Special Report
States Where the Most People Use Only Cellphones

Published:
Last Updated:

Americans are steadily abandoning traditional telephone landlines and exclusively using wireless devices. While 8.4% of U.S. households used only cellphones in 2005, this was true of nearly half of all American households only a decade later.
The likelihood of living in a cellphone-only household varies considerably across states. New Jersey has the lowest share of adults living in wireless-only households at just 27.5%. In Idaho, the share is more than double, at 61.6% — the highest share of any state.
With data from the National Center for Health Statistics, 24/7 Wall St. reviewed the share of adults in wireless-only households in every state.
Click here to see the states where the most people use only cellphones.
Many demographic characteristics correlate with the use of phones. While 72.1% of 25-29 year olds use only cellphones, only 21.1% of Americans 65 and older do. Renters are significantly more likely to use only cellphones than homeowners. Households with unrelated adults are nearly twice as likely to exclusively use cellphones as those with related adults.
The states with the highest share of adults in wireless-only households tend to have higher poverty rates than most states. Paying both for a cellphone plan and landline can be expensive, and households that have little extra money often need to choose between the two.
Conversely, the states with the highest shares of adults in households that use both cellphones and landline phones tend to have higher median household incomes than in most other states.
Many Americans decide to get rid of their landline because of the incessant calls they receive from telemarketers. It is illegal for telemarketers to call a wireless number using an automated dialing system or a recorded message regardless of whether or not the number is on the National Do-Not-Call Registry. Generally, the Federal Trade Commission receives far less complaints per capita from states where a larger share of residents are reachable only by cellphone.
To determine the states where the most people only use cellphones, 24/7 Wall St. reviewed the 2015 share of adults living in wireless-only households using data from the National Center for Health Statistics. The percentage of adults who live in landline-only households came from the same report. Data for 2010 come from a previous version of the NCHS report published in 2012. Telemarketing spam complaints per 100,000 state residents were obtained from the Federal Trade Commission’s Fiscal Year 2016 National Do Not Call Registry Data Book.
These are the states where the most people use only cellphones.

50. New Jersey
> Cellphone only (2015): 27.5%
> Cellphone only (2010): 14.0% (2nd lowest)
> Landline only: 6.5% (tied-21st highest)
> Spam complaints per 100,000: 2,282 (the highest)
[in-text-ad]

49. Connecticut
> Cellphone only (2015): 31.1%
> Cellphone only (2010): 15.3% (3rd lowest)
> Landline only: 9.1% (5th highest)
> Spam complaints per 100,000: 2,147 (3rd highest)

48. New York
> Cellphone only (2015): 32.7%
> Cellphone only (2010): 16.7% (4th lowest)
> Landline only: 7.4% (tied-10th highest)
> Spam complaints per 100,000: 1,831 (14th highest)

47. Delaware
> Cellphone only (2015): 32.8%
> Cellphone only (2010): 21.3% (9th lowest)
> Landline only: 5.6% (tied-19th lowest)
> Spam complaints per 100,000: 2,081 (6th highest)
[in-text-ad-2]

46. Vermont
> Cellphone only (2015): 34.4%
> Cellphone only (2010): 20.6% (8th lowest)
> Landline only: 15.3% (the highest)
> Spam complaints per 100,000: 1,660 (19th highest)

45. Massachusetts
> Cellphone only (2015): 34.5%
> Cellphone only (2010): 17.3% (tied-5th lowest)
> Landline only: 6.5% (tied-21st highest)
> Spam complaints per 100,000: 2,013 (7th highest)
[in-text-ad]

44. Pennsylvania
> Cellphone only (2015): 35.2%
> Cellphone only (2010): 18.4% (7th lowest)
> Landline only: 7.4% (tied-10th highest)
> Spam complaints per 100,000: 1,608 (22nd highest)

43. New Hampshire
> Cellphone only (2015): 36.6%
> Cellphone only (2010): 17.3% (tied-5th lowest)
> Landline only: 4.2% (tied-3rd lowest)
> Spam complaints per 100,000: 1,859 (13th highest)

42. Rhode Island
> Cellphone only (2015): 37.2%
> Cellphone only (2010): 13.3% (the lowest)
> Landline only: 6.2% (tied-24th highest)
> Spam complaints per 100,000: 1,912 (9th highest)
[in-text-ad-2]

41. Maryland
> Cellphone only (2015): 37.4%
> Cellphone only (2010): 21.4% (10th lowest)
> Landline only: 4.5% (tied-7th lowest)
> Spam complaints per 100,000: 2,110 (5th highest)

40. West Virginia
> Cellphone only (2015): 38.6%
> Cellphone only (2010): 21.6% (11th lowest)
> Landline only: 13.4% (2nd highest)
> Spam complaints per 100,000: 1,076 (8th lowest)
[in-text-ad]

39. Hawaii
> Cellphone only (2015): 39.3%
> Cellphone only (2010): 23.1% (15th lowest)
> Landline only: 5.0% (tied-14th lowest)
> Spam complaints per 100,000: 895 (4th lowest)

38. Virginia
> Cellphone only (2015): 43.3%
> Cellphone only (2010): 22.6% (14th lowest)
> Landline only: 5.5% (tied-17th lowest)
> Spam complaints per 100,000: 2,165 (2nd highest)

37. Louisiana
> Cellphone only (2015): 43.6%
> Cellphone only (2010): 30.2% (tied-14th highest)
> Landline only: 6.4% (23rd highest)
> Spam complaints per 100,000: 910 (5th lowest)
[in-text-ad-2]

36. Maine
> Cellphone only (2015): 45.2%
> Cellphone only (2010): 25.7% (16th lowest)
> Landline only: 7.4% (tied-10th highest)
> Spam complaints per 100,000: 1,188 (12th lowest)

35. Montana
> Cellphone only (2015): 45.3%
> Cellphone only (2010): N/A
> Landline only: 11.6% (3rd highest)
> Spam complaints per 100,000: 1,466 (24th lowest)
[in-text-ad]

34. Alabama
> Cellphone only (2015): 46.0%
> Cellphone only (2010): 29.3% (21st highest)
> Landline only: 6.9% (tied-14th highest)
> Spam complaints per 100,000: 1,373 (16th lowest)

33. Minnesota
> Cellphone only (2015): 46.0%
> Cellphone only (2010): 27.2% (19th lowest)
> Landline only: 4.6% (tied-10th lowest)
> Spam complaints per 100,000: 1,425 (20th lowest)
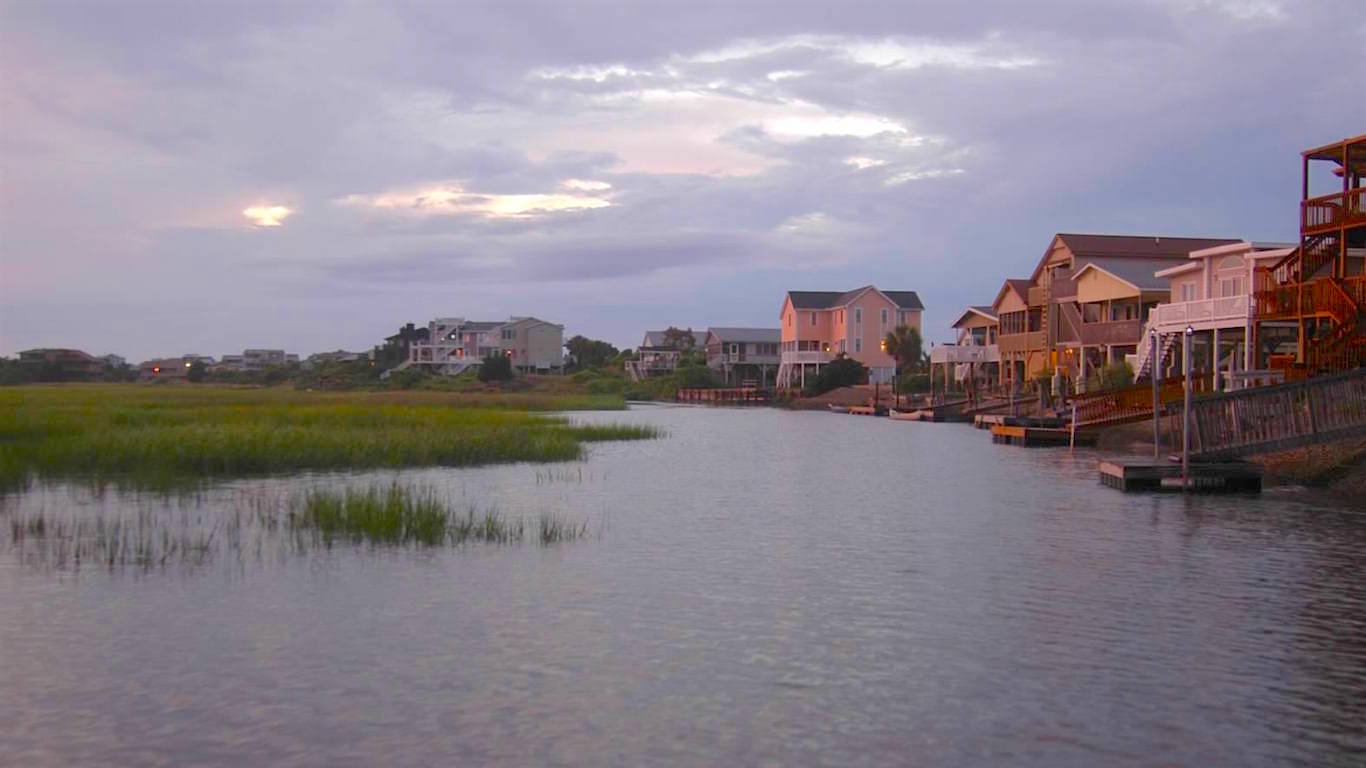
32. North Carolina
> Cellphone only (2015): 46.1%
> Cellphone only (2010): 27.1% (18th lowest)
> Landline only: 6.7% (tied-17th highest)
> Spam complaints per 100,000: 1,379 (17th lowest)
[in-text-ad-2]

31. California
> Cellphone only (2015): 46.8%
> Cellphone only (2010): 21.7% (12th lowest)
> Landline only: 5.5% (tied-17th lowest)
> Spam complaints per 100,000: 1,890 (10th highest)

30. Alaska
> Cellphone only (2015): 47.1%
> Cellphone only (2010): 22.2% (13th lowest)
> Landline only: 4.3% (5th lowest)
> Spam complaints per 100,000: 272 (the lowest)
[in-text-ad]

29. South Dakota
> Cellphone only (2015): 48.0%
> Cellphone only (2010): N/A
> Landline only: 7.8% (8th highest)
> Spam complaints per 100,000: 1,082 (9th lowest)

28. Illinois
> Cellphone only (2015): 48.2%
> Cellphone only (2010): 27.7% (20th lowest)
> Landline only: 4.4% (6th lowest)
> Spam complaints per 100,000: 2,116 (4th highest)

27. North Dakota
> Cellphone only (2015): 48.8%
> Cellphone only (2010): 38.1% (3rd highest)
> Landline only: 8.3% (6th highest)
> Spam complaints per 100,000: 678 (2nd lowest)
[in-text-ad-2]

26. Nebraska
> Cellphone only (2015): 48.9%
> Cellphone only (2010): 32.9% (10th highest)
> Landline only: 6.7% (tied-17th highest)
> Spam complaints per 100,000: 1,595 (tied-23rd highest)

25. Wisconsin
> Cellphone only (2015): 49.3%
> Cellphone only (2010): 29.0% (23rd highest)
> Landline only: 7.7% (9th highest)
> Spam complaints per 100,000: 1,165 (10th lowest)
[in-text-ad]

24. Kentucky
> Cellphone only (2015): 50.2%
> Cellphone only (2010): 31.1% (11th highest)
> Landline only: 8.0% (7th highest)
> Spam complaints per 100,000: 1,184 (11th lowest)

23. Washington
> Cellphone only (2015): 50.2%
> Cellphone only (2010): 30.2% (tied-14th highest)
> Landline only: 5.9% (tied-23rd lowest)
> Spam complaints per 100,000: 1,526 (25th lowest)

22. Georgia
> Cellphone only (2015): 50.7%
> Cellphone only (2010): 29.1% (22nd highest)
> Landline only: 5.6% (tied-19th lowest)
> Spam complaints per 100,000: 1,647 (20th highest)
[in-text-ad-2]

21. Oregon
> Cellphone only (2015): 50.8%
> Cellphone only (2010): 33.0% (9th highest)
> Landline only: 6.6% (20th highest)
> Spam complaints per 100,000: 1,745 (16th highest)

20. Ohio
> Cellphone only (2015): 51.0%
> Cellphone only (2010): 28.0% (22nd lowest)
> Landline only: 5.9% (tied-23rd lowest)
> Spam complaints per 100,000: 1,715 (18th highest)
[in-text-ad]
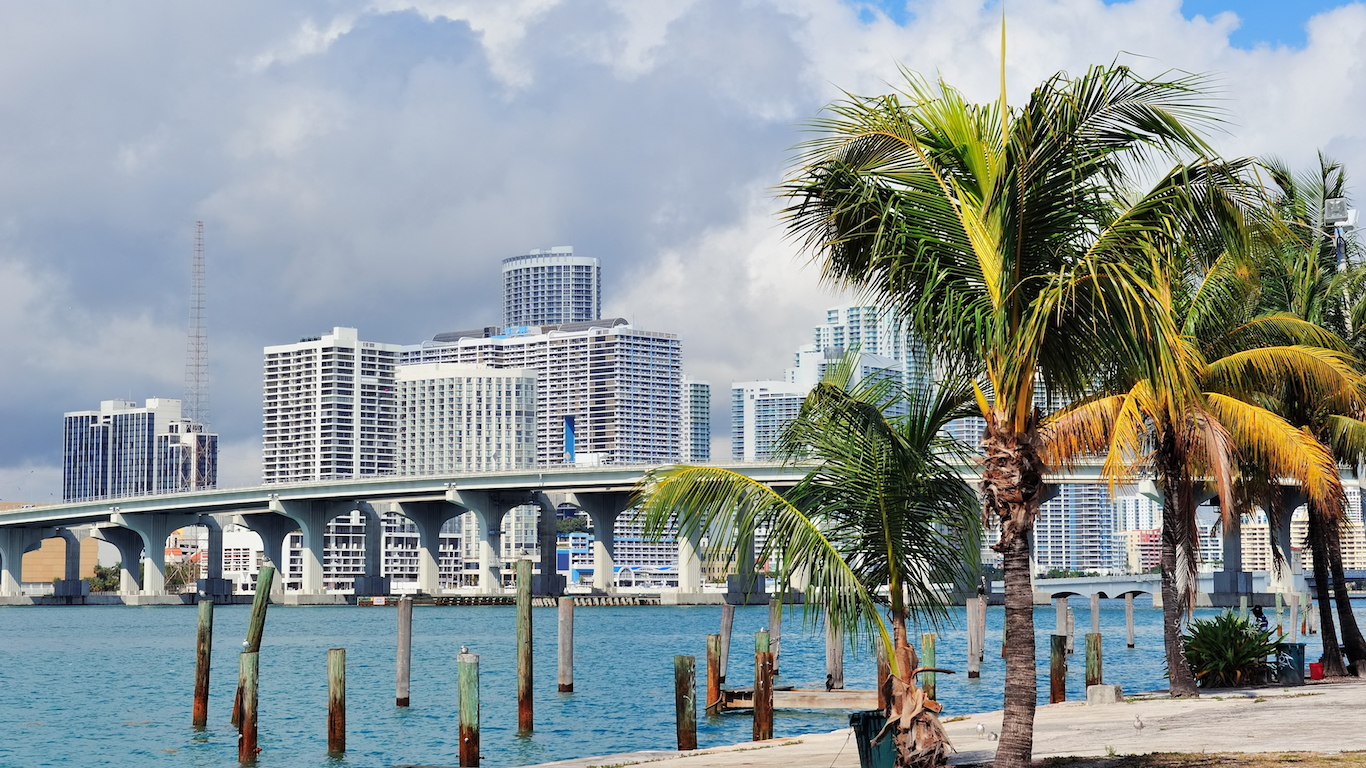
19. Florida
> Cellphone only (2015): 51.0%
> Cellphone only (2010): 30.0% (17th highest)
> Landline only: 6.1% (25th lowest)
> Spam complaints per 100,000: 1,889 (tied-11th highest)

18. Michigan
> Cellphone only (2015): 51.1%
> Cellphone only (2010): 30.8% (13th highest)
> Landline only: 6.2% (tied-24th highest)
> Spam complaints per 100,000: 1,811 (15th highest)
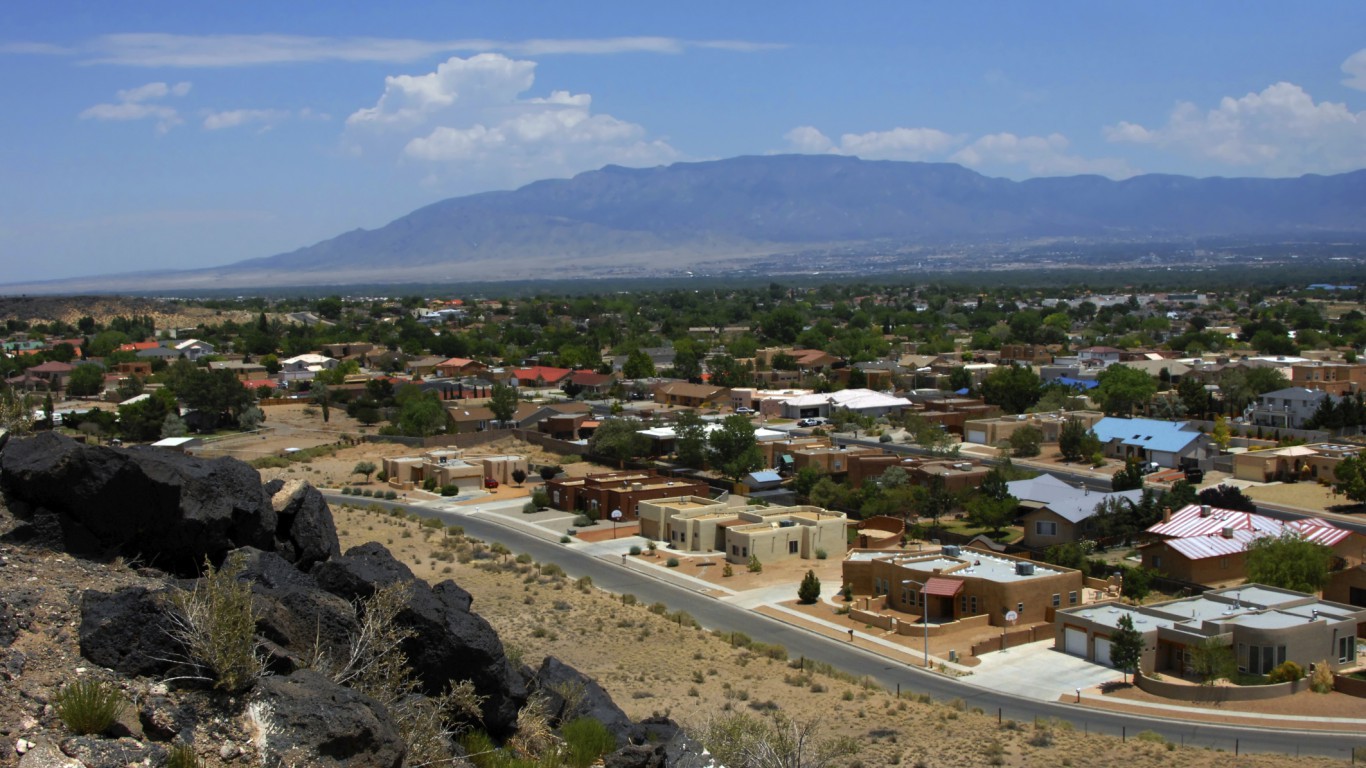
17. New Mexico
> Cellphone only (2015): 51.2%
> Cellphone only (2010): 29.9% (tied-18th highest)
> Landline only: 9.7% (4th highest)
> Spam complaints per 100,000: 1,542 (25th highest)
[in-text-ad-2]

16. Nevada
> Cellphone only (2015): 51.2%
> Cellphone only (2010): 27.9% (21st lowest)
> Landline only: 6.7% (tied-17th highest)
> Spam complaints per 100,000: 1,729 (17th highest)

15. South Carolina
> Cellphone only (2015): 52.0%
> Cellphone only (2010): 30.2% (tied-14th highest)
> Landline only: 5.4% (16th lowest)
> Spam complaints per 100,000: 1,380 (18th lowest)
[in-text-ad]

14. Tennessee
> Cellphone only (2015): 52.4%
> Cellphone only (2010): 31.0% (12th highest)
> Landline only: 5.0% (tied-14th lowest)
> Spam complaints per 100,000: 1,595 (tied-23rd highest)

13. Indiana
> Cellphone only (2015): 52.5%
> Cellphone only (2010): 28.3% (23rd lowest)
> Landline only: 6.8% (16th highest)
> Spam complaints per 100,000: 974 (7th lowest)

12. Arizona
> Cellphone only (2015): 53.1%
> Cellphone only (2010): 33.2% (tied-7th highest)
> Landline only: 6.9% (tied-14th highest)
> Spam complaints per 100,000: 1,948 (8th highest)
[in-text-ad-2]

11. Oklahoma
> Cellphone only (2015): 54.0%
> Cellphone only (2010): 29.9% (tied-18th highest)
> Landline only: 5.6% (tied-19th lowest)
> Spam complaints per 100,000: 1,196 (14th lowest)

10. Kansas
> Cellphone only (2015): 54.0%
> Cellphone only (2010): 33.3% (6th highest)
> Landline only: 5.7% (22nd lowest)
> Spam complaints per 100,000: 1,435 (21st lowest)
[in-text-ad]

9. Iowa
> Cellphone only (2015): 54.5%
> Cellphone only (2010): N/A
> Landline only: 4.6% (tied-10th lowest)
> Spam complaints per 100,000: 1,193 (13th lowest)

8. Colorado
> Cellphone only (2015): 55.2%
> Cellphone only (2010): 33.2% (tied-7th highest)
> Landline only: 4.5% (tied-7th lowest)
> Spam complaints per 100,000: 1,889 (tied-11th highest)

7. Missouri
> Cellphone only (2015): 55.8%
> Cellphone only (2010): 25.8% (17th lowest)
> Landline only: 4.8% (tied-12th lowest)
> Spam complaints per 100,000: 933 (6th lowest)
[in-text-ad-2]

6. Mississippi
> Cellphone only (2015): 57.7%
> Cellphone only (2010): 37.3% (4th highest)
> Landline only: 7.0% (13th highest)
> Spam complaints per 100,000: 831 (3rd lowest)

5. Utah
> Cellphone only (2015): 57.8%
> Cellphone only (2010): 29.6% (20th highest)
> Landline only: 3.3% (2nd lowest)
> Spam complaints per 100,000: 1,368 (15th lowest)
[in-text-ad]

4. Wyoming
> Cellphone only (2015): 58.5%
> Cellphone only (2010): N/A
> Landline only: 3.2% (the lowest)
> Spam complaints per 100,000: 1,456 (22nd lowest)

3. Texas
> Cellphone only (2015): 59.2%
> Cellphone only (2010): 35.4% (5th highest)
> Landline only: 4.2% (tied-3rd lowest)
> Spam complaints per 100,000: 1,392 (19th lowest)

2. Arkansas
> Cellphone only (2015): 59.8%
> Cellphone only (2010): 39.7% (the highest)
> Landline only: 4.8% (tied-12th lowest)
> Spam complaints per 100,000: 1,461 (23rd lowest)
[in-text-ad-2]

1. Idaho
> Cellphone only (2015): 61.6%
> Cellphone only (2010): 38.8% (2nd highest)
> Landline only: 4.5% (tied-7th lowest)
> Spam complaints per 100,000: 1,612 (21st highest)
If you missed out on NVIDIA’s historic run, your chance to see life-changing profits from AI isn’t over.
The 24/7 Wall Street Analyst who first called NVIDIA’s AI-fueled rise in 2009 just published a brand-new research report named “The Next NVIDIA.”
Click here to download your FREE copy.
Thank you for reading! Have some feedback for us?
Contact the 24/7 Wall St. editorial team.