
The U.S. population has grown by 3.7% over the past five years. While this is historically a relatively slow growth, some urban areas have experienced explosive growth over the same period.
24/7 Wall St. reviewed five-year population change in the nation’s 382 metro areas to determine the fastest growing city in each state. The Villages, Florida grew more than any other city, with a population increase of 25.8% over the past five years.
Even the fastest growing city in a given state is not necessarily fast growing when compared to all cities nationwide. Of the 50 cities on this list, nine did not keep pace with nationwide growth. All but one of these nine cities are in the Northeast or Midwest. Recently, Americans in search of jobs and cheaper housing options have been moving out of Northeastern and Midwestern states in favor of Southern and Western states.
Click here to see the fastest growing city in each state.
Domestic migration was the largest contributor to population growth in 22 of the fastest growing cities in each state. Natural population growth — births minus deaths — was the driver in 18 cities, while international migration contributed the most in the remaining 10 cities.
Because securing employment is often the first step of relocation, new residents of an area typically put downward pressure on a city’s unemployment rate. Of the fast-growing cities on this list, 36 have unemployment rates lower than the respective state rate.
Finding a job is by no means the only reason for relocating to a new city. Americans may move to take care of a family member, move in with a new spouse, find an affordable housing market to buy their first home, or, like many of the residents in the fastest growing city in America, retire.
To determine the fastest growing city in each state, 24/7 Wall St. reviewed the five-year population change between July 2011 and July 2016 in each state’s metro areas with data from the U.S. Census Bureau’s 2016 Current Population Survey. July 2016 population figures as well as the largest driver of population growth were also from this survey. Jobs added between July 2011 and July 2016 came from the Bureau of Labor Statistics’ Current Employment Statistics survey. February 2017 unemployment rates came Bureau of Labor Statistics’ Local Area Unemployment Statistics.
This is the fastest growing city in each state.

1. Daphne-Fairhope-Foley, Alabama
> Population (2016): 208,563
> Population chg. (2011-2016): +11.7% (AL: +1.3%)
> Jobs added (2011-2016): 9,800 (+14.9%)
> Unemployment: 5.1% (AL: 6.2%)
> Largest driver of growth: Domestic migration
[in-text-ad]

2. Anchorage, Alaska
> Population (2016): 402,557
> Population chg. (2011-2016): +3.7% (AK: +2.7%)
> Jobs added (2011-2016): 2,900 (+1.6%)
> Unemployment: 6.0% (AK: 6.4%)
> Largest driver of growth: Natural change
 24/7 Wall St.
3. Phoenix-Mesa-Scottsdale, Arizona
> Population (2016): 4,661,537
> Population chg. (2011-2016): +9.7% (AZ: +7.2%)
> Jobs added (2011-2016): 260,900 (+15.7%)
> Unemployment: 4.6% (AZ: 5.1%)
> Largest driver of growth: Domestic migration

4. Fayetteville-Springdale-Rogers, Arkansas
> Population (2016): 525,032
> Population chg. (2011-2016): +10.5% (AR: +1.7%)
> Jobs added (2011-2016): 40,100 (+19.9%)
> Unemployment: 2.7% (AR: 3.7%)
> Largest driver of growth: Domestic migration
[in-text-ad-2]

5. San Francisco-Oakland-Hayward, California
> Population (2016): 4,679,166
> Population chg. (2011-2016): +6.4% (CA: +4.2%)
> Jobs added (2011-2016): 382,900 (+19.5%)
> Unemployment: 3.5% (CA: 5.0%)
> Largest driver of growth: International migration

6. Greeley, Colorado
> Population (2016): 294,932
> Population chg. (2011-2016): +14.0% (CO: +8.2%)
> Jobs added (2011-2016): 16,700 (+20.7%)
> Unemployment: 2.9% (CO: 2.9%)
> Largest driver of growth: Domestic migration
[in-text-ad]
7. Bridgeport-Stamford-Norwalk, Connecticut
> Population (2016): 944,177
> Population chg. (2011-2016): +1.6% (CT: -0.4%)
> Jobs added (2011-2016): 18,600 (+4.7%)
> Unemployment: 5.1% (CT: 4.7%)
> Largest driver of growth: International migration
 24/7 Wall St.
8. Dover, Delaware
> Population (2016): 174,827
> Population chg. (2011-2016): +5.8% (DE: +4.9%)
> Jobs added (2011-2016): 5,400 (+8.6%)
> Unemployment: 4.8% (DE: 4.5%)
> Largest driver of growth: Domestic migration
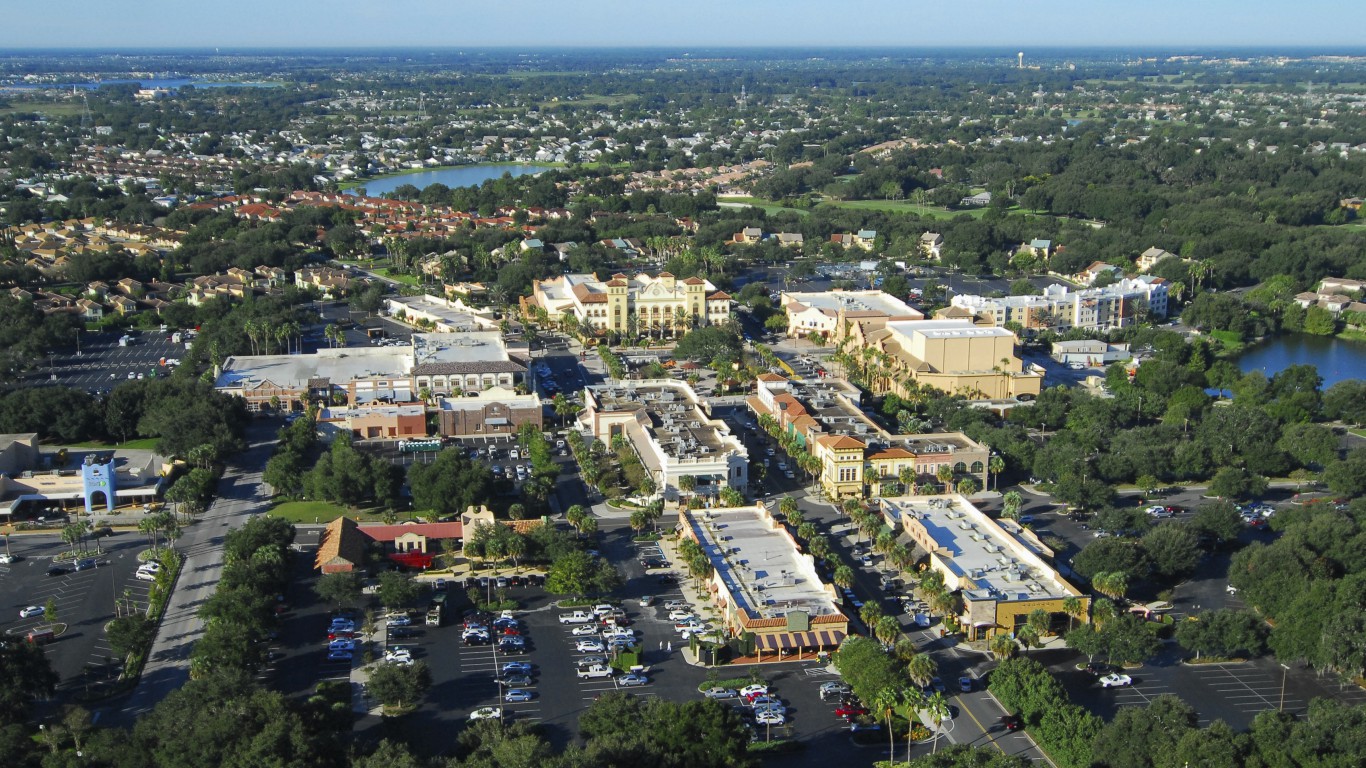
9. The Villages, Florida
> Population (2016): 123,996
> Population chg. (2011-2016): +25.8% (FL: +7.9%)
> Jobs added (2011-2016): 5,300 (+25.1%)
> Unemployment: 7.0% (FL: 5.0%)
> Largest driver of growth: Domestic migration
[in-text-ad-2]

10. Savannah, Georgia
> Population (2016): 384,024
> Population chg. (2011-2016): +7.9% (GA: +5.1%)
> Jobs added (2011-2016): 23,800 (+15.6%)
> Unemployment: 4.8% (GA: 5.3%)
> Largest driver of growth: Natural change
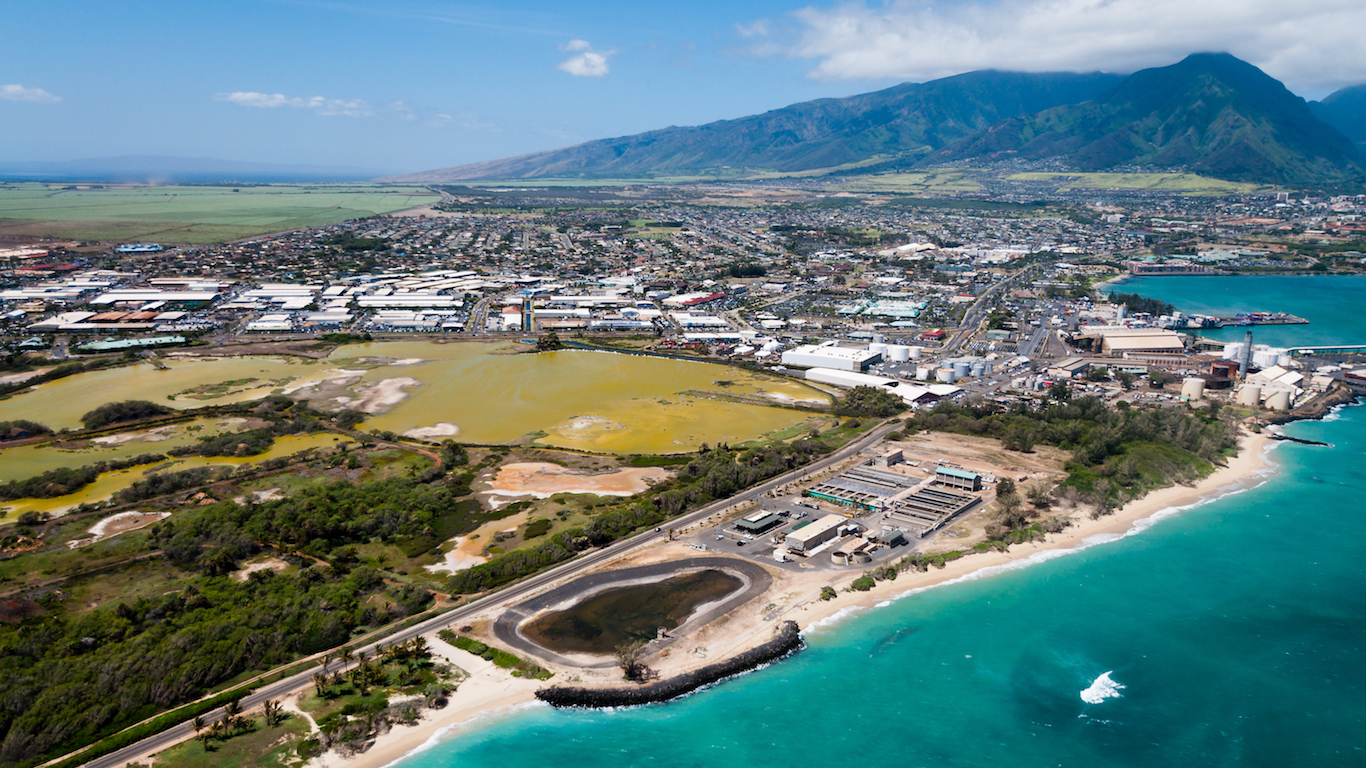
11. Kahului-Wailuku-Lahaina, Hawaii
> Population (2016): 165,474
> Population chg. (2011-2016): +5.5% (HI: +3.7%)
> Jobs added (2011-2016): 8,400 (+12.8%)
> Unemployment: 3.1% (HI: 2.8%)
> Largest driver of growth: Natural change
[in-text-ad]

12. Boise City, Idaho
> Population (2016): 691,423
> Population chg. (2011-2016): +10.2% (ID: +6.2%)
> Jobs added (2011-2016): 48,900 (+19.0%)
> Unemployment: 3.5% (ID: 3.6%)
> Largest driver of growth: Domestic migration

13. Champaign-Urbana, Illinois
> Population (2016): 238,554
> Population chg. (2011-2016): +2.2% (IL: -0.5%)
> Jobs added (2011-2016): 3,700 (+3.7%)
> Unemployment: 4.9% (IL: 5.4%)
> Largest driver of growth: International migration

14. Lafayette-West Lafayette, Indiana
> Population (2016): 216,679
> Population chg. (2011-2016): +6.0% (IN: +1.8%)
> Jobs added (2011-2016): 11,800 (+13.7%)
> Unemployment: 3.8% (IN: 4.1%)
> Largest driver of growth: International migration
[in-text-ad-2]

15. Des Moines-West Des Moines, Iowa
> Population (2016): 634,725
> Population chg. (2011-2016): +9.3% (IA: +2.3%)
> Jobs added (2011-2016): 41,800 (+13.1%)
> Unemployment: 2.9% (IA: 3.2%)
> Largest driver of growth: Domestic migration

16. Lawrence, Kansas
> Population (2016): 119,440
> Population chg. (2011-2016): +6.2% (KS: +1.3%)
> Jobs added (2011-2016): 2,600 (+5.5%)
> Unemployment: 3.3% (KS: 4.0%)
> Largest driver of growth: International migration
[in-text-ad]

17. Bowling Green, Kentucky
> Population (2016): 171,122
> Population chg. (2011-2016): +6.4% (KY: +1.5%)
> Jobs added (2011-2016): 7,400 (+11.2%)
> Unemployment: 4.1% (KY: 4.9%)
> Largest driver of growth: Domestic migration

18. Hammond, Louisiana
> Population (2016): 130,710
> Population chg. (2011-2016): +6.6% (LA: +2.3%)
> Jobs added (2011-2016): 1,600 (+3.8%)
> Unemployment: 6.3% (LA: 5.8%)
> Largest driver of growth: Domestic migration

19. Portland-South Portland, Maine
> Population (2016): 529,657
> Population chg. (2011-2016): +2.6% (ME: +0.2%)
> Jobs added (2011-2016): 12,100 (+6.2%)
> Unemployment: 2.5% (ME: 3.2%)
> Largest driver of growth: Domestic migration
[in-text-ad-2]

20. Salisbury, Maryland
> Population (2016): 400,200
> Population chg. (2011-2016): +5.8% (MD: +3.0%)
> Jobs added (2011-2016): 13,800 (+8.9%)
> Unemployment: 5.8% (MD: 4.2%)
> Largest driver of growth: Domestic migration

21. Boston-Cambridge-Newton, Massachusetts
> Population (2016): 4,794,447
> Population chg. (2011-2016): +4.0% (MA: +3.0%)
> Jobs added (2011-2016): 183,400 (+11.1%)
> Unemployment: 3.3% (MA: 3.4%)
> Largest driver of growth: International migration
[in-text-ad]

22. Grand Rapids-Wyoming, Michigan
> Population (2016): 1,047,099
> Population chg. (2011-2016): +5.1% (MI: +0.5%)
> Jobs added (2011-2016): 73,400 (+15.7%)
> Unemployment: 3.4% (MI: 5.3%)
> Largest driver of growth: Natural change
 24/7 Wall St.
23. Minneapolis-St. Paul-Bloomington, Minnesota
> Population (2016): 3,551,036
> Population chg. (2011-2016): +4.8% (MN: +3.2%)
> Jobs added (2011-2016): 192,800 (+10.8%)
> Unemployment: 3.8% (MN: 4.0%)
> Largest driver of growth: Natural change
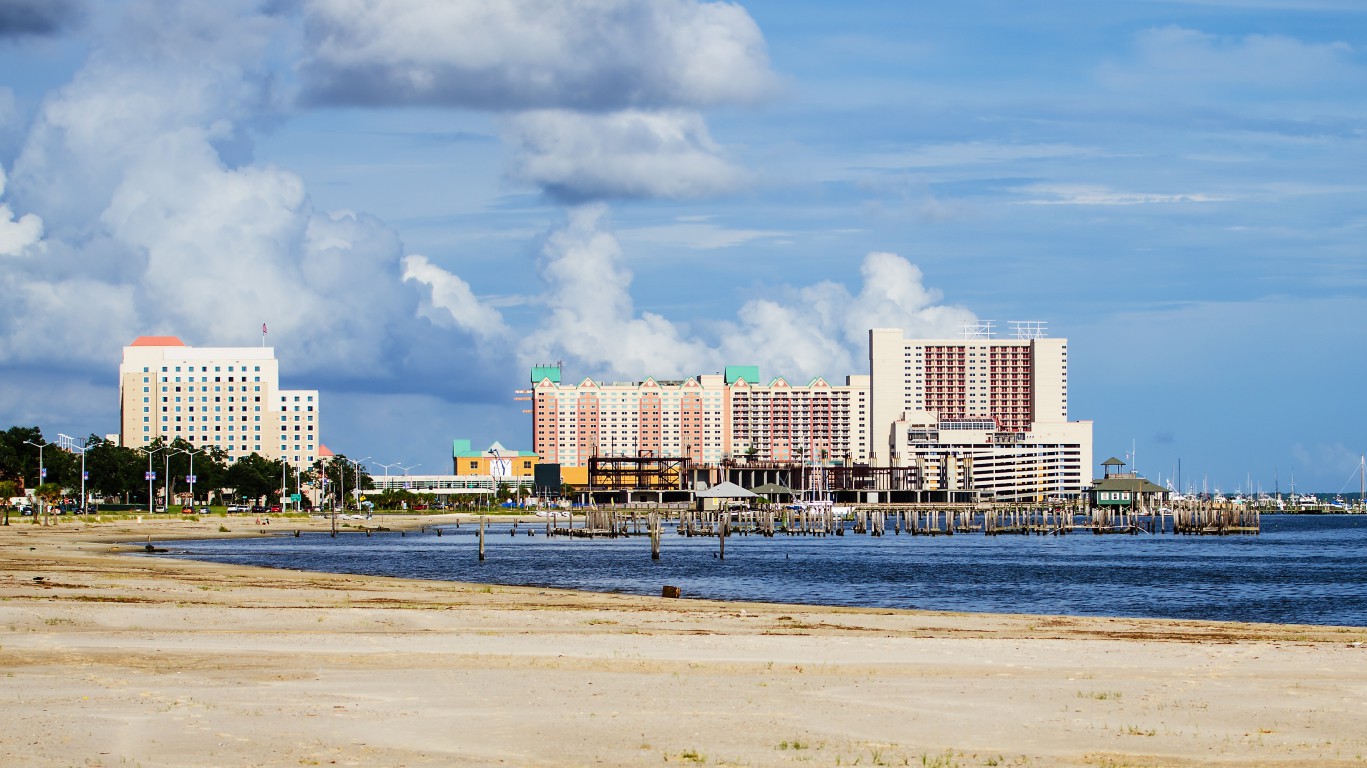
24. Gulfport-Biloxi-Pascagoula, Mississippi
> Population (2016): 391,266
> Population chg. (2011-2016): +4.1% (MS: +0.4%)
> Jobs added (2011-2016): 4,100 (+2.7%)
> Unemployment: 5.0% (MS: 5.2%)
> Largest driver of growth: Natural change
[in-text-ad-2]

25. Columbia, Missouri
> Population (2016): 176,594
> Population chg. (2011-2016): +6.4% (MO: +1.4%)
> Jobs added (2011-2016): 6,000 (+6.7%)
> Unemployment: 3.0% (MO: 4.1%)
> Largest driver of growth: Natural change
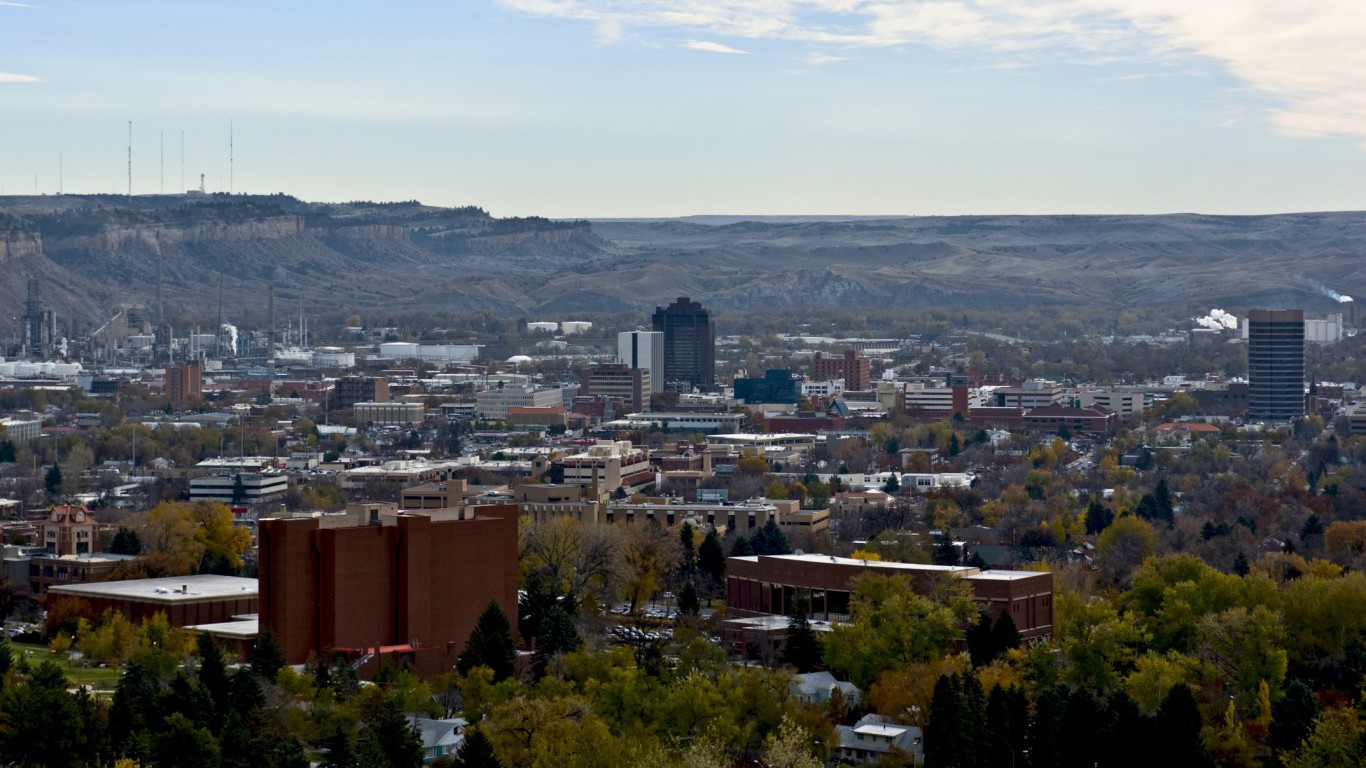
26. Billings, Montana
> Population (2016): 169,728
> Population chg. (2011-2016): +5.6% (MT: +4.5%)
> Jobs added (2011-2016): 5,500 (+6.9%)
> Unemployment: 3.3% (MT: 3.8%)
> Largest driver of growth: Domestic migration
[in-text-ad]

27. Lincoln, Nebraska
> Population (2016): 326,921
> Population chg. (2011-2016): +6.6% (NE: +3.5%)
> Jobs added (2011-2016): 14,300 (+8.3%)
> Unemployment: 2.6% (NE: 3.2%)
> Largest driver of growth: Natural change

28. Las Vegas-Henderson-Paradise, Nevada
> Population (2016): 2,155,664
> Population chg. (2011-2016): +9.6% (NV: +8.2%)
> Jobs added (2011-2016): 142,200 (+17.7%)
> Unemployment: 5.1% (NV: 4.9%)
> Largest driver of growth: Domestic migration

29. Manchester-Nashua, New Hampshire
> Population (2016): 407,761
> Population chg. (2011-2016): +1.5% (NH: +1.2%)
> Jobs added (2011-2016): 9,600 (+9.6%)
> Unemployment: 2.8% (NH: 2.7%)
> Largest driver of growth: Natural change
[in-text-ad-2]

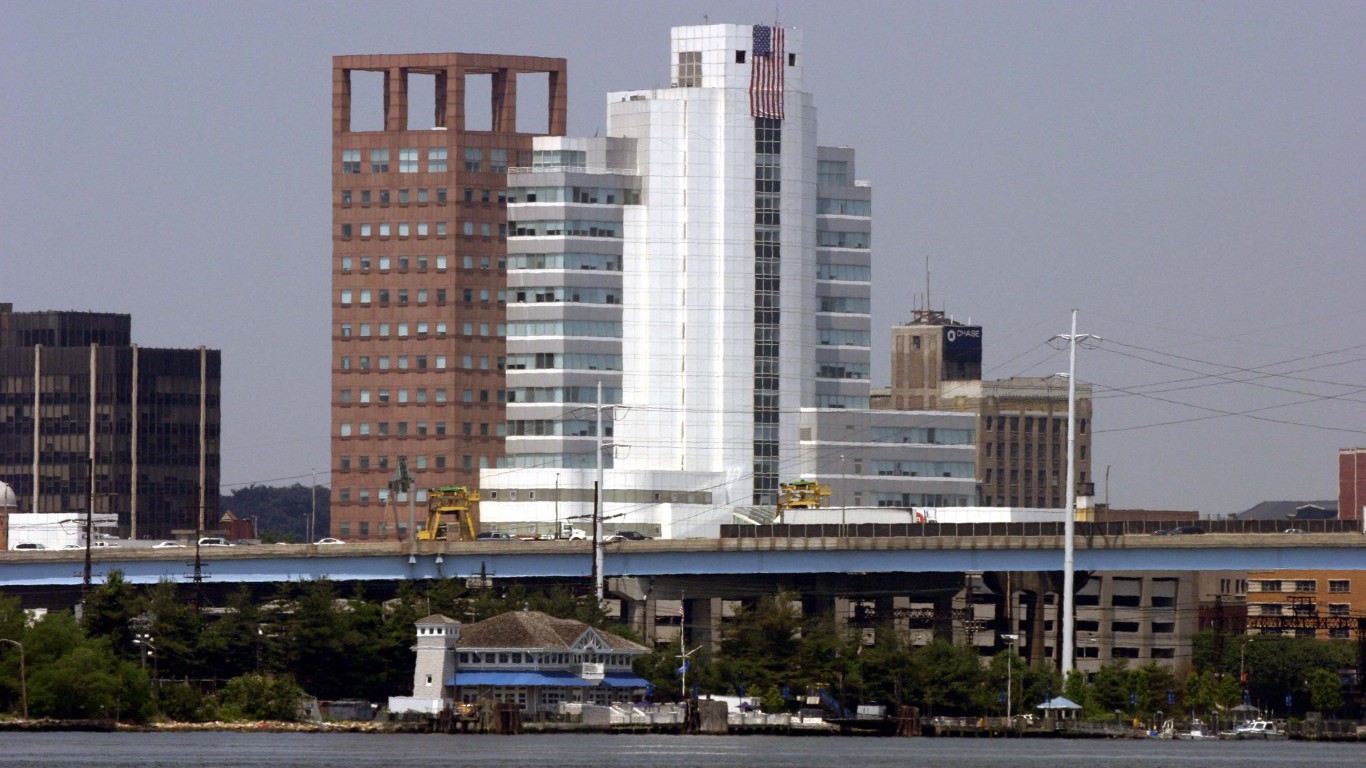
30. Trenton, New Jersey
> Population (2016): 371,023
> Population chg. (2011-2016): +0.8% (NJ: +1.2%)
> Jobs added (2011-2016): 25,900 (+10.9%)
> Unemployment: 3.9% (NJ: 4.4%)
> Largest driver of growth: International migration

31. Santa Fe, New Mexico
> Population (2016): 148,651
> Population chg. (2011-2016): +2.3% (NM: +0.2%)
> Jobs added (2011-2016): 2,000 (+3.2%)
> Unemployment: 5.4% (NM: 6.8%)
> Largest driver of growth: Natural change
[in-text-ad]

32. Ithaca, New York
> Population (2016): 104,871
> Population chg. (2011-2016): +2.7% (NY: +1.2%)
> Jobs added (2011-2016): 4,400 (+7.7%)
> Unemployment: 3.9% (NY: 4.4%)
> Largest driver of growth: International migration

33. Raleigh, North Carolina
> Population (2016): 1,302,946
> Population chg. (2011-2016): +12.0% (NC: +5.1%)
> Jobs added (2011-2016): 92,800 (+18.3%)
> Unemployment: 4.2% (NC: 5.1%)
> Largest driver of growth: Domestic migration

34. Bismarck, North Dakota
> Population (2016): 131,635
> Population chg. (2011-2016): +12.1% (ND: +10.6%)
> Jobs added (2011-2016): 7,600 (+11.4%)
> Unemployment: 2.8% (ND: 2.9%)
> Largest driver of growth: Domestic migration
[in-text-ad-2]

35. Columbus, Ohio
> Population (2016): 2,041,520
> Population chg. (2011-2016): +6.0% (OH: +0.6%)
> Jobs added (2011-2016): 125,400 (+13.4%)
> Unemployment: 4.2% (OH: 5.1%)
> Largest driver of growth: Natural change

36. Oklahoma City, Oklahoma
> Population (2016): 1,373,211
> Population chg. (2011-2016): +7.6% (OK: +3.6%)
> Jobs added (2011-2016): 46,700 (+8.1%)
> Unemployment: 4.1% (OK: 4.6%)
> Largest driver of growth: Domestic migration
[in-text-ad]
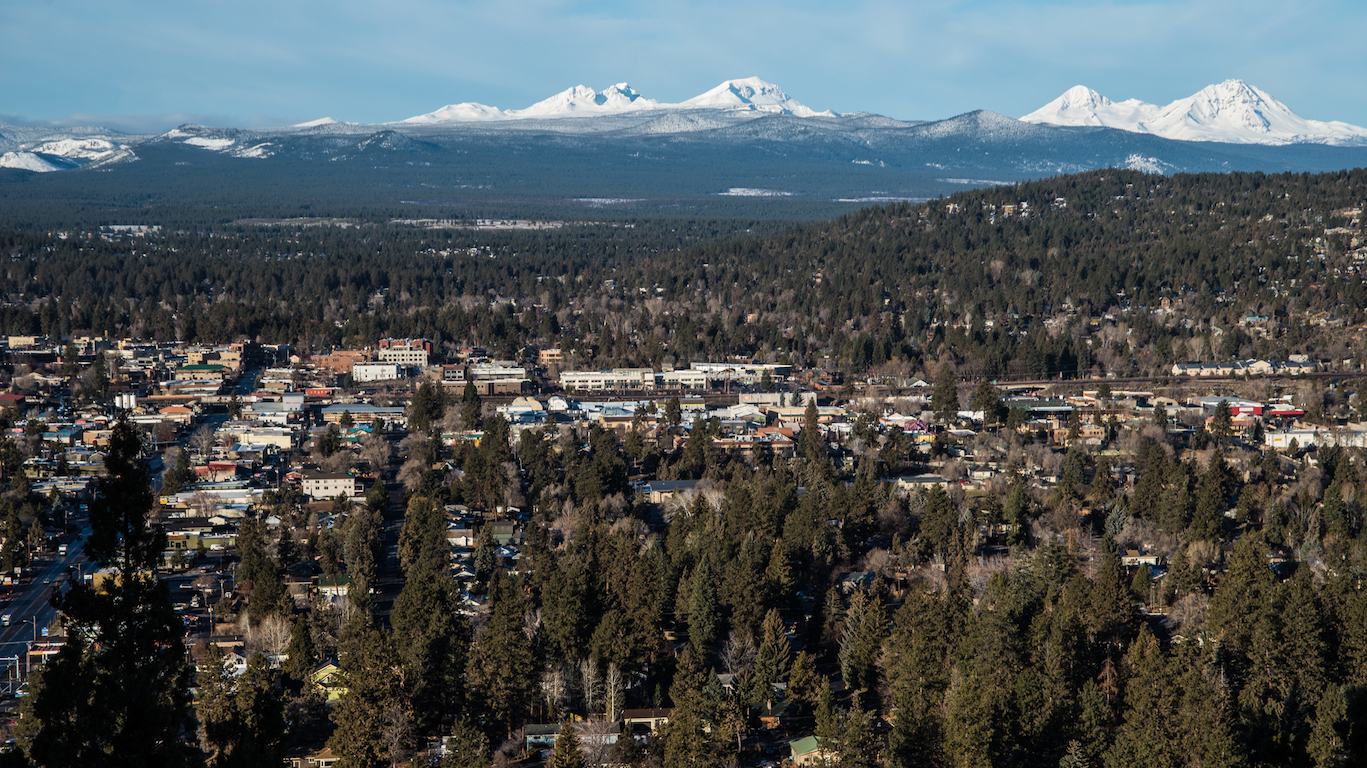
37. Bend-Redmond, Oregon
> Population (2016): 181,307
> Population chg. (2011-2016): +13.5% (OR: +5.8%)
> Jobs added (2011-2016): 17,400 (+27.7%)
> Unemployment: 3.7% (OR: 4.0%)
> Largest driver of growth: Domestic migration

38. State College, Pennsylvania
> Population (2016): 161,464
> Population chg. (2011-2016): +4.2% (PA: +0.3%)
> Jobs added (2011-2016): 2,500 (+3.5%)
> Unemployment: 3.9% (PA: 5.0%)
> Largest driver of growth: International migration

39. Providence-Warwick, Rhode Island
> Population (2016): 1,614,750
> Population chg. (2011-2016): +0.8% (RI: +0.4%)
> Jobs added (2011-2016): 40,800 (+7.5%)
> Unemployment: 4.5% (RI: 4.5%)
> Largest driver of growth: International migration
[in-text-ad-2]
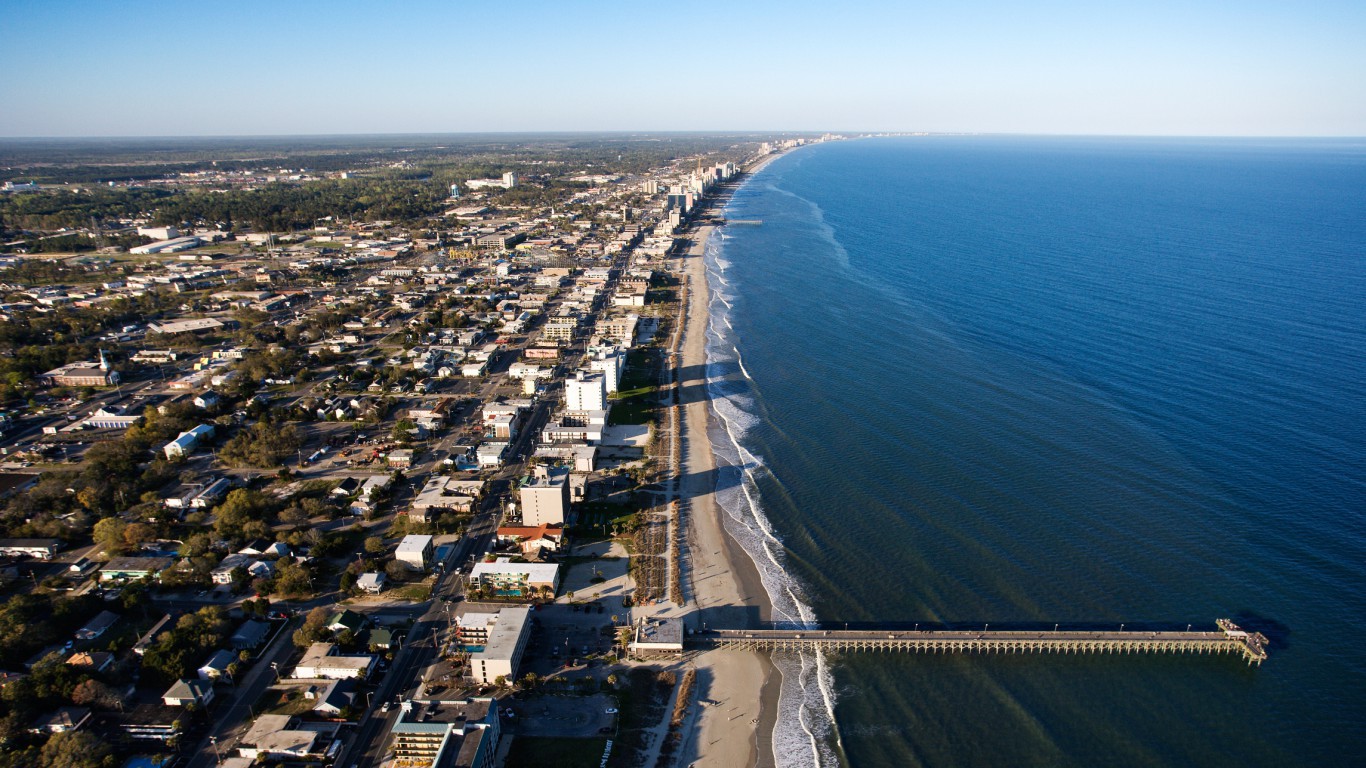
40. Myrtle Beach-Conway-North Myrtle Beach, South Carolina
> Population (2016): 449,295
> Population chg. (2011-2016): +16.5% (SC: +6.2%)
> Jobs added (2011-2016): 15,900 (+10.3%)
> Unemployment: 5.1% (SC: 4.4%)
> Largest driver of growth: Domestic migration

41. Sioux Falls, South Dakota
> Population (2016): 255,729
> Population chg. (2011-2016): +9.9% (SD: +5.0%)
> Jobs added (2011-2016): 17,600 (+12.8%)
> Unemployment: 2.4% (SD: 2.8%)
> Largest driver of growth: Natural change
[in-text-ad]

42. Nashville-Davidson–Murfreesboro–Franklin, Tennessee
> Population (2016): 1,865,298
> Population chg. (2011-2016): +9.8% (TN: +4.0%)
> Jobs added (2011-2016): 164,100 (+21.0%)
> Unemployment: 3.8% (TN: 5.3%)
> Largest driver of growth: Domestic migration
 24/7 Wall St.
43. Midland, Texas
> Population (2016): 168,288
> Population chg. (2011-2016): +16.1% (TX: +8.6%)
> Jobs added (2011-2016): 8,100 (+10.4%)
> Unemployment: 4.2% (TX: 4.9%)
> Largest driver of growth: Domestic migration
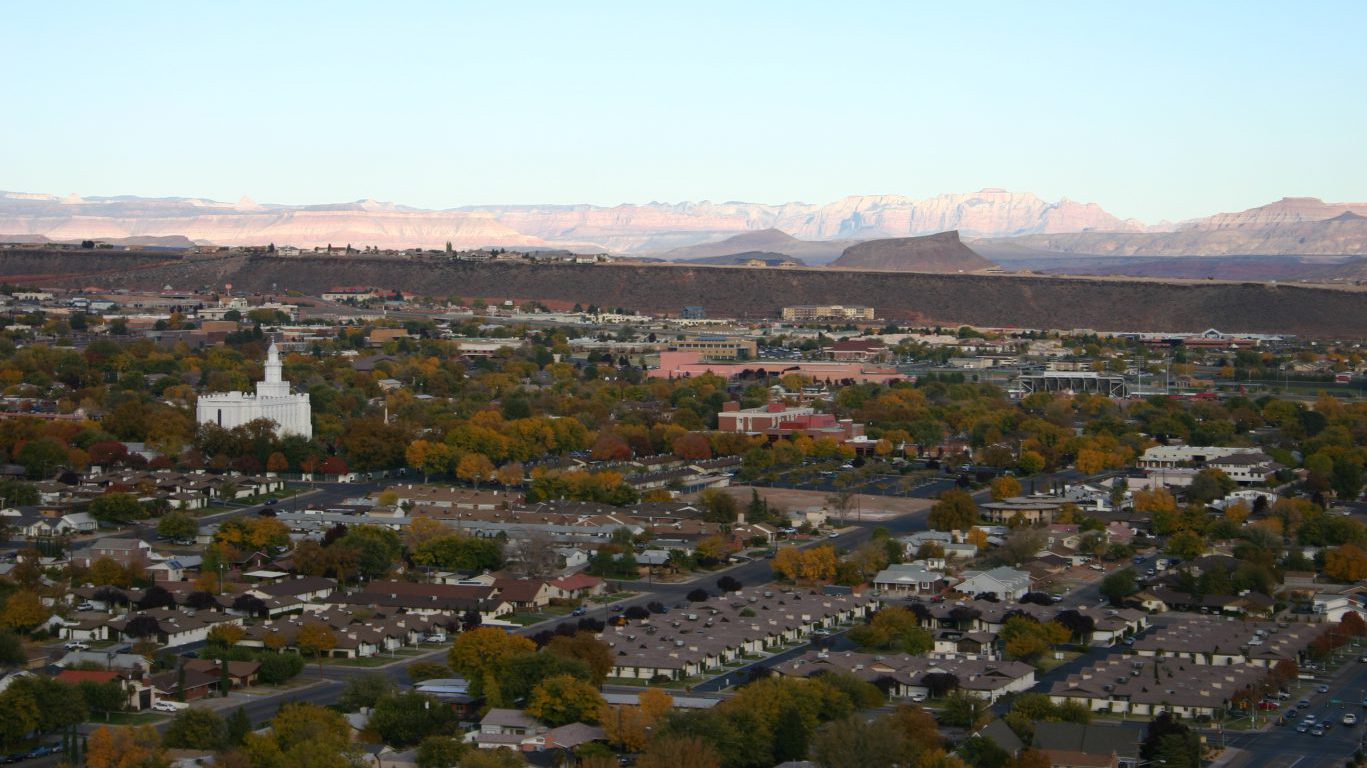
44. St. George, Utah
> Population (2016): 160,245
> Population chg. (2011-2016): +13.2% (UT: +8.3%)
> Jobs added (2011-2016): 13,500 (+29.0%)
> Unemployment: 3.2% (UT: 3.1%)
> Largest driver of growth: Domestic migration
[in-text-ad-2]

45. Burlington-South Burlington, Vermont
> Population (2016): 217,365
> Population chg. (2011-2016): +2.1% (VT: -0.3%)
> Jobs added (2011-2016): 8,800 (+7.6%)
> Unemployment: 2.4% (VT: 3.0%)
> Largest driver of growth: Natural change

46. Richmond, Virginia
> Population (2016): 1,281,708
> Population chg. (2011-2016): +5.1% (VA: +3.7%)
> Jobs added (2011-2016): 62,100 (+10.3%)
> Unemployment: 3.9% (VA: 3.9%)
> Largest driver of growth: Natural change
[in-text-ad]

47. Seattle-Tacoma-Bellevue, Washington
> Population (2016): 3,798,902
> Population chg. (2011-2016): +8.6% (WA: +6.8%)
> Jobs added (2011-2016): 261,300 (+15.3%)
> Unemployment: 3.8% (WA: 4.9%)
> Largest driver of growth: Natural change
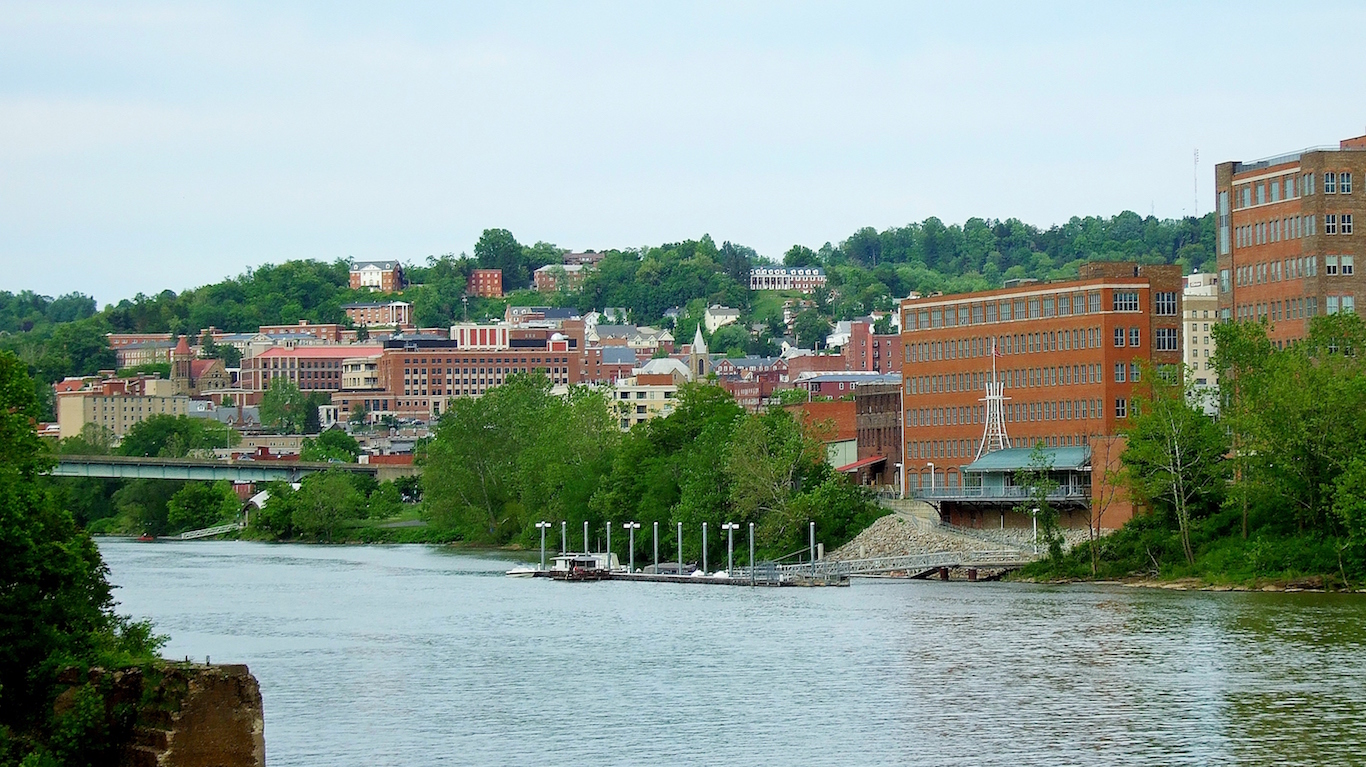
48. Morgantown, West Virginia
> Population (2016): 138,380
> Population chg. (2011-2016): +4.6% (WV: -1.3%)
> Jobs added (2011-2016): 4,000 (+6.3%)
> Unemployment: 3.9% (WV: 5.2%)
> Largest driver of growth: Natural change
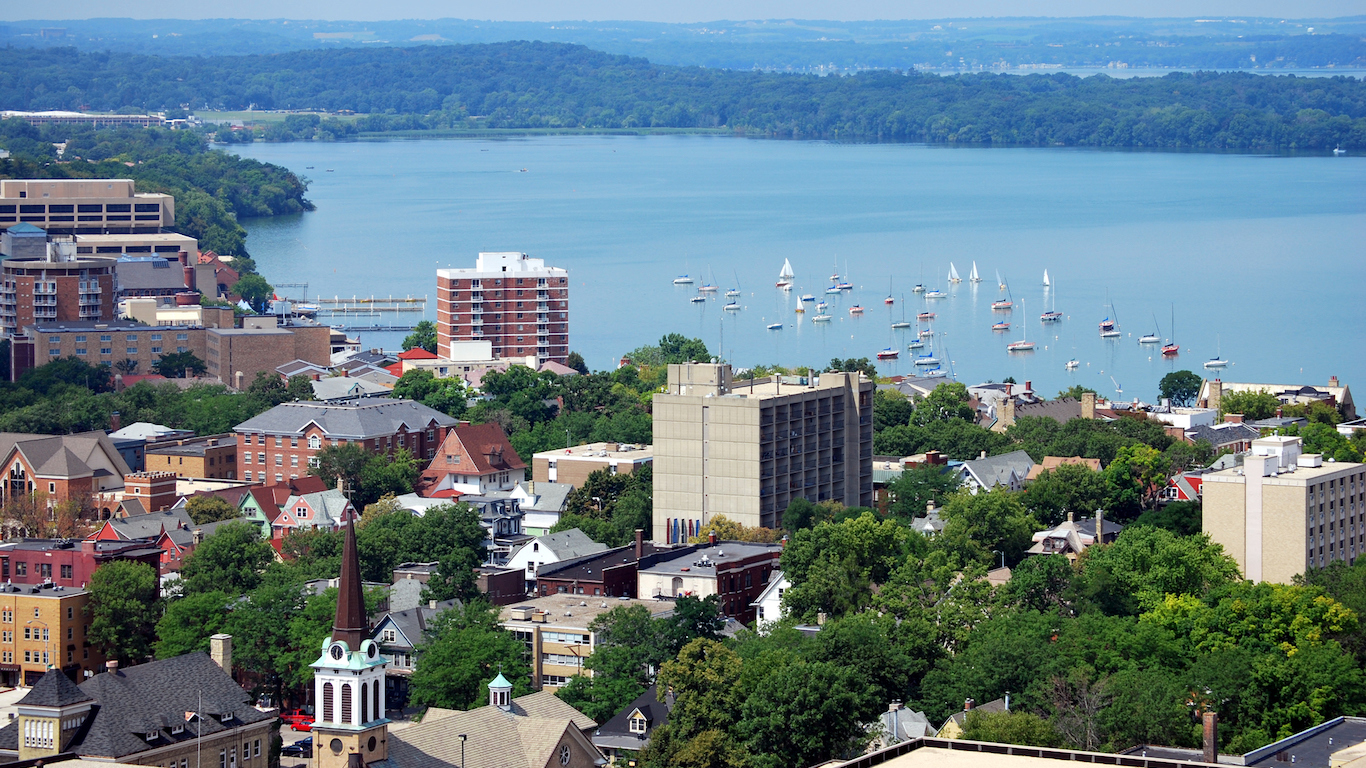
49. Madison, Wisconsin
> Population (2016): 648,929
> Population chg. (2011-2016): +5.7% (WI: +1.2%)
> Jobs added (2011-2016): 36,100 (+9.9%)
> Unemployment: 2.7% (WI: 3.7%)
> Largest driver of growth: Natural change
[in-text-ad-2]
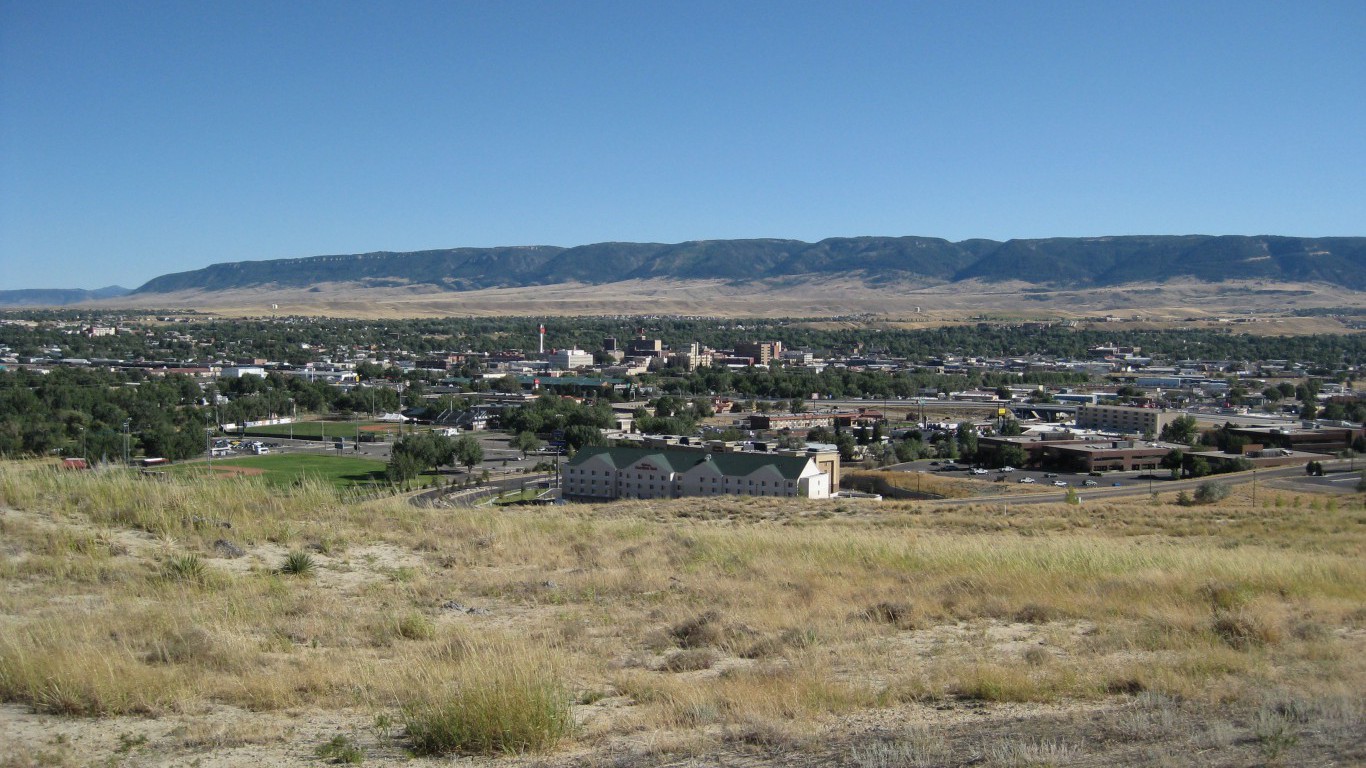
50. Casper, Wyoming
> Population (2016): 81,039
> Population chg. (2011-2016): +6.1% (WY: +3.1%)
> Jobs added (2011-2016): -1,600 (-4.0%)
> Unemployment: 6.4% (WY: 4.7%)
> Largest driver of growth: Natural change
Take Charge of Your Retirement In Just A Few Minutes (Sponsor)
Retirement planning doesn’t have to feel overwhelming. The key is finding expert guidance—and SmartAsset’s simple quiz makes it easier than ever for you to connect with a vetted financial advisor.
Here’s how it works:
- Answer a Few Simple Questions. Tell us a bit about your goals and preferences—it only takes a few minutes!
- Get Matched with Vetted Advisors Our smart tool matches you with up to three pre-screened, vetted advisors who serve your area and are held to a fiduciary standard to act in your best interests. Click here to begin
- Choose Your Fit Review their profiles, schedule an introductory call (or meet in person), and select the advisor who feel is right for you.
Why wait? Start building the retirement you’ve always dreamed of. Click here to get started today!
Thank you for reading! Have some feedback for us?
Contact the 24/7 Wall St. editorial team.
Latest from 24/7


Our expert who first called NVIDIA in 2009 is predicting 2025 will see a historic AI breakthrough.
You can follow him investing $500,000 of his own money on our top AI stocks for free.