Special Report
Cities With the Highest (and Lowest) Credit Scores

Published:
Last Updated:
Whether you are being denied a home or auto loan, a rental application, or a job, having a low credit score is a challenging situation. Such difficulties make it even harder to improve your financial standing.
To highlight how credit scores differ between cities, 24/7 Wall St. listed the 25 cities with the highest and 25 with the lowest average credit score as reported in credit bureau Experian’s 2016 State of Credit Report. Residents of Mankato, Minnesota have the highest average credit score of any measured city with 708. By contrast, the average credit score in Greenwood, Missouri is only 622, the lowest in the country.
A credit score indicates to creditors how much risk a potential borrower poses, with a higher score indicating less risk. Borrowers with high credit scores are more likely to pay back the loan, and on a timely basis. Lenders are not only more likely to approve these borrowers over those with a low credit score, but also the interest rates charged can be much lower.
Click here to see the cities with the highest credit scores.
Click here to see the cities with the lowest credit scores.
There are several different models used to calculate a credit score. Experian’s report is based on the latest VantageScore 3.0 model, a score created by VantageScore Solutions, LLC a company jointly owned by the three credit bureaus. Like the common FICO score, the VantageScore has a range between 300-850, with the majority of borrowers falling between 600-750.
According to Experian, the most influential aspect of the VantageScore model is payment history. Frequent delinquent payments lower a creditor’s confidence that future debts will be repaid as agreed. In 20 of the 25 cities with the worst credit scores, consumers make a late payment every other billing cycle on average. However, in 20 of the 25 cities with the best credit scores, residents make late payments half as often.
The worst case scenario for a creditor is to offer a loan and to never be repaid. Unpaid debt is often marked as a loss or sold to a third-party debt collector for a substantial loss. Of all collections, charge-offs, repossessions, foreclosures, and other loans, 32% are in default nationwide. In a handful of the cities with the worst credit, over 50% are in default, while every city with the best credit on this list is well under the nationwide rate.
Other factors that affect an individual’s credit score include the type of credit and how much of the available credit a borrower has utilized. Americans use on average 30% of the credit available to them. In every city with the worst credit, utilization is higher, while the opposite is true in every city with the best credit.
Even when borrowers with low credit scores are approved for credit, they are charged higher interest rates due to the increased risk they pose. Further, if they are denied, many resort to alternative borrowing options, such payday loans, that can have still higher interest rates.
To determine the cities where people have the best and worst credit, 24/7 Wall St. reviewed the average credit score in over 200 cities with data from Experian’s 2016 State of Credit report. Average annual late payments, revolving credit utilization, and mortgage and nonmortgage debt figures were also obtained from the same report.
These are the cities where residents have the best and worst credit.
The Cities with the Highest Credit Scores
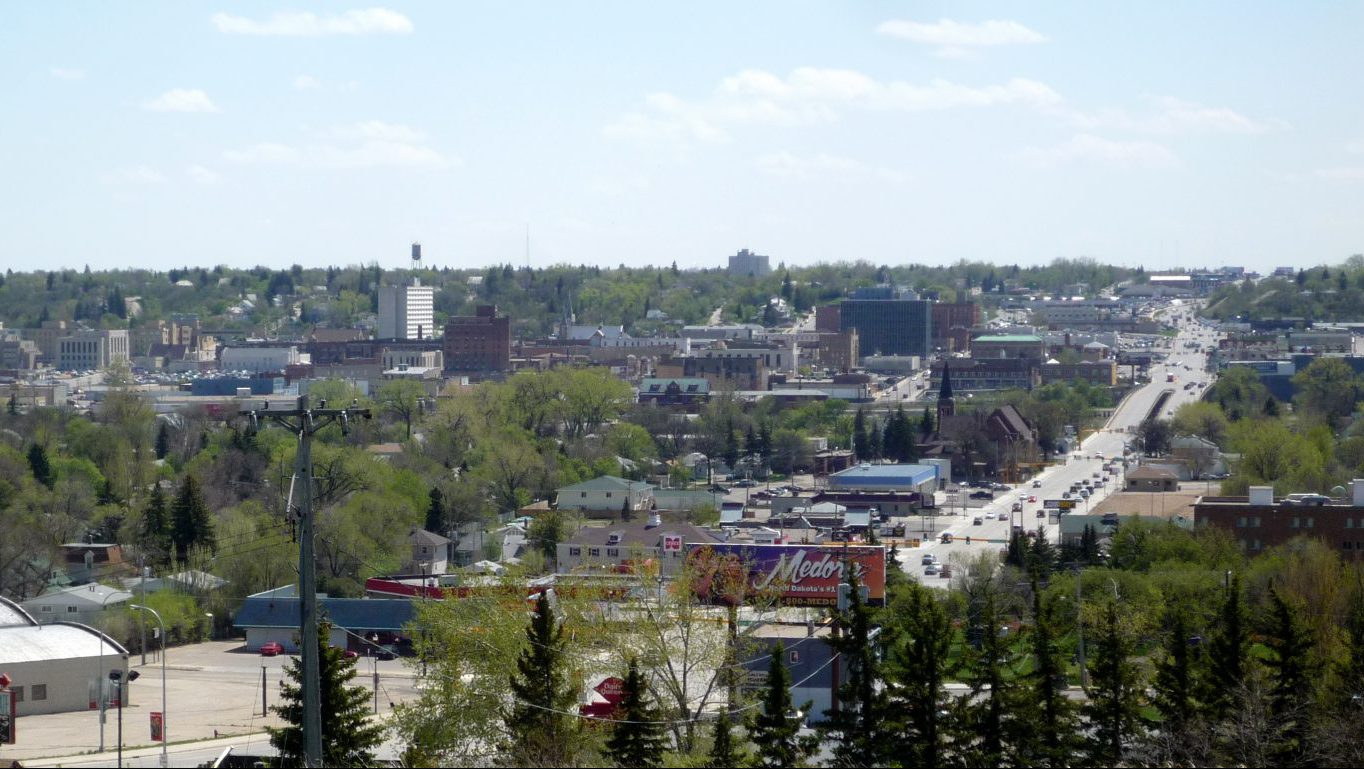
25. Minot, ND
> Avg. credit score: 693
> Avg. late payments per year: 2.9
> Avg. credit limit used: 26.3%
> Avg. nonmortgage debt: $43,830
> Avg. mortgage debt: $161,987
[in-text-ad]

24. Alpena, MI
> Avg. credit score: 694
> Avg. late payments per year: 3.6
> Avg. credit limit used: 26.2%
> Avg. nonmortgage debt: $26,019
> Avg. mortgage debt: $85,562

23. Des Moines, IA
> Avg. credit score: 694
> Avg. late payments per year: 2.8
> Avg. credit limit used: 25.8%
> Avg. nonmortgage debt: $36,200
> Avg. mortgage debt: $133,764

22. Johnstown, PA
> Avg. credit score: 694
> Avg. late payments per year: 3.1
> Avg. credit limit used: 27.1%
> Avg. nonmortgage debt: $35,150
> Avg. mortgage debt: $108,698
[in-text-ad-2]

21. Presque Isle, ME
> Avg. credit score: 695
> Avg. late payments per year: 2.9
> Avg. credit limit used: 28.9%
> Avg. nonmortgage debt: $35,998
> Avg. mortgage debt: $92,179

20. Butte, MT
> Avg. credit score: 696
> Avg. late payments per year: 3.1
> Avg. credit limit used: 26.7%
> Avg. nonmortgage debt: $44,342
> Avg. mortgage debt: $194,529
[in-text-ad]

19. Sioux City, IA
> Avg. credit score: 696
> Avg. late payments per year: 2.5
> Avg. credit limit used: 23.5%
> Avg. nonmortgage debt: $33,271
> Avg. mortgage debt: $117,638

18. Helena, MT
> Avg. credit score: 697
> Avg. late payments per year: 2.5
> Avg. credit limit used: 26.8%
> Avg. nonmortgage debt: $41,395
> Avg. mortgage debt: $172,258

17. Burlington, VT
> Avg. credit score: 697
> Avg. late payments per year: 2.4
> Avg. credit limit used: 28.2%
> Avg. nonmortgage debt: $38,217
> Avg. mortgage debt: $141,540
[in-text-ad-2]
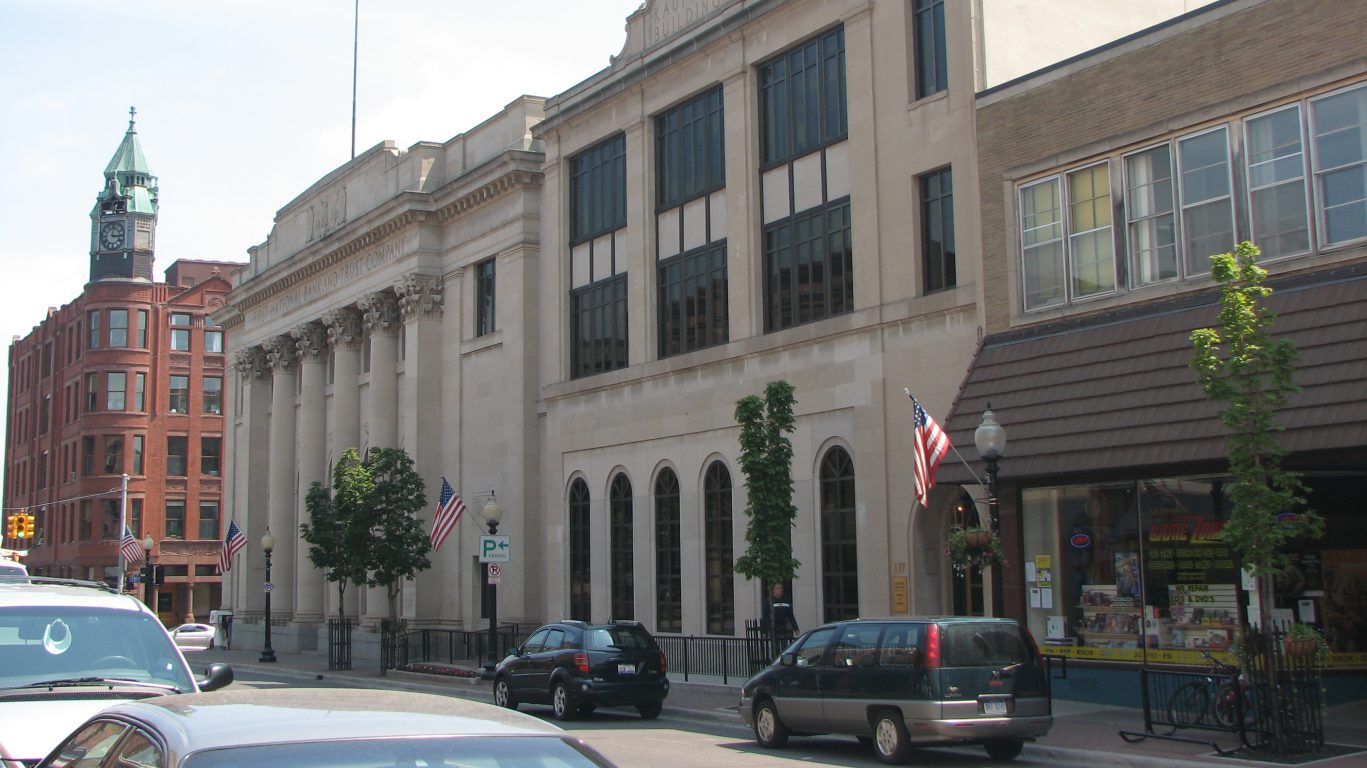
16. Marquette, MI
> Avg. credit score: 697
> Avg. late payments per year: 3.6
> Avg. credit limit used: 27.1%
> Avg. nonmortgage debt: $33,080
> Avg. mortgage debt: $96,699

15. Boston, MA
> Avg. credit score: 699
> Avg. late payments per year: 2.3
> Avg. credit limit used: 27.2%
> Avg. nonmortgage debt: $41,179
> Avg. mortgage debt: $248,399
[in-text-ad]

14. Lincoln, NE
> Avg. credit score: 699
> Avg. late payments per year: 2.7
> Avg. credit limit used: 24.0%
> Avg. nonmortgage debt: $33,260
> Avg. mortgage debt: $127,750

13. San Francisco, CA
> Avg. credit score: 699
> Avg. late payments per year: 2.0
> Avg. credit limit used: 25.4%
> Avg. nonmortgage debt: $43,590
> Avg. mortgage debt: $430,575

12. Charlottesville, VA
> Avg. credit score: 700
> Avg. late payments per year: 2.4
> Avg. credit limit used: 26.7%
> Avg. nonmortgage debt: $46,108
> Avg. mortgage debt: $229,111
[in-text-ad-2]

11. Cedar Rapids, IA
> Avg. credit score: 701
> Avg. late payments per year: 2.9
> Avg. credit limit used: 24.9%
> Avg. nonmortgage debt: $35,250
> Avg. mortgage debt: $131,569

10. Madison, WI
> Avg. credit score: 702
> Avg. late payments per year: 2.3
> Avg. credit limit used: 25.5%
> Avg. nonmortgage debt: $35,815
> Avg. mortgage debt: $155,777
[in-text-ad]

9. Fargo, ND
> Avg. credit score: 703
> Avg. late payments per year: 2.6
> Avg. credit limit used: 25.3%
> Avg. nonmortgage debt: $37,966
> Avg. mortgage debt: $133,264

8. La Crosse, WI
> Avg. credit score: 703
> Avg. late payments per year: 2.6
> Avg. credit limit used: 25.5%
> Avg. nonmortgage debt: $32,895
> Avg. mortgage debt: $120,946

7. Sioux Falls, SD
> Avg. credit score: 703
> Avg. late payments per year: 2.5
> Avg. credit limit used: 25.3%
> Avg. nonmortgage debt: $39,269
> Avg. mortgage debt: $141,827
[in-text-ad-2]

6. Duluth, MN
> Avg. credit score: 703
> Avg. late payments per year: 2.2
> Avg. credit limit used: 26.4%
> Avg. nonmortgage debt: $34,782
> Avg. mortgage debt: $123,017

5. Wausau, WI
> Avg. credit score: 704
> Avg. late payments per year: 2.8
> Avg. credit limit used: 24.7%
> Avg. nonmortgage debt: $31,975
> Avg. mortgage debt: $111,625
[in-text-ad]

4. Green Bay, WI
> Avg. credit score: 704
> Avg. late payments per year: 3.0
> Avg. credit limit used: 24.4%
> Avg. nonmortgage debt: $33,034
> Avg. mortgage debt: $121,194

3. Minneapolis, MN
> Avg. credit score: 707
> Avg. late payments per year: 2.3
> Avg. credit limit used: 26.3%
> Avg. nonmortgage debt: $37,699
> Avg. mortgage debt: $179,170

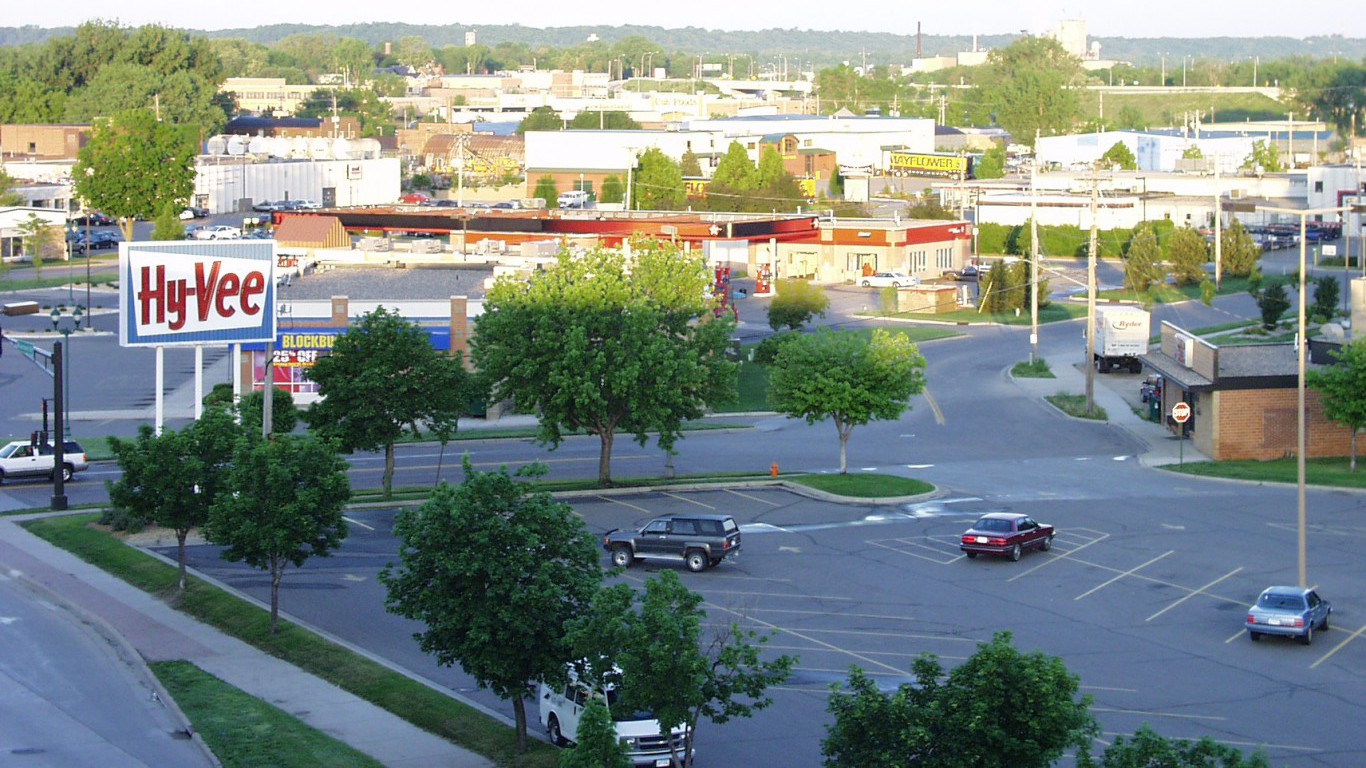
2. Rochester, MN
> Avg. credit score: 708
> Avg. late payments per year: 2.5
> Avg. credit limit used: 24.0%
> Avg. nonmortgage debt: $35,973
> Avg. mortgage debt: $132,430
[in-text-ad-2]
1. Mankato, MN
> Avg. credit score: 708
> Avg. late payments per year: 2.7
> Avg. credit limit used: 24.1%
> Avg. nonmortgage debt: $32,536
> Avg. mortgage debt: $120,142
The Cities with the Lowest Credit Scores

25. Tyler, TX
> Avg. credit score: 648
> Avg. late payments per year: 6.8
> Avg. credit limit used: 30.9%
> Avg. nonmortgage debt: $40,153
> Avg. mortgage debt: $127,808
[in-text-ad]

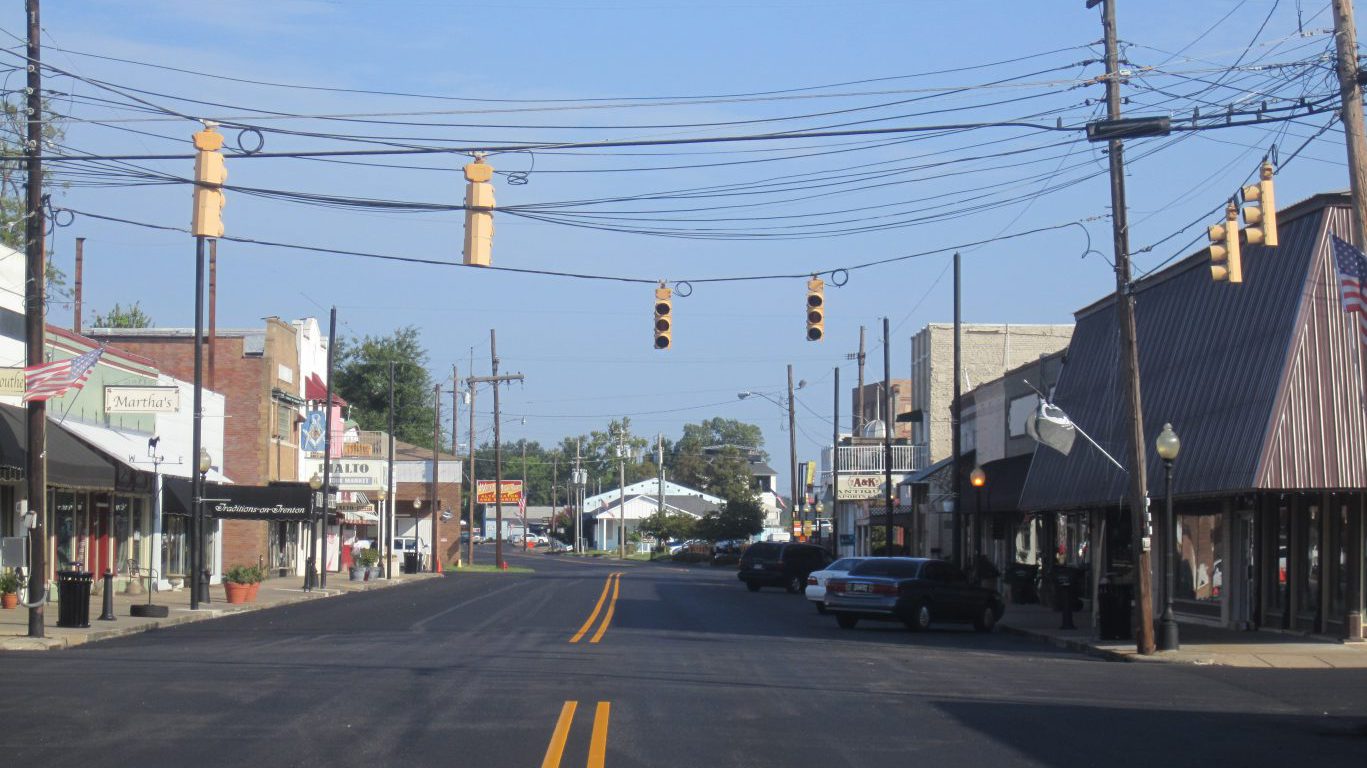
24. Sherman, OK
> Avg. credit score: 648
> Avg. late payments per year: 7.0
> Avg. credit limit used: 32.1%
> Avg. nonmortgage debt: $39,179
> Avg. mortgage debt: $113,863

23. El Paso, TX
> Avg. credit score: 648
> Avg. late payments per year: 6.7
> Avg. credit limit used: 35.5%
> Avg. nonmortgage debt: $35,738
> Avg. mortgage debt: $118,213

22. Fresno, CA
> Avg. credit score: 646
> Avg. late payments per year: 4.6
> Avg. credit limit used: 32.5%
> Avg. nonmortgage debt: $34,514
> Avg. mortgage debt: $173,833
[in-text-ad-2]

21. Columbus, MS
> Avg. credit score: 646
> Avg. late payments per year: 6.1
> Avg. credit limit used: 31.3%
> Avg. nonmortgage debt: $36,794
> Avg. mortgage debt: $98,547
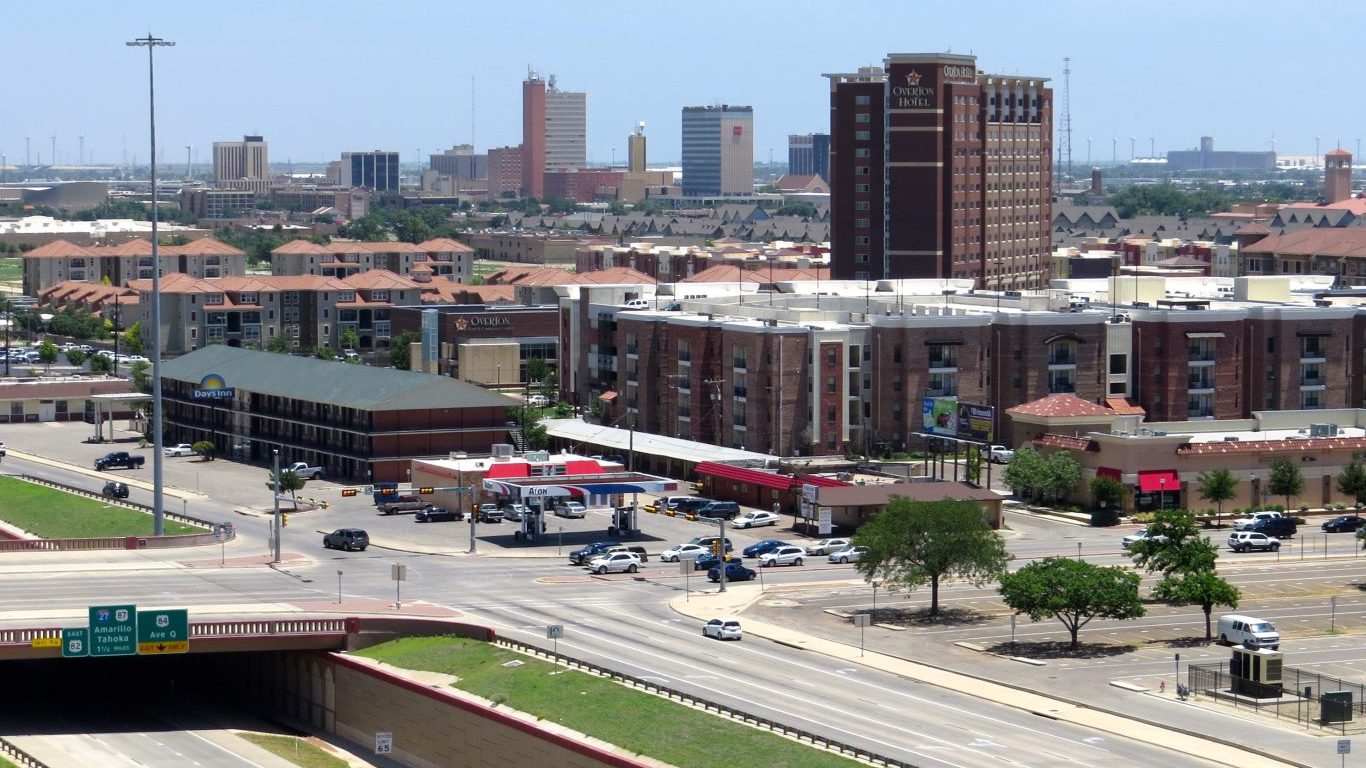
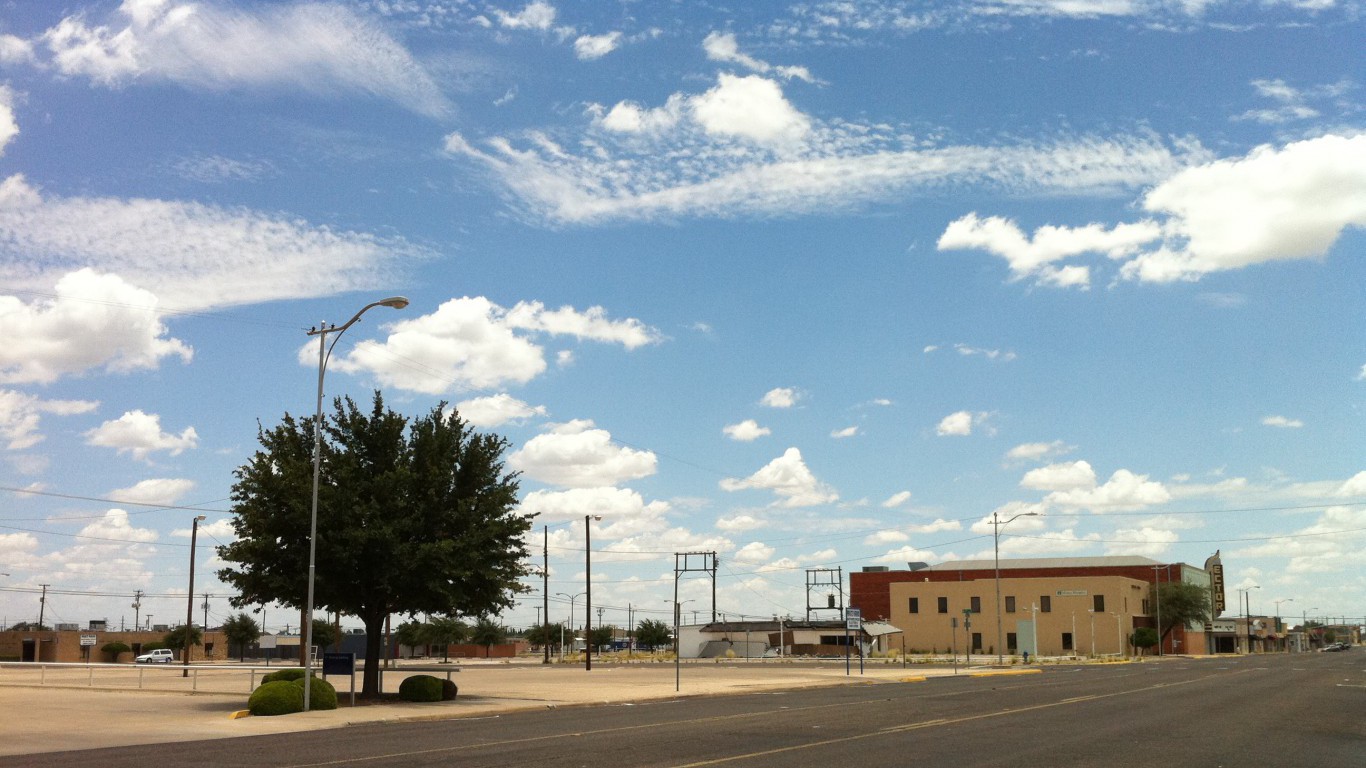
20. Lubbock, TX
> Avg. credit score: 646
> Avg. late payments per year: 7.1
> Avg. credit limit used: 32.6%
> Avg. nonmortgage debt: $43,169
> Avg. mortgage debt: $124,981
[in-text-ad]

19. Las Vegas, NV
> Avg. credit score: 645
> Avg. late payments per year: 6.0
> Avg. credit limit used: 34.3%
> Avg. nonmortgage debt: $37,636
> Avg. mortgage debt: $205,441

18. Macon, GA
> Avg. credit score: 644
> Avg. late payments per year: 6.9
> Avg. credit limit used: 34.0%
> Avg. nonmortgage debt: $38,487
> Avg. mortgage debt: $118,484

17. Columbus, GA
> Avg. credit score: 643
> Avg. late payments per year: 5.9
> Avg. credit limit used: 36.5%
> Avg. nonmortgage debt: $38,967
> Avg. mortgage debt: $139,519
[in-text-ad-2]

16. Memphis, TN
> Avg. credit score: 642
> Avg. late payments per year: 6.2
> Avg. credit limit used: 34.5%
> Avg. nonmortgage debt: $39,005
> Avg. mortgage debt: $130,180

15. Savannah, GA
> Avg. credit score: 642
> Avg. late payments per year: 6.0
> Avg. credit limit used: 34.8%
> Avg. nonmortgage debt: $42,005
> Avg. mortgage debt: $172,356
[in-text-ad]

14. Jackson, MS
> Avg. credit score: 642
> Avg. late payments per year: 6.7
> Avg. credit limit used: 35.0%
> Avg. nonmortgage debt: $40,309
> Avg. mortgage debt: $130,964

13. Augusta, GA
> Avg. credit score: 642
> Avg. late payments per year: 6.3
> Avg. credit limit used: 34.5%
> Avg. nonmortgage debt: $39,416
> Avg. mortgage debt: $133,928

12. Montgomery, AL
> Avg. credit score: 641
> Avg. late payments per year: 7.3
> Avg. credit limit used: 34.3%
> Avg. nonmortgage debt: $38,957
> Avg. mortgage debt: $131,720
[in-text-ad-2]
11. Odessa, TX
> Avg. credit score: 641
> Avg. late payments per year: 6.7
> Avg. credit limit used: 34.7%
> Avg. nonmortgage debt: $44,378
> Avg. mortgage debt: $141,967

10. Shreveport, LA
> Avg. credit score: 640
> Avg. late payments per year: 7.0
> Avg. credit limit used: 33.6%
> Avg. nonmortgage debt: $41,204
> Avg. mortgage debt: $122,876
[in-text-ad]
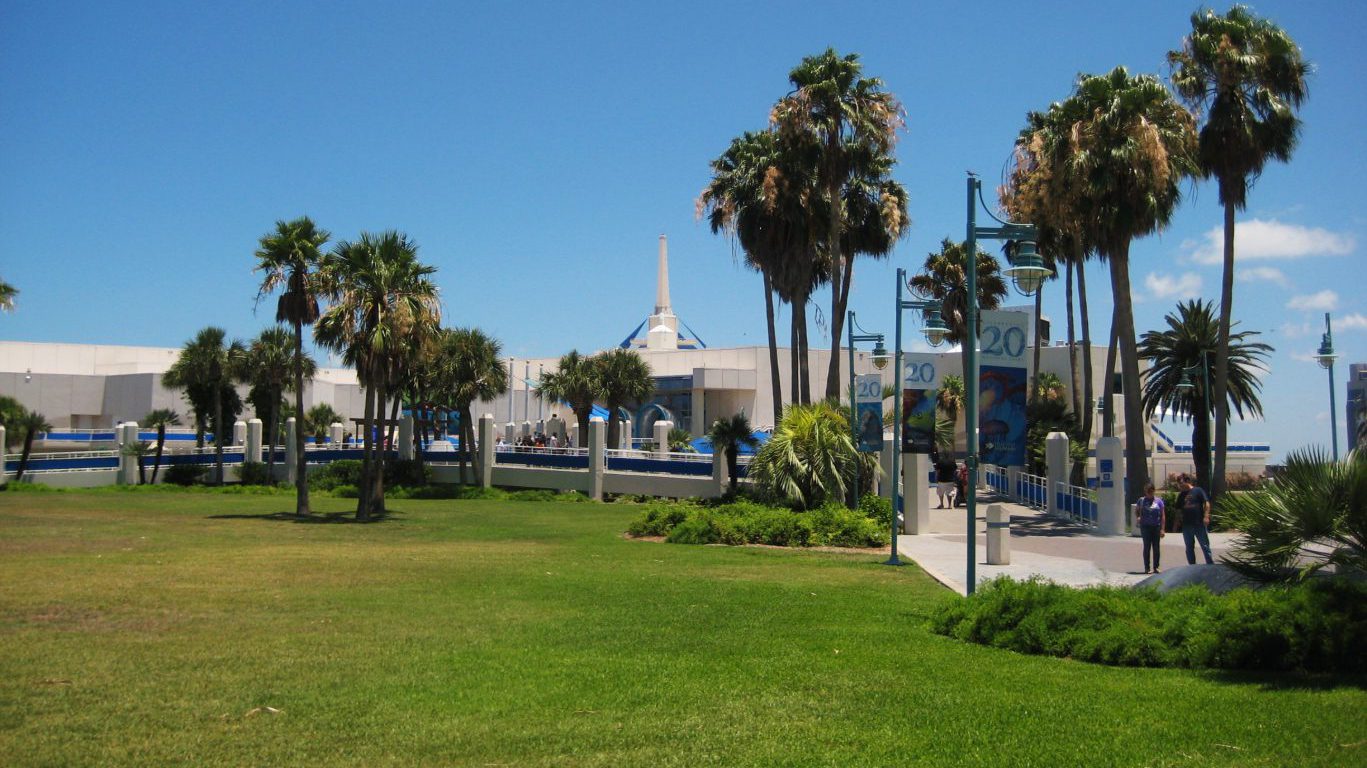
9. Corpus Christi, TX
> Avg. credit score: 639
> Avg. late payments per year: 10.5
> Avg. credit limit used: 35.6%
> Avg. nonmortgage debt: $41,435
> Avg. mortgage debt: $121,413

8. Bakersfield, CA
> Avg. credit score: 639
> Avg. late payments per year: 4.7
> Avg. credit limit used: 33.3%
> Avg. nonmortgage debt: $35,138
> Avg. mortgage debt: $178,955

7. Alexandria, LA
> Avg. credit score: 639
> Avg. late payments per year: 7.5
> Avg. credit limit used: 33.0%
> Avg. nonmortgage debt: $38,863
> Avg. mortgage debt: $119,235
[in-text-ad-2]
6. Monroe, LA
> Avg. credit score: 639
> Avg. late payments per year: 6.9
> Avg. credit limit used: 33.4%
> Avg. nonmortgage debt: $41,610
> Avg. mortgage debt: $116,628
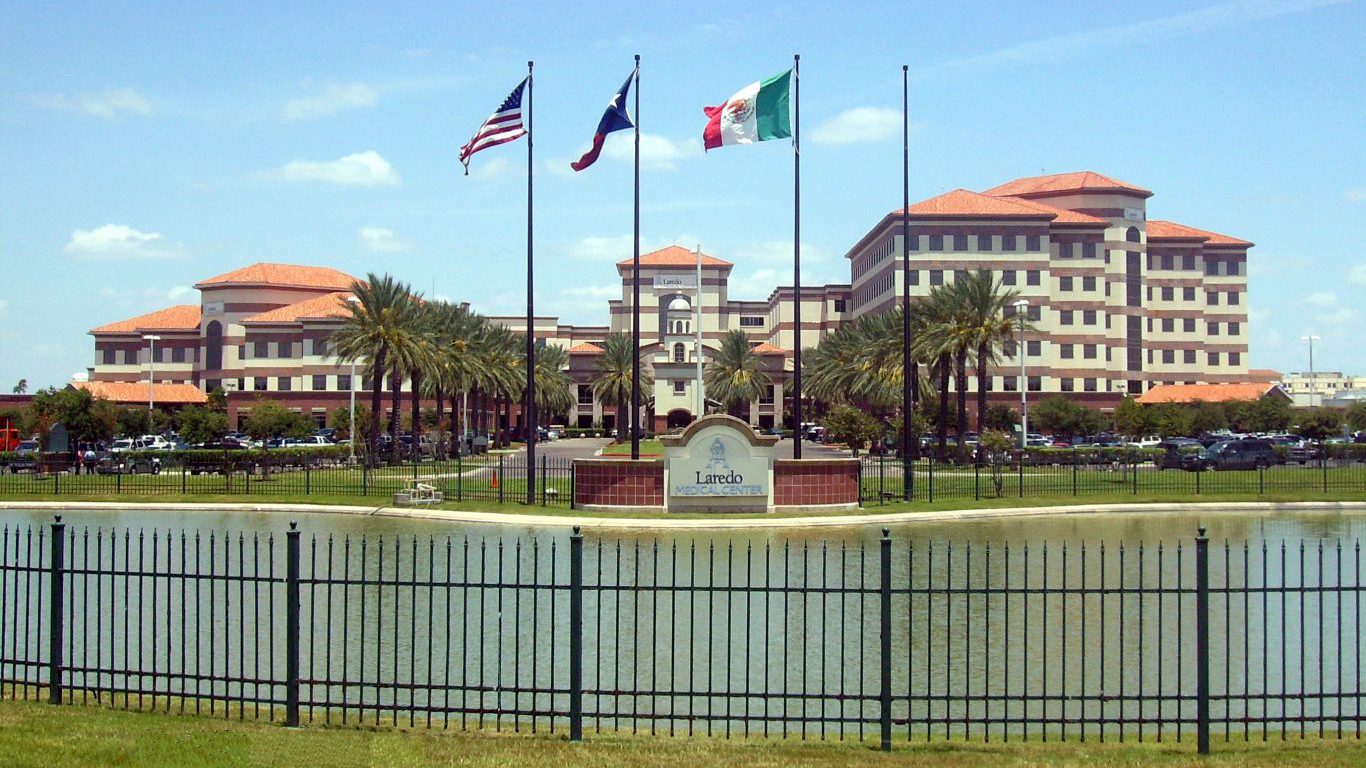
5. Laredo, TX
> Avg. credit score: 635
> Avg. late payments per year: 7.5
> Avg. credit limit used: 36.2%
> Avg. nonmortgage debt: $35,799
> Avg. mortgage debt: $111,718
[in-text-ad]

4. Riverside, CA
> Avg. credit score: 632
> Avg. late payments per year: 5.4
> Avg. credit limit used: 37.1%
> Avg. nonmortgage debt: $37,659
> Avg. mortgage debt: $194,373
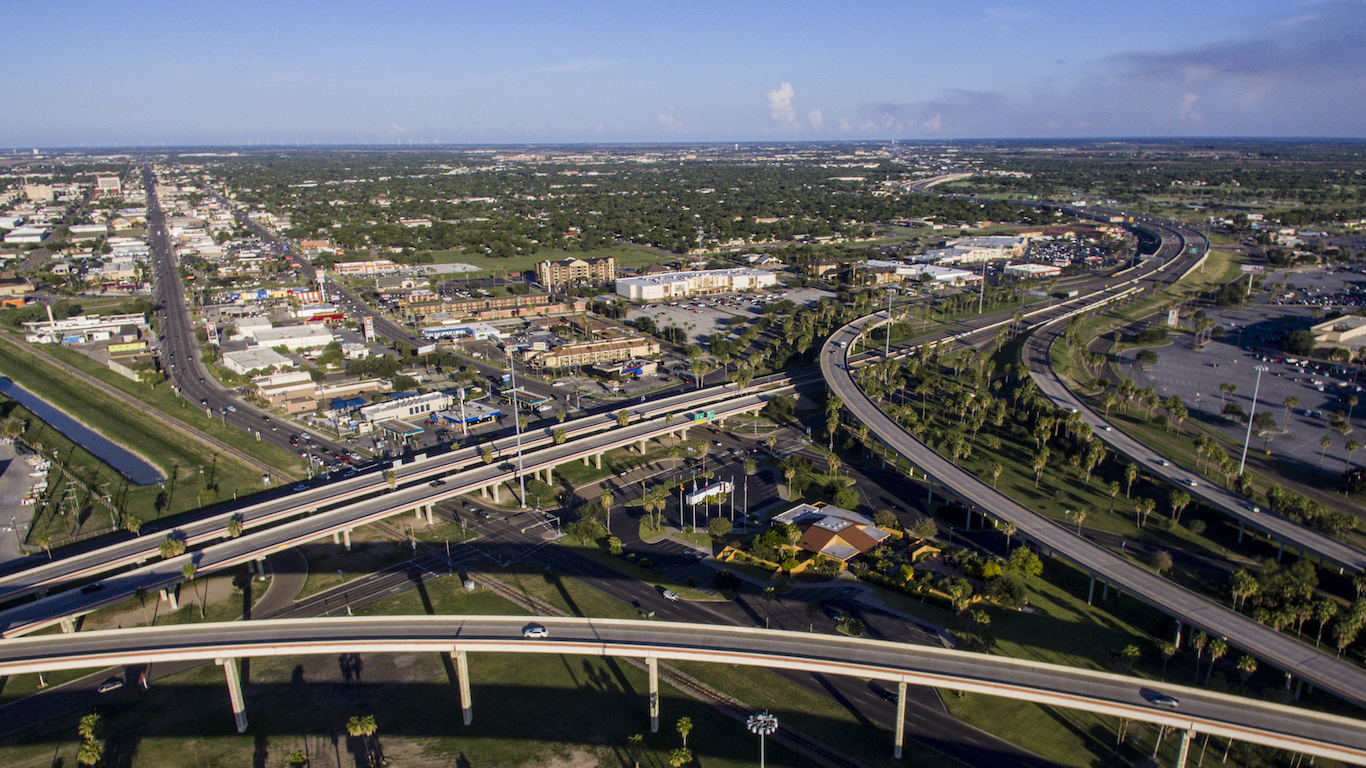
3. Harlingen, TX
> Avg. credit score: 631
> Avg. late payments per year: 8.1
> Avg. credit limit used: 35.4%
> Avg. nonmortgage debt: $35,690
> Avg. mortgage debt: $96,487
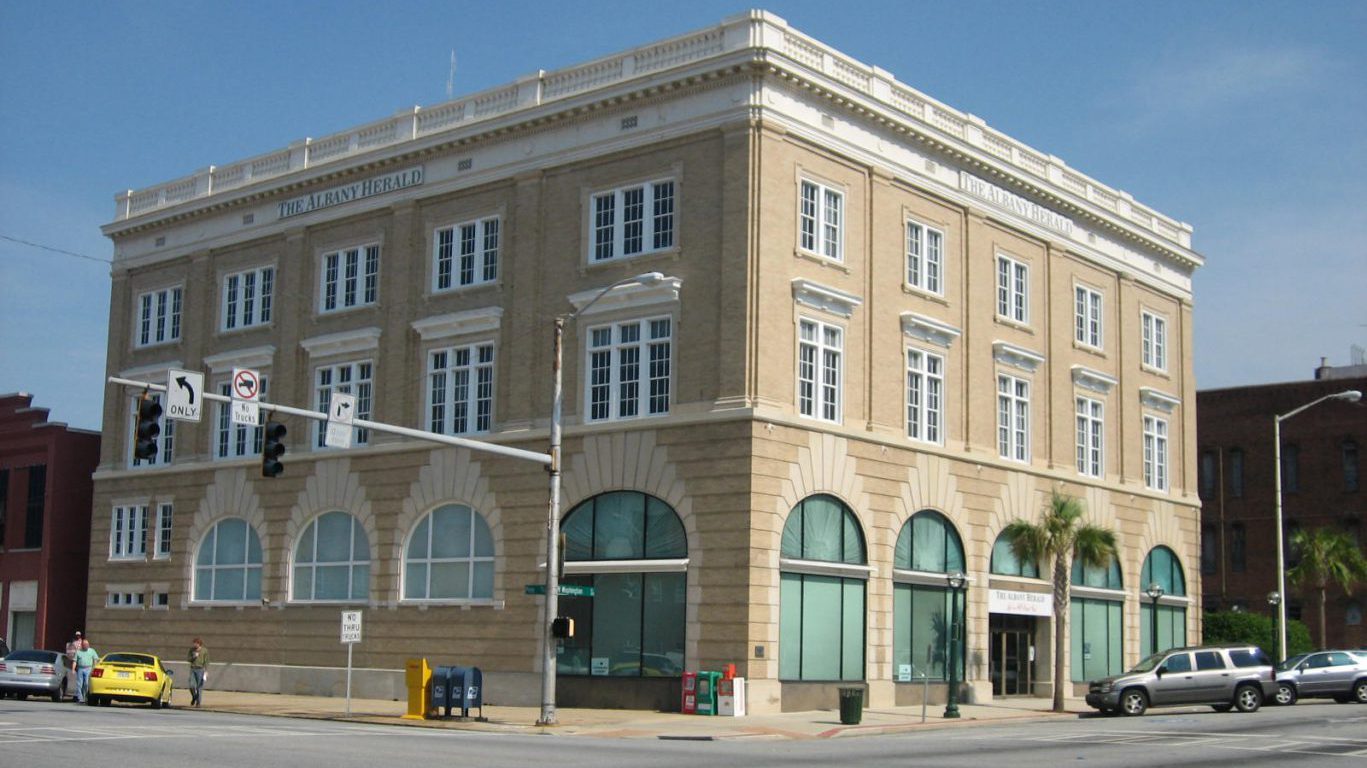
2. Albany, GA
> Avg. credit score: 624
> Avg. late payments per year: 8.3
> Avg. credit limit used: 35.6%
> Avg. nonmortgage debt: $38,580
> Avg. mortgage debt: $103,613
[in-text-ad-2]

1. Greenwood, MS
> Avg. credit score: 622
> Avg. late payments per year: 6.3
> Avg. credit limit used: 36.6%
> Avg. nonmortgage debt: $38,201
> Avg. mortgage debt: $83,170
Are you ahead, or behind on retirement? For families with more than $500,000 saved for retirement, finding a financial advisor who puts your interest first can be the difference, and today it’s easier than ever. SmartAsset’s free tool matches you with up to three fiduciary financial advisors who serve your area in minutes. Each advisor has been carefully vetted and must act in your best interests. Start your search now.
If you’ve saved and built a substantial nest egg for you and your family, don’t delay; get started right here and help your retirement dreams become a retirement reality.
Thank you for reading! Have some feedback for us?
Contact the 24/7 Wall St. editorial team.


Our expert who first called NVIDIA in 2009 is predicting 2025 will see a historic AI breakthrough.
You can follow him investing $500,000 of his own money on our top AI stocks for free.
 24/7 Wall St.
 24/7 Wall St.
 24/7 Wall St.
 24/7 Wall St.
 24/7 Wall St.