Special Report
America’s Most Eco-Friendly Vehicles
Published:
Last Updated:

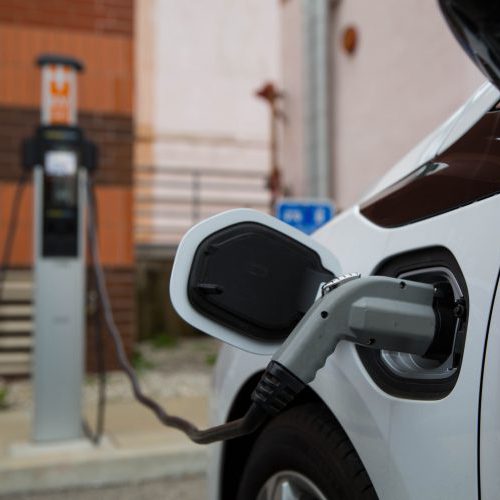
Highway vehicles in the United States emit approximately 1.7 billion tons of greenhouse gases into the atmosphere every year, close to one-quarter of all greenhouse gas emissions. With climate change widely viewed as a long-term threat to the planet and health of the population, consumers and auto industry players continue to seek more fuel-efficient driving options.
In light of Earth Day — a celebration aimed at putting environmental protection in the spotlight, and a reminder of the much needed action yet to be done — 24/7 Wall St. reviewed the vehicles with the lowest CO2 emissions per mile. Data was obtained from the Environmental Protection Agency’s 2017 Fuel Economy Guide.
Because electric cars emit zero CO2, the top 13 best vehicles for the environment are all electric cars, led by Hyundai Ioniq Electric. The Ioniq Electric’s 136 mpg equivalent makes it the most efficient even among the other electric vehicles on this list. Pollution from power plants that generate electricity for electric cars is part of the true environmental impact of a particular vehicle, but production stage factors such as these were not considered for this ranking.
Click here to see America’s most environmentally-friendly vehicles.
Efficient fuel consumption helps reduce environmental harm. While almost all cars currently run on oil, fossil fuels are nonrenewable sources of energy and eventually alternative fuel sources will be needed for the current level of automobile travel to continue.
Efficient fuel consumption can also be beneficial to personal finances. The price of gas fluctuates wildly, and a fuel-efficient vehicle can make a major dent in a driver’s annual operating costs.
According to the EPA, on the assumption of 15,000 miles of travel, a driver in the United States spends between $500 and $4,000 on fuel each year — less for fuel efficient cars that use regular unleaded gasoline, and more for gas guzzling vehicles that require premium fuel. To estimate an average expenditure, the EPA assumes 25 mpg fuel economy and $2.44 per gallon of regular unleaded gasoline. At this rate, a typical driver would end up spending roughly $1,500 a year on fuel.
Unsurprisingly, large SUVs and high performance sports cars dominate the list of least efficient vehicles. By contrast, small, hybrid and electric compact vehicles tend to be among the most eco-friendly and most cost effective vehicles on the market. Drivers of Chevy Bolts, VW e-Golfs, and Hyundai Ioniq Electrics — each among the top five most eco-friendly cars — spend an average $550 on fuel annually.
A few of the nation’s greenest cars, despite having among the lowest CO2 emissions, are relatively expensive to drive. The Hyundai Tucson Fuel Cell, for example, is more costly to drive than the average vehicle. While the only waste product of the Fuel Cell is water, the hydrogen needed to operate the car is currently more expensive than gasoline.
To determine the most environmentally-friendly vehicles available in the United States, 24/7 Wall St. reviewed CO2 emissions per mile driven for over 1,200 vehicles with data from the Environmental Protection Agency’s 2017 Fuel Economy Guide datafile. To break ties between vehicles with equal CO2 emissions, we used fuel efficiency figures followed by five-year fuel cost savings from the same dataset. We only considered the most environmentally- friendly vehicle within each model. For example, the Tesla S 60D was selected among eight versions of the Tesla Model S tracked by the EPA.
These are the most eco-friendly vehicles.

50. Toyota Yaris iA
> CO2 released per mile: 249 grams
> Fuel efficiency: 35 mpg
> 5-yr fuel savings vs. 2017 industry avg.: $1,750
> Vehicle type: Gasoline
[in-text-ad]

49. BMW X5 xDrive40e
> CO2 released per mile: 248 grams
> Fuel efficiency: 29 mpg equivalent
> 5-yr fuel savings vs. 2017 industry avg.: -$750
> Vehicle type: Plug-in Hybrid
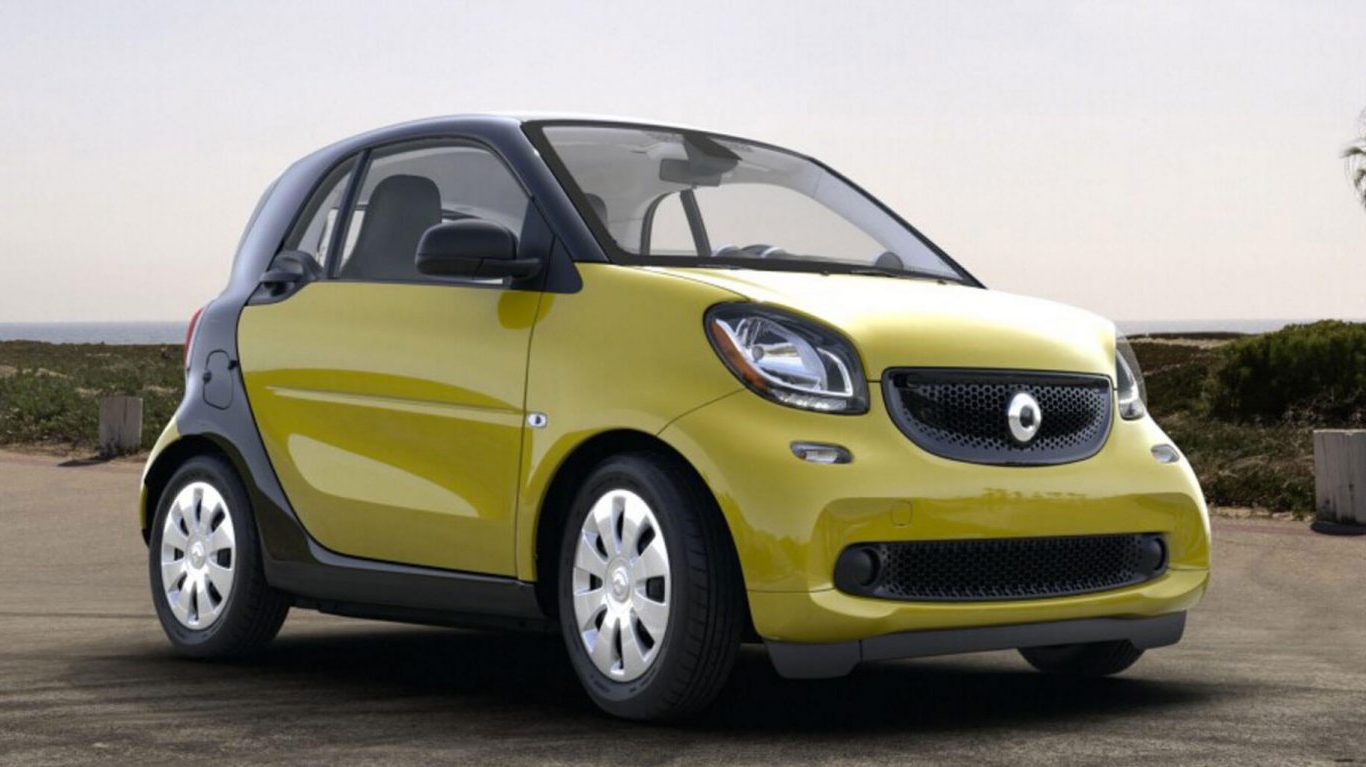
48. Smart Fortwo (Coupe)
> CO2 released per mile: 248 grams
> Fuel efficiency: 35 mpg
> 5-yr fuel savings vs. 2017 industry avg.: $1,000
> Vehicle type: Gasoline
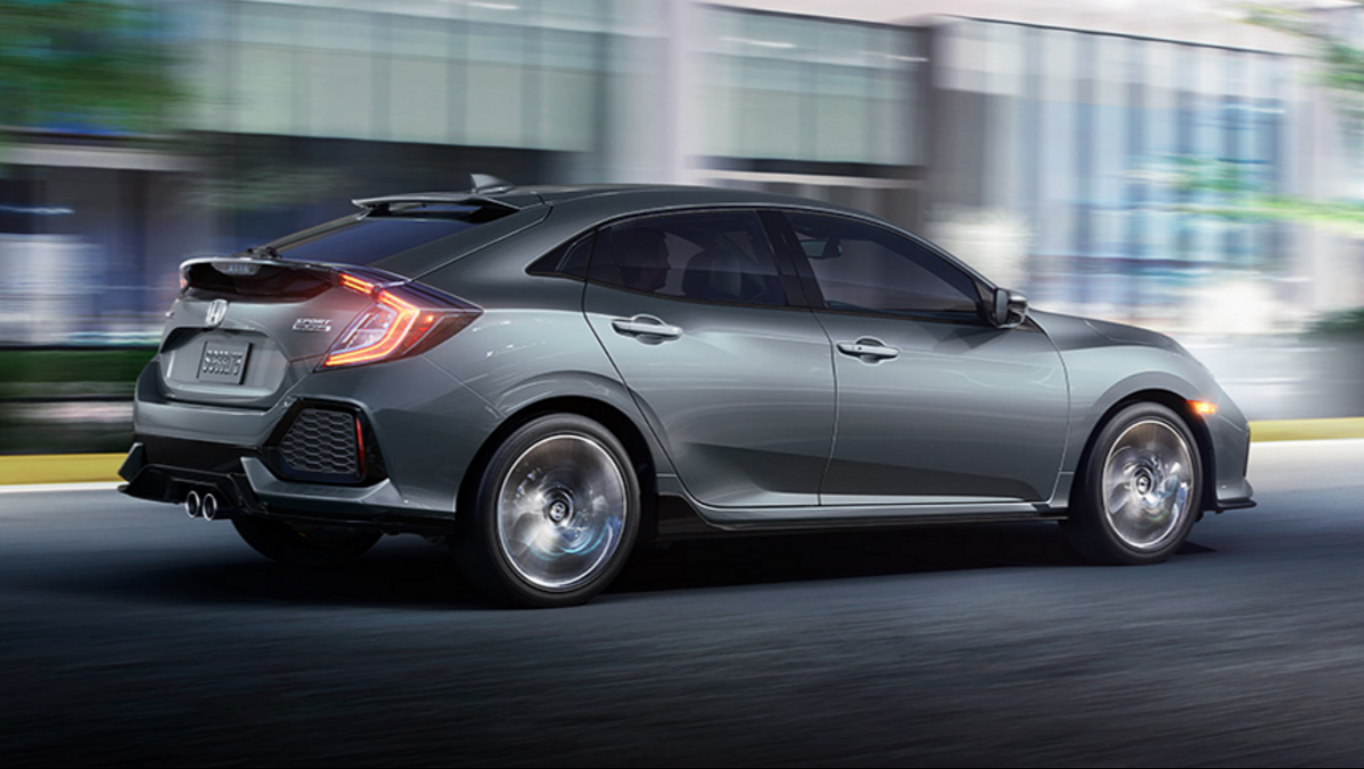
47. Honda Civic 4DR
> CO2 released per mile: 248 grams
> Fuel efficiency: 36 mpg
> 5-yr fuel savings vs. 2017 industry avg.: $2,000
> Vehicle type: Gasoline
[in-text-ad-2]
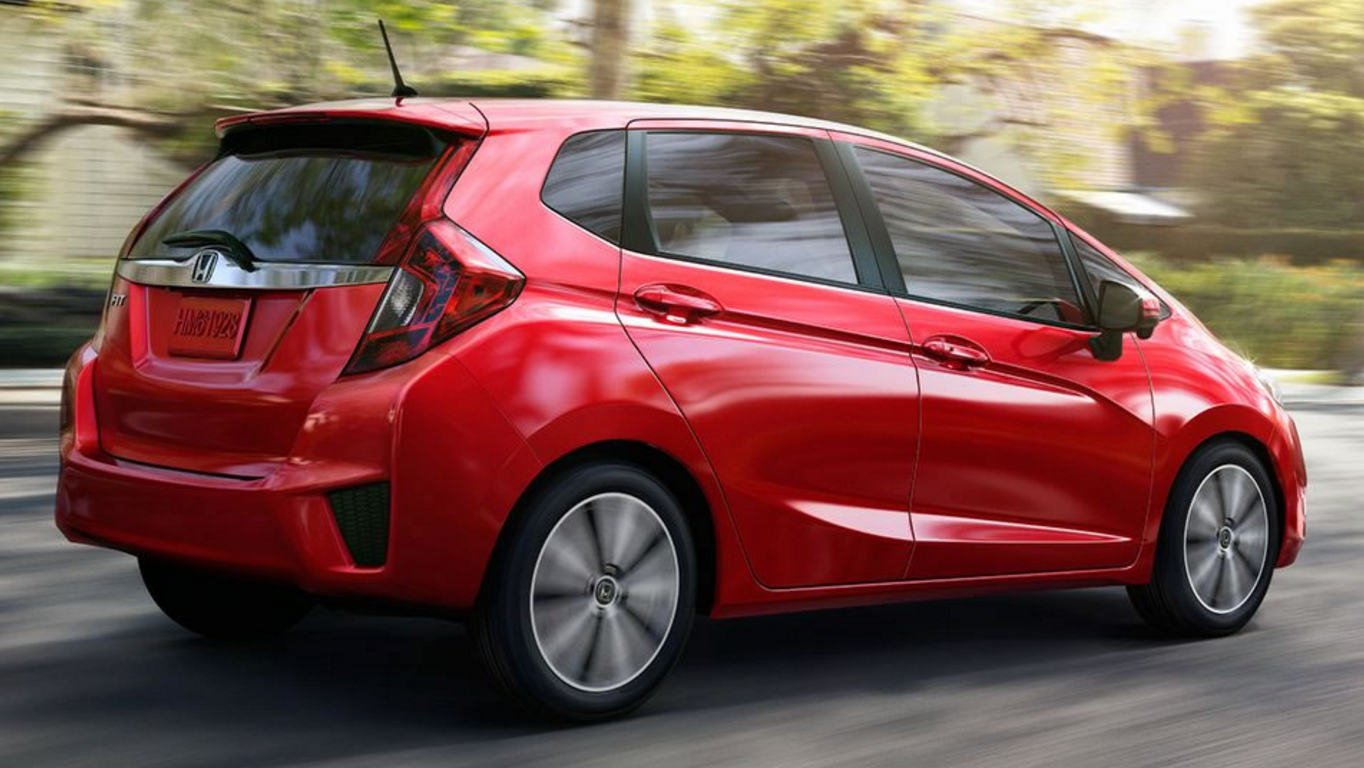
46. Honda Fit
> CO2 released per mile: 247 grams
> Fuel efficiency: 36 mpg
> 5-yr fuel savings vs. 2017 industry avg.: $2,000
> Vehicle type: Gasoline

45. Volvo XC90 AWD
> CO2 released per mile: 238 grams
> Fuel efficiency: 30 mpg equivalent
> 5-yr fuel savings vs. 2017 industry avg.: -$500
> Vehicle type: Plug-in Hybrid
[in-text-ad]

44. Mercedes-Benz S 550e
> CO2 released per mile: 229 grams
> Fuel efficiency: 31 mpg equivalent
> 5-yr fuel savings vs. 2017 industry avg.: -$250
> Vehicle type: Plug-in Hybrid

43. Mitsubishi Mirage
> CO2 released per mile: 226 grams
> Fuel efficiency: 39 mpg
> 5-yr fuel savings vs. 2017 industry avg.: $2,250
> Vehicle type: Gasoline
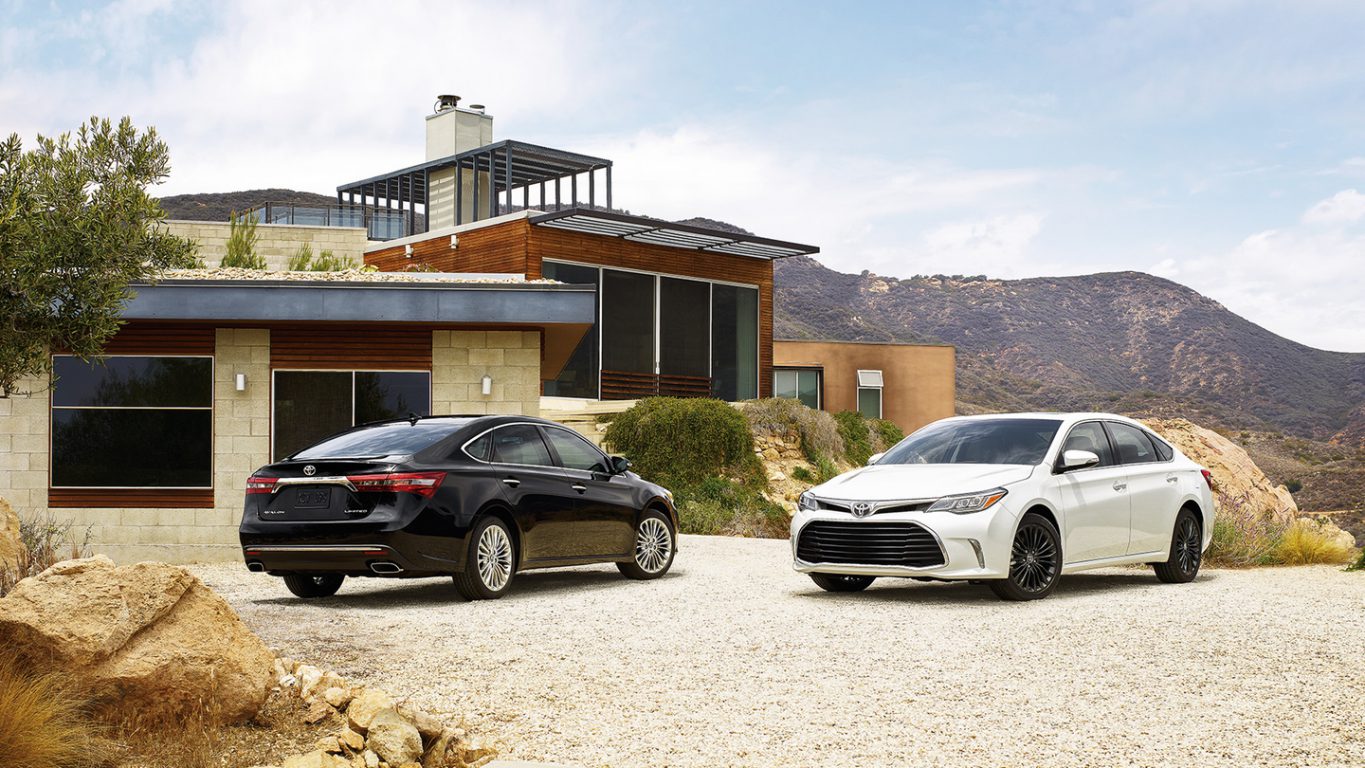
42. Toyota Avalon Hybrid
> CO2 released per mile: 223 grams
> Fuel efficiency: 40 mpg
> 5-yr fuel savings vs. 2017 industry avg.: $2,500
> Vehicle type: Gasoline
[in-text-ad-2]
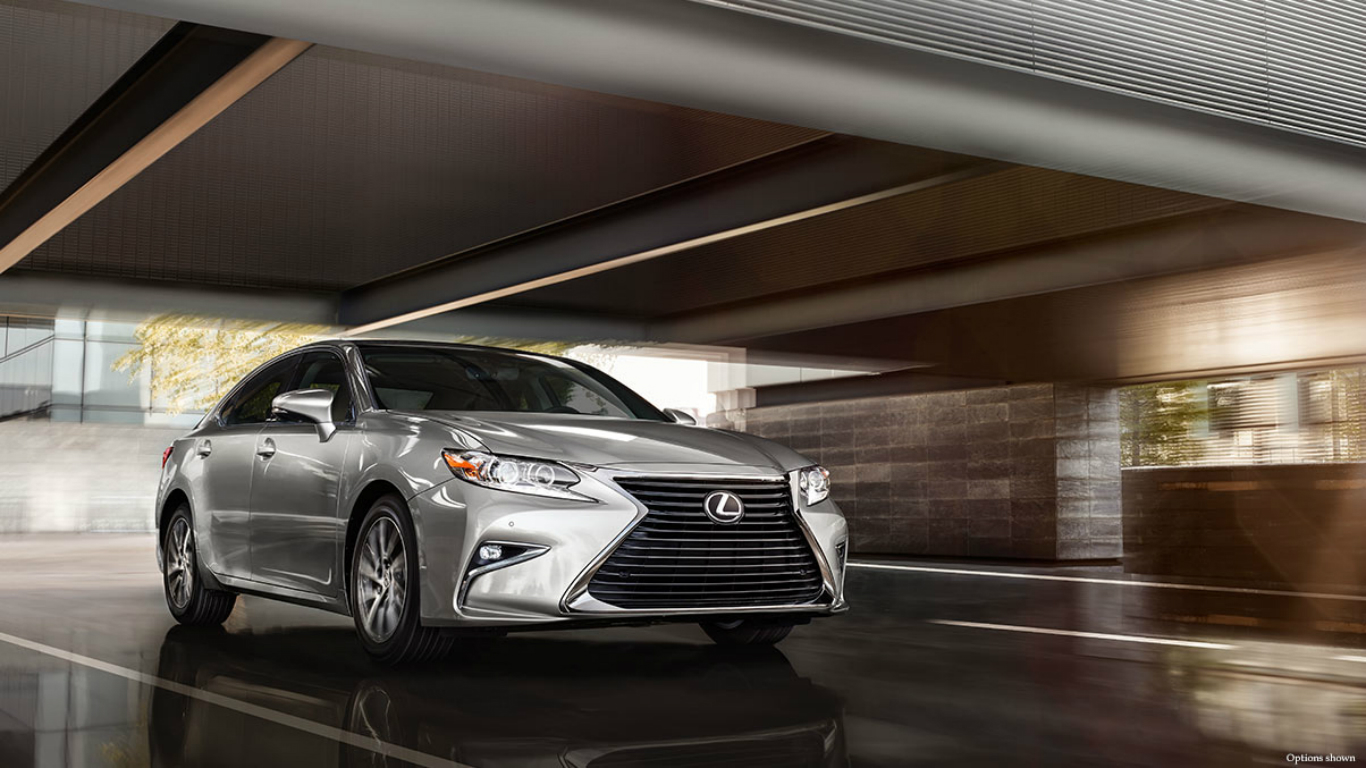
41. Lexus ES 300h
> CO2 released per mile: 223 grams
> Fuel efficiency: 40 mpg
> 5-yr fuel savings vs. 2017 industry avg.: $2,500
> Vehicle type: Gasoline

40. Ford C-Max Hybrid FWD
> CO2 released per mile: 222 grams
> Fuel efficiency: 40 mpg
> 5-yr fuel savings vs. 2017 industry avg.: $2,500
> Vehicle type: Gasoline
[in-text-ad]

39. Lincoln MKZ Hybrid FWD
> CO2 released per mile: 222 grams
> Fuel efficiency: 40 mpg
> 5-yr fuel savings vs. 2017 industry avg.: $2,500
> Vehicle type: Gasoline
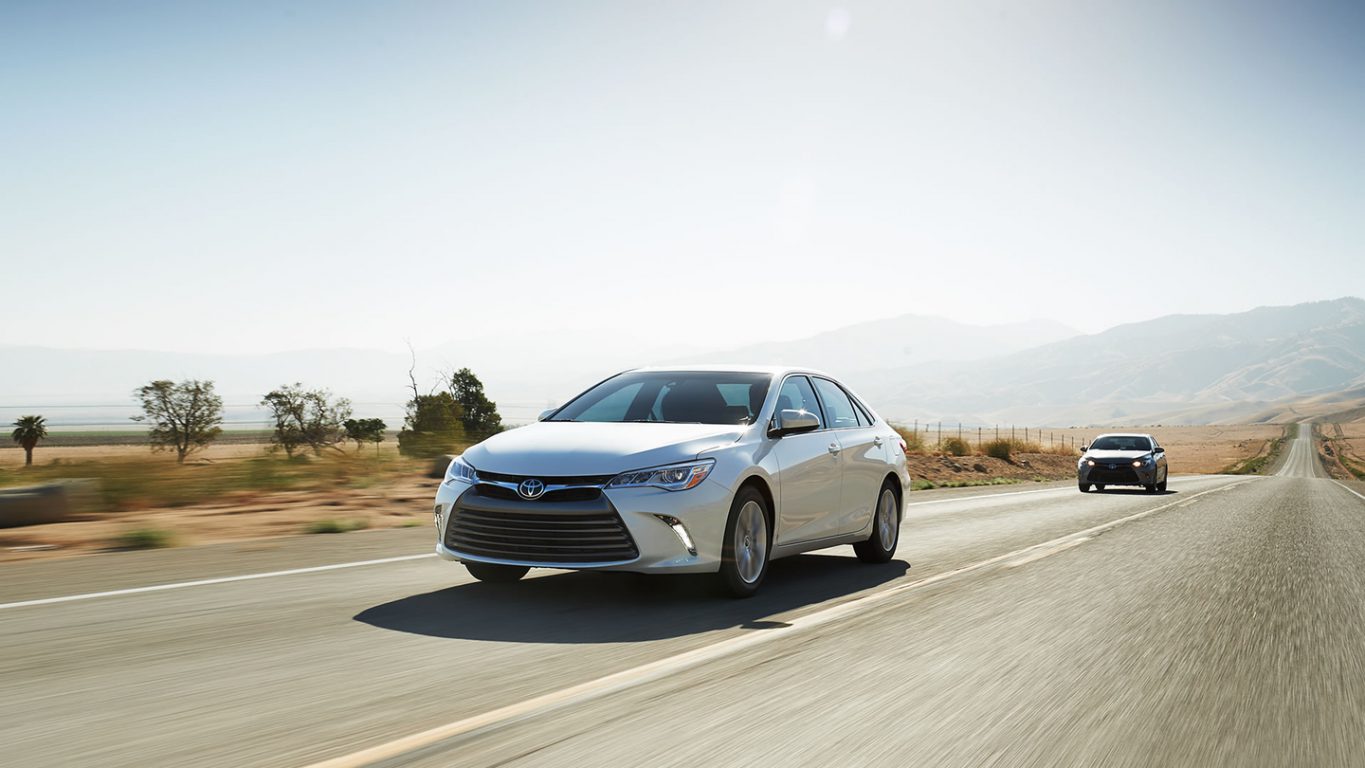
38. Toyota Camry Hybrid LE
> CO2 released per mile: 221 grams
> Fuel efficiency: 40 mpg
> 5-yr fuel savings vs. 2017 industry avg.: $2,500
> Vehicle type: Gasoline
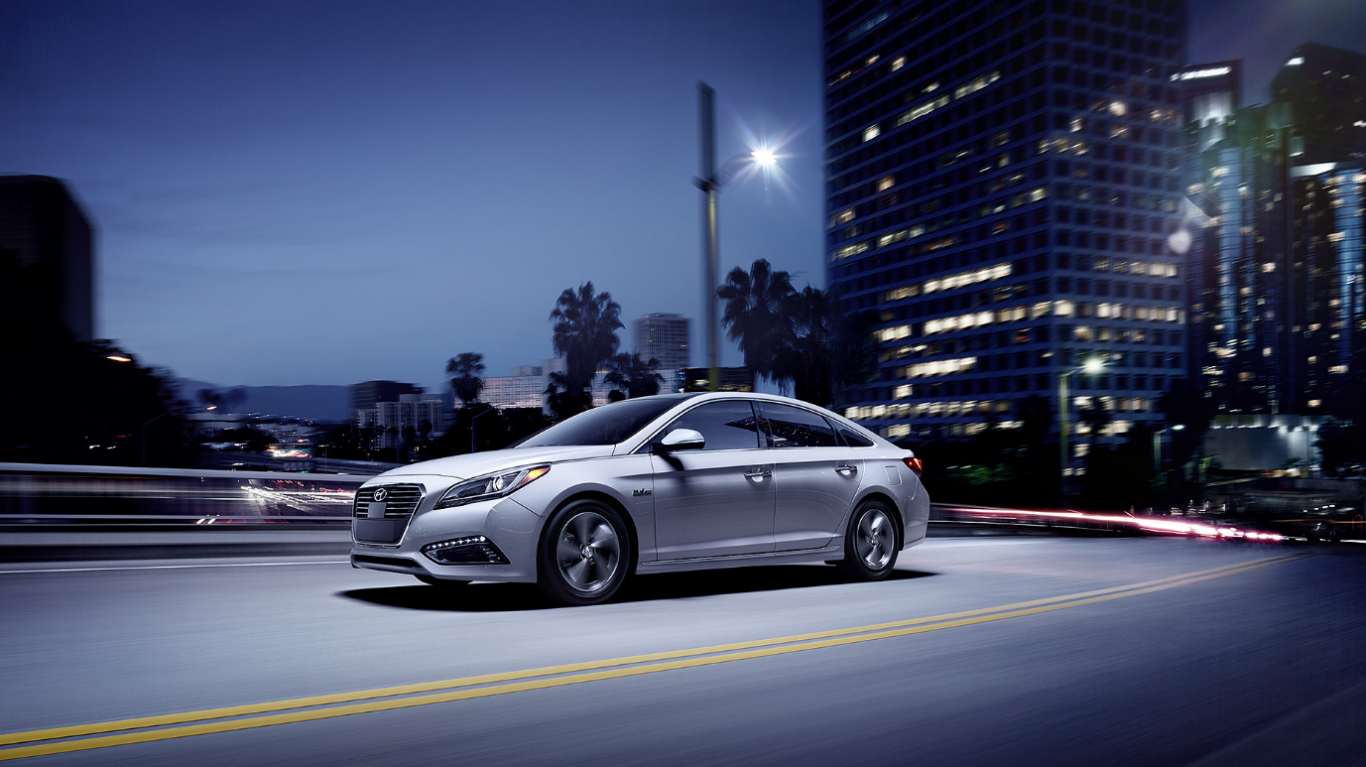
37. Hyundai Sonata Hybrid SE
> CO2 released per mile: 221 grams
> Fuel efficiency: 42 mpg
> 5-yr fuel savings vs. 2017 industry avg.: $2,500
> Vehicle type: Gasoline
[in-text-ad-2]

36. BMW 740e xDrive
> CO2 released per mile: 214 grams
> Fuel efficiency: 33 mpg equivalent
> 5-yr fuel savings vs. 2017 industry avg.: $250
> Vehicle type: Plug-in Hybrid

35. Lexus CT 200h
> CO2 released per mile: 212 grams
> Fuel efficiency: 42 mpg
> 5-yr fuel savings vs. 2017 industry avg.: $2,500
> Vehicle type: Gasoline
[in-text-ad]
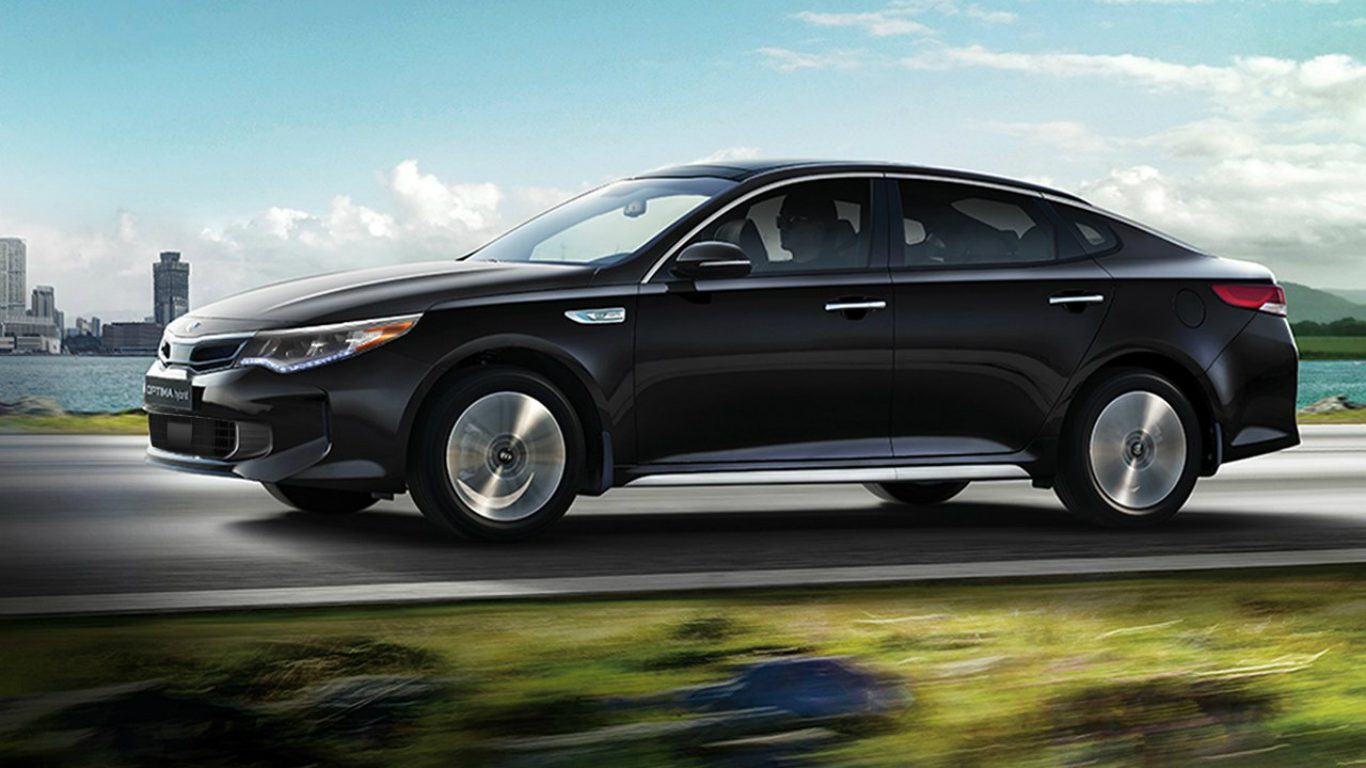
34. Kia Optima Hybrid
> CO2 released per mile: 212 grams
> Fuel efficiency: 42 mpg
> 5-yr fuel savings vs. 2017 industry avg.: $2,500
> Vehicle type: Gasoline
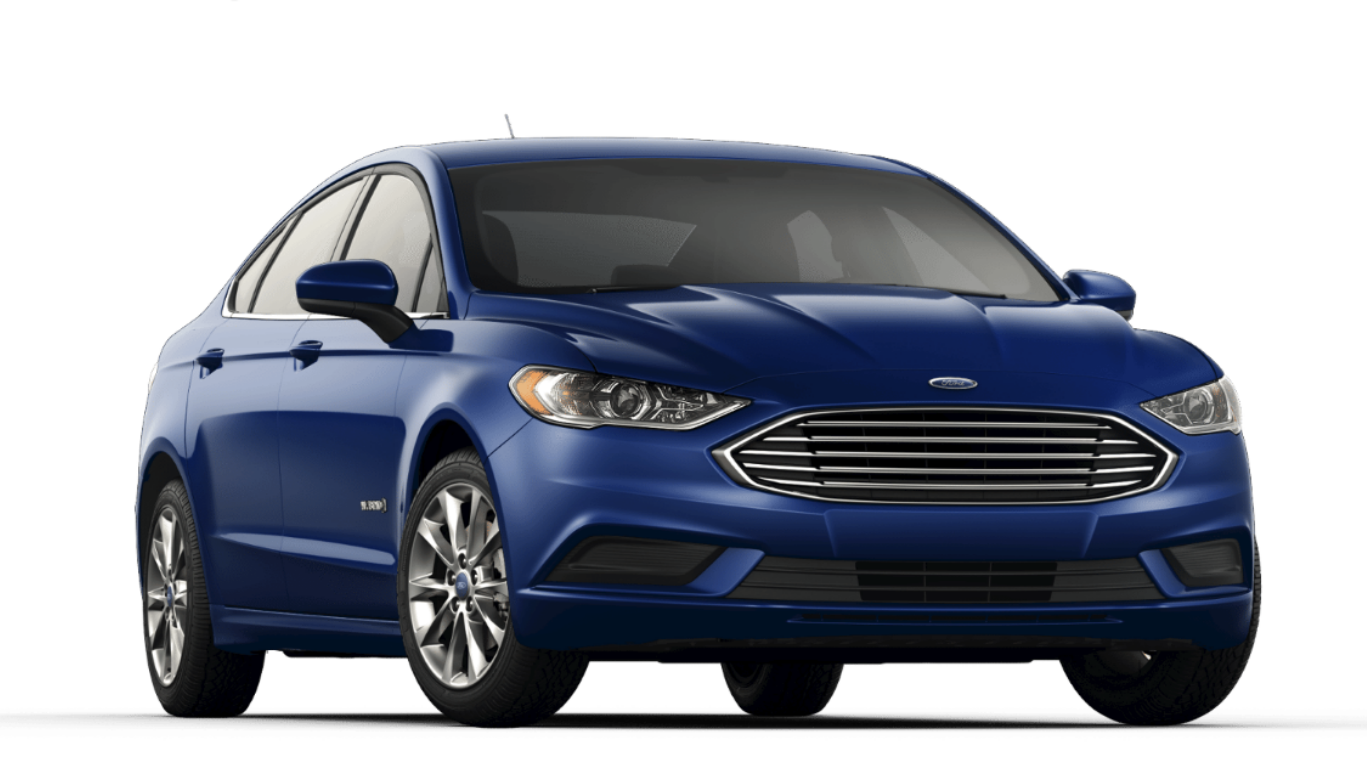
33. Ford Fusion Hybrid FWD
> CO2 released per mile: 210 grams
> Fuel efficiency: 42 mpg
> 5-yr fuel savings vs. 2017 industry avg.: $2,500
> Vehicle type: Gasoline
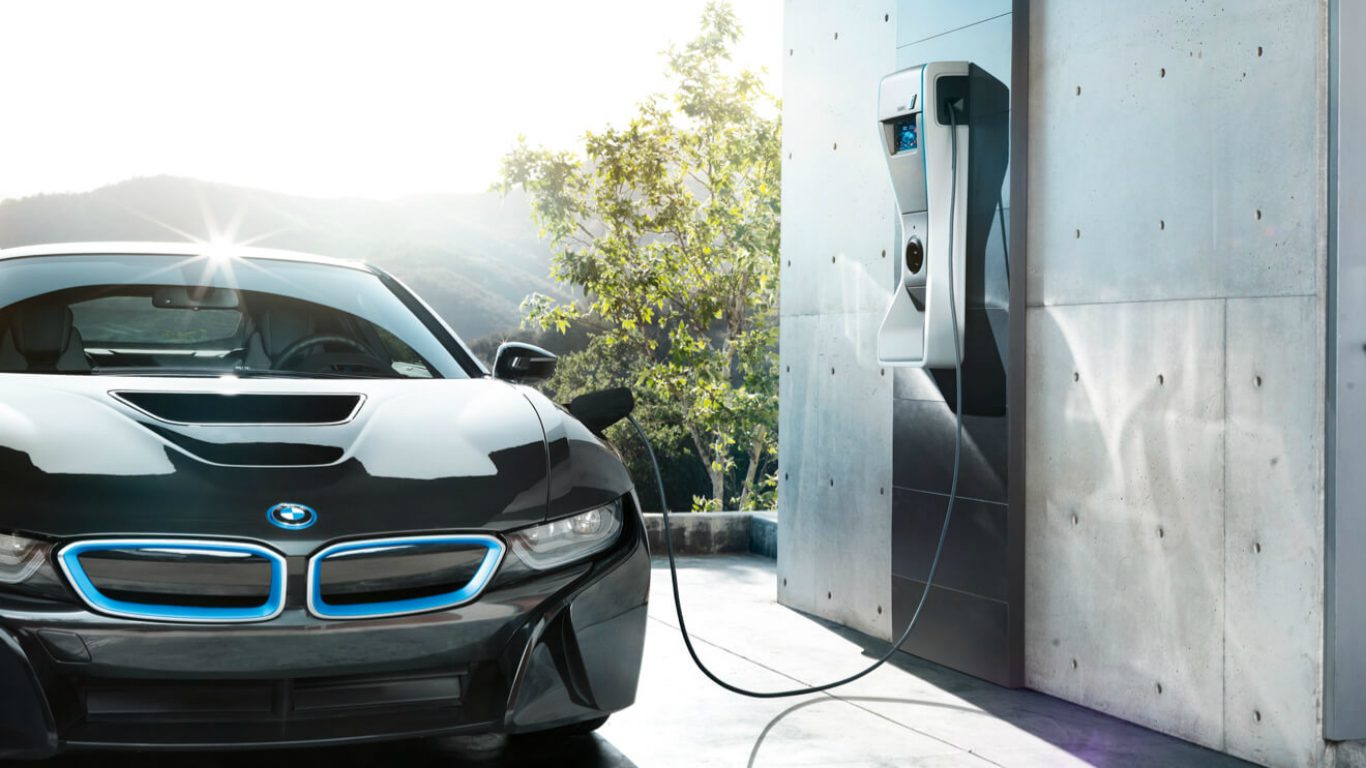
32. BMW i8
> CO2 released per mile: 199 grams
> Fuel efficiency: 37 mpg equivalent
> 5-yr fuel savings vs. 2017 industry avg.: $750
> Vehicle type: Plug-in Hybrid
[in-text-ad-2]
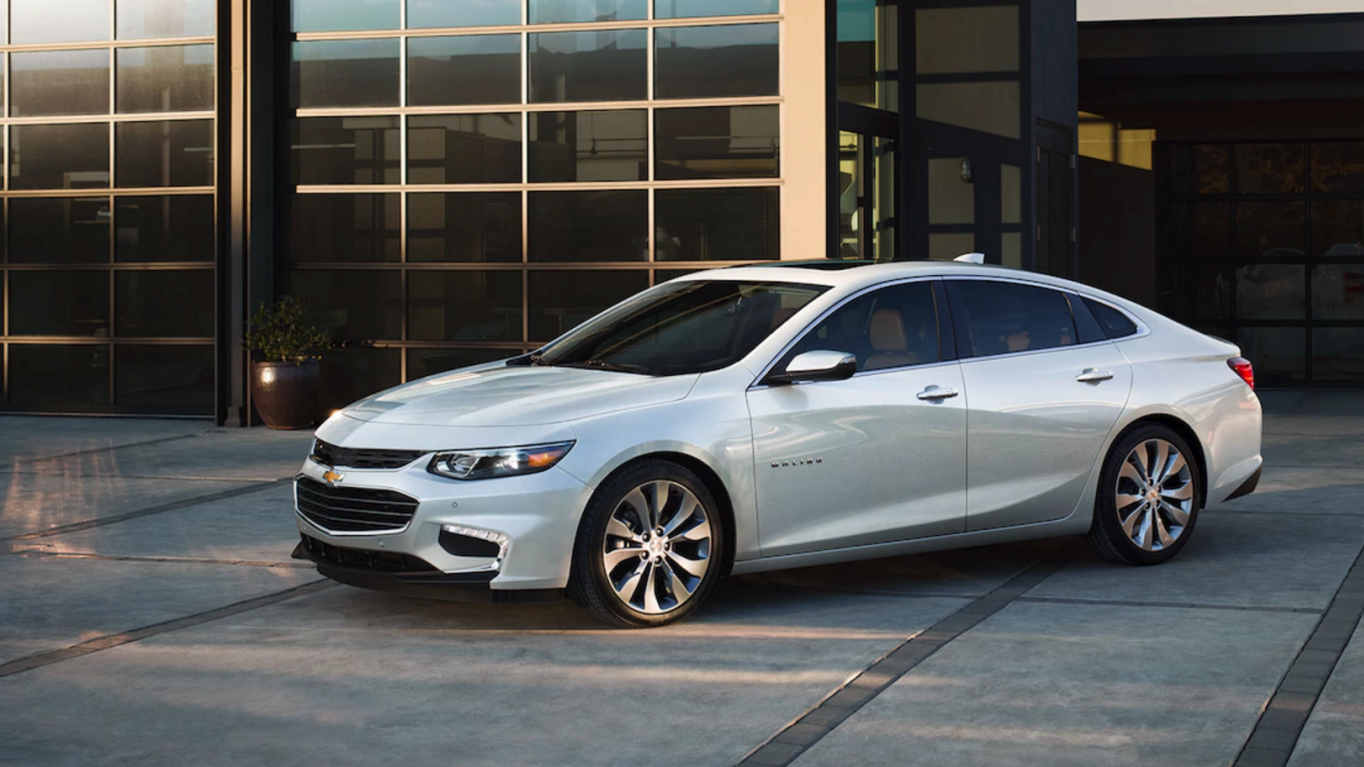
31. Chevrolet Malibu
> CO2 released per mile: 194 grams
> Fuel efficiency: 46 mpg
> 5-yr fuel savings vs. 2017 industry avg.: $3,000
> Vehicle type: Gasoline
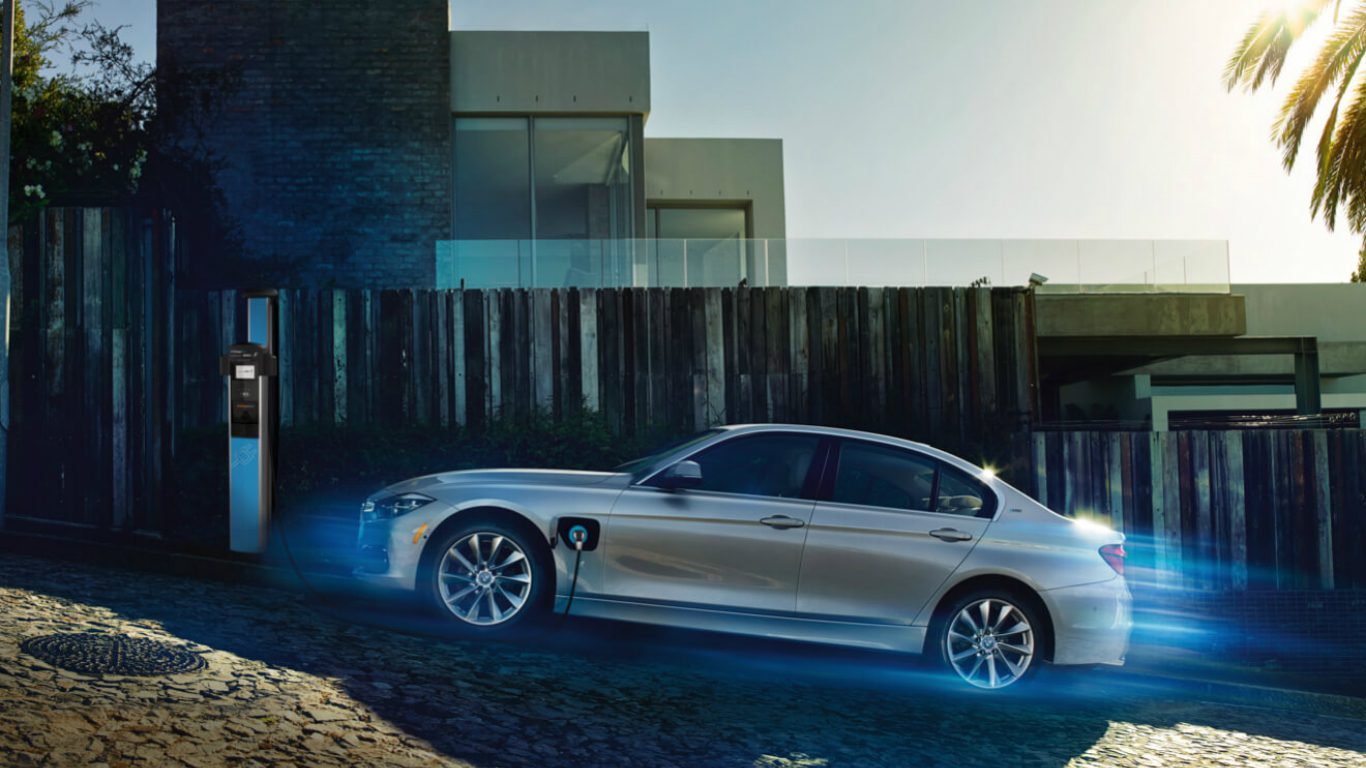
30. BMW 330e
> CO2 released per mile: 189 grams
> Fuel efficiency: 38 mpg equivalent
> 5-yr fuel savings vs. 2017 industry avg.: $1,000
> Vehicle type: Plug-in Hybrid
[in-text-ad]
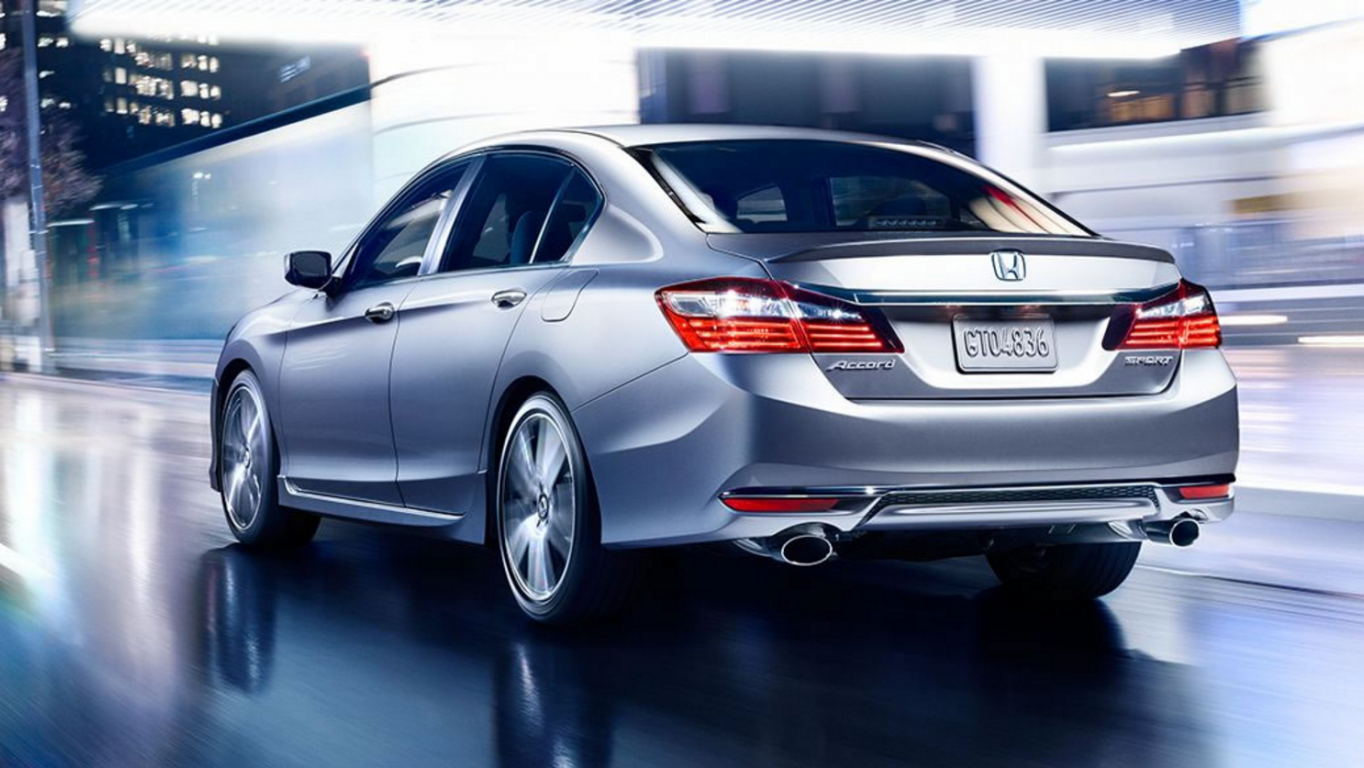
29. Honda Accord
> CO2 released per mile: 183 grams
> Fuel efficiency: 48 mpg
> 5-yr fuel savings vs. 2017 industry avg.: $3,250
> Vehicle type: Gasoline
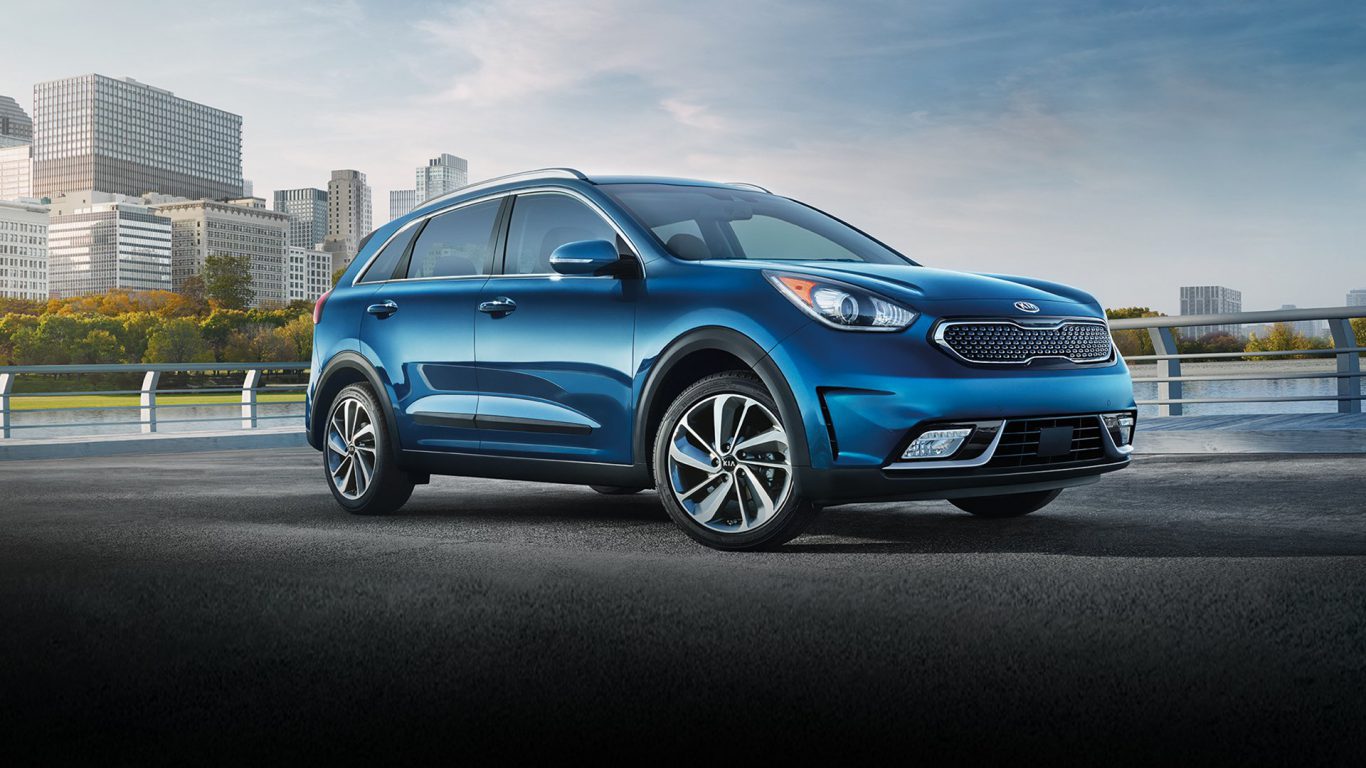
28. Kia Niro FE
> CO2 released per mile: 177 grams
> Fuel efficiency: 50 mpg
> 5-yr fuel savings vs. 2017 industry avg.: $3,250
> Vehicle type: Gasoline
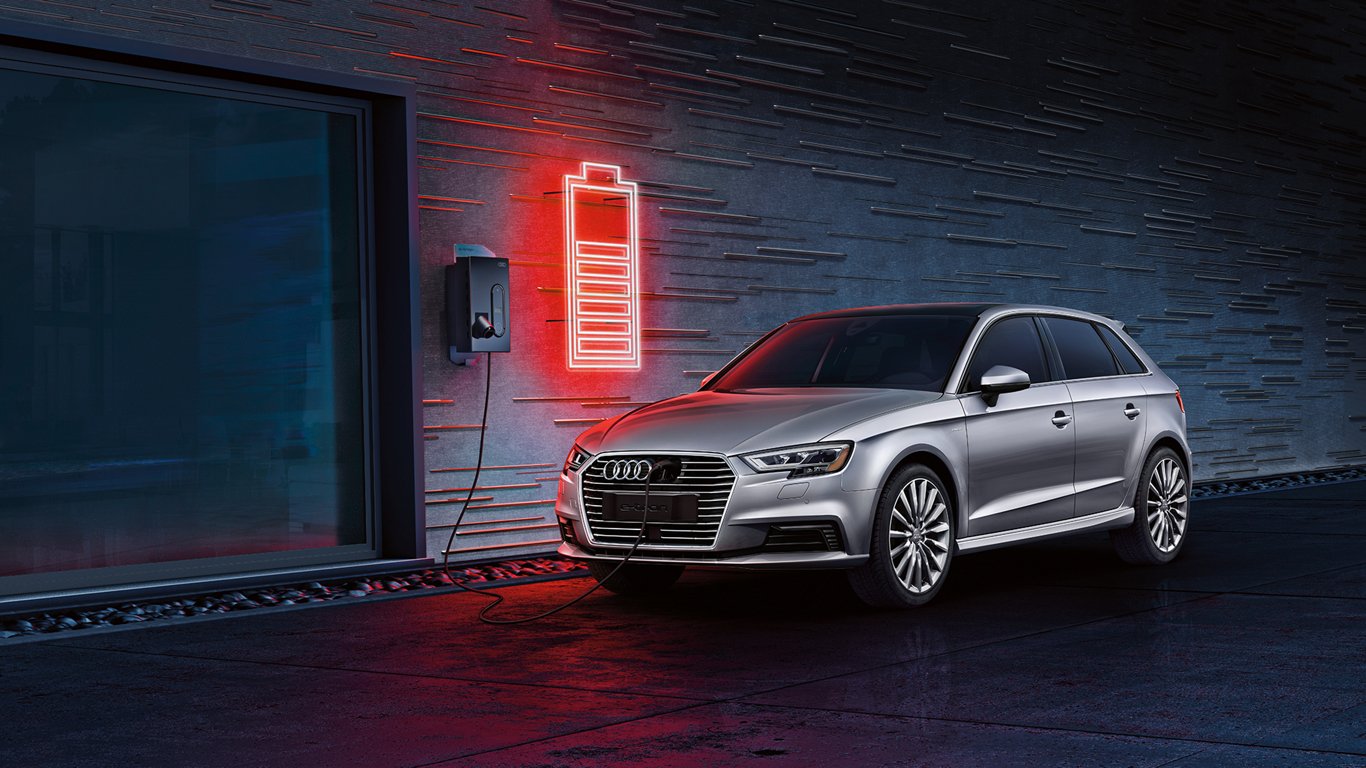
27. Audi A3 e-tron
> CO2 released per mile: 158 grams
> Fuel efficiency: 44 mpg equivalent
> 5-yr fuel savings vs. 2017 industry avg.: $1,750
> Vehicle type: Plug-in Hybrid
[in-text-ad-2]
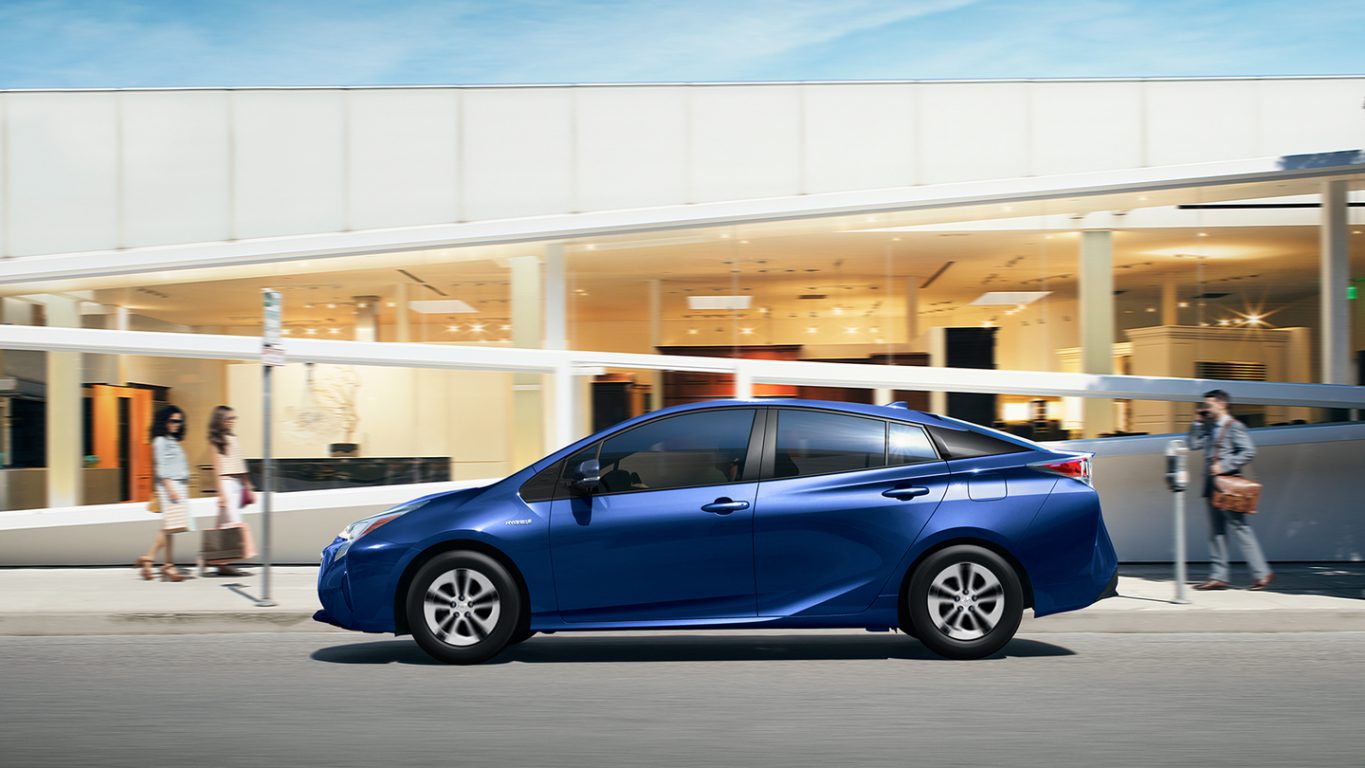
26. Toyota Prius Eco
> CO2 released per mile: 158 grams
> Fuel efficiency: 56 mpg
> 5-yr fuel savings vs. 2017 industry avg.: $3,750
> Vehicle type: Gasoline
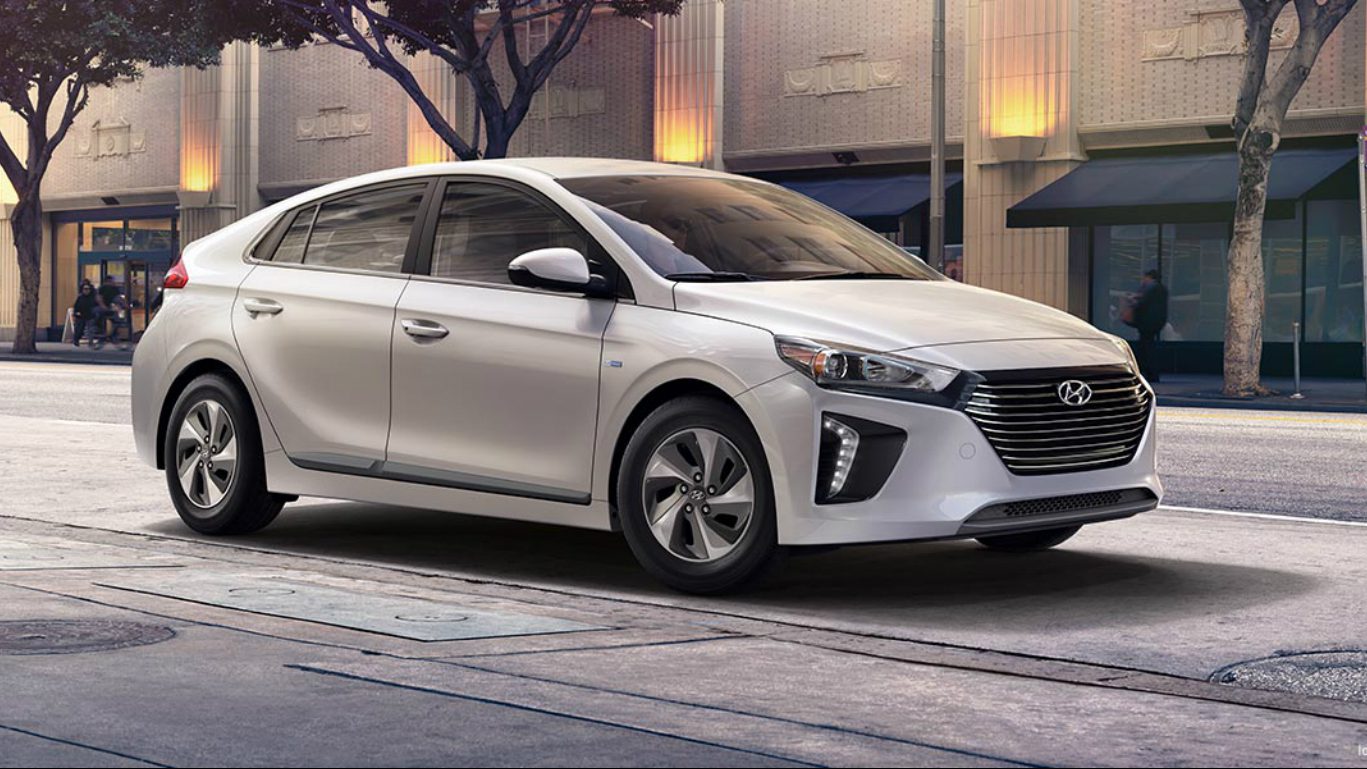
25. Hyundai Ioniq Blue
> CO2 released per mile: 154 grams
> Fuel efficiency: 58 mpg
> 5-yr fuel savings vs. 2017 industry avg.: $3,750
> Vehicle type: Gasoline
[in-text-ad]

24. Ford C-MAX Energi Plug-in Hybrid FWD
> CO2 released per mile: 122 grams
> Fuel efficiency: 54 mpg equivalent
> 5-yr fuel savings vs. 2017 industry avg.: $3,000
> Vehicle type: Plug-in Hybrid
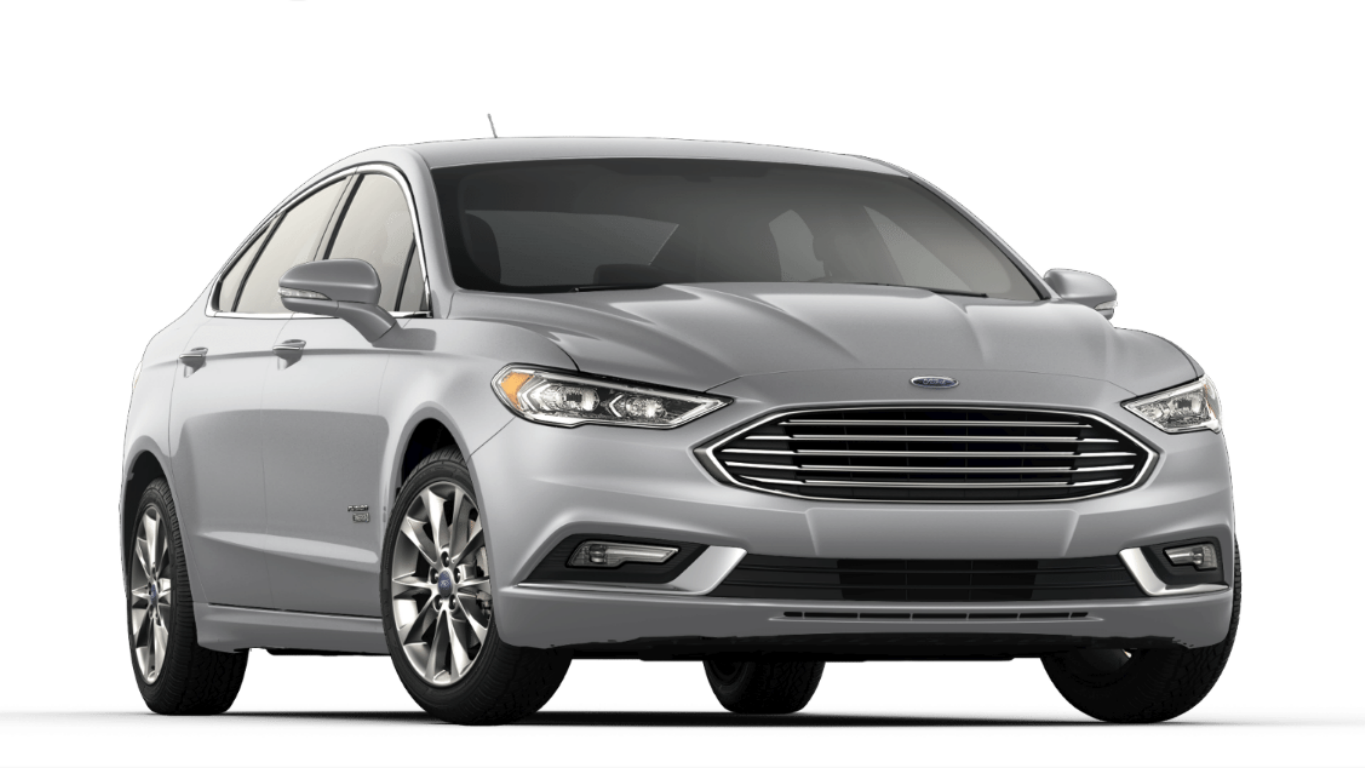
23. Ford Fusion Energi Plug-in Hybrid FWD
> CO2 released per mile: 112 grams
> Fuel efficiency: 57 mpg equivalent
> 5-yr fuel savings vs. 2017 industry avg.: $3,000
> Vehicle type: Plug-in Hybrid
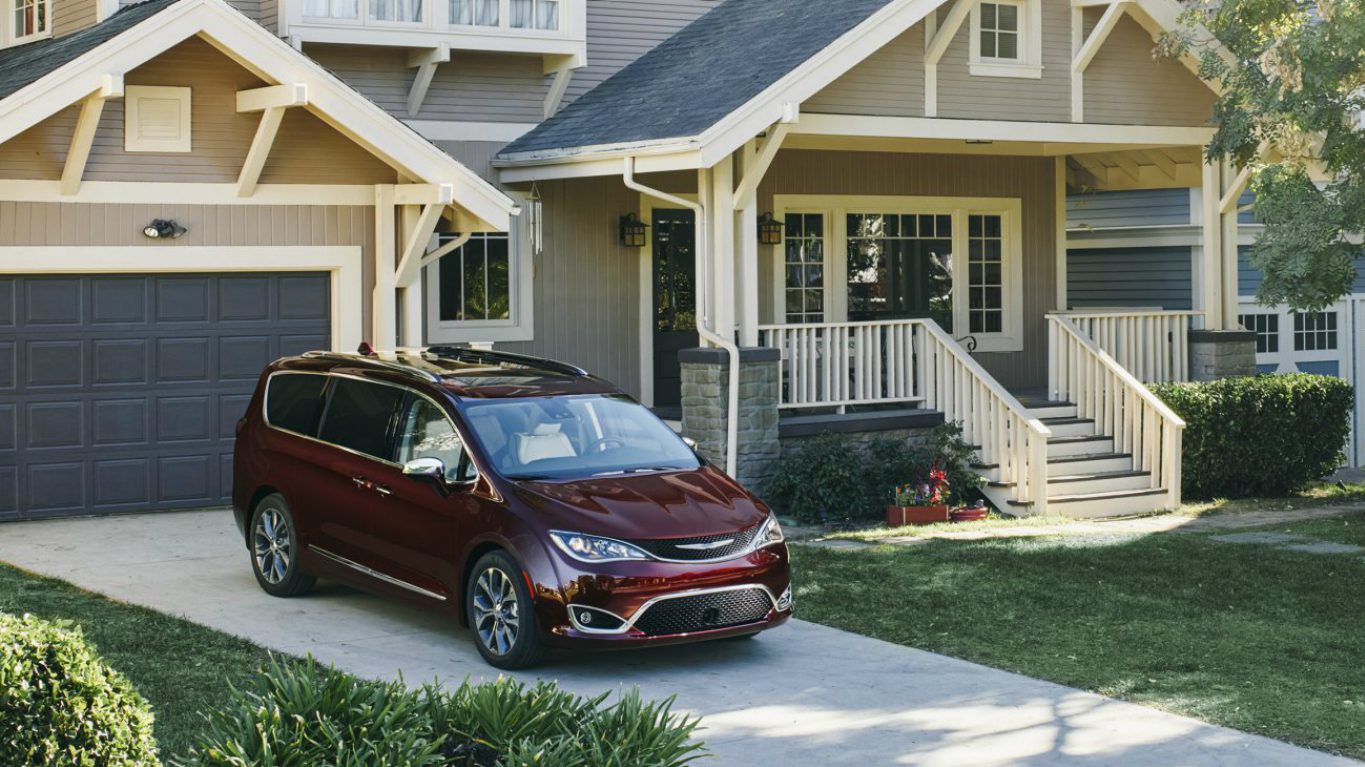
22. Chrysler Pacifica Hybrid
> CO2 released per mile: 106 grams
> Fuel efficiency: 52 mpg equivalent
> 5-yr fuel savings vs. 2017 industry avg.: $2,500
> Vehicle type: Plug-in Hybrid
[in-text-ad-2]
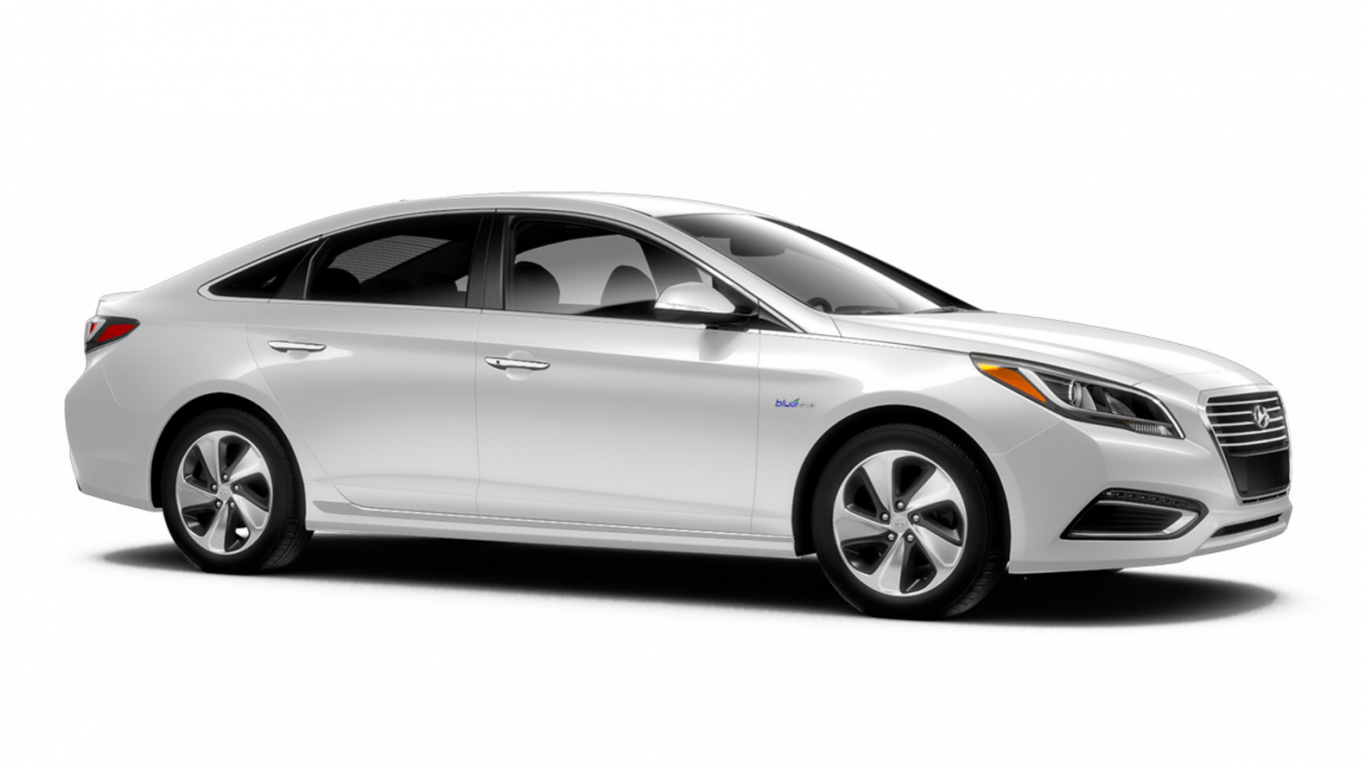
21. Hyundai Sonata Plug-in Hybrid
> CO2 released per mile: 104 grams
> Fuel efficiency: 58 mpg equivalent
> 5-yr fuel savings vs. 2017 industry avg.: $3,000
> Vehicle type: Plug-in Hybrid
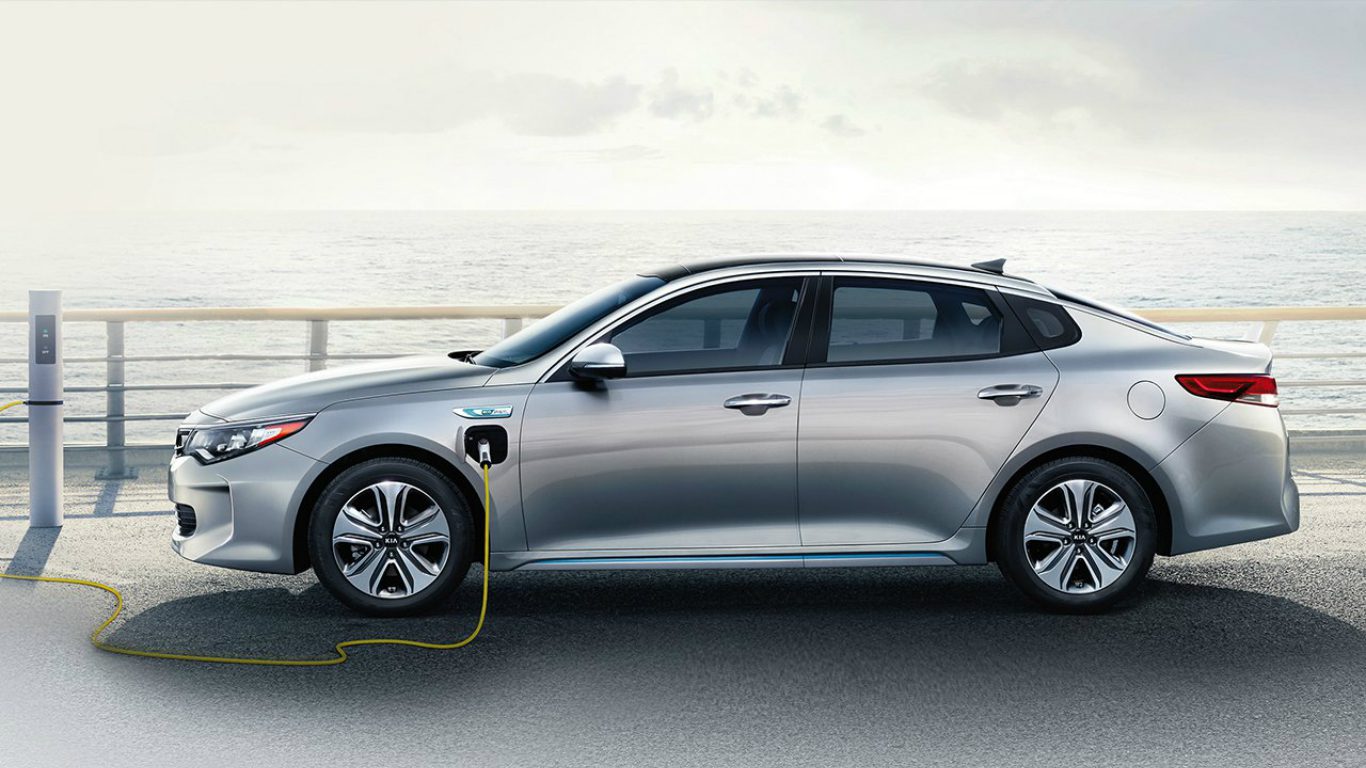
20. Kia Optima Plug-in Hybrid
> CO2 released per mile: 97 grams
> Fuel efficiency: 61 mpg equivalent
> 5-yr fuel savings vs. 2017 industry avg.: $3,250
> Vehicle type: Plug-in Hybrid
[in-text-ad]
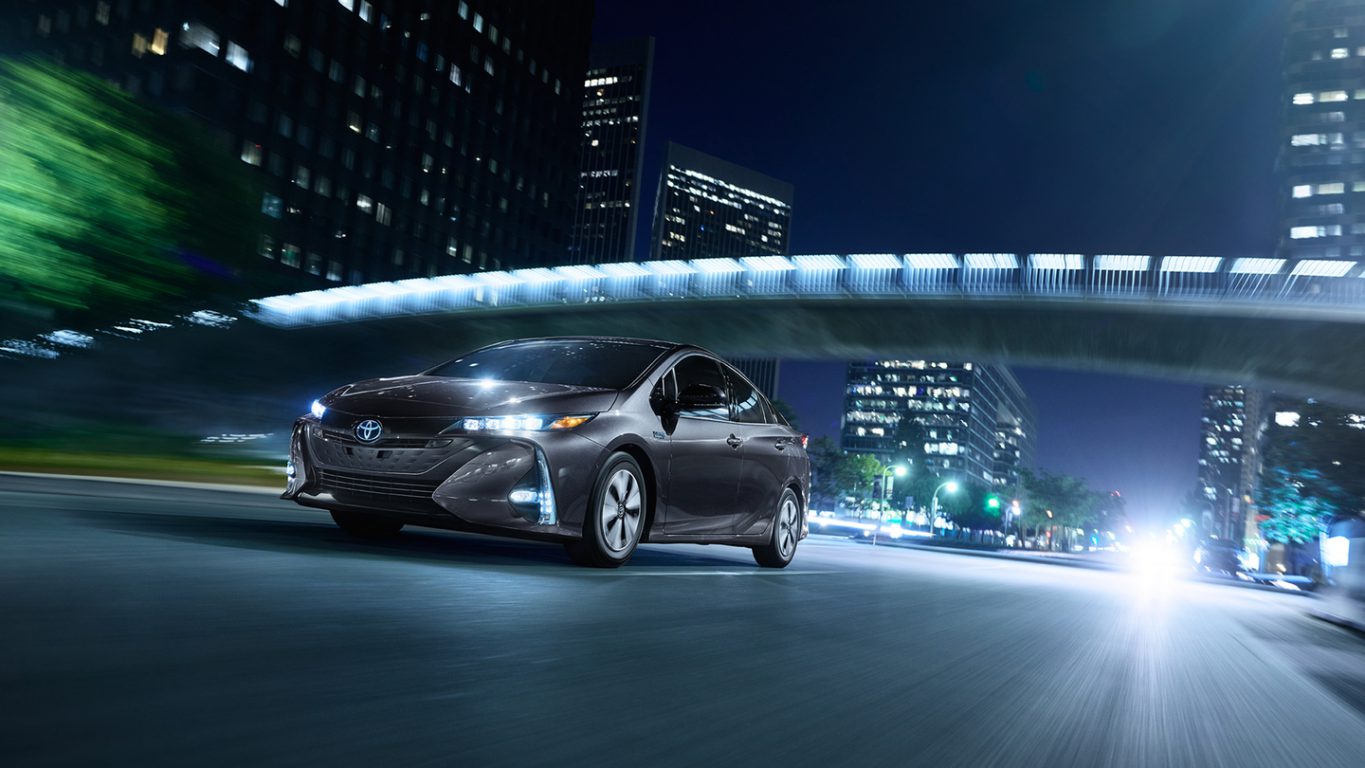
19. Toyota Prius Prime
> CO2 released per mile: 78 grams
> Fuel efficiency: 78 mpg equivalent
> 5-yr fuel savings vs. 2017 industry avg.: $4,000
> Vehicle type: Plug-in Hybrid
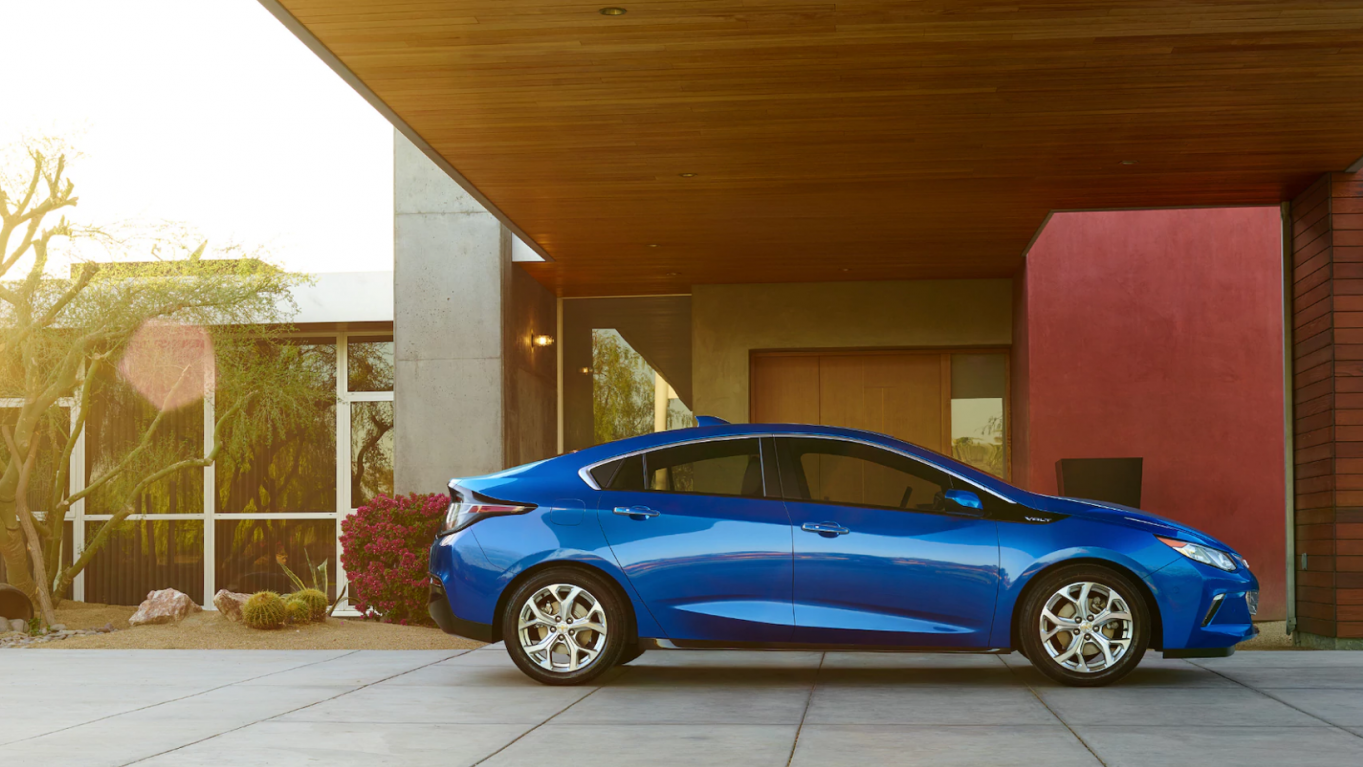
18. Chevrolet Volt
> CO2 released per mile: 51 grams
> Fuel efficiency: 77 mpg equivalent
> 5-yr fuel savings vs. 2017 industry avg.: $3,750
> Vehicle type: Plug-in Hybrid
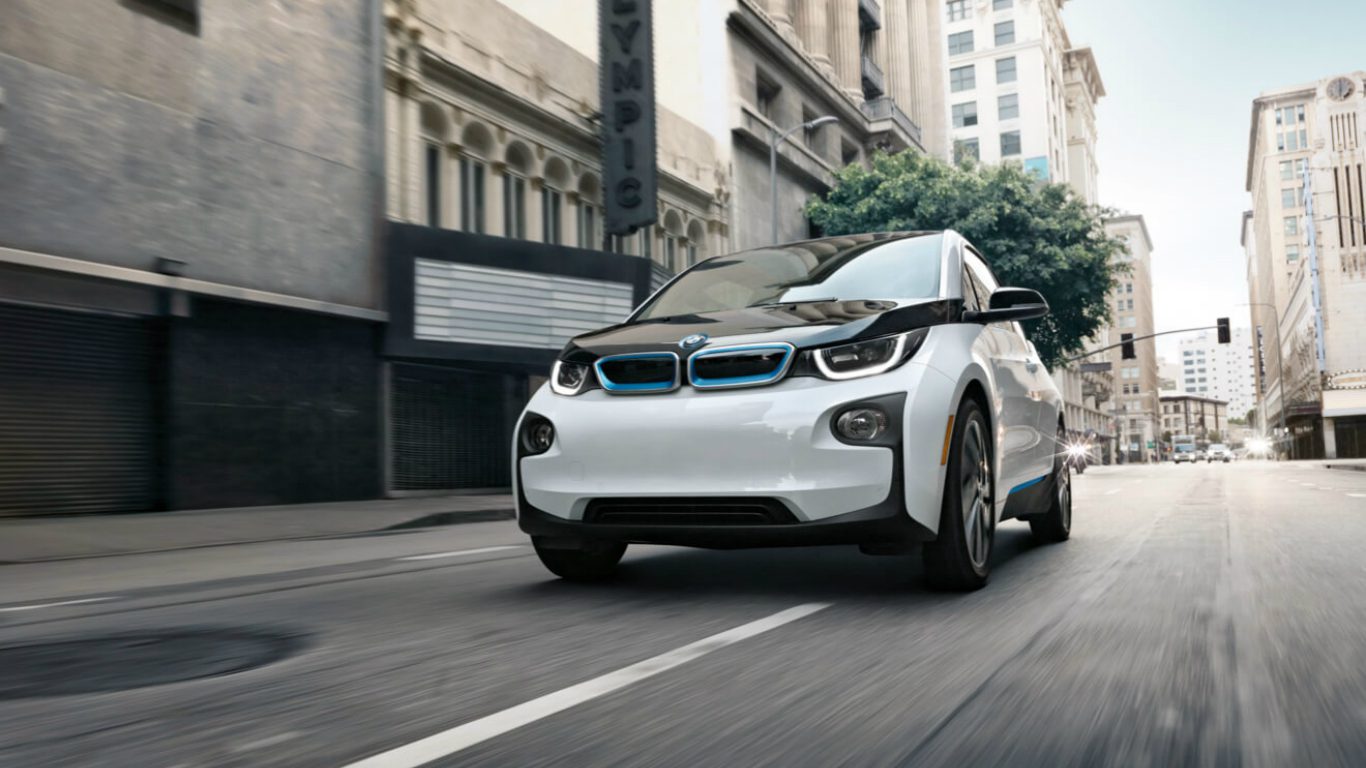
17. BMW i3 REx (94Ah)
> CO2 released per mile: 29 grams
> Fuel efficiency: 88 mpg equivalent
> 5-yr fuel savings vs. 2017 industry avg.: $3,750
> Vehicle type: Plug-in Hybrid
[in-text-ad-2]
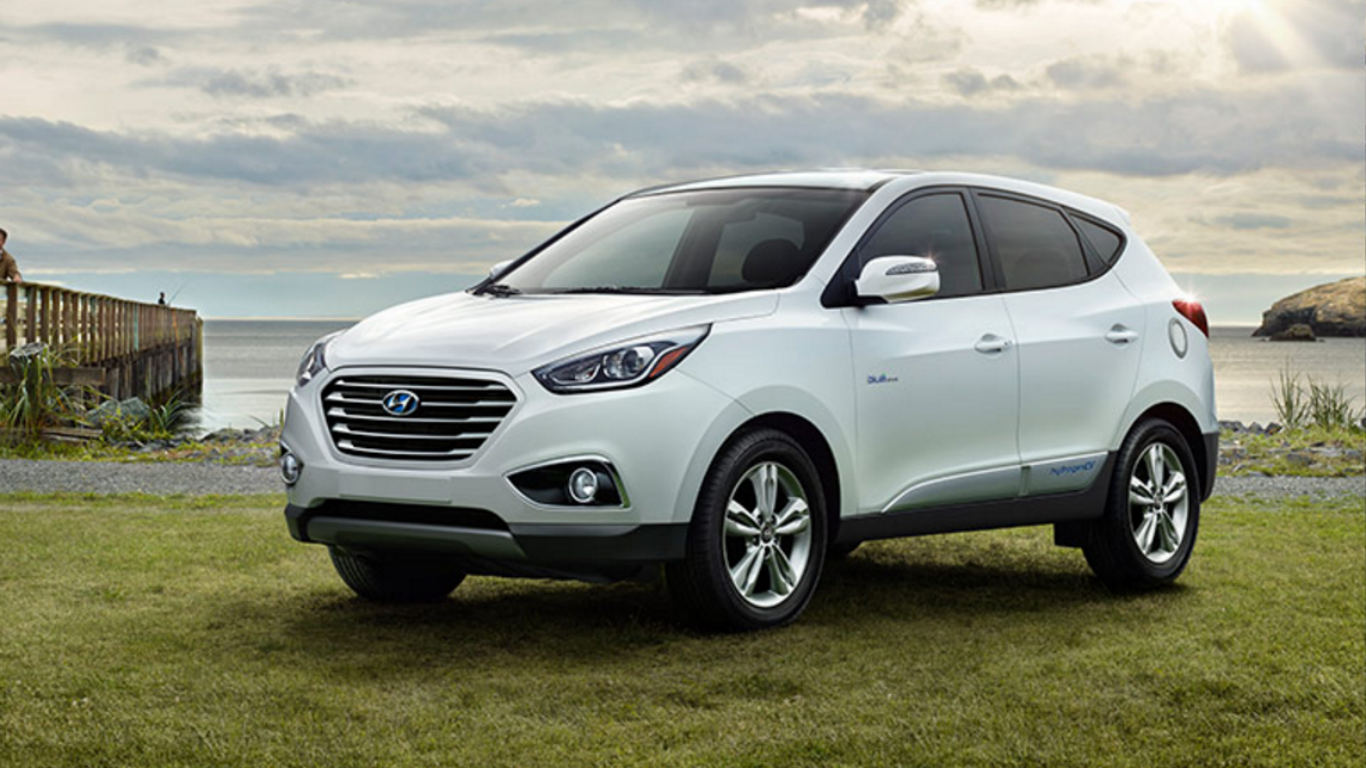
16. Hyundai Tucson Fuel Cell
> CO2 released per mile: 0 grams
> Fuel efficiency: 50 mpg equivalent
> 5-yr fuel savings vs. 2017 industry avg.: -$1,500
> Vehicle type: Fuel Cell
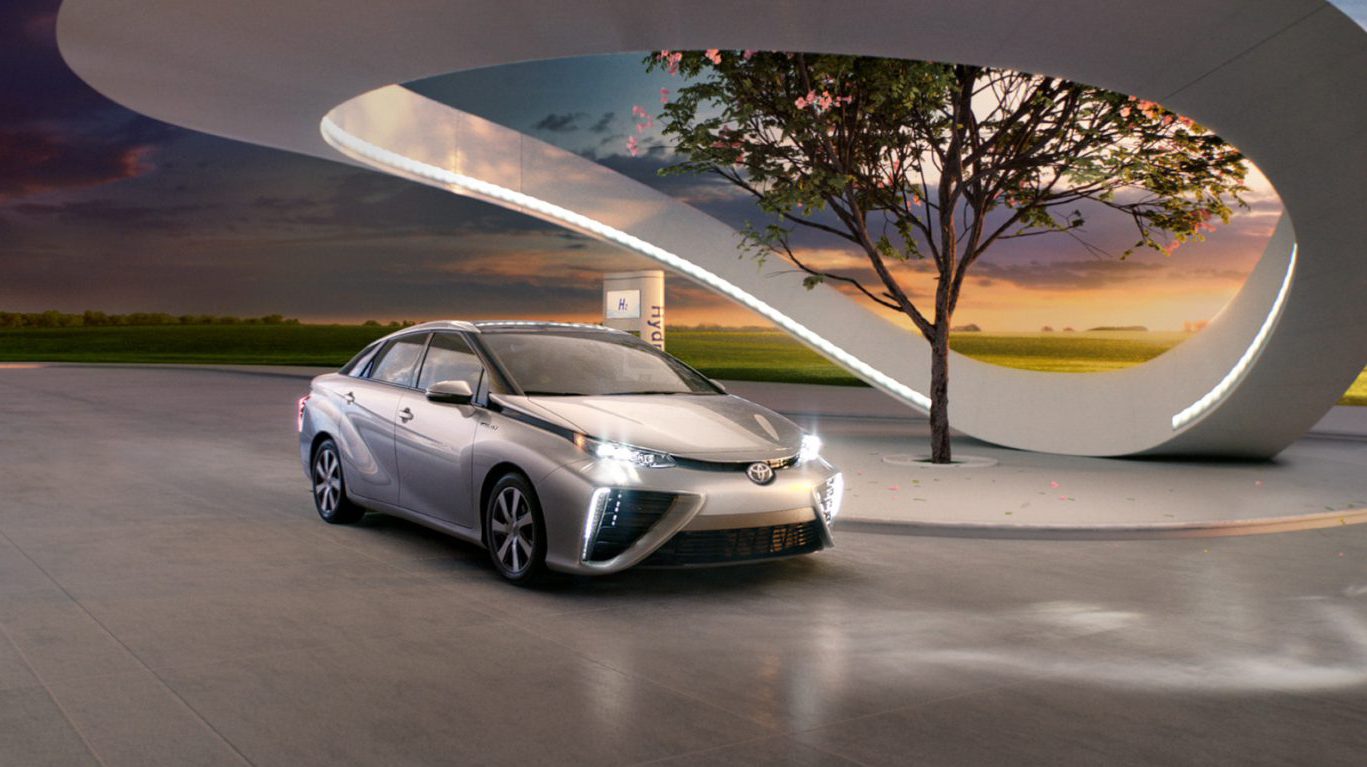
15. Toyota Mirai
> CO2 released per mile: 0 grams
> Fuel efficiency: 67 mpg equivalent
> 5-yr fuel savings vs. 2017 industry avg.: $750
> Vehicle type: Fuel Cell
[in-text-ad]
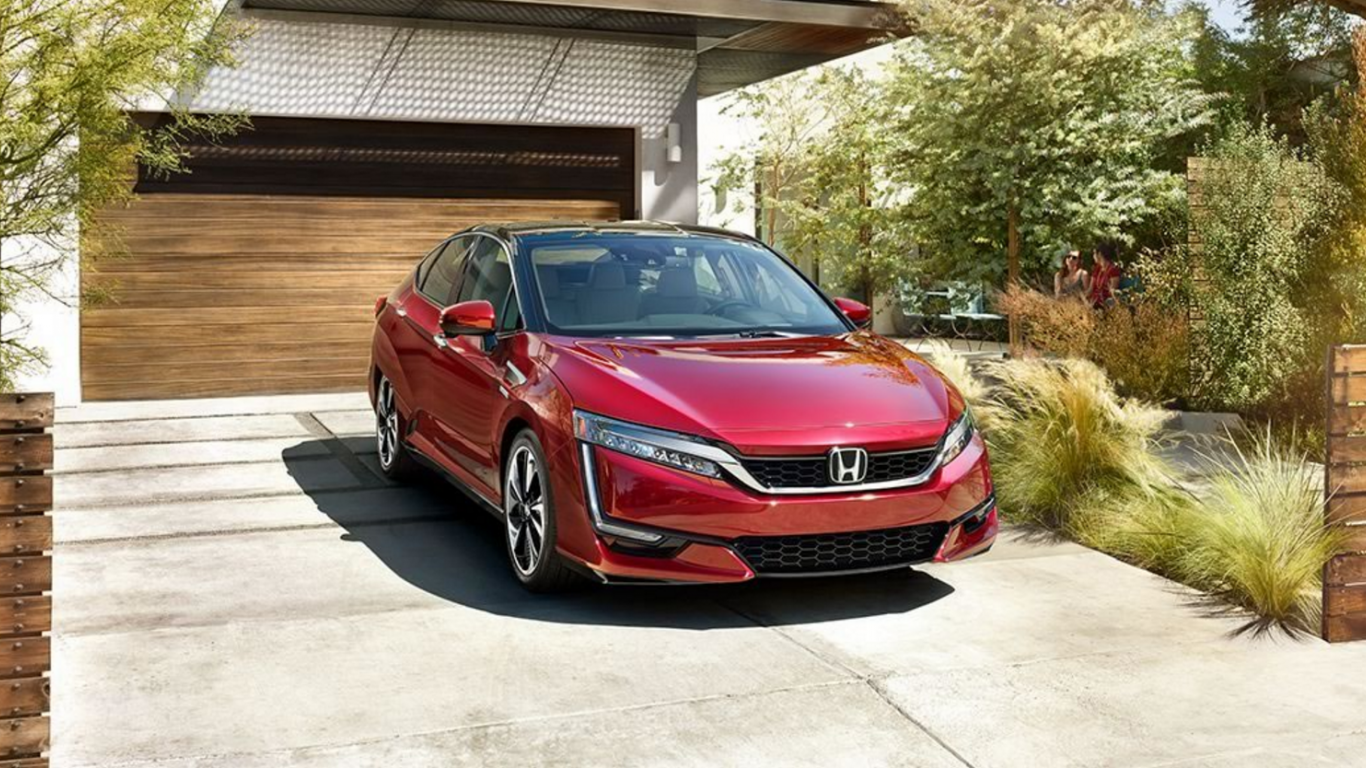
14. Honda Clarity
> CO2 released per mile: 0 grams
> Fuel efficiency: 68 mpg equivalent
> 5-yr fuel savings vs. 2017 industry avg.: $750
> Vehicle type: Fuel Cell

13. BYD e6
> CO2 released per mile: 0 grams
> Fuel efficiency: 72 mpg equivalent
> 5-yr fuel savings vs. 2017 industry avg.: $2,500
> Vehicle type: Electric
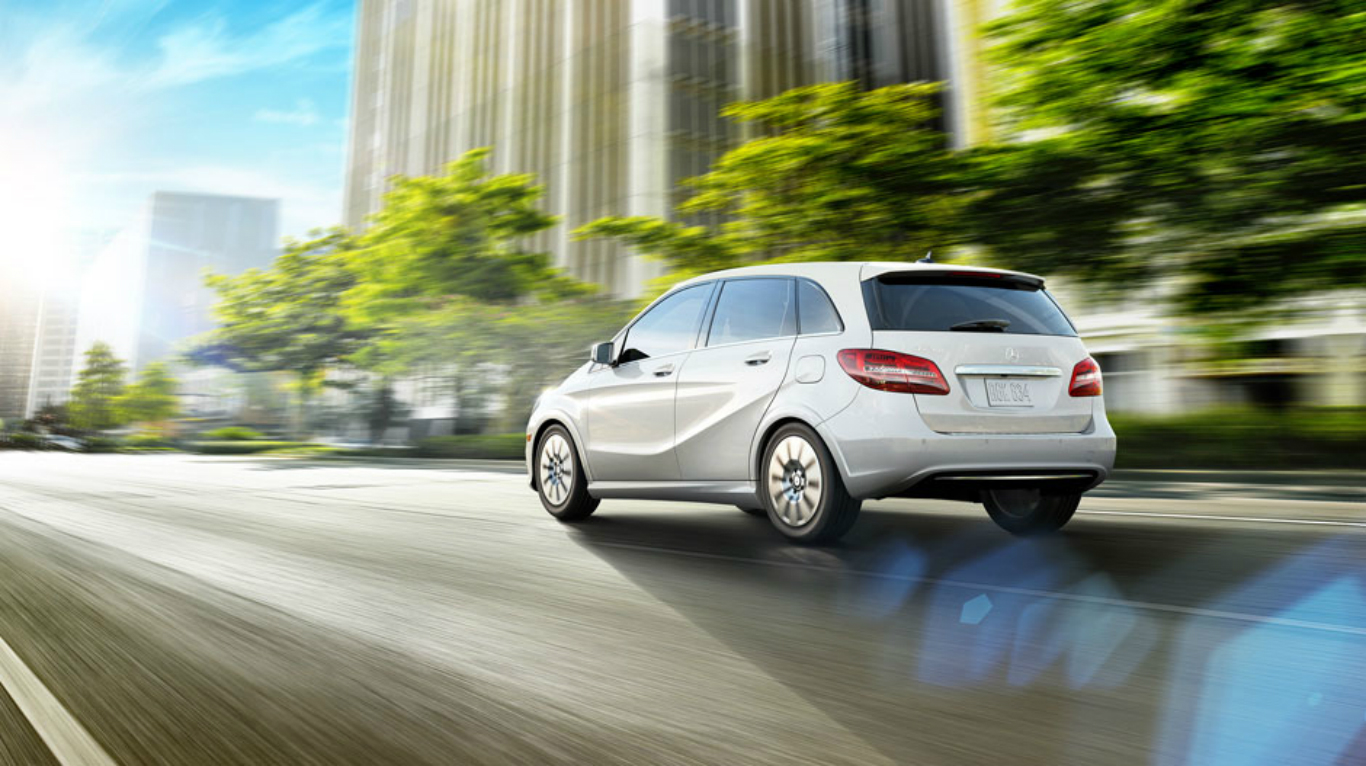
12. Mercedes-Benz B250e
> CO2 released per mile: 0 grams
> Fuel efficiency: 84 mpg equivalent
> 5-yr fuel savings vs. 2017 industry avg.: $3,000
> Vehicle type: Electric
[in-text-ad-2]
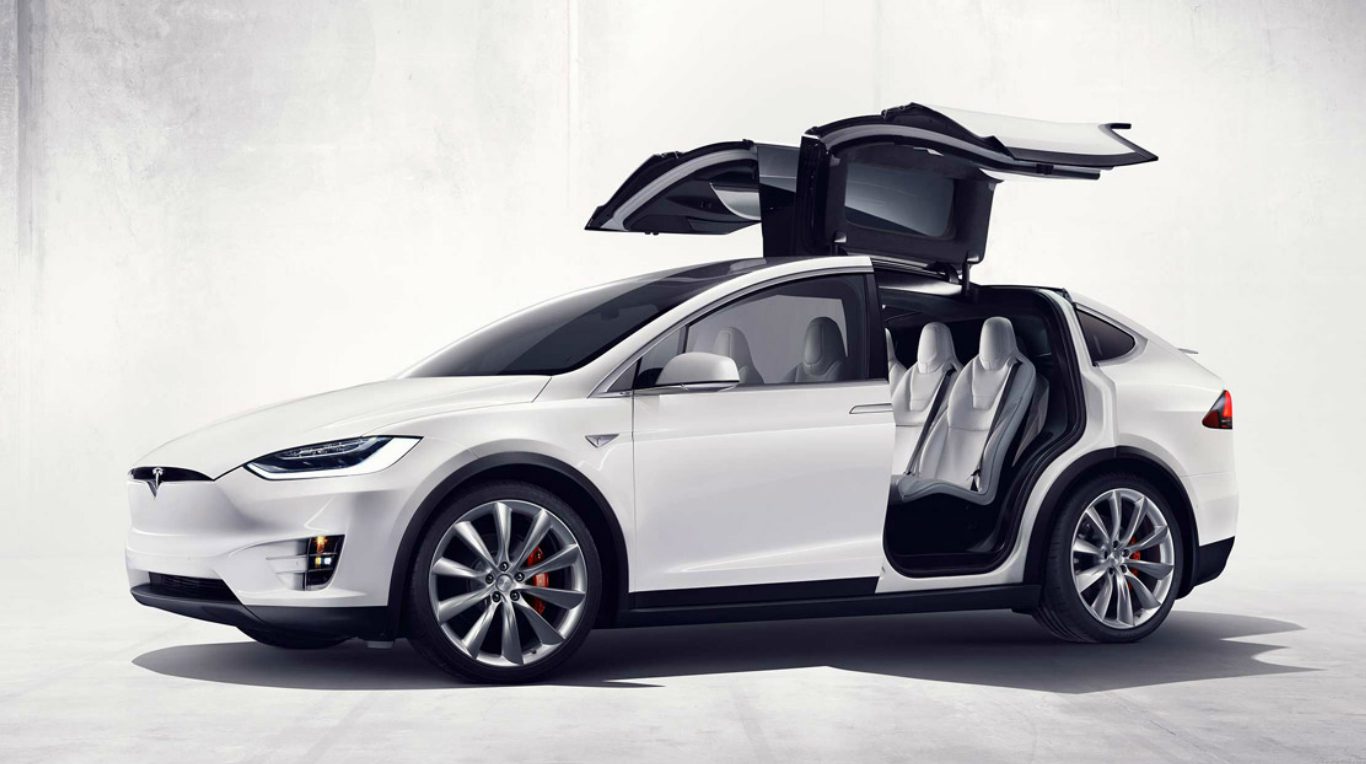
11. Tesla Model X 60D
> CO2 released per mile: 0 grams
> Fuel efficiency: 93 mpg equivalent
> 5-yr fuel savings vs. 2017 industry avg.: $3,500
> Vehicle type: Electric
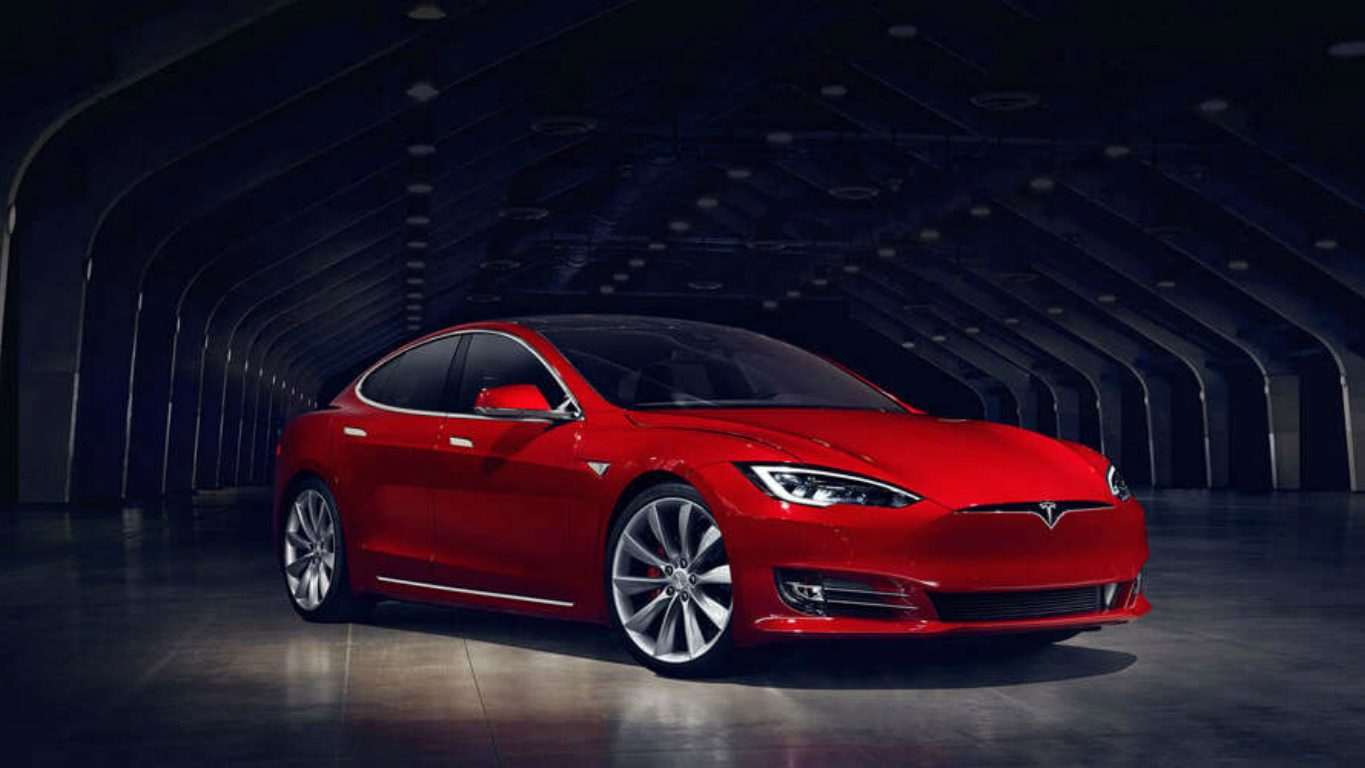
10. Tesla Model S 60D
> CO2 released per mile: 0 grams
> Fuel efficiency: 104 mpg equivalent
> 5-yr fuel savings vs. 2017 industry avg.: $3,750
> Vehicle type: Electric
[in-text-ad]
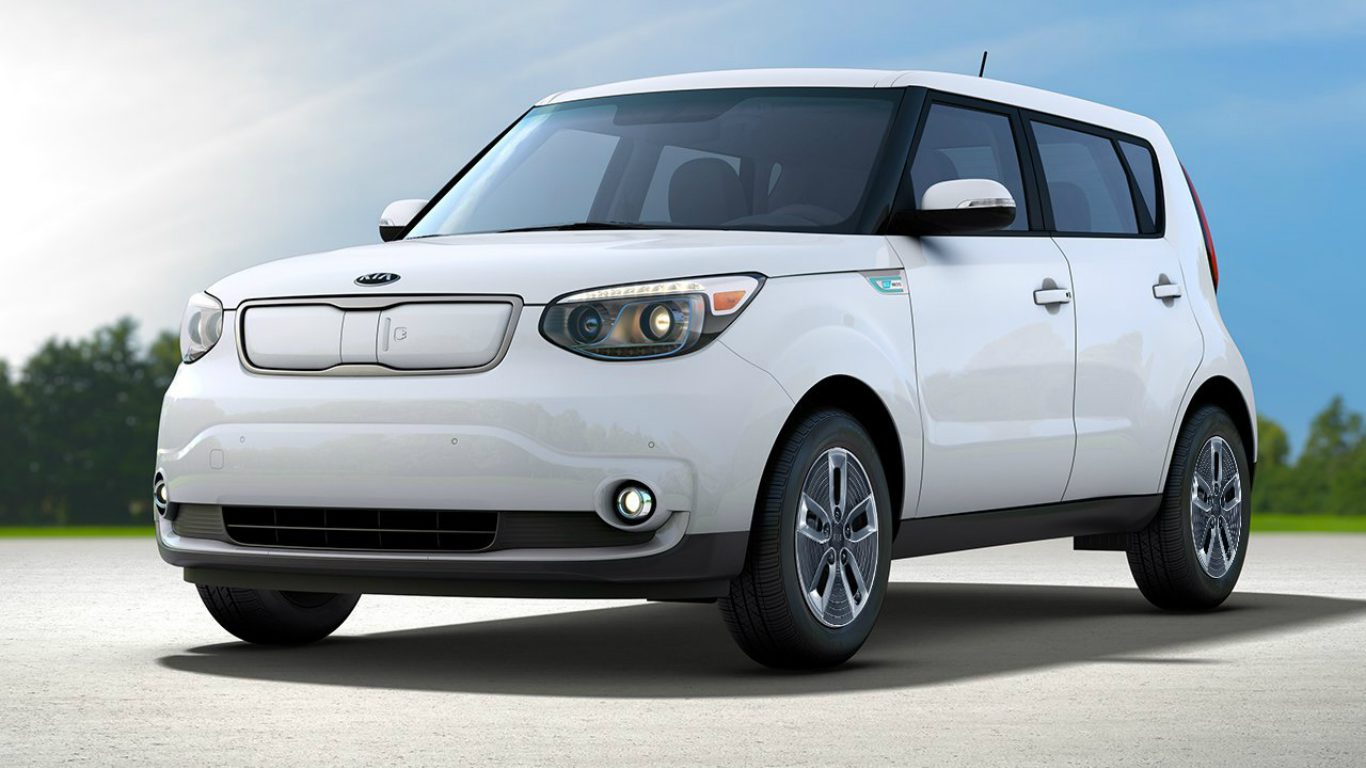
9. Kia Soul Electric
> CO2 released per mile: 0 grams
> Fuel efficiency: 105 mpg equivalent
> 5-yr fuel savings vs. 2017 industry avg.: $4,000
> Vehicle type: Electric
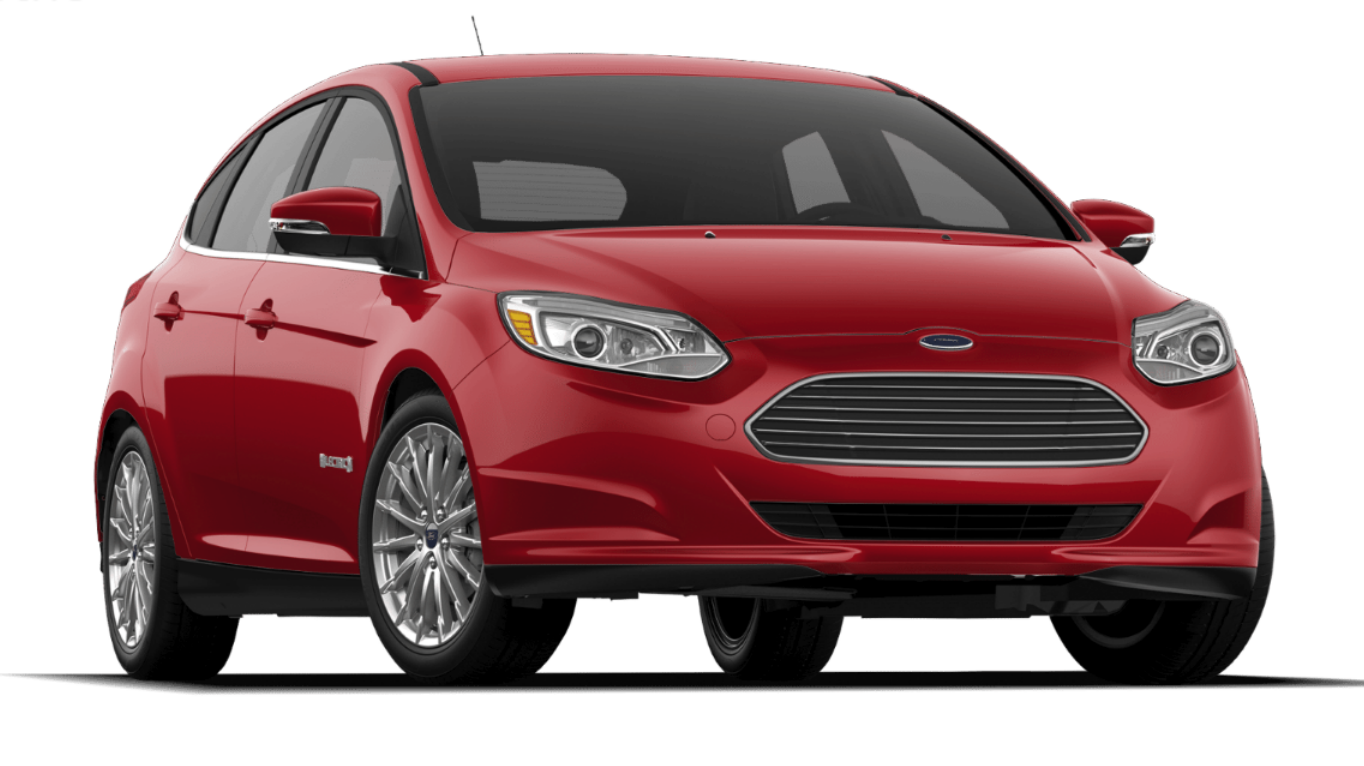
8. Ford Focus Electric FWD
> CO2 released per mile: 0 grams
> Fuel efficiency: 107 mpg equivalent
> 5-yr fuel savings vs. 2017 industry avg.: $4,000
> Vehicle type: Electric
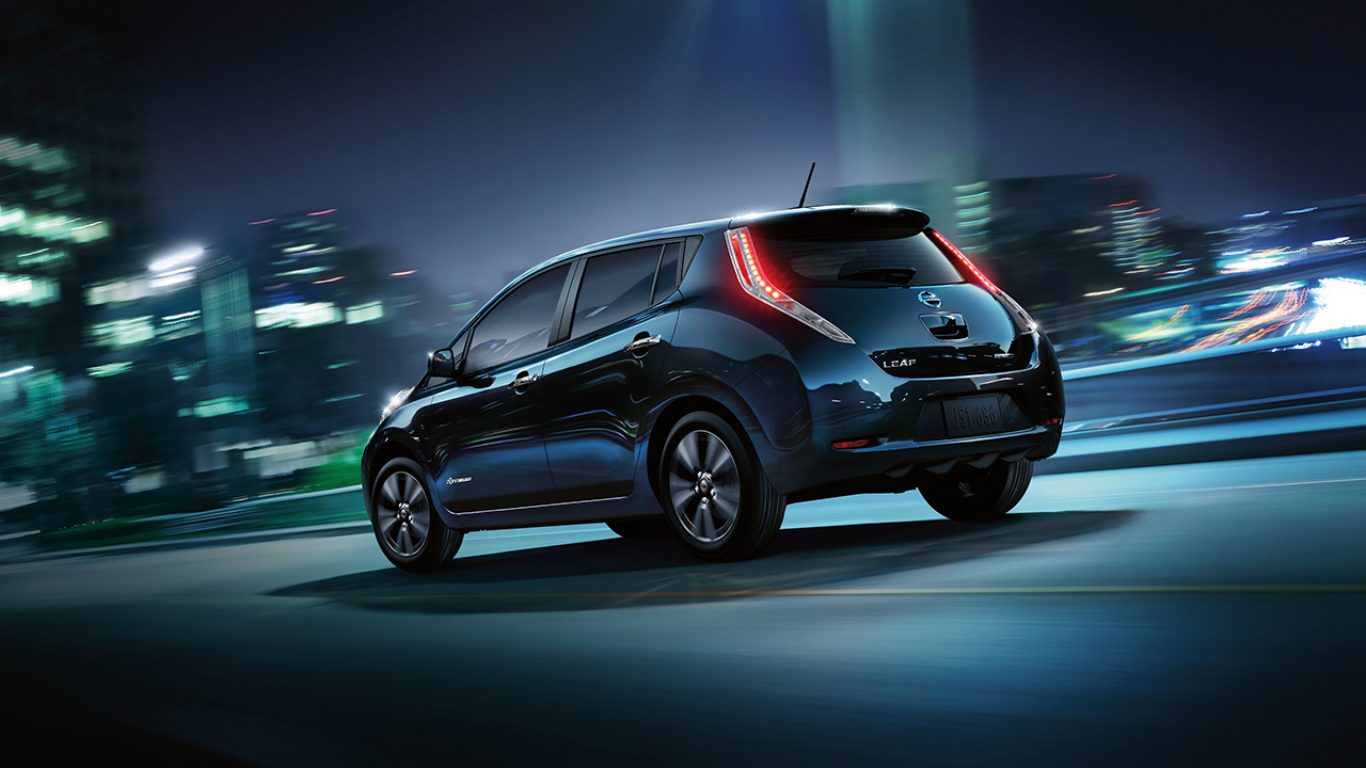
7. Nissan Leaf
> CO2 released per mile: 0 grams
> Fuel efficiency: 112 mpg equivalent
> 5-yr fuel savings vs. 2017 industry avg.: $4,000
> Vehicle type: Electric
[in-text-ad-2]
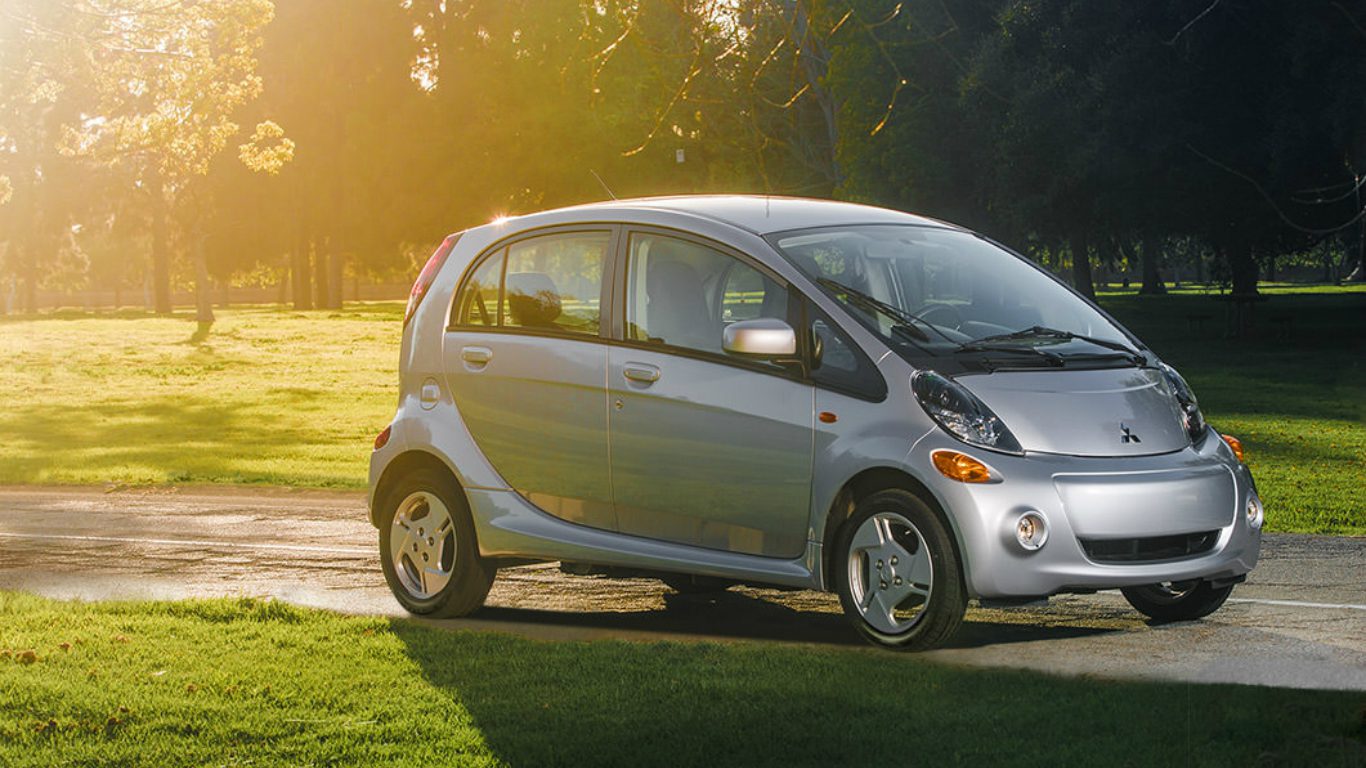
6. Mitsubishi i-MiEV
> CO2 released per mile: 0 grams
> Fuel efficiency: 112 mpg equivalent
> 5-yr fuel savings vs. 2017 industry avg.: $4,000
> Vehicle type: Electric
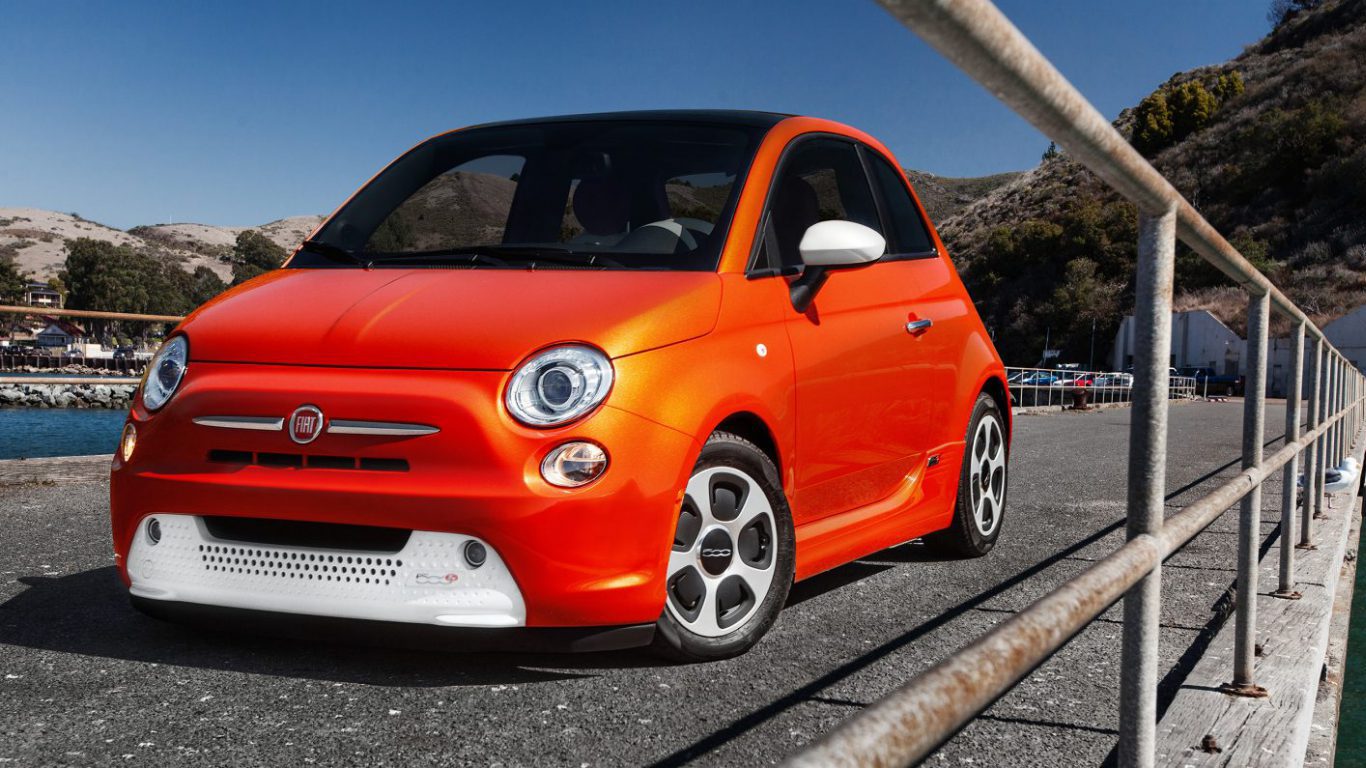
5. Fiat 500e
> CO2 released per mile: 0 grams
> Fuel efficiency: 112 mpg equivalent
> 5-yr fuel savings vs. 2017 industry avg.: $4,000
> Vehicle type: Electric
[in-text-ad]
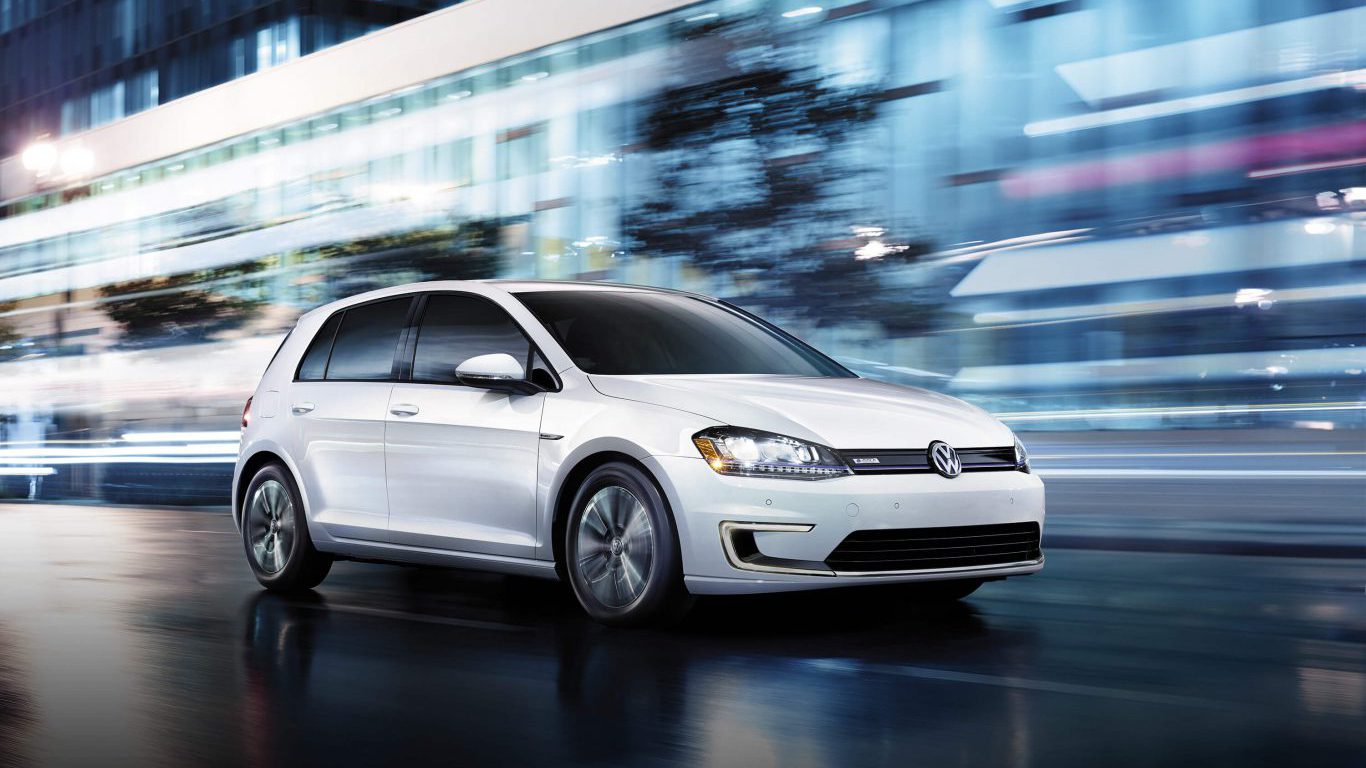
4. Volkswagen e-Golf
> CO2 released per mile: 0 grams
> Fuel efficiency: 119 mpg equivalent
> 5-yr fuel savings vs. 2017 industry avg.: $4,250
> Vehicle type: Electric
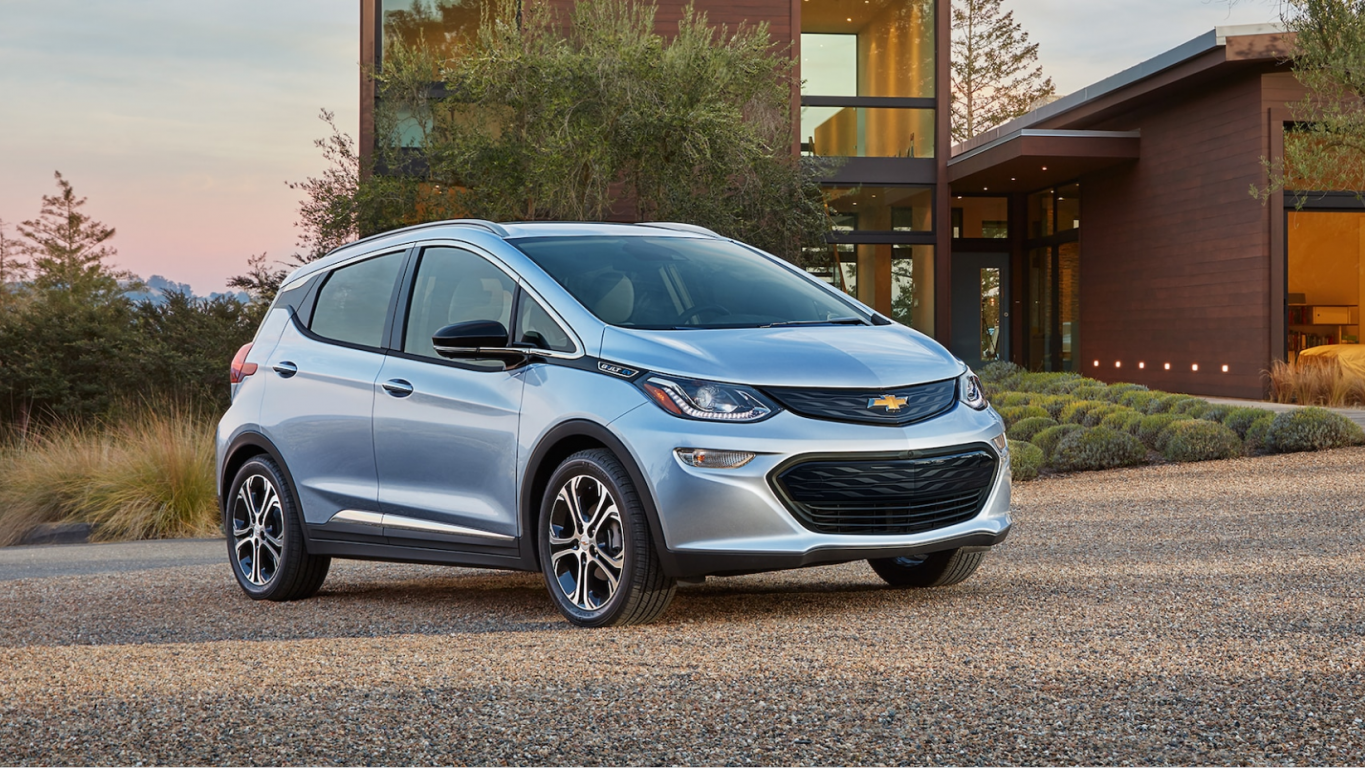
3. Chevrolet Bolt EV
> CO2 released per mile: 0 grams
> Fuel efficiency: 119 mpg equivalent
> 5-yr fuel savings vs. 2017 industry avg.: $4,250
> Vehicle type: Electric

2. BMW i3 BEV (60Ah)
> CO2 released per mile: 0 grams
> Fuel efficiency: 124 mpg equivalent
> 5-yr fuel savings vs. 2017 industry avg.: $4,250
> Vehicle type: Electric
[in-text-ad-2]
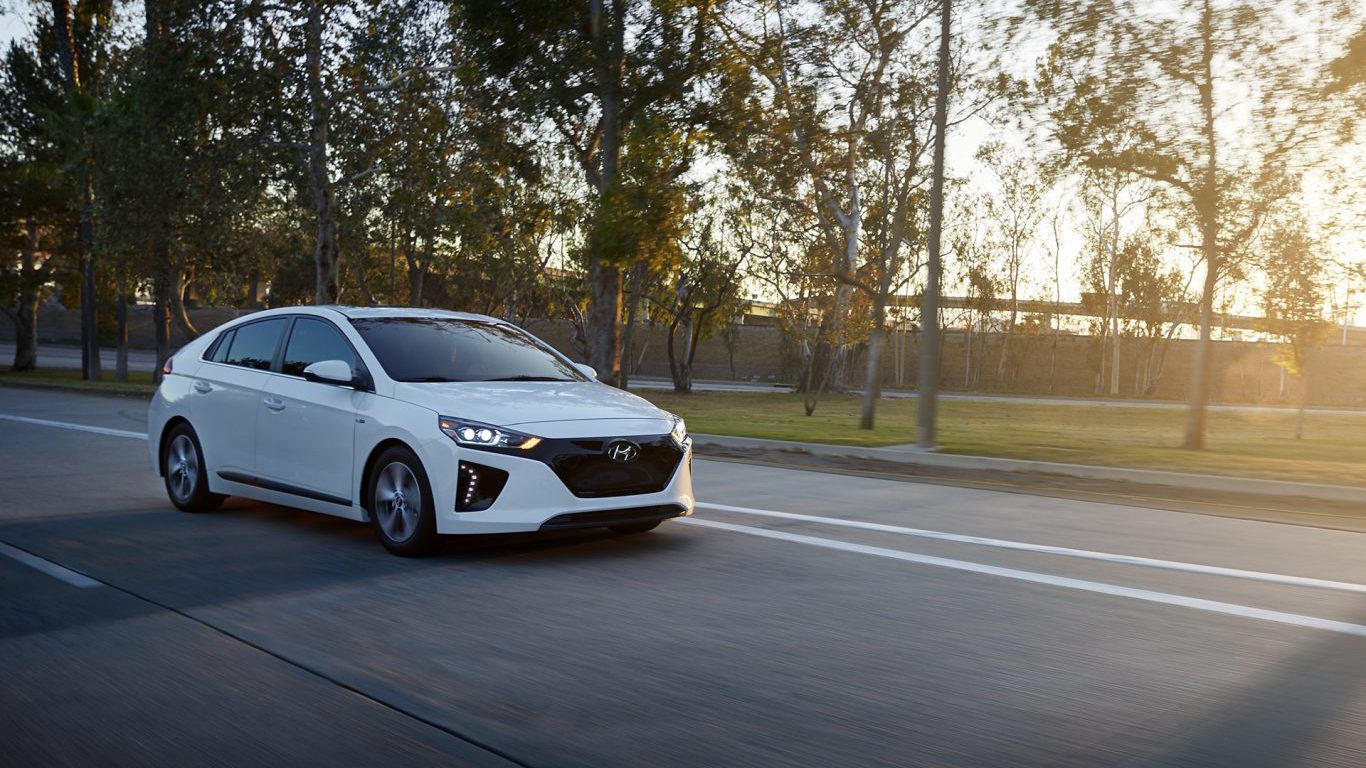
1. Hyundai Ioniq Electric
> CO2 released per mile: 0 grams
> Fuel efficiency: 136 mpg equivalent
> 5-yr fuel savings vs. 2017 industry avg.: $4,500
> Vehicle type: Electric
Retirement can be daunting, but it doesn’t need to be.
Imagine having an expert in your corner to help you with your financial goals. Someone to help you determine if you’re ahead, behind, or right on track. With SmartAsset, that’s not just a dream—it’s reality. This free tool connects you with pre-screened financial advisors who work in your best interests. It’s quick, it’s easy, so take the leap today and start planning smarter!
Don’t waste another minute; get started right here and help your retirement dreams become a retirement reality.
Thank you for reading! Have some feedback for us?
Contact the 24/7 Wall St. editorial team.