
The California State Senate passed a bill in April that provides a number of protections to immigrants in the state in light of recent crackdowns by Immigration and Customs Enforcement. The legislation limits the power of ICE agents to draw upon the resources of local law enforcement.
With the law’s passage, California is now being called the nation’s first “sanctuary state” at a time when the Trump administration has been targeting illegal immigration and so-called sanctuary cities.
[in-text-ad]
Safety and continued residency are only some of the concerns facing non-natives living in the United States. Different parts of the country provide different opportunities for earnings, education, and homeownership. Some also have large communities of fellow immigrants, whose help and support can ease the process of assimilation for new Americans.
24/7 Wall St. reviewed data on the presence and prosperity of immigrants in each state and ranked all 50 based on their favorability for foreign-born residents. California ranks as the best state for immigrants, while South Dakota ranks as the worst.
Click here to see the 10 best states for immigrants.
Establishing a new life and finding success in the United States can be difficult. Immigrants are far less likely to earn more than Americans who were born in the U.S., and are more likely to live in poverty.
Notably, however, unemployment tends to be lower among immigrants than among U.S.-born residents. While the unemployment rate among native-born citizens is 5.3%, it is just 5.0% for immigrants. In Alaska, one of the best states for immigrants, the unemployment rate is 2.6 percentage points lower among foreign-born workers than among U.S. natives in the labor force. This phenomenon is likely in part related to the fact that immigrants must maintain employment to have their visa renewed.
One factor determining a state’s favorability for immigrants is the share of state residents who are non-natives. This ranges from a 27.0% share in California to just 1.5% in West Virginia. Having relatively few immigrants does not necessarily imply the state is inhospitable, however, as in the case of West Virginia, which ranks third best on our list.
However, many of the best states for immigrants, such as New York, California, New Jersey, and Florida, have large immigrant populations. These states are home to major metropolitan areas with distinct communities of immigrants from countries all over the world. For new immigrants, these communities provide access to others who speak their first language and have gone through the process of becoming a full-time resident. This is a potentially helpful, if not necessary, component of a smooth transition to full integration.
While we rank states based on the economic outcomes for foreign-born residents, it is important to note that outcomes in each state tend to vary based on more than simply a resident’s status as native-born or foreign-born.
For example, naturalized immigrants — those who have been granted citizenship — overwhelmingly tend to have much higher incomes, and are much more often highly-educated, than non-citizen foreign-born residents. Among immigrants, the poverty rate for those who are citizens is 11.4% — less than the rate for native-born residents — while nearly 25% of non-citizens from other countries are poor. There are also substantial differences in economic outcomes depending on the region of origin of non-natives living in each state.
To determine the best states for immigrants, 24/7 Wall St. constructed an index consisting of five socioeconomic measures intended to reflect the success and ease of assimilation for foreign-born citizens relative to the native-born population within a given state. Three of the measures — median household income, poverty rate, and unemployment — came from the U.S. Census Bureau’s 2015 American Community Survey. The disparities in median household income, poverty rate, and unemployment among the native- and foreign-born populations were standardized using min-max normalization and added to a composite index. The index also includes the normalized value for the share of the overall state population that is foreign born, which also came from the ACS, and the number of green cards issued within the state as a share of the total number of green cards issued nationwide in the 2015 fiscal year. Green card data came from the Department of Homeland Security’s 2015 Yearbook of Immigration Statistics. Supplementary data used in our analysis but not our index, such as educational attainment, household size, and employment composition by citizenship status, also came from the ACS.
These are the 10 best states for immigrants.
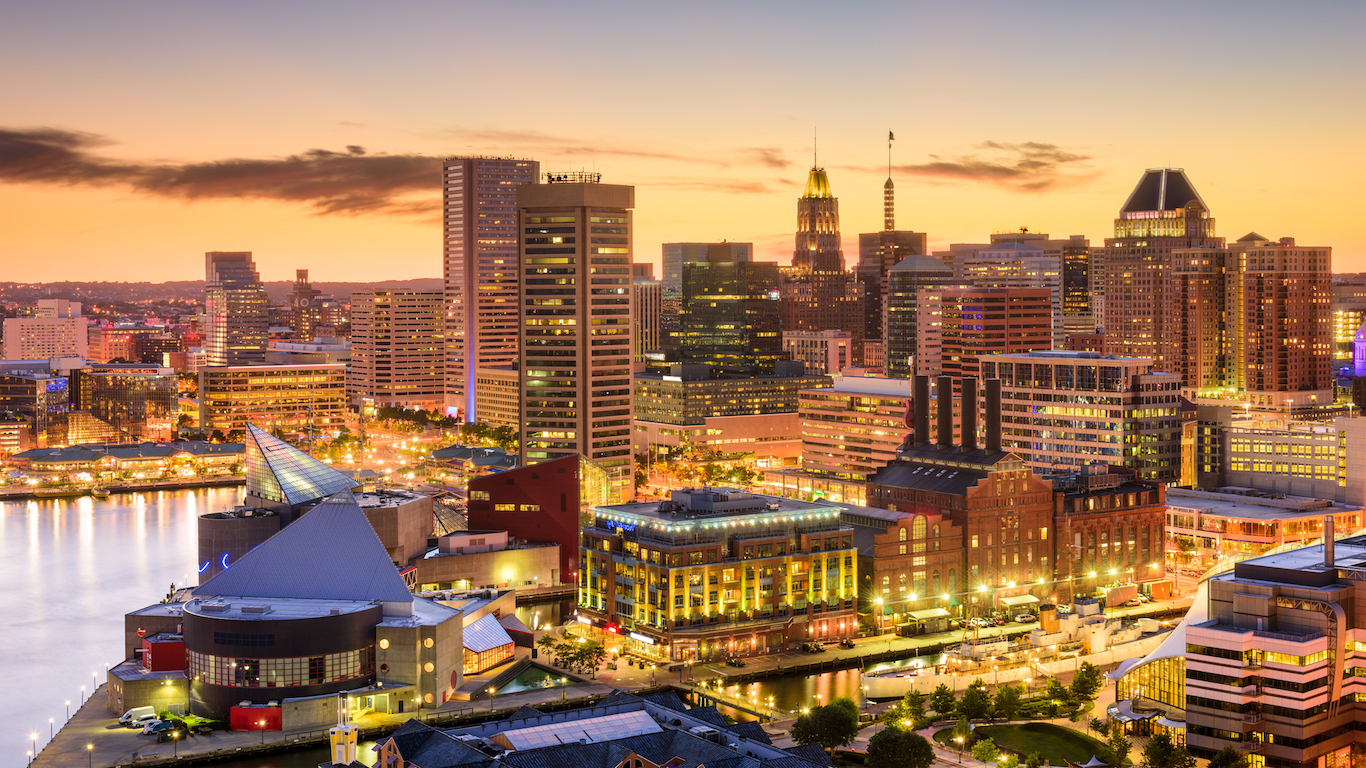
10. Maryland
> Pct. foreign born: 14.5% (9th highest)
> Median household income: $71,081 (foreign-born), $75,279 (native-born)
> Adults with a bachelor’s degree: 41.1% (foreign-born), 37.1% (native-born)
> Green cards issued in 2015: 381.5 per 100,000 (8th highest)
One of the wealthier states in the country, Maryland residents are better off than the average American by a number of socioeconomic measures, regardless of place of birth. Some 10.8% of foreign-born state residents live in poverty, far less than the 18.6% poverty rate for immigrants nationwide and just 1.0 percentage point more than the 9.8% poverty rate for U.S.-born Maryland residents. Nationwide, the poverty rate among immigrants is 3.6 percentage points greater than for natural-born citizens.
[in-text-ad]
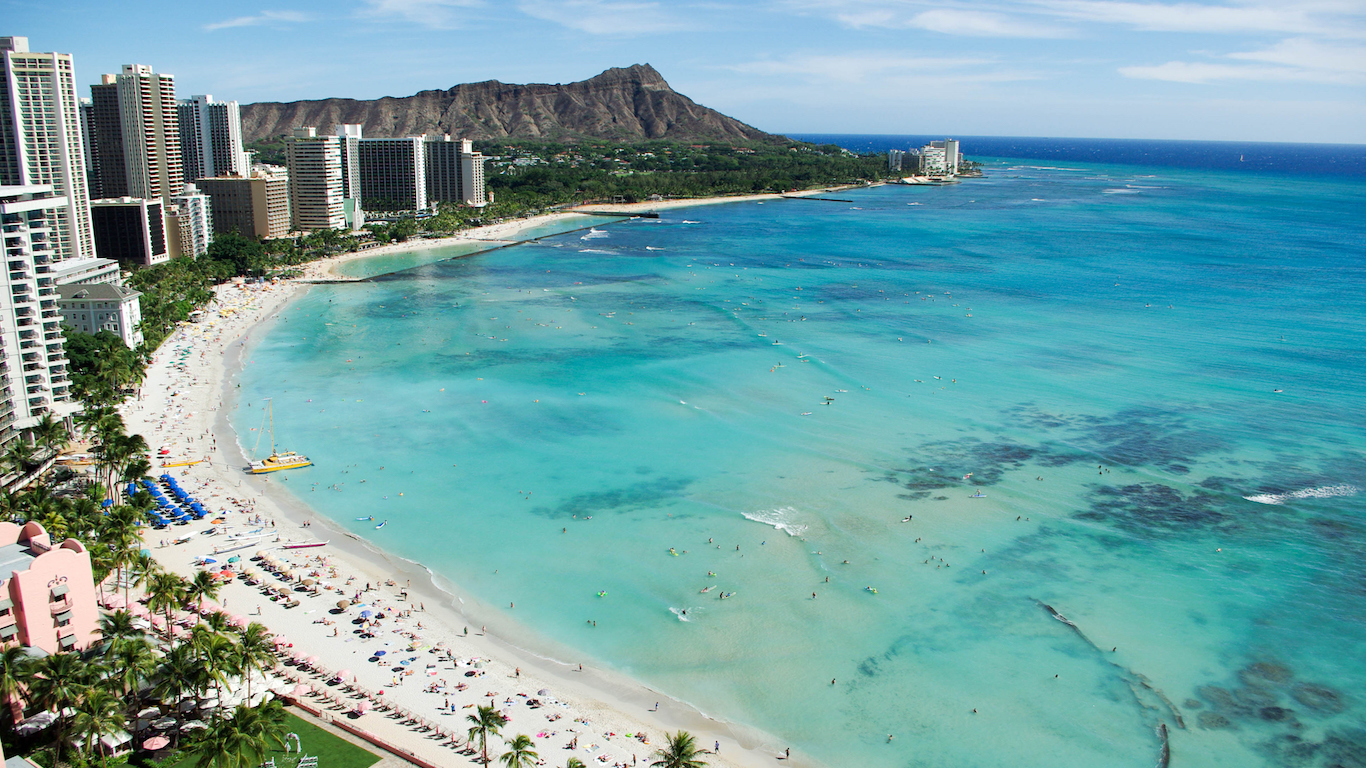
9. Hawaii
> Pct. foreign born: 17.7% (6th highest)
> Median household income: $63,081 (foreign-born), $70,828 (native-born)
> Adults with a bachelor’s degree: 24.7% (foreign-born), 32.6% (native-born)
> Green cards issued in 2015: 463.1 per 100,000 (5th highest)
A popular destination of both domestic and international migrants, Hawaii is one of the best states for immigrants. The federal government has considered any person born in Hawaii a U.S. citizen since 1900, and the state’s population consisted of roughly 30% foreign-born residents when it gained statehood in 1959. Today, 18% of residents on the islands were born outside of the United States — the sixth largest share nationwide. Foreign-born residents of Hawaii are also more likely to be naturalized U.S. citizens than in most parts of the country. A number of ethnicities — Japanese, Chinese, Filipino, and Korean — have established rich cultural heritages in Hawaii, making it easier for immigrants to move and assimilate into the state. Roughly 57% of immigrants in Hawaii have gained U.S. citizenship, the largest share of any state other than Vermont.
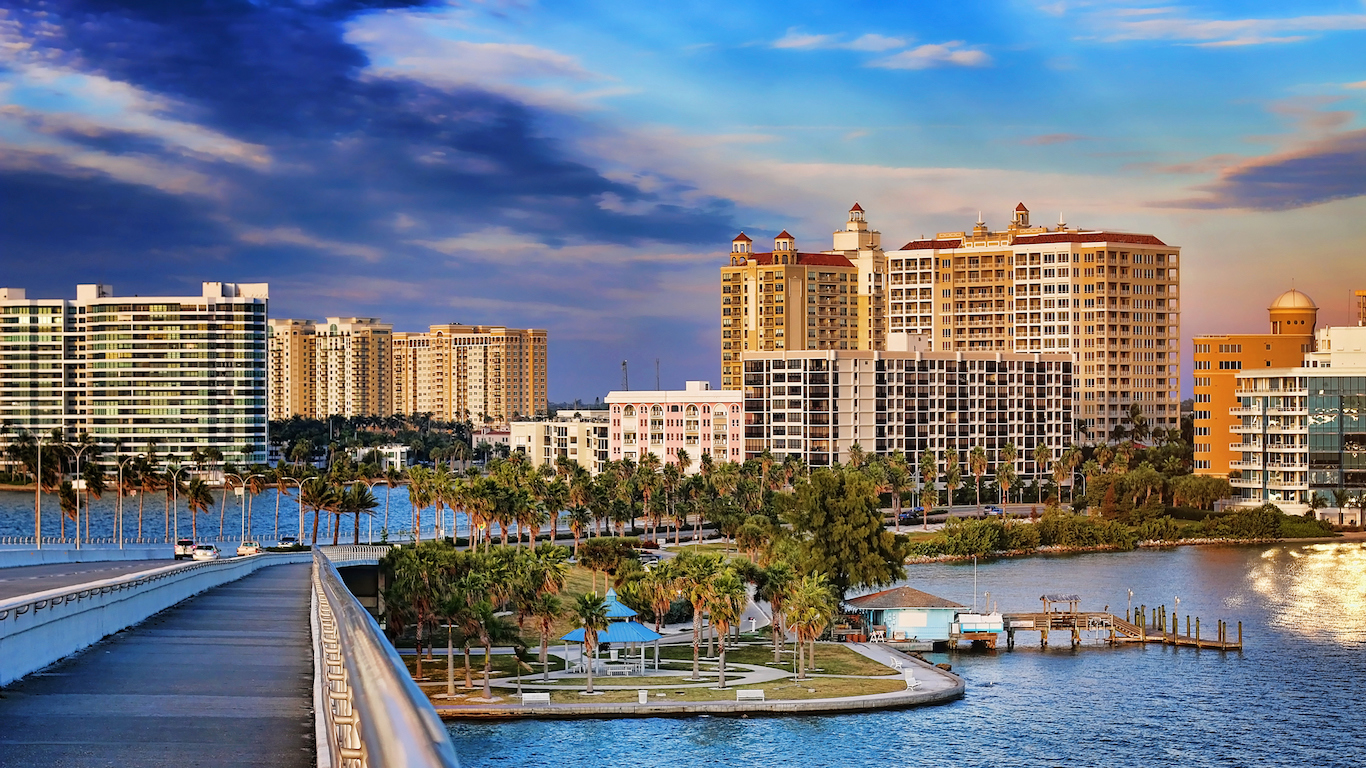
8. Florida
> Pct. foreign born: 19.7% (4th highest)
> Median household income: $41,518 (foreign-born), $49,431 (native-born)
> Adults with a bachelor’s degree: 25.5% (foreign-born), 27.9% (native-born)
> Green cards issued in 2015: 605.1 per 100,000 (2nd highest)
Florida has accepted more immigrants in recent years than nearly any other state. The population grew by 3.7% from international migration between 2010 and 2016, more than any other state and roughly twice the national growth rate due to immigration. More than 40% of all Florida’s foreign-born population is from the Caribbean, and more than 25% is from South and Central America, both high shares compared to that of the nation as a whole. Approximately 605 green cards were issued per 100,000 state residents in the 2015 fiscal year, more than in any state other than New York.
While more foreign-born Floridians have been granted permanent resident status than most states combined over the last several years, the state has one of the larger wealth disparities between native- and non-native residents. The typical immigrant household in Florida earns roughly $8,000 less annually than the typical native-born household, far more than the $5,000 national figure.

7. Nevada
> Pct. foreign born: 19.2% (5th highest)
> Median household income: $45,593 (foreign-born), $53,809 (native-born)
> Adults with a bachelor’s degree: 19.0% (foreign-born), 24.4% (native-born)
> Green cards issued in 2015: 394.9 per 100,000 (7th highest)
About 19% of Nevada’s population is foreign-born, compared to roughly 13% of the U.S. population. Just over 40% of this group was born in Mexico. Likely in part because remaining in the United States without employment can result in deportation, immigrants in the United States are less likely to be unemployed than native-borns. In Nevada, the unemployment rate for foreign-born residents is 5.9%, compared to a 7.0% jobless rate for native-born residents. As is the case throughout the country, being a naturalized immigrant in Nevada tends to correspond to a much better life than those for who remain non-U.S. citizens. For example, 23% of non-citizens in the state live in poverty, compared to 10% of Nevadans who have have been naturalized.
[in-text-ad]
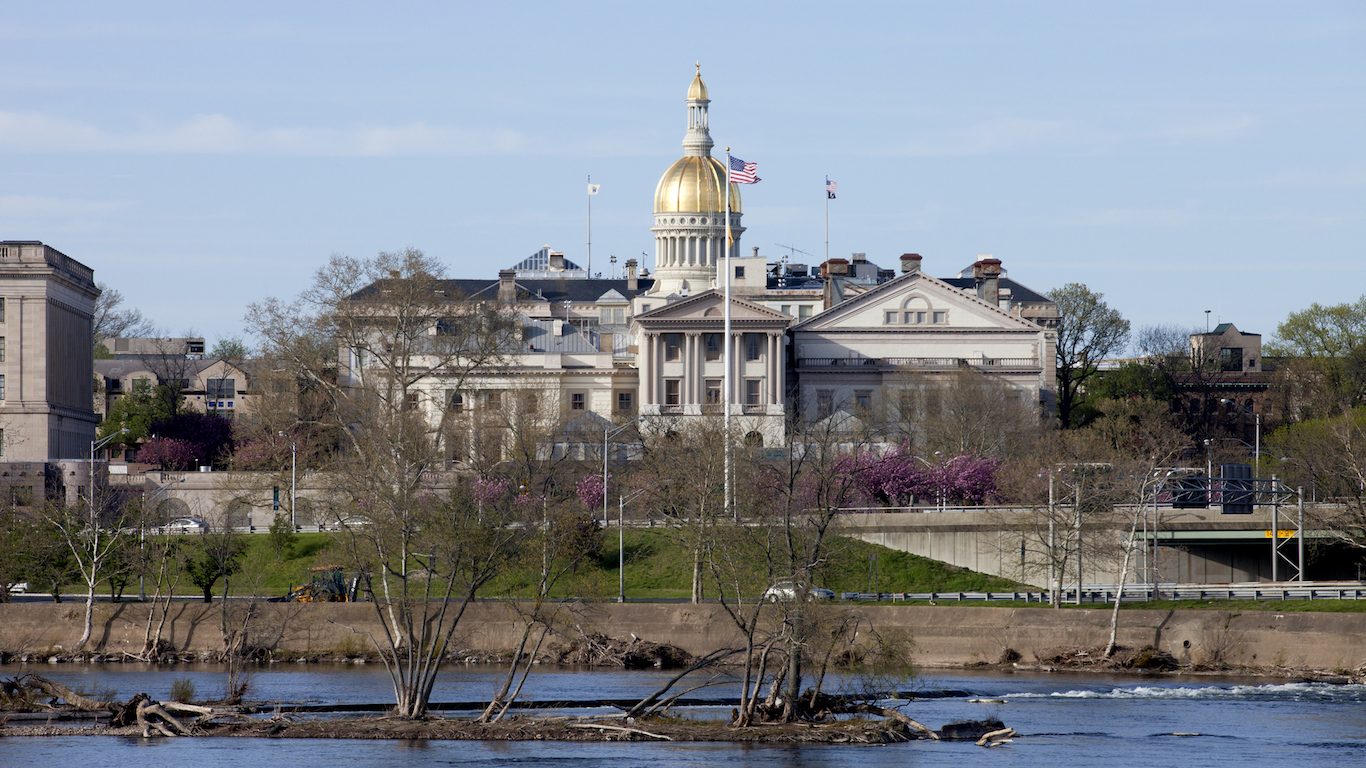
6. New Jersey
> Pct. foreign born: 21.7% (3rd highest)
> Median household income: $65,683 (foreign-born), $74,306 (native-born)
> Adults with a bachelor’s degree: 36.9% (foreign-born), 36.7% (native-born)
> Green cards issued in 2015: 559.3 per 100,000 (3rd highest)
When a state has a large share of foreign-born residents, it may be indicative of greater tolerance for other cultures. Many such states contain substantial communities of fellow immigrants that can help others with the process of assimilation into American life. In New Jersey, over one in five residents is foreign born, more than in all but two other states.
New Jersey’s foreign-born population — both those who are naturalized and those who are not — is one of the least likely of any state to live in poverty. Immigrants who reside in the Garden State tend to have relatively high educational attainment, which tends to correlate with higher earning potential. About 37% of Jersey’s foreign-born residents have a bachelor’s degree, some 8 percentage points higher than the national college attainment rate among immigrants.

5. New York
> Pct. foreign born: 22.5% (2nd highest)
> Median household income: $51,377 (foreign-born), $61,939 (native-born)
> Adults with a bachelor’s degree: 29.4% (foreign-born), 36.2% (native-born)
> Green cards issued in 2015: 660.8 per 100,000 (the highest)
In New York, 22.5% of the population is foreign born, second only to California. Largely because there are so many immigrants in the state, more people receive green cards on an annual basis in New York than in any other state. Some 661 green cards were issued per 100,000 state residents in the government’s 2015 fiscal year, almost exactly double the national rate. The earnings gap between immigrants and U.S. natives in the state is higher than most. The median income of native-born households is about $10,000 more than the median for foreign-born households. However, because incomes are generally higher in New York state, the typical immigrant household income is still slightly higher than the national median for immigrants.
4. Virginia
> Pct. foreign born: 11.7% (15th highest)
> Median household income: $70,835 (foreign-born), $64,236 (native-born)
> Adults with a bachelor’s degree: 40.7% (foreign-born), 35.6% (native-born)
> Green cards issued in 2015: 334.5 per 100,000 (12th highest)
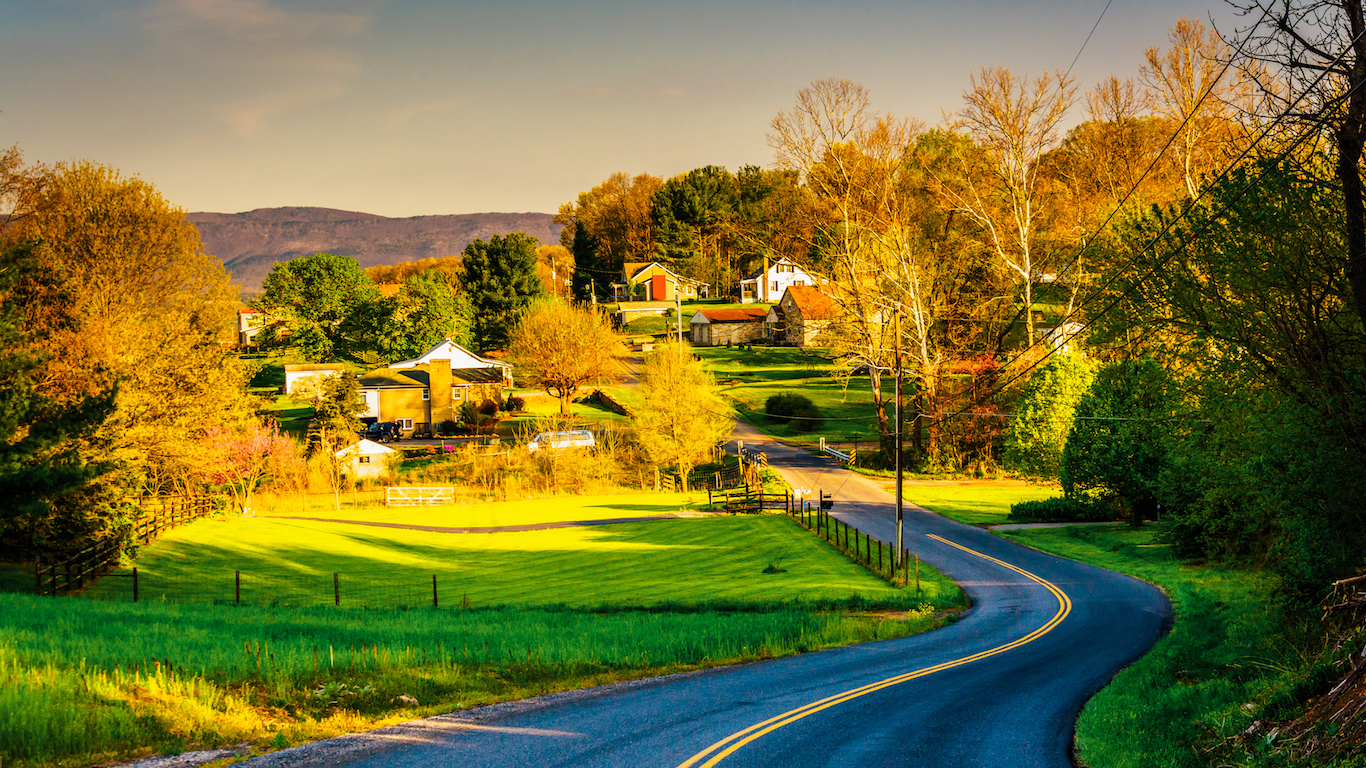
Virginia is one of just four states in which a foreign-born resident can reasonably expect not only to have a good income, but also to earn more than those born in the United States. The typical non-U.S. native Virginia household earns close to $71,000 a year, more than the $64,000 median for U.S.-native households. This is both the second largest positive income gap and the second highest median earnings for immigrants of any state. However, as is the case nationwide, those foreign-born Virginians who have not been granted citizenship are in a significantly different class of success. The median household income for this group is about $57,000 a year.

3. West Virginia
> Pct. foreign born: 1.5% (the lowest)
> Median household income: $48,460 (foreign-born), $41,668 (native-born)
> Adults with a bachelor’s degree: 45.4% (foreign-born), 18.7% (native-born)
> Green cards issued in 2015: 42.5 per 100,000 (the lowest)
Many of the states on this list have very large immigrant populations. With only 1.5% of its population born outside of the U.S., West Virginia is certainly not one of these. There were just 43 green cards issued per 100,000 West Virginians in fiscal 2015, less than one-seventh the U.S. rate.
However, that small group of West Virginians who were not born in the United States is relatively prosperous. Like in only three other states, immigrant households in the state earn a higher median income than native-born households. Also, foreign-born West Virginians are less likely to be unemployed and far more likely to have a college degree than native-born residents.
[in-text-ad]

2. Alaska
> Pct. foreign born: 7.4% (24th highest)
> Median household income: $62,242 (foreign-born), $73,311 (native-born)
> Adults with a bachelor’s degree: 23.9% (foreign-born), 28.4% (native-born)
> Green cards issued in 2015: 214.4 per 100,000 (24th highest)
The poverty rate among immigrants in the United States is 18.6%, higher than the rate among U.S. natives of 15.0%. While the poverty rate among immigrants is higher than it is among native-born residents in every state, the gap in Alaska is very small. Of all immigrant state residents, 10.3% live in poverty, nearly the same as the 10.2% of U.S.-born state residents. As is the case nationwide, socioeconomic outcomes vary heavily by citizenship. Just 6.6% of foreign-born Alaskans who have been naturalized live in poverty, compared to 14.7% of non-citizen immigrants.
Unemployment tends to be lower for immigrants than U.S.-natives, and in no state is this more true than in Alaska. Only 3.2% of non-native workers in the state are unemployed, compared to 5.8% among native-born Americans living in Alaska.
1. California
> Pct. foreign born: 27.0% (the highest)
> Median household income: $52,438 (foreign-born), $66,670 (native-born)
> Adults with a bachelor’s degree: 26.3% (foreign-born), 34.4% (native-born)
> Green cards issued in 2015: 545.4 per 100,000 (4th highest)
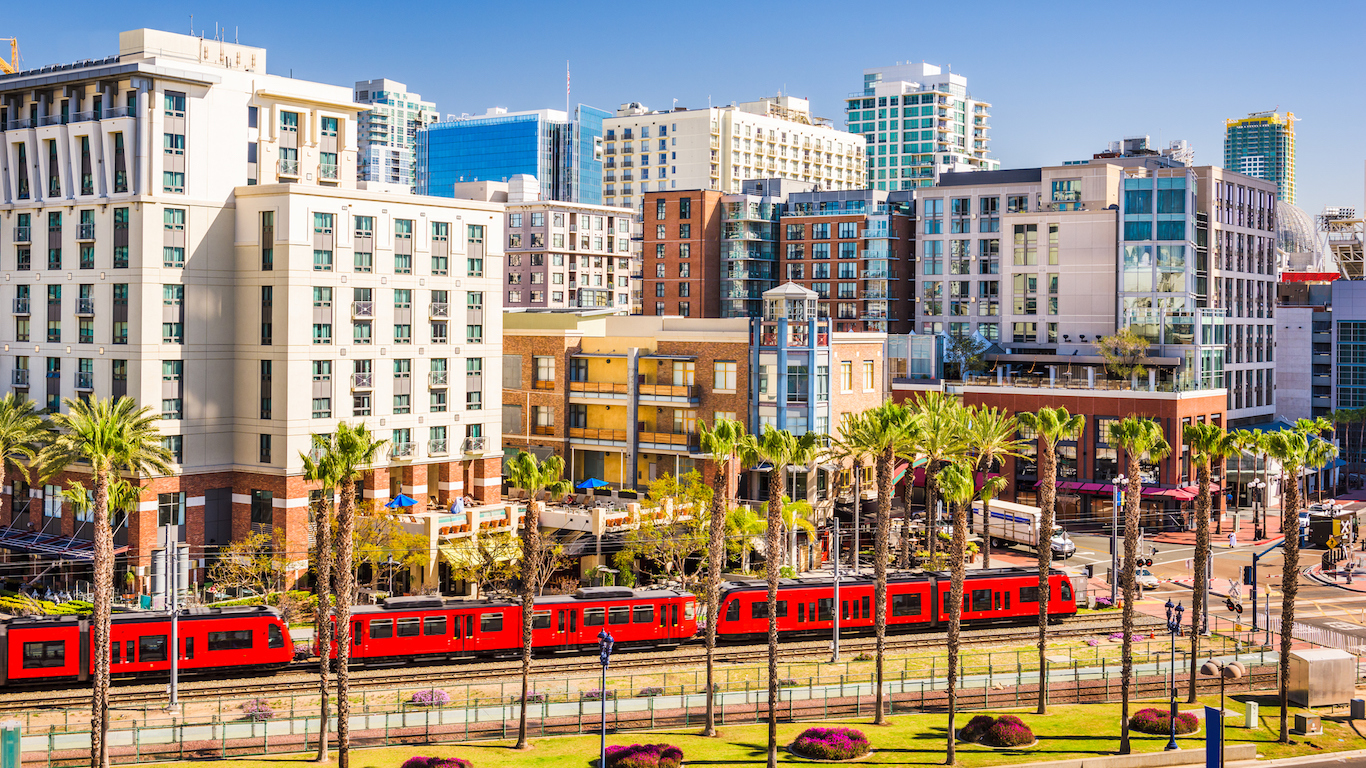
In light of the recent crackdown by Immigration and Customs Enforcement officers on illegal immigrants, California in April moved to become the first “sanctuary state.” A bill passed in the California State Senate provides greater legal protections for immigrants, such as limiting communication between local law enforcement and ICE officials.
A nation-leading 27% of state residents were not born in the United States. Approximately one in five green card grantees each year are Californians. There is a slightly higher income gap in California between U.S. natives and foreign-born residents compared to many other states on this list, but as is the case nationwide, incomes depend on region of origin and citizenship status. The state has large shares of both native Mexicans and Southeast Asians, who typically make about $33,000 more than Mexican immigrant households.
The Average American Has No Idea How Much Money You Can Make Today (Sponsor)
The last few years made people forget how much banks and CD’s can pay. Meanwhile, interest rates have spiked and many can afford to pay you much more, but most are keeping yields low and hoping you won’t notice.
But there is good news. To win qualified customers, some accounts are paying almost 10x the national average! That’s an incredible way to keep your money safe and earn more at the same time. Our top pick for high yield savings accounts includes other benefits as well. You can earn up to 3.80% with a Checking & Savings Account today Sign up and get up to $300 with direct deposit. No account fees. FDIC Insured.
Click here to see how much more you could be earning on your savings today. It takes just a few minutes to open an account to make your money work for you.
Our top pick for high yield savings accounts includes other benefits as well. You can earn up to 4.00% with a Checking & Savings Account from Sofi. Sign up and get up to $300 with direct deposit. No account fees. FDIC Insured.
Thank you for reading! Have some feedback for us?
Contact the 24/7 Wall St. editorial team.
 24/7 Wall St.
