Special Report
How Many People Are Alive From the Year You Were Born

Published:
Last Updated:

The U.S. fertility rate is at its lowest point in history, with 62.5 births per 1,000 women between the ages of 15 and 44. The total fertility rate has been below replacement level since 1971. Despite this, the nation’s population is the largest it has ever been. In addition to births, the U.S. population has been growing due to immigration and longer life expectancy.
24/7 Wall St. has determined the number of people alive today who were born each year since 1933. While the fertility rate has declined, the mortality rate has declined as well, increasing the share of Americans who are from a younger generation.
Due to increased access to health care, which has improved dramatically over the last century, life expectancy has gone up significantly. The average person born in 1930 lived to 59.7 years of age in. By 2012, the average life expectancy had increased to 78.8 years.
Click here to see how many people from the year you were born are alive.
To determine how many people are left from the year you were born, 24/7 Wall St. reviewed estimates of the 2017 native population by age from the U.S. Census Bureau. These estimates adjust for both naturalized citizens as well as native-born Americans living outside the United States. The share of people born each year since 1933 alive in 2017 was calculated by comparing these Census population estimates to the number of births each year from the Centers for Disease Control and Prevention’s Vital Statistics of the United States report series. Total U.S. population figures in each year were from the Bureau of Economic Analysis.
This is how many people from the year you were born are alive.

> 84-year-old pop., 2017: 874,723
> Ppl. born in 1933 who are still alive: 42.0%
> Births: 2,081,232
> U.S. population: 125,375,422
[in-text-ad]

> 83-year-old pop., 2017: 922,895
> Ppl. born in 1934 who are still alive: 42.6%
> Births: 2,167,636
> U.S. population: 126,025,349

> 82-year-old pop., 2017: 1,049,356
> Ppl. born in 1935 who are still alive: 48.7%
> Births: 2,155,105
> U.S. population: 127,521,006

> 81-year-old pop., 2017: 1,107,334
> Ppl. born in 1936 who are still alive: 51.6%
> Births: 2,144,790
> U.S. population: 128,430,539

> 80-year-old pop., 2017: 1,182,379
> Ppl. born in 1937 who are still alive: 53.7%
> Births: 2,203,337
> U.S. population: 128,850,117
[in-text-ad-2]
> 79-year-old pop., 2017: 1,303,948
> Ppl. born in 1938 who are still alive: 57.0%
> Births: 2,286,962
> U.S. population: 129,941,023
> 78-year-old pop., 2017: 1,374,656
> Ppl. born in 1939 who are still alive: 60.7%
> Births: 2,265,588
> U.S. population: 130,958,844

> 77-year-old pop., 2017: 1,477,282
> Ppl. born in 1940 who are still alive: 62.6%
> Births: 2,360,399
> U.S. population: 131,865,866
[in-text-ad]
> 76-year-old pop., 2017: 1,584,307
> Ppl. born in 1941 who are still alive: 63.0%
> Births: 2,513,427
> U.S. population: 133,692,926

> 75-year-old pop., 2017: 1,767,482
> Ppl. born in 1942 who are still alive: 62.9%
> Births: 2,808,996
> U.S. population: 135,047,885

> 74-year-old pop., 2017: 2,067,076
> Ppl. born in 1943 who are still alive: 70.4%
> Births: 2,934,860
> U.S. population: 136,505,116

> 73-year-old pop., 2017: 2,014,651
> Ppl. born in 1944 who are still alive: 72.1%
> Births: 2,794,800
> U.S. population: 138,356,436
> 72-year-old pop., 2017: 2,067,531
> Ppl. born in 1945 who are still alive: 75.6%
> Births: 2,735,456
> U.S. population: 140,279,795
> 71-year-old pop., 2017: 2,082,820
> Ppl. born in 1946 who are still alive: 63.3%
> Births: 3,288,672
> U.S. population: 141,144,721
[in-text-ad-2]
> 70-year-old pop., 2017: 2,916,071
> Ppl. born in 1947 who are still alive: 78.8%
> Births: 3,699,940
> U.S. population: 143,408,527

> 69-year-old pop., 2017: 2,784,211
> Ppl. born in 1948 who are still alive: 78.8%
> Births: 3,535,068
> U.S. population: 146,077,190

> 68-year-old pop., 2017: 2,813,871
> Ppl. born in 1949 who are still alive: 79.1%
> Births: 3,559,529
> U.S. population: 148,934,268
> 67-year-old pop., 2017: 2,891,776
> Ppl. born in 1950 who are still alive: 81.4%
> Births: 3,554,149
> U.S. population: 150,599,534
[in-text-ad]

> 66-year-old pop., 2017: 2,982,754
> Ppl. born in 1951 who are still alive: 79.5%
> Births: 3,750,850
> U.S. population: 153,095,918
> 65-year-old pop., 2017: 3,097,345
> Ppl. born in 1952 who are still alive: 80.5%
> Births: 3,846,986
> U.S. population: 155,748,421
> 64-year-old pop., 2017: 3,202,835
> Ppl. born in 1953 who are still alive: 82.1%
> Births: 3,902,120
> U.S. population: 157,980,567

> 63-year-old pop., 2017: 3,332,687
> Ppl. born in 1954 who are still alive: 83.0%
> Births: 4,017,362
> U.S. population: 161,339,839

> 62-year-old pop., 2017: 3,459,999
> Ppl. born in 1955 who are still alive: 85.5%
> Births: 4,047,295
> U.S. population: 164,524,187
> 61-year-old pop., 2017: 3,492,739
> Ppl. born in 1956 who are still alive: 83.9%
> Births: 4,163,090
> U.S. population: 167,192,369
[in-text-ad-2]

> 60-year-old pop., 2017: 3,626,712
> Ppl. born in 1957 who are still alive: 85.2%
> Births: 4,254,784
> U.S. population: 170,191,360

> 59-year-old pop., 2017: 3,657,165
> Ppl. born in 1958 who are still alive: 87.0%
> Births: 4,203,812
> U.S. population: 172,996,379

> 58-year-old pop., 2017: 3,663,532
> Ppl. born in 1959 who are still alive: 86.3%
> Births: 4,244,796
> U.S. population: 176,866,500

> 57-year-old pop., 2017: 3,765,804
> Ppl. born in 1960 who are still alive: 88.4%
> Births: 4,257,850
> U.S. population: 179,656,118
[in-text-ad]

> 56-year-old pop., 2017: 3,754,258
> Ppl. born in 1961 who are still alive: 88.0%
> Births: 4,268,326
> U.S. population: 183,189,957
> 55-year-old pop., 2017: 3,685,311
> Ppl. born in 1962 who are still alive: 88.4%
> Births: 4,167,362
> U.S. population: 186,042,946

> 54-year-old pop., 2017: 3,633,563
> Ppl. born in 1963 who are still alive: 88.7%
> Births: 4,098,020
> U.S. population: 188,848,848
> 53-year-old pop., 2017: 3,623,640
> Ppl. born in 1964 who are still alive: 90.0%
> Births: 4,027,490
> U.S. population: 190,876,303

> 52-year-old pop., 2017: 3,522,917
> Ppl. born in 1965 who are still alive: 93.7%
> Births: 3,760,358
> U.S. population: 193,832,887
> 51-year-old pop., 2017: 3,303,201
> Ppl. born in 1966 who are still alive: 91.6%
> Births: 3,606,274
> U.S. population: 195,993,152
[in-text-ad-2]

> 50-year-old pop., 2017: 3,226,962
> Ppl. born in 1967 who are still alive: 91.7%
> Births: 3,520,959
> U.S. population: 197,806,685

> 49-year-old pop., 2017: 3,153,522
> Ppl. born in 1968 who are still alive: 90.1%
> Births: 3,501,564
> U.S. population: 198,952,500
> 48-year-old pop., 2017: 3,255,654
> Ppl. born in 1969 who are still alive: 90.4%
> Births: 3,600,206
> U.S. population: 201,128,827

> 47-year-old pop., 2017: 3,435,823
> Ppl. born in 1970 who are still alive: 92.1%
> Births: 3,731,386
> U.S. population: 202,792,717
[in-text-ad]

> 46-year-old pop., 2017: 3,400,125
> Ppl. born in 1971 who are still alive: 95.6%
> Births: 3,555,970
> U.S. population: 206,742,442

> 45-year-old pop., 2017: 3,159,189
> Ppl. born in 1972 who are still alive: 97.0%
> Births: 3,258,411
> U.S. population: 208,872,500

> 44-year-old pop., 2017: 2,959,478
> Ppl. born in 1973 who are still alive: 94.3%
> Births: 3,136,965
> U.S. population: 210,534,564

> 43-year-old pop., 2017: 2,918,206
> Ppl. born in 1974 who are still alive: 92.3%
> Births: 3,159,958
> U.S. population: 212,077,718
> 42-year-old pop., 2017: 3,022,240
> Ppl. born in 1975 who are still alive: 96.1%
> Births: 3,144,198
> U.S. population: 212,445,811

> 41-year-old pop., 2017: 2,939,871
> Ppl. born in 1976 who are still alive: 92.8%
> Births: 3,167,788
> U.S. population: 214,039,730
[in-text-ad-2]

> 40-year-old pop., 2017: 3,062,831
> Ppl. born in 1977 who are still alive: 92.1%
> Births: 3,326,632
> U.S. population: 216,015,065

> 39-year-old pop., 2017: 3,097,685
> Ppl. born in 1978 who are still alive: 92.9%
> Births: 3,333,279
> U.S. population: 217,861,373

> 38-year-old pop., 2017: 3,209,984
> Ppl. born in 1979 who are still alive: 91.9%
> Births: 3,494,398
> U.S. population: 219,773,459

> 37-year-old pop., 2017: 3,440,448
> Ppl. born in 1980 who are still alive: 95.2%
> Births: 3,612,258
> U.S. population: 227,186,038
[in-text-ad]

> 36-year-old pop., 2017: 3,415,856
> Ppl. born in 1981 who are still alive: 94.1%
> Births: 3,629,238
> U.S. population: 229,698,608

> 35-year-old pop., 2017: 3,471,601
> Ppl. born in 1982 who are still alive: 94.3%
> Births: 3,680,537
> U.S. population: 231,480,314

> 34-year-old pop., 2017: 3,461,829
> Ppl. born in 1983 who are still alive: 95.1%
> Births: 3,638,933
> U.S. population: 233,264,936

> 33-year-old pop., 2017: 3,442,512
> Ppl. born in 1984 who are still alive: 93.8%
> Births: 3,669,141
> U.S. population: 235,201,346

> 32-year-old pop., 2017: 3,588,802
> Ppl. born in 1985 who are still alive: 95.4%
> Births: 3,760,561
> U.S. population: 238,010,190

> 31-year-old pop., 2017: 3,603,018
> Ppl. born in 1986 who are still alive: 95.9%
> Births: 3,756,547
> U.S. population: 240,804,295
[in-text-ad-2]

> 30-year-old pop., 2017: 3,619,230
> Ppl. born in 1987 who are still alive: 95.0%
> Births: 3,809,394
> U.S. population: 242,636,561

> 29-year-old pop., 2017: 3,708,203
> Ppl. born in 1988 who are still alive: 94.9%
> Births: 3,909,510
> U.S. population: 244,344,375
> 28-year-old pop., 2017: 3,873,646
> Ppl. born in 1989 who are still alive: 95.9%
> Births: 4,040,958
> U.S. population: 246,399,878

> 27-year-old pop., 2017: 4,100,491
> Ppl. born in 1990 who are still alive: 98.6%
> Births: 4,158,212
> U.S. population: 248,994,731
[in-text-ad]

> 26-year-old pop., 2017: 4,074,234
> Ppl. born in 1991 who are still alive: 99.1%
> Births: 4,110,907
> U.S. population: 253,759,691
> 25-year-old pop., 2017: 4,023,625
> Ppl. born in 1992 who are still alive: 99.0%
> Births: 4,065,014
> U.S. population: 257,279,367

> 24-year-old pop., 2017: 3,963,467
> Ppl. born in 1993 who are still alive: 99.1%
> Births: 4,000,240
> U.S. population: 259,755,844

> 23-year-old pop., 2017: 3,921,277
> Ppl. born in 1994 who are still alive: 99.2%
> Births: 3,952,767
> U.S. population: 263,517,800

> 22-year-old pop., 2017: 3,868,825
> Ppl. born in 1995 who are still alive: 99.2%
> Births: 3,899,589
> U.S. population: 267,095,137
> 21-year-old pop., 2017: 3,880,286
> Ppl. born in 1996 who are still alive: 99.7%
> Births: 3,891,494
> U.S. population: 270,242,639
[in-text-ad-2]

> 20-year-old pop., 2017: 3,878,561
> Ppl. born in 1997 who are still alive: 99.9%
> Births: 3,880,894
> U.S. population: 273,302,394

> 19-year-old pop., 2017: 3,890,945
> Ppl. born in 1998 who are still alive: 98.7%
> Births: 3,941,553
> U.S. population: 275,633,077

> 18-year-old pop., 2017: 3,910,206
> Ppl. born in 1999 who are still alive: 98.8%
> Births: 3,959,417
> U.S. population: 278,832,183

> 17-year-old pop., 2017: 4,000,787
> Ppl. born in 2000 who are still alive: 98.6%
> Births: 4,058,814
> U.S. population: 281,862,083
[in-text-ad]

> 16-year-old pop., 2017: 3,963,543
> Ppl. born in 2001 who are still alive: 98.5%
> Births: 4,025,933
> U.S. population: 285,527,163

> 15-year-old pop., 2017: 3,888,296
> Ppl. born in 2002 who are still alive: 96.7%
> Births: 4,021,726
> U.S. population: 289,332,806

> 14-year-old pop., 2017: 3,919,050
> Ppl. born in 2003 who are still alive: 95.8%
> Births: 4,089,950
> U.S. population: 290,067,376

> 13-year-old pop., 2017: 3,975,454
> Ppl. born in 2004 who are still alive: 96.7%
> Births: 4,112,052
> U.S. population: 292,881,197
> 12-year-old pop., 2017: 3,978,836
> Ppl. born in 2005 who are still alive: 96.1%
> Births: 4,138,349
> U.S. population: 295,596,357

> 11-year-old pop., 2017: 4,004,914
> Ppl. born in 2006 who are still alive: 93.9%
> Births: 4,265,555
> U.S. population: 298,290,559
[in-text-ad-2]

> 10-year-old pop., 2017: 4,045,915
> Ppl. born in 2007 who are still alive: 93.7%
> Births: 4,316,233
> U.S. population: 301,202,582
> 9-year-old pop., 2017: 4,032,802
> Ppl. born in 2008 who are still alive: 94.9%
> Births: 4,247,694
> U.S. population: 304,058,268

> 8-year-old pop., 2017: 3,918,246
> Ppl. born in 2009 who are still alive: 94.9%
> Births: 4,130,665
> U.S. population: 306,884,473

> 7-year-old pop., 2017: 3,923,609
> Ppl. born in 2010 who are still alive: 98.1%
> Births: 3,999,386
> U.S. population: 308,832,896
[in-text-ad]

> 6-year-old pop., 2017: 3,928,469
> Ppl. born in 2011 who are still alive: 99.4%
> Births: 3,953,590
> U.S. population: 311,551,615
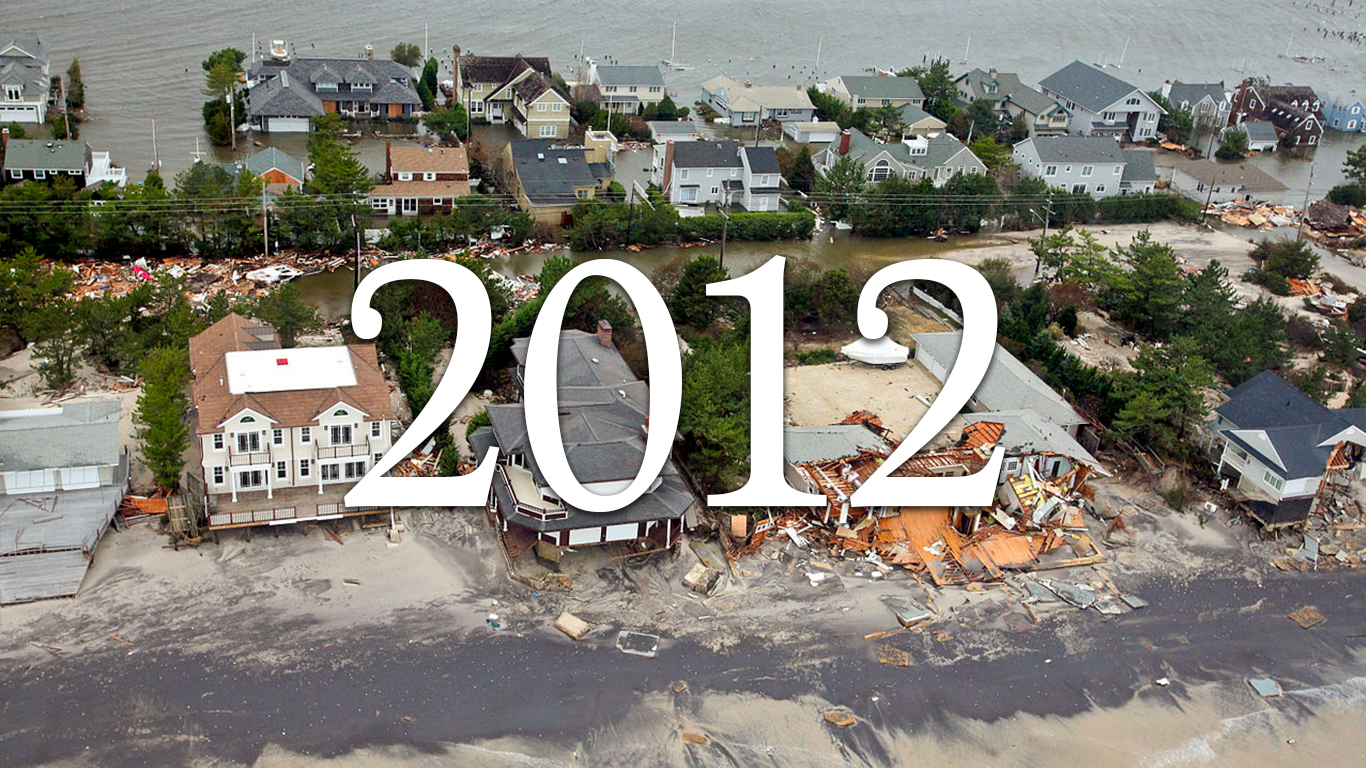
> 5-year-old pop., 2017: 3,911,241
> Ppl. born in 2012 who are still alive: 98.9%
> Births: 3,952,841
> U.S. population: 313,966,720

> 4-year-old pop., 2017: 3,908,611
> Ppl. born in 2013 who are still alive: 99.4%
> Births: 3,932,181
> U.S. population: 316,091,720
[in-text-ad-2]

> 3-year-old pop., 2017: 3,941,332
> Ppl. born in 2014 who are still alive: 98.8%
> Births: 3,988,076
> U.S. population: 318,791,047
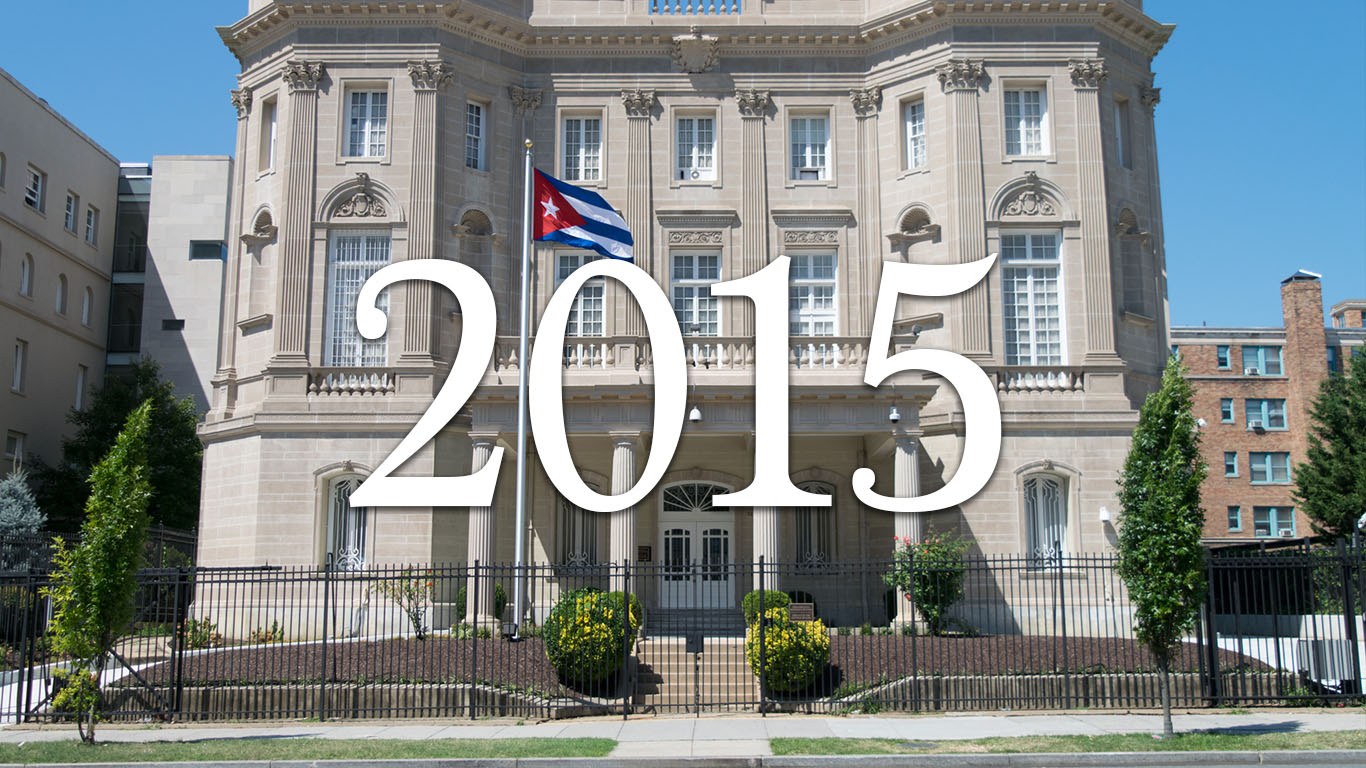
> 2-year-old pop., 2017: 3,971,528
> Ppl. born in 2015 who are still alive: 99.8%
> Births: 3,978,497
> U.S. population: 321,364,863
The thought of burdening your family with a financial disaster is most Americans’ nightmare. However, recent studies show that over 100 million Americans still don’t have proper life insurance in the event they pass away.
Life insurance can bring peace of mind – ensuring your loved ones are safeguarded against unforeseen expenses and debts. With premiums often lower than expected and a variety of plans tailored to different life stages and health conditions, securing a policy is more accessible than ever.
A quick, no-obligation quote can provide valuable insight into what’s available and what might best suit your family’s needs. Life insurance is a simple step you can take today to help secure peace of mind for your loved ones tomorrow.
Click here to learn how to get a quote in just a few minutes.
Thank you for reading! Have some feedback for us?
Contact the 24/7 Wall St. editorial team.