Special Report
Best (and Worst) States to Be Unemployed

Published:
Last Updated:

While the U.S. unemployment rate has steadily improved since the Great Recession, millions of Americans remain out of work. Every week, hundreds of thousands of the nation’s jobless apply for unemployment insurance, relying on the program to avoid severe financial hardship.
Since its establishment during the Great Depression, the U.S. unemployment insurance program has been a key component of the nation’s social welfare system. Unemployment insurance provides a weekly or biweekly stipend to jobless Americans to partially replace lost wages. The benefits help individuals maintain their quality of life in between jobs, and also help stabilize the economy by stimulating consumer activity during periods of high unemployment.
To determine the best and worst states to be unemployed in, 24/7 Wall St. compiled an index of various measures related to a state’s job market and unemployment insurance program. In the best states to be unemployed, people are less likely to be out of work for long, and a large share of the jobless receive generous UI benefits.
Click here to see the best states to be unemployed.
Click here to see the worst states to be unemployed.
Click here to see our detailed findings and methodology.
Best states to be unemployed:

10. Minnesota
> Pct. unemployed receiving benefits: 41.0% (7th highest)
> Pct. of average weekly wage covered: 42.2% (10th highest)
> Unemployment rate: 3.9% (13th lowest)
> 1-yr. job growth: 0.7% (16th smallest increase)
Minnesota has some of the most comprehensive unemployment insurance coverage in the country. More than 40% of unemployed workers in the state receive jobless benefits, the seventh highest rate nationwide. Unemployment benefits in the state average $434 a week, a larger sum than in all but four states. The average benefits payment amounts to 42.2% of the state’s average weekly wage, compared to only 34.1% nationwide.
Minnesota also has a relatively healthy job market overall. Just 3.9% of the workforce is unemployed, below the 4.9% national rate.
[in-text-ad]
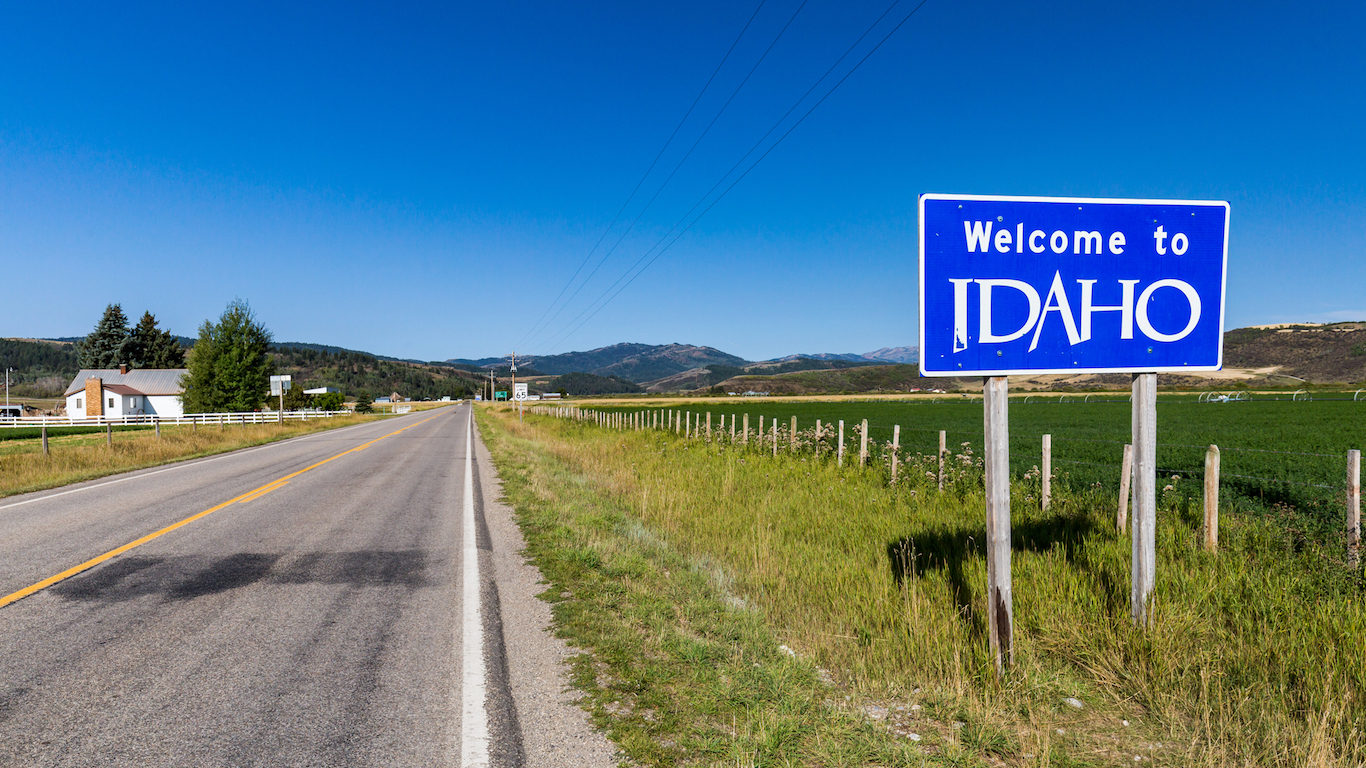
9. Idaho
> Pct. unemployed receiving benefits: 25.0% (21st lowest)
> Pct. of average weekly wage covered: 42.0% (11th highest)
> Unemployment rate: 3.8% (11th lowest)
> 1-yr. job growth: 2.6% (10th largest increase)
Incomes are relatively low in Idaho, and unemployment benefits supplement a large share of the earnings lost to joblessness. While unemployment benefits in the state average just $312 a week, they cover 42% of the average Idaho worker’s weekly paycheck. By comparison, the $344 average benefit nationwide covers just 34% of weekly earnings for the average U.S. worker.
Over the past year, Idaho’s economy grew at a faster rate than that of a majority of states. As employment increased by 2.6% — faster than the 1.7% national rate — unemployment fell from 4.2% to 3.8%. The increased economic activity likely reduced dependency on unemployment insurance in the state. In 2016, unemployed workers in Idaho spent just 11 weeks on average on unemployment, the fifth shortest duration of any state.
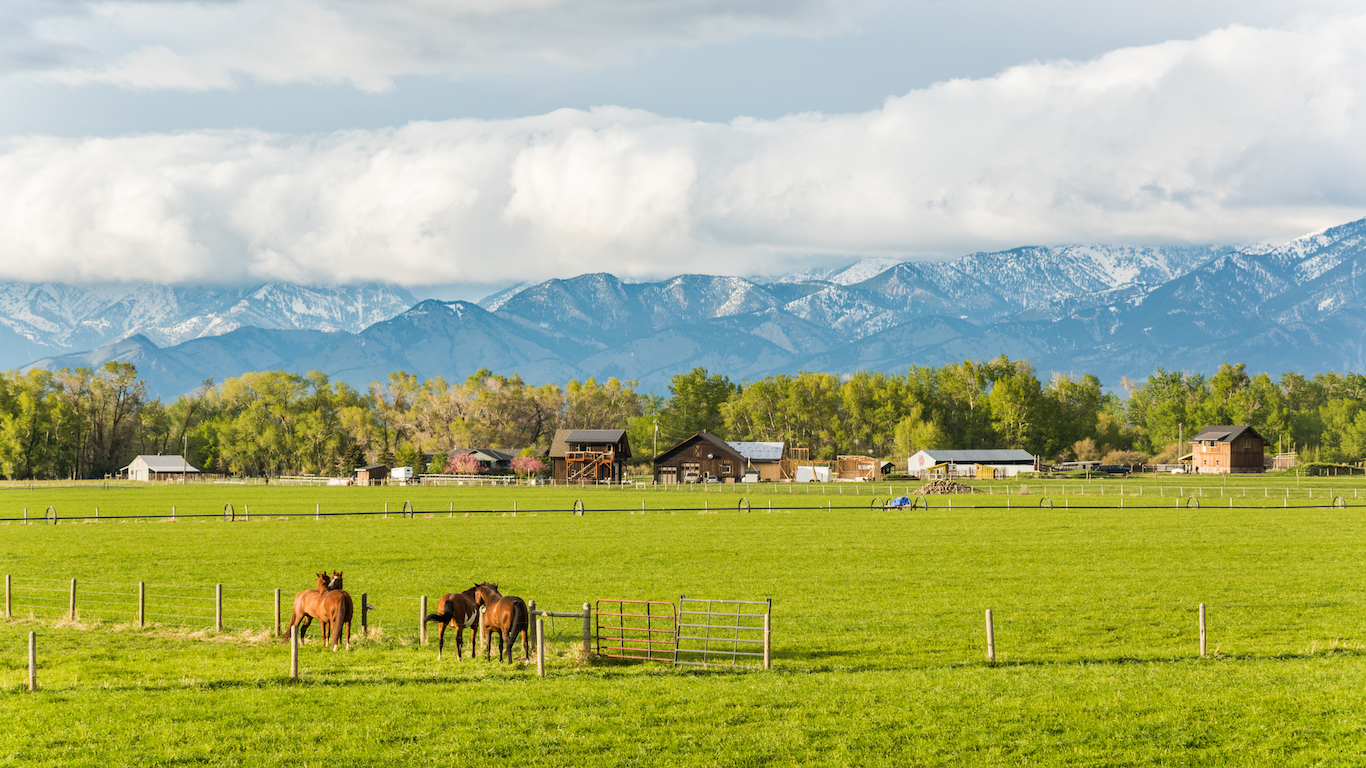
8. Montana
> Pct. unemployed receiving benefits: 37.0% (11th highest)
> Pct. of average weekly wage covered: 43.8% (8th highest)
> Unemployment rate: 4.1% (17th lowest)
> 1-yr. job growth: 1.3% (25th smallest increase)
Out of work Montanans are more likely than those in most states to receive unemployment benefits. While 28% of jobless Americans receive such benefits, 37% of unemployed Montanans do. Further, those benefits tend to be more generous in the state than elsewhere. The average weekly benefits, at $333, are actually slightly below the national average figure of $344. However, the average weekly wage in Montana, which has a very low cost of living, is just $759, compared to a national average weekly wage of just over $1,000. As a result, the unemployment benefits replace about 44% of lost wages, 10 percentage points above the national rate.
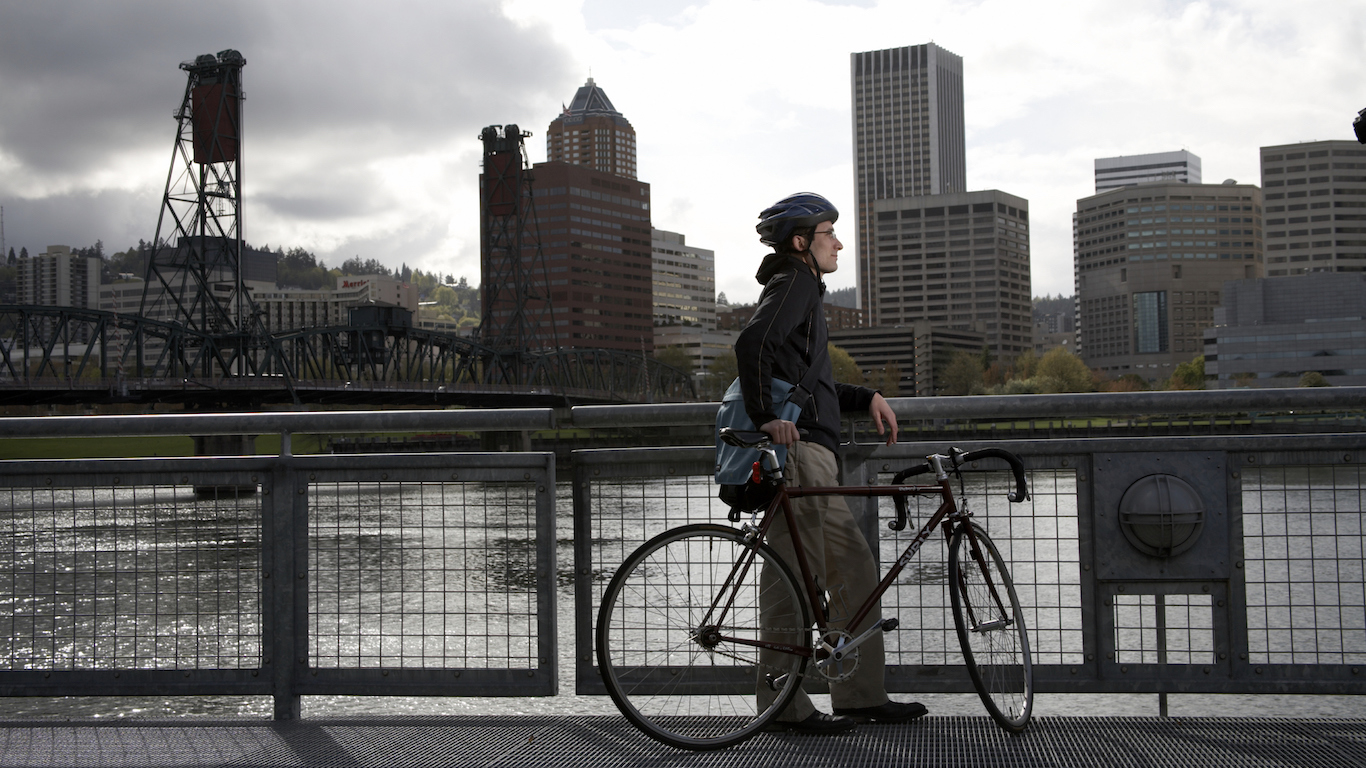
7. Oregon
> Pct. unemployed receiving benefits: 30.0% (21st highest)
> Pct. of average weekly wage covered: 39.2% (19th highest)
> Unemployment rate: 4.9% (20th highest)
> 1-yr. job growth: 4.7% (the largest increase)
Oregon’s economy improved rapidly in 2016. The state’s 4.7% annual job growth outpaced every other state and more than doubled the 1.7% nationwide growth rate. Partially as a result, the state’s annual unemployment rate fell from 5.6% in 2015 to 4.9% last year. Job growth has increased output in nearly every industry. Mining and logging was the only sector in the state to detract from GDP growth in 2016.
Oregon’s unemployed have other things going for them, as well. Oregon’s unemployed benefit from. For example, the average weekly unemployment insurance payout in Oregon covers 39.2% of the average weekly wage, a larger share than most states and well above the 34.1% national average.
[in-text-ad-2]
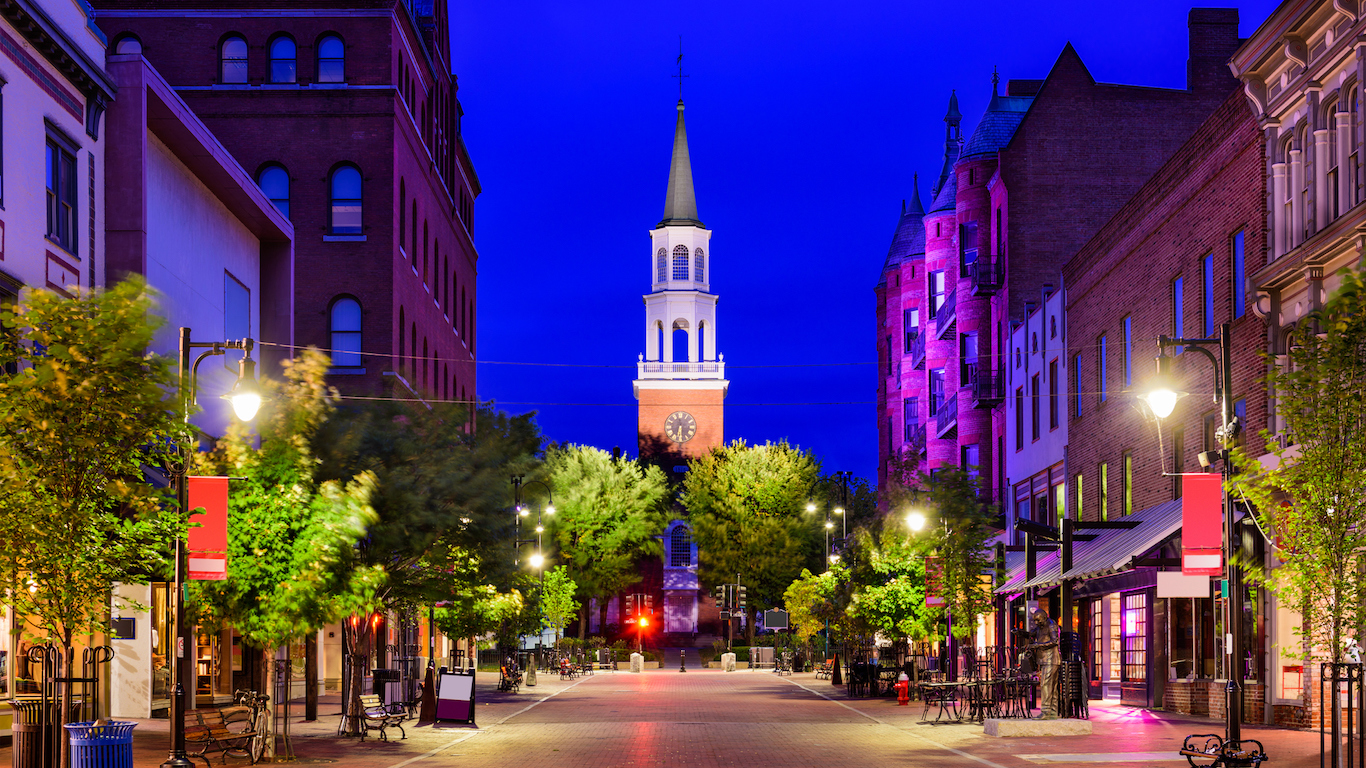
6. Vermont
> Pct. unemployed receiving benefits: 44.0% (5th highest)
> Pct. of average weekly wage covered: 40.3% (13th highest)
> Unemployment rate: 3.3% (7th lowest)
> 1-yr. job growth: 0.2% (9th smallest increase)
Unemployed workers in Vermont are more likely to find a job before exhausting their jobless benefits than most Americans. Just 3.3% of the state’s labor force is out of work, far less than the 4.9% nationwide unemployment rate. While Vermont residents are allowed to receive unemployment insurance — UI — for a maximum of 26 weeks, the average jobless worker stays on UI programs for roughly half that time. Only 15% of unemployment recipients in Vermont max out their benefit programs, the second smallest share of any state and less than half the 37% national rate.
Vermont also has some of the most comprehensive unemployment coverage of any state. Roughly 44% of unemployed workers in Vermont receive benefits, the fifth largest share in the country.
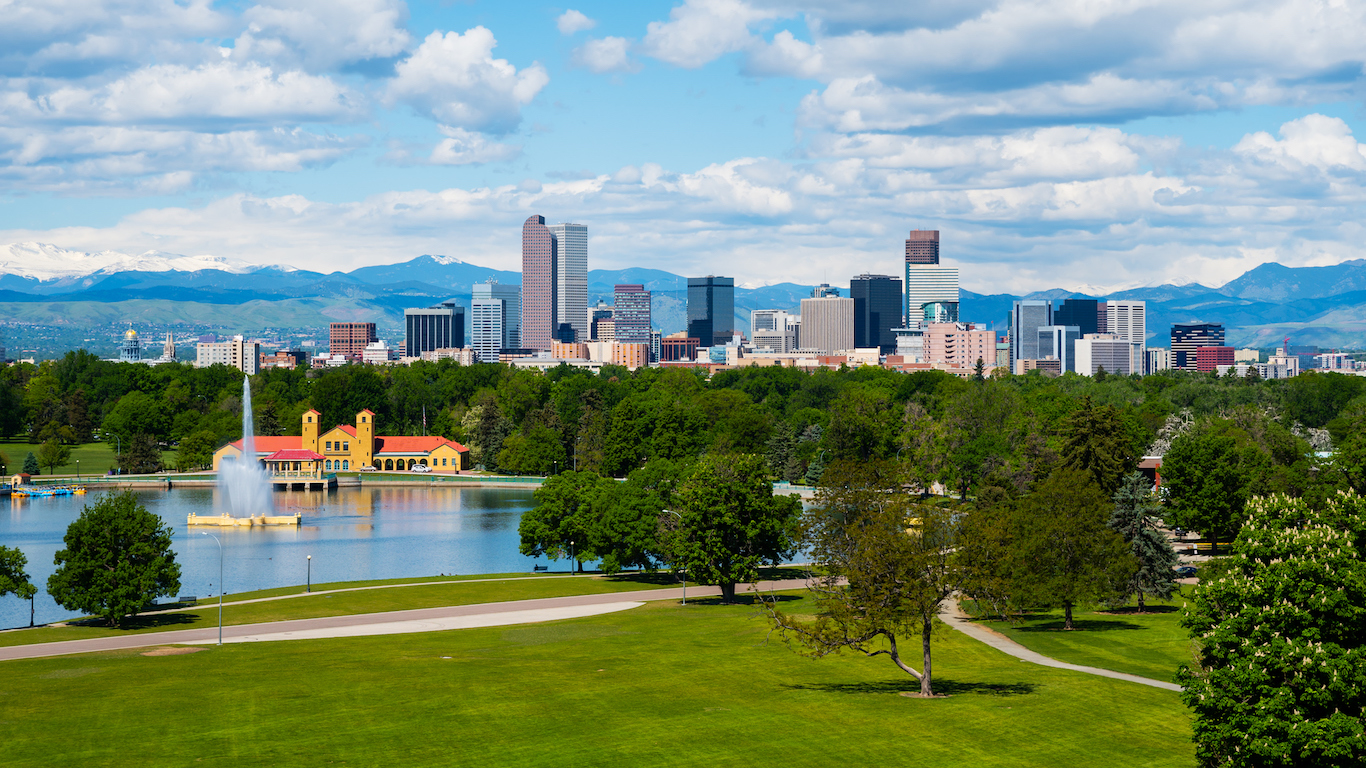
5. Colorado
> Pct. unemployed receiving benefits: 31.0% (18th highest)
> Pct. of average weekly wage covered: 40.0% (14th highest)
> Unemployment rate: 3.3% (7th lowest)
> 1-yr. job growth: 2.7% (9th largest increase)
Colorado is yet another western state to rank as one of the most favorable places for the unemployed. First, those who don’t have a job in the state are more likely to rejoin the ranks of the employed quickly. The unemployment rate, at 3.3%, is one of the lowest in the country, and the number of jobs increased by 2.7% in 2016, one of the largest such increases nationwide. For those Coloradans who do not quickly regain a job, benefits average over $1,000 per week, the 10th-highest of any state.
[in-text-ad]

4. Utah
> Pct. unemployed receiving benefits: 21.0% (17th lowest)
> Pct. of average weekly wage covered: 45.5% (4th highest)
> Unemployment rate: 3.4% (8th lowest)
> 1-yr. job growth: 3.3% (3rd largest increase)
Utah’s job market is healthier than that of nearly any state. Last year, state employment rose by 3.3%, the third most in the country and nearly double the job growth nationwide. The state’s 2016 unemployment rate of 3.4% is among the lowest of any state, and as of April 2017, it had fallen to just 3.1%. The state’s unemployment insurance recipiency rate of 21% is below that of most states. However, those who do receive UI benefits in the state tend to be generously covered. The average weekly UI benefits of $385 comes to 45.5% of weekly wages in Utah, the fourth highest in the country.

3. Massachusetts
> Pct. unemployed receiving benefits: 54.0% (2nd highest)
> Pct. of average weekly wage covered: 38.0% (24th highest)
> Unemployment rate: 3.7% (10th lowest)
> 1-yr. job growth: 1.5% (23rd largest increase)
The average unemployment insurance recipient in Massachusetts pockets about $488 a week in benefits, the second highest payout of any state after North Dakota. In addition to a higher unemployment income, Massachusetts residents are less likely to exhaust their benefits before they find a job. Only 34.2% of those receiving unemployment benefits exhaust them before returning to work, slightly less than the 36.9% share who do nationwide.
Workers in Massachusetts are also less likely to ever need unemployment benefits in the first place. Driven largely by jobs in the education and health services sector, as well as professional and business services jobs, Massachusetts’ economy is relatively strong. The state has an unemployment rate of only 3.7% — one of the lower figures in the country.

2. Hawaii
> Pct. unemployed receiving benefits: 36.0% (13th highest)
> Pct. of average weekly wage covered: 51.7% (2nd highest)
> Unemployment rate: 3.0% (3rd lowest)
> 1-yr. job growth: 2.1% (13th largest increase)
The average unemployment benefits payment covers 52% of the average Hawaiian paycheck, the largest share of any state other than North Dakota. While Hawaiians are allowed a maximum of 26 weeks of unemployment insurance, the average UI payment recipient in the state spends just 14 weeks on the program. Only 26% of UI beneficiaries in the state max out their benefits, far less than the 37% national exhaustion rate.
Like the U.S. as a whole, Hawaii’s job market has improved over the past year. As the number of jobs in the state rose 2.1% between 2015 and 2016, the unemployment rate fell from 3.6% to 3.0% in 2016 — the third lowest annual unemployment rate nationwide.
[in-text-ad-2]

1. North Dakota
> Pct. unemployed receiving benefits: 63.0% (the highest)
> Pct. of average weekly wage covered: 54.6% (the highest)
> Unemployment rate: 3.2% (5th lowest)
> 1-yr. job growth: 0.1% (8th smallest increase)
While losing one’s job is by no means a desirable turn of events, you are best off having it happen in North Dakota. A staggering 63% of North Dakota’s receive benefits, the most of any state and more than double the national rate. This rate is also almost 10 percentage points above the state with the second highest recipiency rate, Massachussetts.
North Dakota’s UI benefits are also perhaps the most generous in the country. The average unemployed American receives $344 in weekly benefits, amounting to 34% of lost weekly wages. North Dakotans, meanwhile, receive an average of $515 weekly, amounting to 63% of average lost wages in the state, each the highest such figure of any state.
Worst states to be unemployed:

10. New York
> Pct. unemployed receiving benefits: 35.0% (15th highest)
> Pct. of average weekly wage covered: 25.1% (3rd lowest)
> Unemployment rate: 4.8% (25th highest)
> 1-yr. job growth: 0.4% (12th smallest increase)
The average unemployment insurance recipient in New York only gets benefits worth about a quarter of the average weekly wage in the state, one of the smallest such shares in the country. In comparison, the average payout nationwide covers 34.1% of the weekly working wage.
New York’s job market expanded by less than half a percentage point in 2016 — less than a third the 1.7% nationwide employment growth. Slow job growth likely makes it harder for the state’s unemployed residents to find work. The typical out-of-work New Yorker receives unemployment benefits for 17.3 weeks before finding a job, slightly longer than the 15.5-week nationwide average.
[in-text-ad]
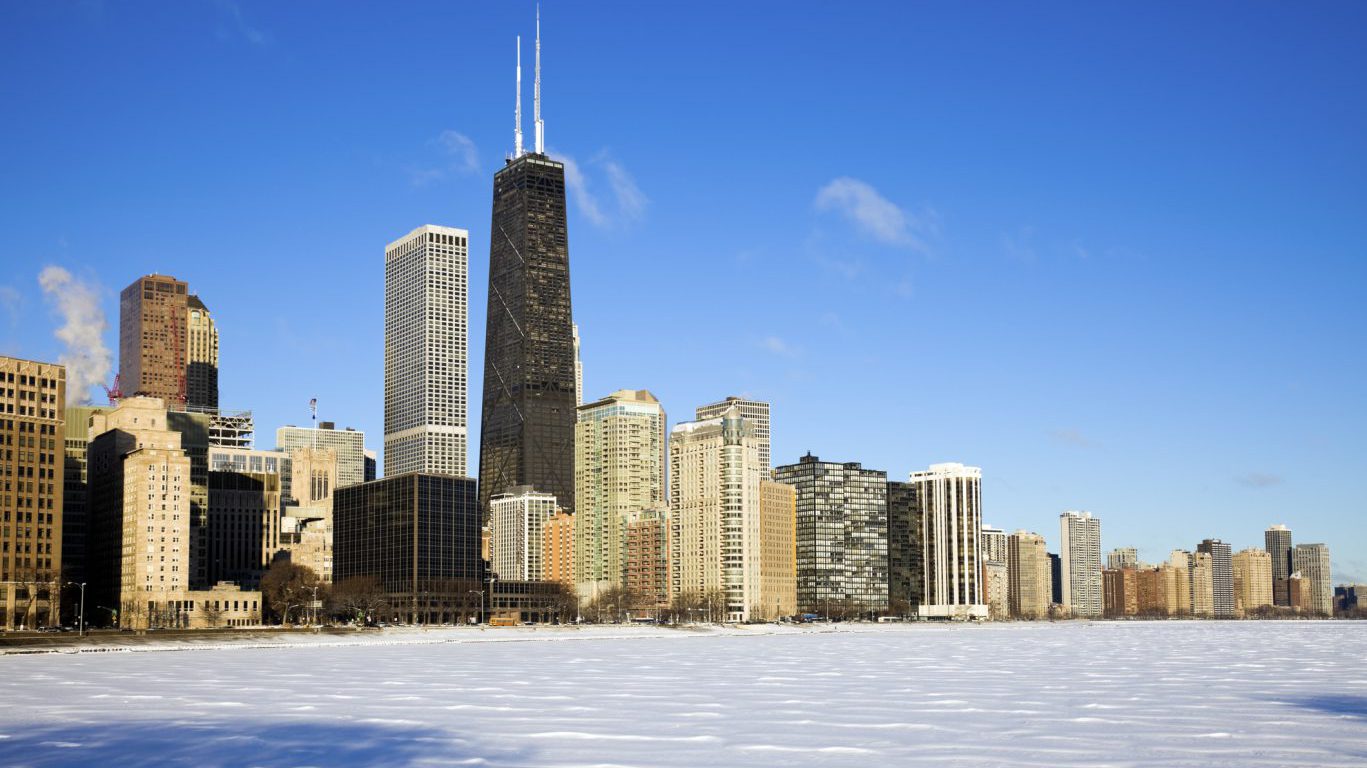
9. Illinois
> Pct. unemployed receiving benefits: 31.0% (18th highest)
> Pct. of average weekly wage covered: 33.7% (21st lowest)
> Unemployment rate: 5.9% (6th highest)
> 1-yr. job growth: 0.6% (14th smallest increase)
Compared to many of the other worst states to be unemployed, Illinois’ unemployment insurance benefits system tends to pay out more than most. Of the state’s 386,000 unemployed workers, 31% receive UI benefits, slightly above the national rate of 28%. It is also one of just 15 states to pay out over $1,000 on average per week. However, the cost of living and wages are higher in Illinois, so the $1,076 in average weekly benefits only comes to 33.9% of lost wages, slightly below the national average.
Those who are without a job in Illinois are likely to remain unemployed for some time. The state has the sixth highest unemployment rate of any state, and last year, employment increased by just 0.6%, about one third of the national growth rate.

8. North Carolina
> Pct. unemployed receiving benefits: 11.0% (2nd lowest)
> Pct. of average weekly wage covered: 27.6% (10th lowest)
> Unemployment rate: 5.1% (16th highest)
> 1-yr. job growth: 3.0% (5th largest increase)
In 2013, the North Carolina legislature enacted a law that prematurely cut all funding from the federal Emergency Unemployment Compensation program — which provided benefits to individuals who had exhausted their regular state benefits — before the program was set to expire. The bill immediately cut off unemployment insurance for about 170,000 workers, and lowered the maximum duration of benefits below the 26-week national median.
The share of unemployed workers receiving UI benefits in North Carolina fell from 24% in 2012 to just 11% in 2016, the second lowest rate of any state. Over the same period, the maximum duration of UI benefits fell from 26 weeks to 13 weeks, currently tied with Missouri as the second shortest of any state.

7. Florida
> Pct. unemployed receiving benefits: 9.0% (the lowest)
> Pct. of average weekly wage covered: 27.0% (8th lowest)
> Unemployment rate: 4.9% (20th highest)
> 1-yr. job growth: 2.9% (8th largest increase)
Half of all unemployment insurance recipients in Florida exhaust their benefits before finding work, the worst rate of any state. The state’s nation-leading UI benefit exhaustion rate can likely be ascribed in part to state policy. UI benefits extend for only 12 weeks in Florida, the shortest period of any state. The vast majority of states extend benefits for 26 weeks.
For unemployed Floridians who have not yet exhausted their benefits, UI payments are relatively small. The average weekly payout in Florida is only $239, or 27% of the average weekly wage in the state. In comparison, the average weekly benefit nationwide is $344, or 34.1% of the average weekly wage.
[in-text-ad-2]

6. Arizona
> Pct. unemployed receiving benefits: 16.0% (10th lowest)
> Pct. of average weekly wage covered: 24.5% (the lowest)
> Unemployment rate: 5.3% (13th highest)
> 1-yr. job growth: 3.1% (4th largest increase)
Arizona has one of the lowest UI recipiency rates of any state. Just 16% of those who are unemployed in Arizona received unemployment insurance, less than the 28% national figure.
For the small number of jobless workers who do receive unemployment insurance, the benefits are a comparatively poor replacement for lost wages. The average payment covers just 24.5% of the average weekly wage in Arizona, the lowest replacement rate of any state and far less than the 34.1% national figure.

5. New Mexico
> Pct. unemployed receiving benefits: 20.0% (16th lowest)
> Pct. of average weekly wage covered: 42.6% (9th highest)
> Unemployment rate: 6.7% (the highest)
> 1-yr. job growth: 0.2% (10th smallest increase)
Those who receive unemployment insurance benefits in New Mexico receive an average of $338 weekly. This is the equivalent of 42.6% of lost average weekly wages in the state, one of the higher replacement rates in the country. However, only a small share of New Mexicans receive UI benefits — just 20% of the unemployed — compared to a national recipiency rate of 28%.
Further, New Mexicans receiving benefits are more likely than those in most states to run out. About 40% of the state’s jobless exhaust their 26 weeks of benefits before finding another job. The high exhaustion rate is likely in part due to the relatively small number of job opportunities in the state, New Mexico’s unemployment rate of 6.7% is the highest in the country.
[in-text-ad]
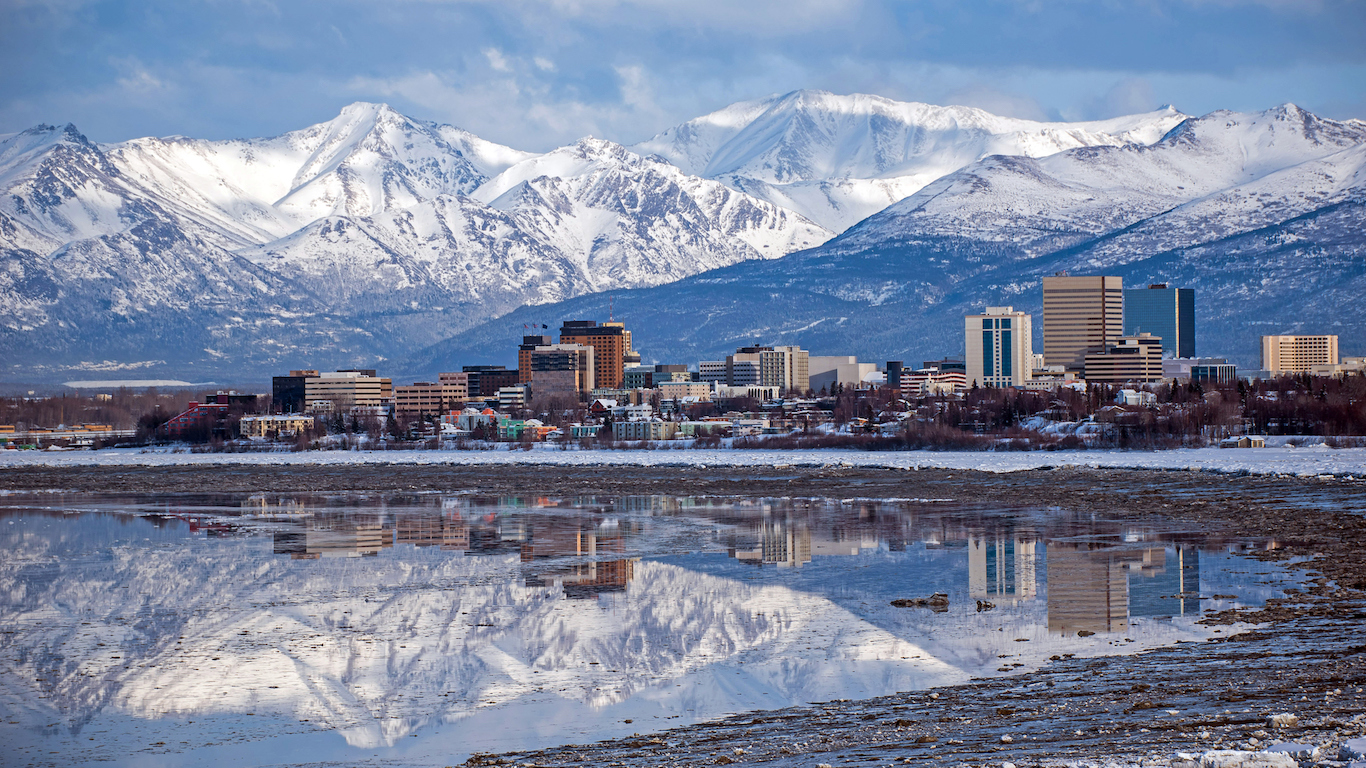
4. Alaska
> Pct. unemployed receiving benefits: 48.0% (3rd highest)
> Pct. of average weekly wage covered: 27.3% (9th lowest)
> Unemployment rate: 6.6% (2nd highest)
> 1-yr. job growth: -0.8% (2nd largest decline)
Some 6.6% of Alaska’s workforce are out of a job, the second highest annual employment rate in the country. That figure is up from 6.4% in 2015 — making the state one of only nine where the unemployment rate worsened.
Climbing unemployment coincided with a decrease in job opportunities in Alaska. The number of jobs in the state fell by 0.8% from 2015 to 2016, one of the steepest declines in the country. Alaska’s lagging job market means the state’s unemployed have fewer employment opportunities. Some 45% of unemployment insurance recipients exhaust their benefits before finding a job, one of the largest such shares of any state and well above the 37% rate nationwide.

3. Mississippi
> Pct. unemployed receiving benefits: 15.0% (7th lowest)
> Pct. of average weekly wage covered: 28.7% (11th lowest)
> Unemployment rate: 5.8% (7th highest)
> 1-yr. job growth: 1.4% (24th largest increase)
Mississippi has one of the highest unemployment rates in the country, at 5.8%. About 75,000 of the state’s labor force of 1.3 million are unemployed. Given the large number of state workers who file for benefits, as well as the fact that Mississippi’s government does not have the same resources as some of the more affluent states, it is not surprising that the state’s unemployment insurance benefits program is relatively sparse.
Just 15% of the state’s jobless receive UI benefits, about half the national rate. The average weekly benefit amount for that small group is just $206, the smallest of any state. Even given Mississippi’s relatively low cost of living and wages, this comes to just 28.7% of lost weekly wages, compared to the national replacement rate of 34.1%.

2. Alabama
> Pct. unemployed receiving benefits: 16.0% (10th lowest)
> Pct. of average weekly wage covered: 26.4% (6th lowest)
> Unemployment rate: 6.0% (4th highest)
> 1-yr. job growth: 0.9% (21st smallest increase)
Alabama has one of the highest unemployment rates of any state, and also has among the worst unemployment insurance coverage of nearly any state. Just 16% of those who are unemployed receive benefits, a small share compared to the 28% national figure. For the minority of jobless workers who do receive UI benefits in Alabama, unemployment insurance is a poor substitute for lost wages. The average payment amounts to just 26.4% of wages, the sixth smallest share of any state and far less than the 34.1% national figure.
[in-text-ad-2]

1. Louisiana
> Pct. unemployed receiving benefits: 12.0% (4th lowest)
> Pct. of average weekly wage covered: 25.2% (4th lowest)
> Unemployment rate: 6.1% (3rd highest)
> 1-yr. job growth: -1.6% (4th largest decline)
Unemployment insurance benefits in Louisiana are likely inadequate for many recipients. The average weekly payout only covers about 25% of the average weekly wage of working Louisiana residents, compared to a national average of 34.1%.
A flagging economy does not help the job prospects for the state’s unemployed residents. The number of jobs in Louisiana fell by 1.6% between 2015 and 2016, the second steepest drop of any state. The state’s annual unemployment rate stands at 6.1%, the third highest in the country and well above the 4.3% national unemployment rate. Several industries in Louisiana detracted from GDP growth in 2016, including finance, mining, and government, the largest sector by employment in the state.
Detailed Findings and Methodology:
Unemployment insurance is perhaps more important today than it has ever been. Due to changes in the workforce and the economy, Americans are spending more time unemployed than during any other period on record. While in 1970 the average unemployed U.S. worker spent 8.6 weeks between jobs, today the average duration of unemployment is 27.5 weeks.
While unemployment lasts nearly three times as long today, on average, as it did 50 years ago, a much smaller share of jobless Americans receive UI benefits. The recipiency rate — the share of unemployed workers receiving UI benefits — has fallen from around 40% in 1972 to 28% today, just slightly higher than the historic low reached in 2014. Some state UI programs, however, have a much wider reach than others. The recipiency rate is below 20% in 13 states, and above 40% in seven.
The degree to which unemployment insurance is effective depends on how much benefit payments compensate for lost wages. States determine the amount an involuntarily unemployed worker receives in benefits based on a preset proportion of the wages earned during his or her previous job, as well as a number of other factors. The replacement rate — the average weekly UI benefit amount as a share of average weekly earnings — is 34.1% nationwide.
Replacement rates are often higher in states with low unemployment, where UI claims are relatively low and UI benefits are spread across fewer recipients. Of the 15 states where the replacement rate is 40% or higher, 11 have unemployment rates below the 4.9% national figure.
In states with high unemployment and negative job growth, the chances of finding employment are worse, and the time spent on unemployment insurance is longer. Similarly, job seekers in states with the lowest unemployment likely have the best chances of returning to work in the shortest time. In 13 of the 15 states where unemployment is 4.0% or less, the average duration of UI recipiency is shorter than the 15.5-week national figure.
To identify the best (and worst) states to be unemployed in, 24/7 Wall St. generated a rank comprised of four measures: the UI recipiency rate, the average weekly benefit amount as a share of the average weekly wage, the unemployment rate, and one-year job growth. Data on unemployment, duration of unemployment, total employment, and employment by industry came from the Bureau of Labor Statistics and are for 2016. One-year job growth was calculated using annual employment figures for 2015 and 2016. Data on UI recipiency, income replacement, and UI benefit exhaustion came from the U.S. Department of Labor and are for the 12 months ending Q4 2016.
Are you ready for retirement? Planning for retirement can be overwhelming, that’s why it could be a good idea to speak to a fiduciary financial advisor about your goals today.
Start by taking this retirement quiz right here from SmartAsset that will match you with up to 3 financial advisors that serve your area and beyond in 5 minutes. Smart Asset is now matching over 50,000 people a month.
Click here now to get started.
Thank you for reading! Have some feedback for us?
Contact the 24/7 Wall St. editorial team.