
Americans purchased 17.54 million cars and light trucks in 2016 — more than ever before. While this has been a record year for a number of makes and models, not all vehicles are flying off dealership lots. Some models sit for months on end before finally being sold.
With data provided by vehicle research and valuation site Kelley Blue Book, 24/7 Wall St. reviewed the average number of days vehicles sat on U.S. dealership lots before selling in 2016. This measure, referred to as days to turn, is often used to estimate demand for certain models. It is not a perfect measure, though, as it also depends on supply. A model can have very high days to turn simply because manufacturers produced too many units. Generally, however, models with high days to turn have lower demand than models with low days to turn.
While many in-demand vehicles sell in just a few weeks once they reach a dealer’s lot, every model on this list typically remains unsold for at least four months. A few of these cars have an average days to turn of nearly half a year. Because large vehicles like SUVs, crossovers, and trucks have dominated U.S. auto sales recently, sedans, hatchbacks, and coupes make up the majority of vehicles Americans don’t want to buy.
Click here to see the cars Americans don’t want to buy.
Click here to see the detailed findings and methodology.
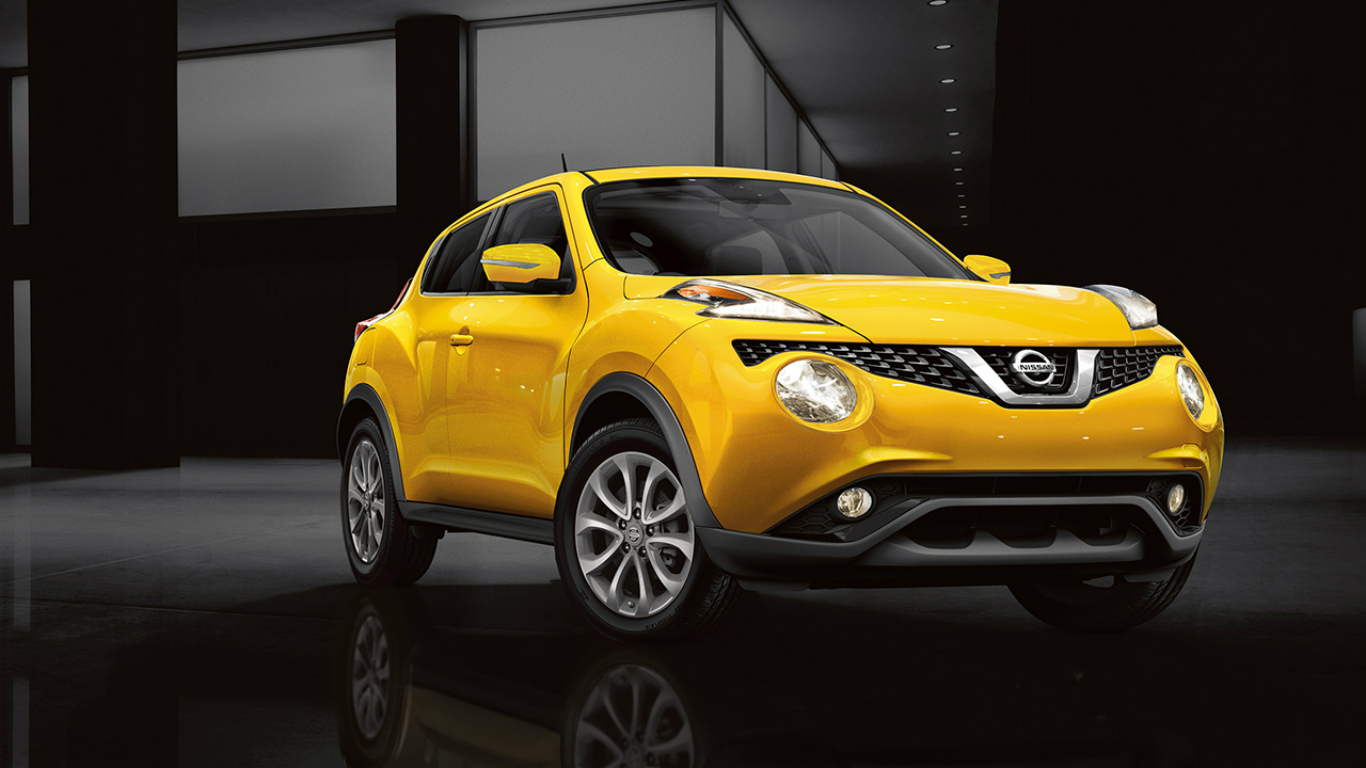
15. Nissan JUKE
> Avg. days on lot: 127.4
> 2016 sales: 19,577
> 2015-2016 sales change: -27.8%
> Starting at: $20,250
[in-text-ad]
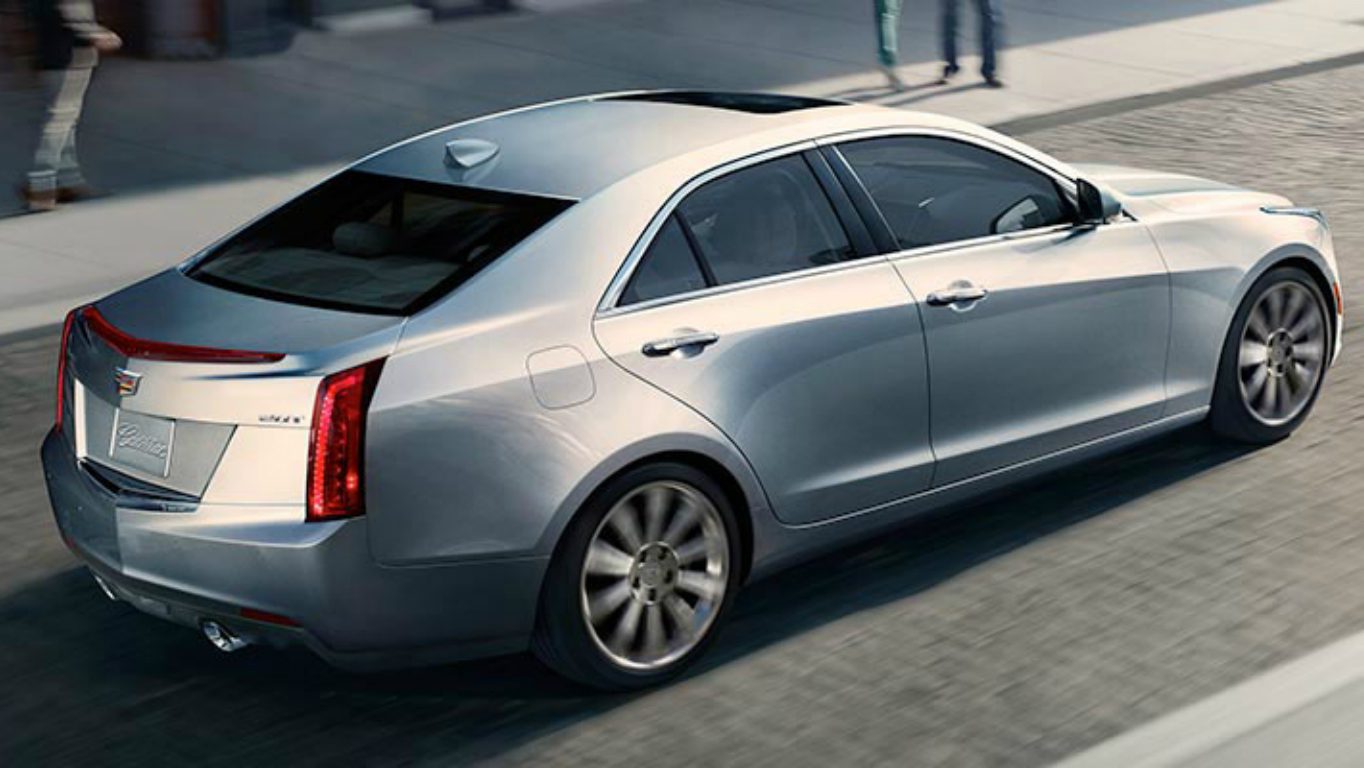
14. Cadillac ATS
> Avg. days on lot: 129.1
> 2016 sales: 21,505
> 2015-2016 sales change: -20.0%
> Starting at: $34,595
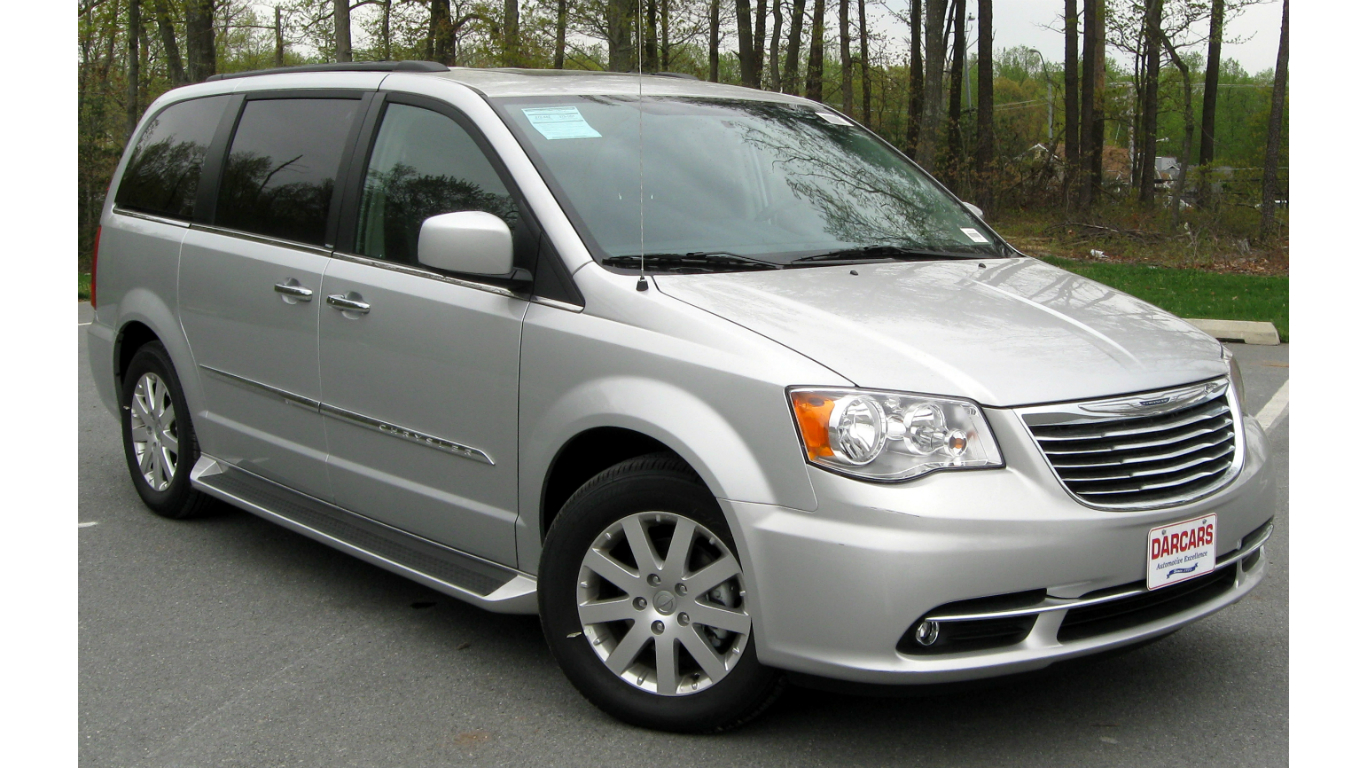
13. Chrysler Town & Country
> Avg. days on lot: 130.3
> 2016 sales: 59,071
> 2015-2016 sales change: -39.4%
> Starting at: N/A
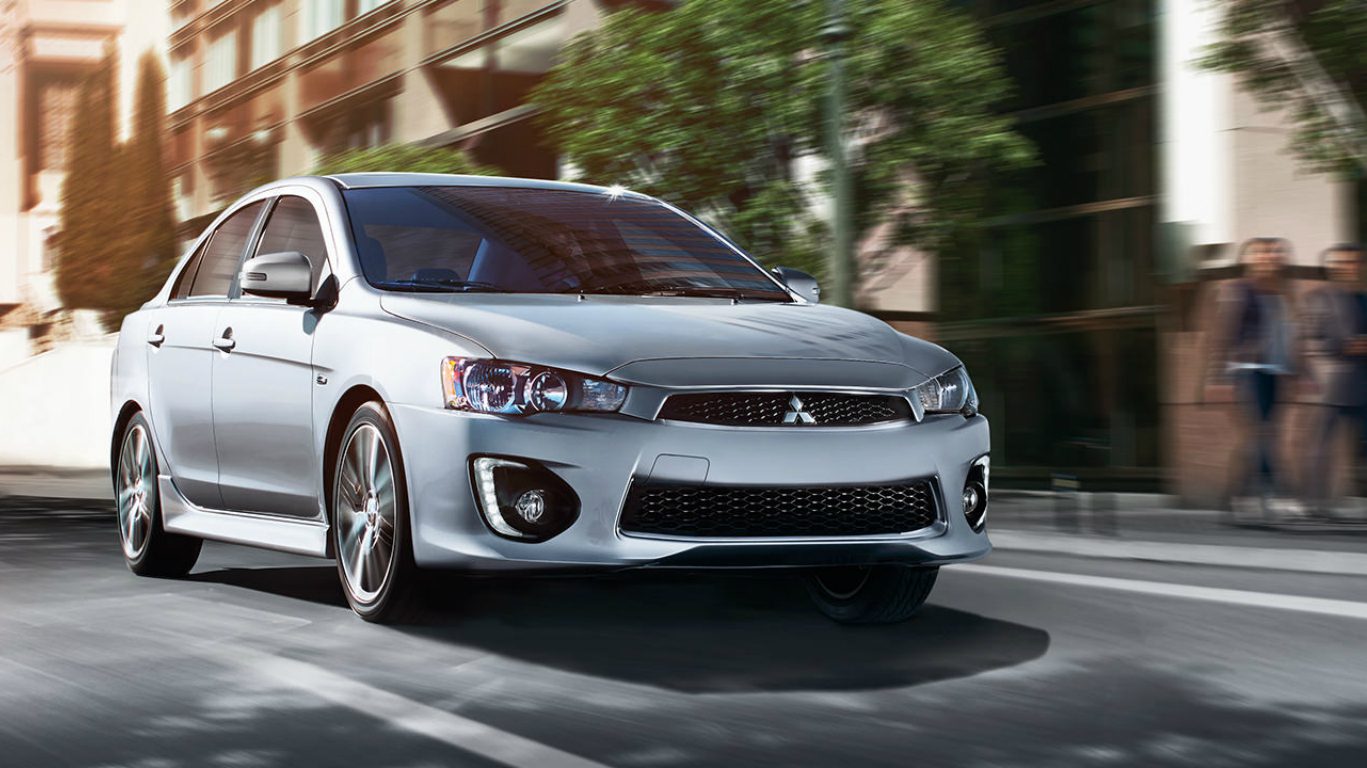
12. Mitsubishi Lancer
> Avg. days on lot: 131.1
> 2016 sales: 14,304
> 2015-2016 sales change: -19.1%
> Starting at: $17,795
[in-text-ad-2]

11. Nissan Quest
> Avg. days on lot: 131.8
> 2016 sales: 11,115
> 2015-2016 sales change: +0.9%
> Starting at: N/A
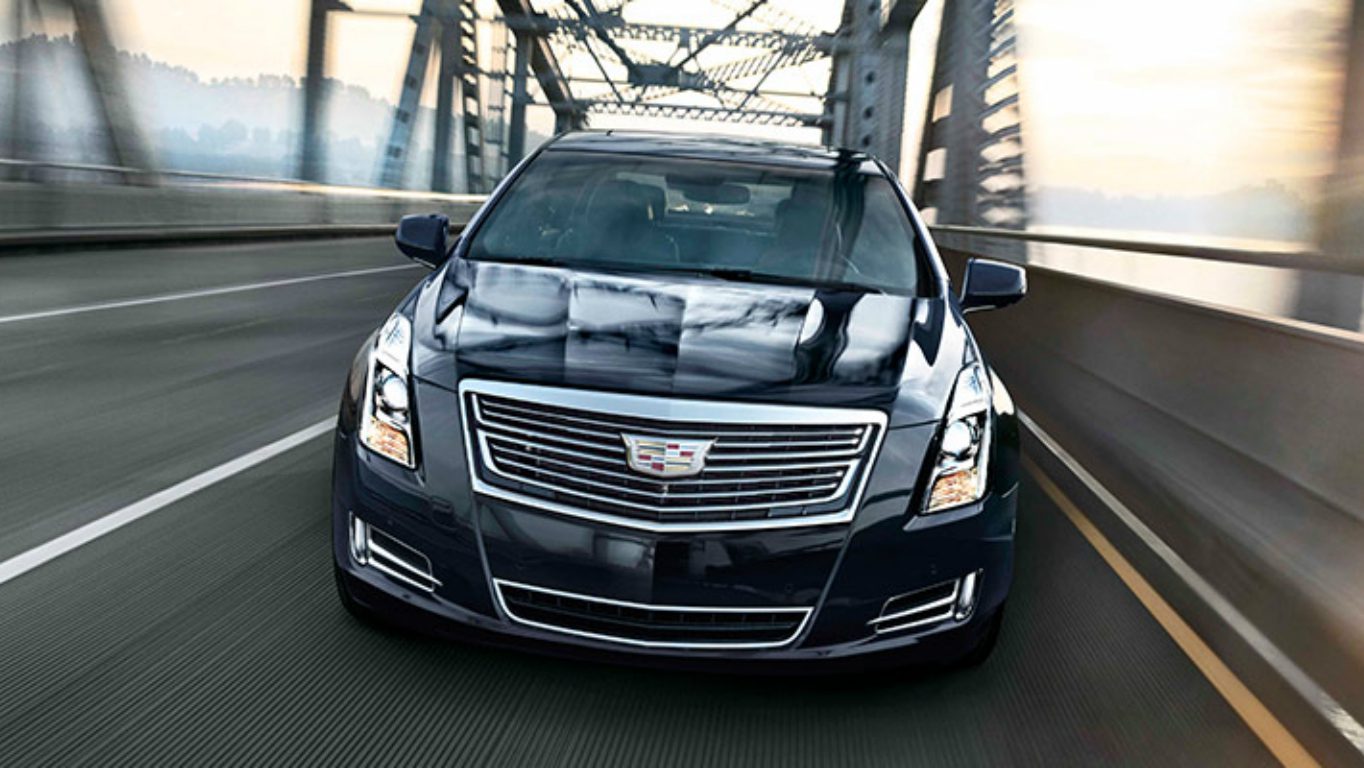
10. Cadillac XTS
> Avg. days on lot: 131.8
> 2016 sales: 22,171
> 2015-2016 sales change: -4.1%
> Starting at: $45,595
[in-text-ad]
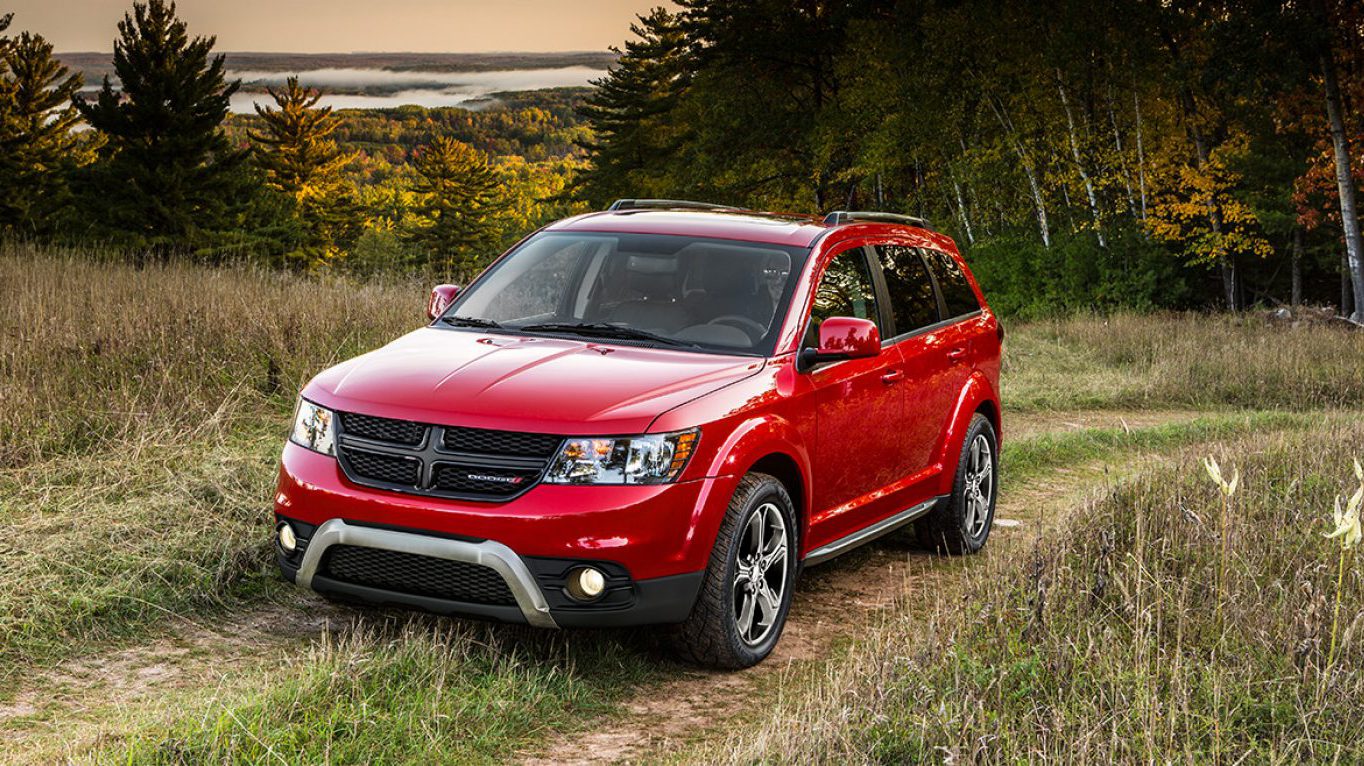
9. Dodge Journey
> Avg. days on lot: 133.1
> 2016 sales: 106,759
> 2015-2016 sales change: -1.2%
> Starting at: $21,195
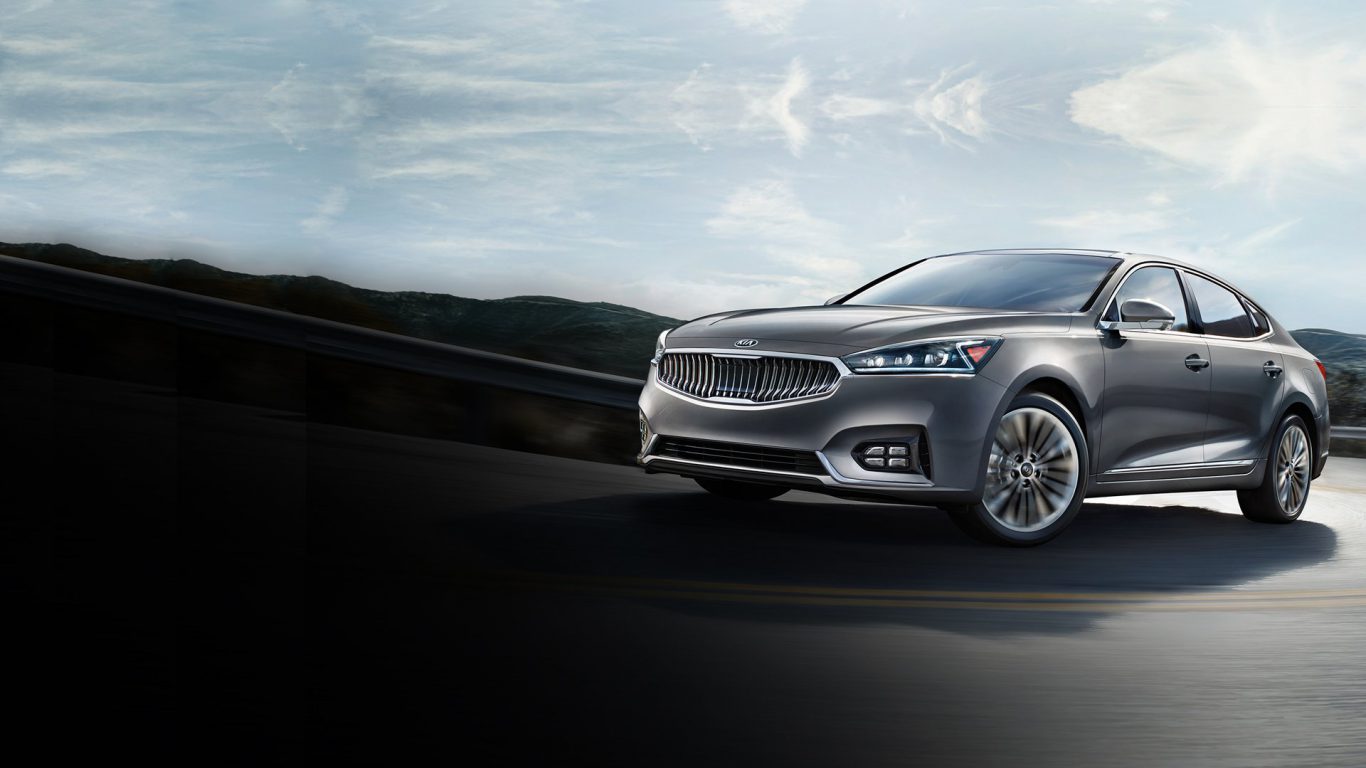
8. Kia Cadenza
> Avg. days on lot: 137.6
> 2016 sales: 4,738
> 2015-2016 sales change: -35.5%
> Starting at: $31,990

7. Fiat 500X
> Avg. days on lot: 146.0
> 2016 sales: 11,712
> 2015-2016 sales change: +3.1%
> Starting at: $19,995
[in-text-ad-2]
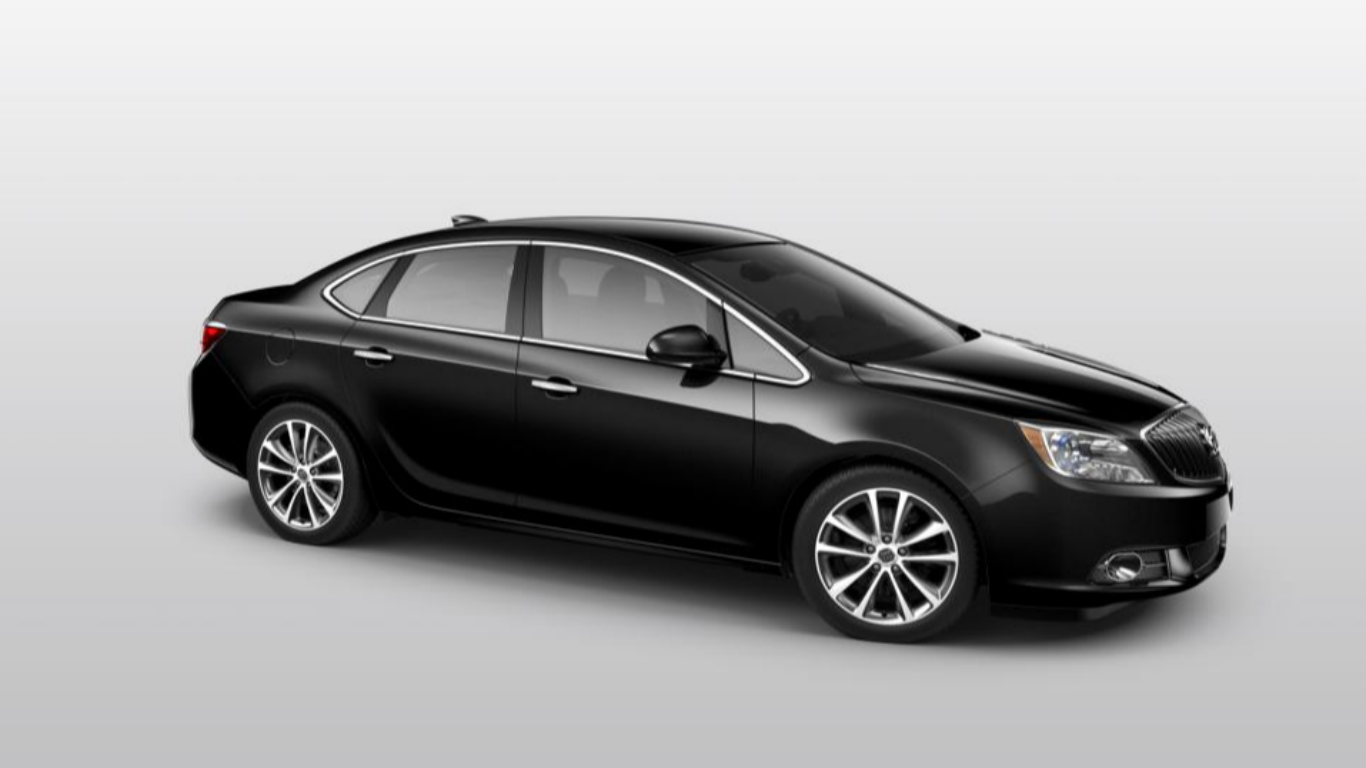
6. Buick Verano
> Avg. days on lot: 150.3
> 2016 sales: 30,277
> 2015-2016 sales change: -5.0%
> Starting at: $21,065
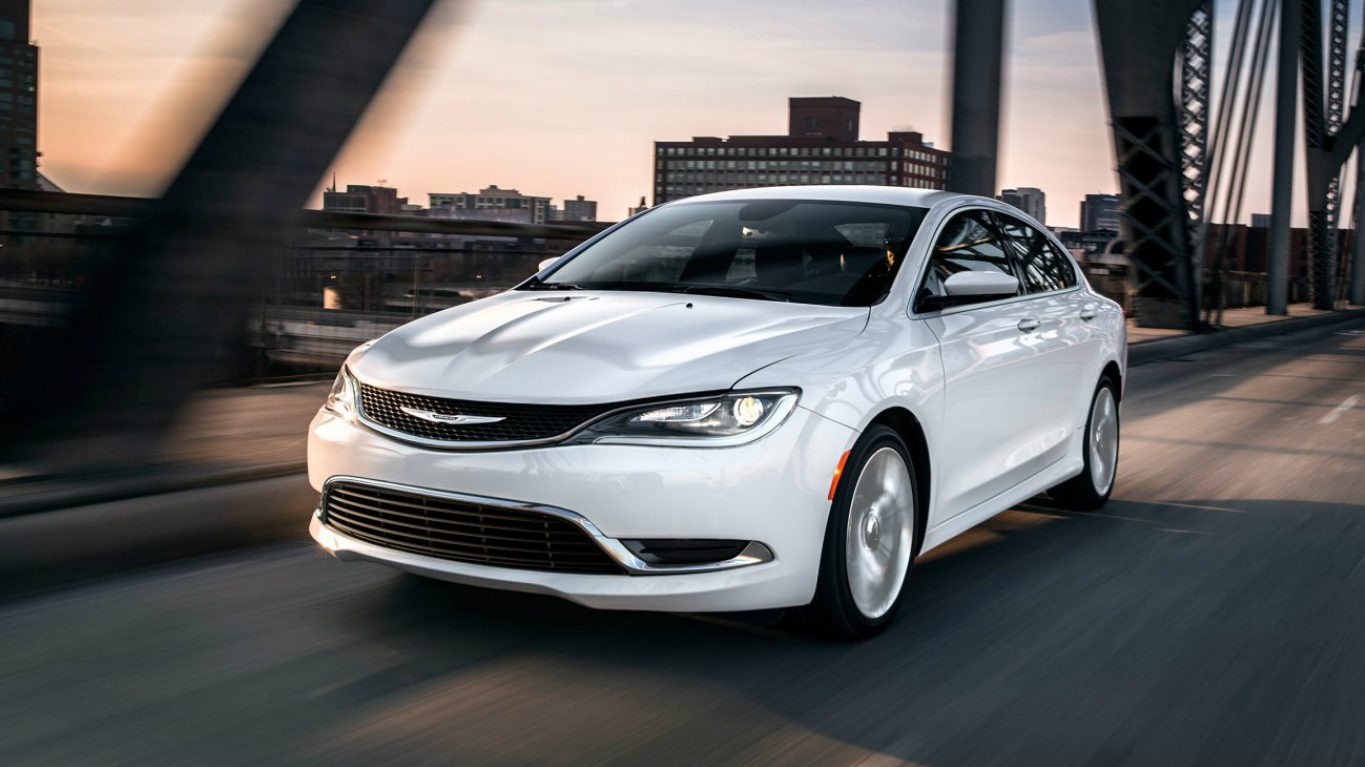
5. Chrysler 200
> Avg. days on lot: 150.5
> 2016 sales: 57,294
> 2015-2016 sales change: -65.8%
> Starting at: $22,610
[in-text-ad]
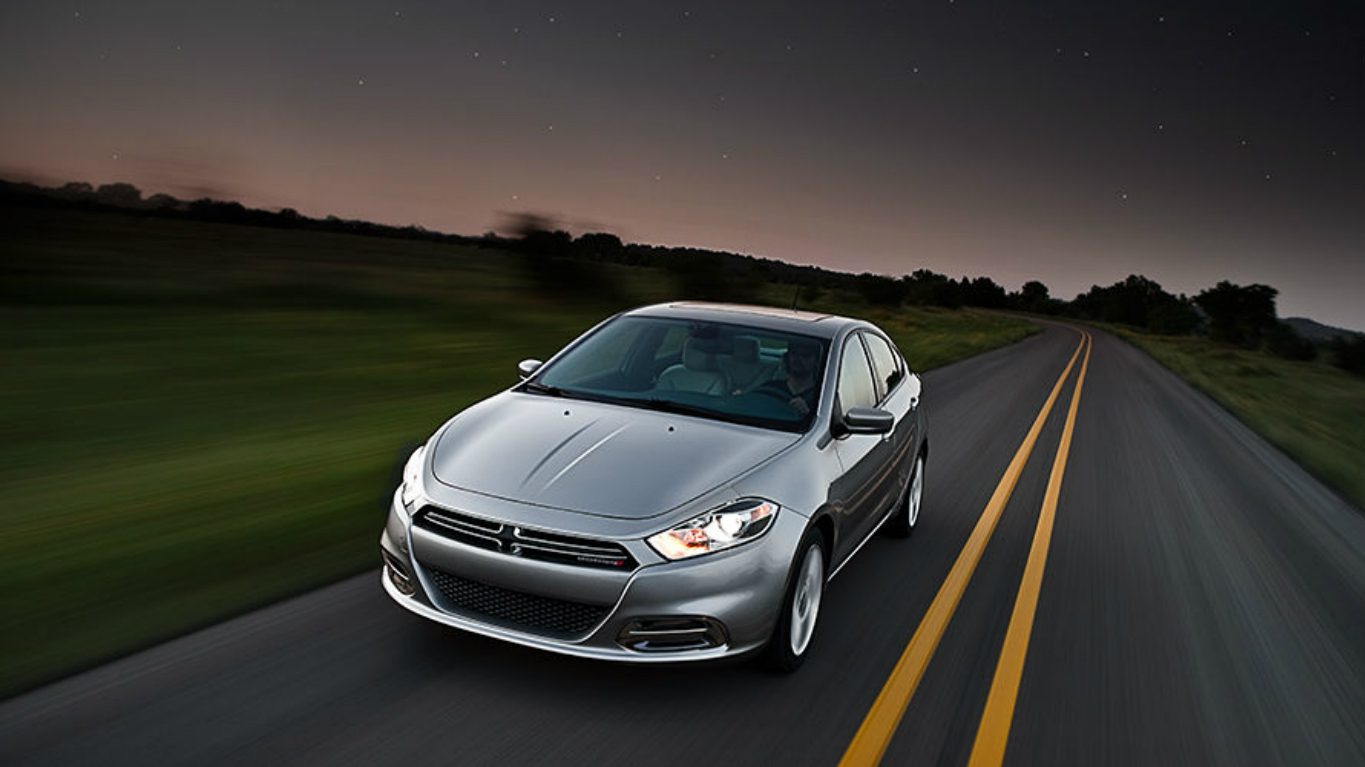
4. Dodge Dart
> Avg. days on lot: 150.7
> 2016 sales: 43,402
> 2015-2016 sales change: -50.6%
> Starting at: $16,995
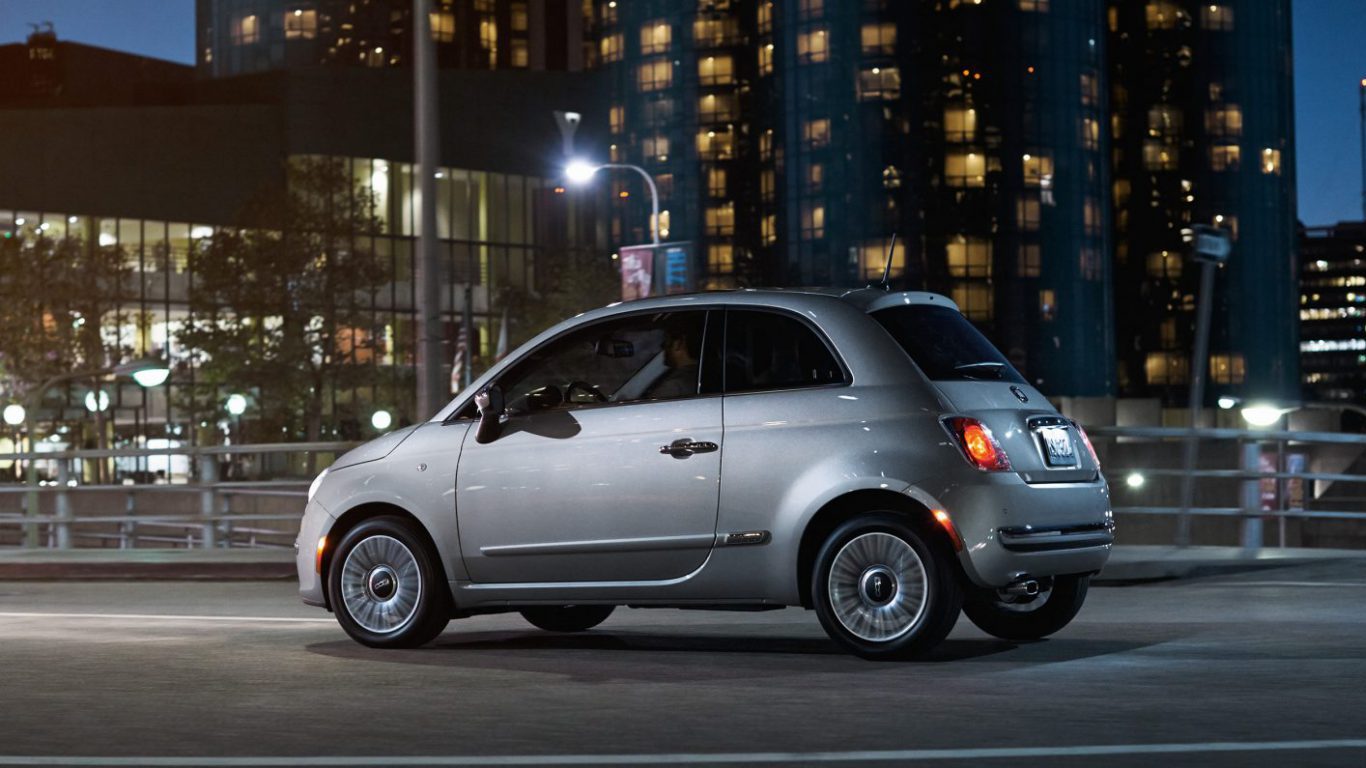
3. Fiat 500
> Avg. days on lot: 166.2
> 2016 sales: 15,437
> 2015-2016 sales change: -35.6%
> Starting at: $14,995
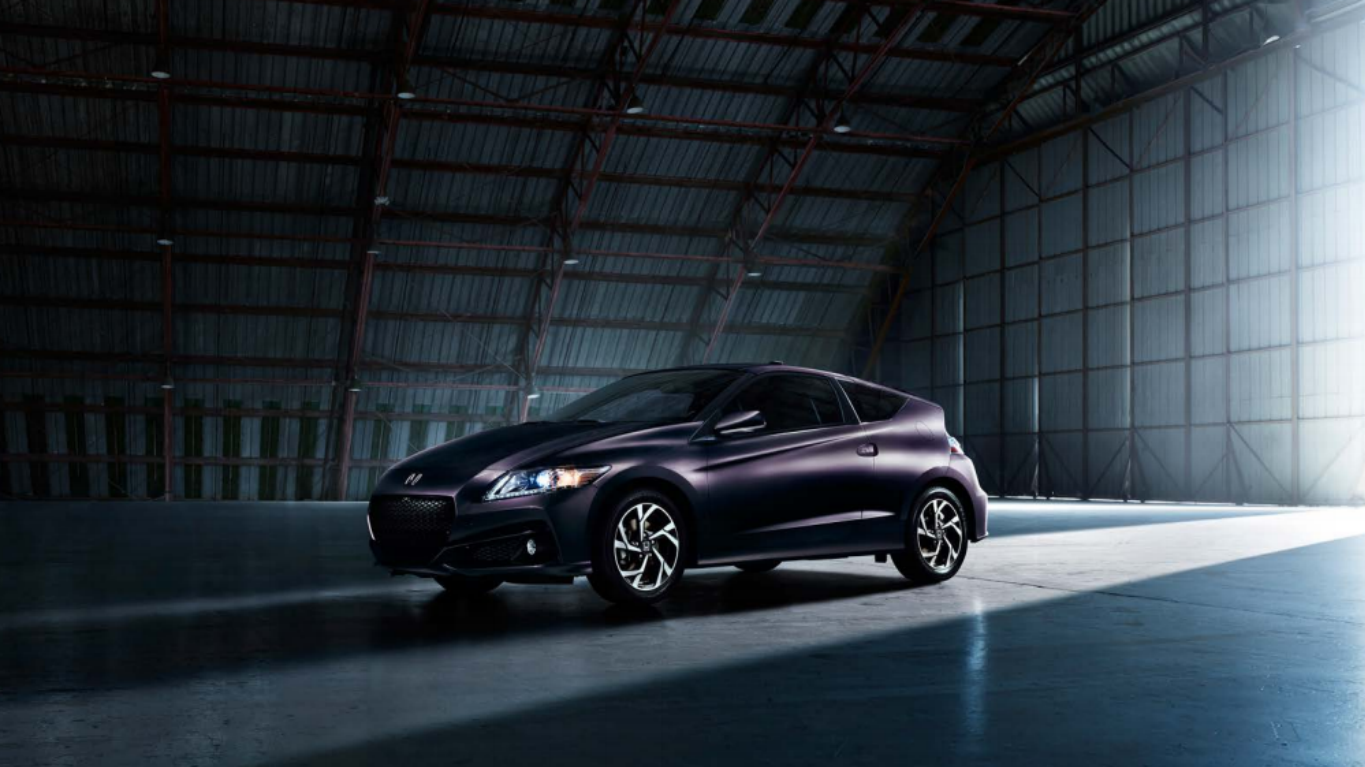
2. Honda CR-Z
> Avg. days on lot: 168.4
> 2016 sales: 2,338
> 2015-2016 sales change: -23.9%
> Starting at: N/A
[in-text-ad-2]

1. Fiat 500L
> Avg. days on lot: 174.6
> 2016 sales: 3,118
> 2015-2016 sales change: -58.9%
> Starting at: $20,995
Detailed Findings & Methodology
Manufacturers use historical sales data to help determine production levels for each model. Long turnover times at dealerships can indicate demand is significantly lower than what the manufacturer predicted — either due to overly optimistic projections or waning interest from buyers.
Speaking with 24/7 Wall St., KBB analyst Tim Fleming explained that this list shows the vehicles that are on their way out. “These are all cars that are winding down on their life cycle, and since they’re not being produced anymore, those units that are on the lots are just accumulating extra days, and that average is creeping up to very high numbers.”
In some cases, a model with high days to turn may be indicative of a poorly performing brand overall. While some top performing brands such as Subaru have no models on this list, Fiat has three, including the car with the highest days to turn — the Fiat 500L. Subaru has a strong brand, says Fleming, while Fiat has a weak brand.
SUVs and crossovers were the main drivers of industry growth in 2016, with 486,000 more units sold than in the previous year. In contrast, U.S. passenger car sales declined by 650,000 during the same period. While cars accounted for 52% of auto industry sales in the U.S. market in 2012, they accounted for just 39% of 2016 sales. This shift toward SUVs and crossovers has lowered demand for many of the cars on this list that are now in their final year of production.
To determine the cars Americans don’t want to buy, 24/7 Wall St. reviewed 2016 days to turn figures provided by Kelley Blue Book, a vehicle research and valuation company. The days to turn figure measures the average number of days a particular model spends on dealers’ lots until it is sold in a particular year. Additionally, Kelley Blue Book provided figures on U.S. sales by model for 2014, 2015, and 2016. Manufacturer’s suggested retail price (MSRP) figures come from the manufacturers’ websites.
The #1 Thing to Do Before You Claim Social Security (Sponsor)
Choosing the right (or wrong) time to claim Social Security can dramatically change your retirement. So, before making one of the biggest decisions of your financial life, it’s a smart idea to get an extra set of eyes on your complete financial situation.
A financial advisor can help you decide the right Social Security option for you and your family. Finding a qualified financial advisor doesn’t have to be hard. SmartAsset’s free tool matches you with up to three financial advisors who serve your area, and you can interview your advisor matches at no cost to decide which one is right for you.
Click here to match with up to 3 financial pros who would be excited to help you optimize your Social Security outcomes.
Have questions about retirement or personal finance? Email us at [email protected]!
By emailing your questions to 24/7 Wall St., you agree to have them published anonymously on a673b.bigscoots-temp.com.
By submitting your story, you understand and agree that we may use your story, or versions of it, in all media and platforms, including via third parties.
Thank you for reading! Have some feedback for us?
Contact the 24/7 Wall St. editorial team.
 24/7 Wall St.
 24/7 Wall St.

