Special Report
States Where the Most People Live With Their Parents

Published:
Last Updated:

The hopes and dreams of young adults in the United States usually involve financial success — and total independence from one’s parents. Achieving these dreams is by no means guaranteed. Young adults in the United States usually rely on varying levels of family support to get by. This ranges from help with the phone bill to living in your mom’s basement in your 30s.
Young people today are transitioning into adulthood in an entirely different way than previous generations. Traditionally, while starting a family and living independently were considered the most important aspects of becoming an adult, millennials do not mind forgoing some of that independence while they finish their education, hunt for a fulfilling job, and even for the sake of saving money.
Three-quarters of young people today think it is only somewhat important or not important to move out of their parents’ household. This new mindset is likely, at least in part, the result of increasing student debt, high unemployment among millennials, and general worries about financial well-being exacerbated by the recent recession. At the same time, the vast majority of people living at home are either enrolled in school or employed.
24/7 Wall St. reviewed the share of 18-34 year olds that live with their parents in each state. For reference, one in three Americans live with their parents. Economic factors seem to be the chief concern, as relatively expensive areas tend to have larger shares of young people who choose to remain in their parents’ household.
Click here to see the states where the most people live with their parents.
Click here to see the detailed findings and methodology.
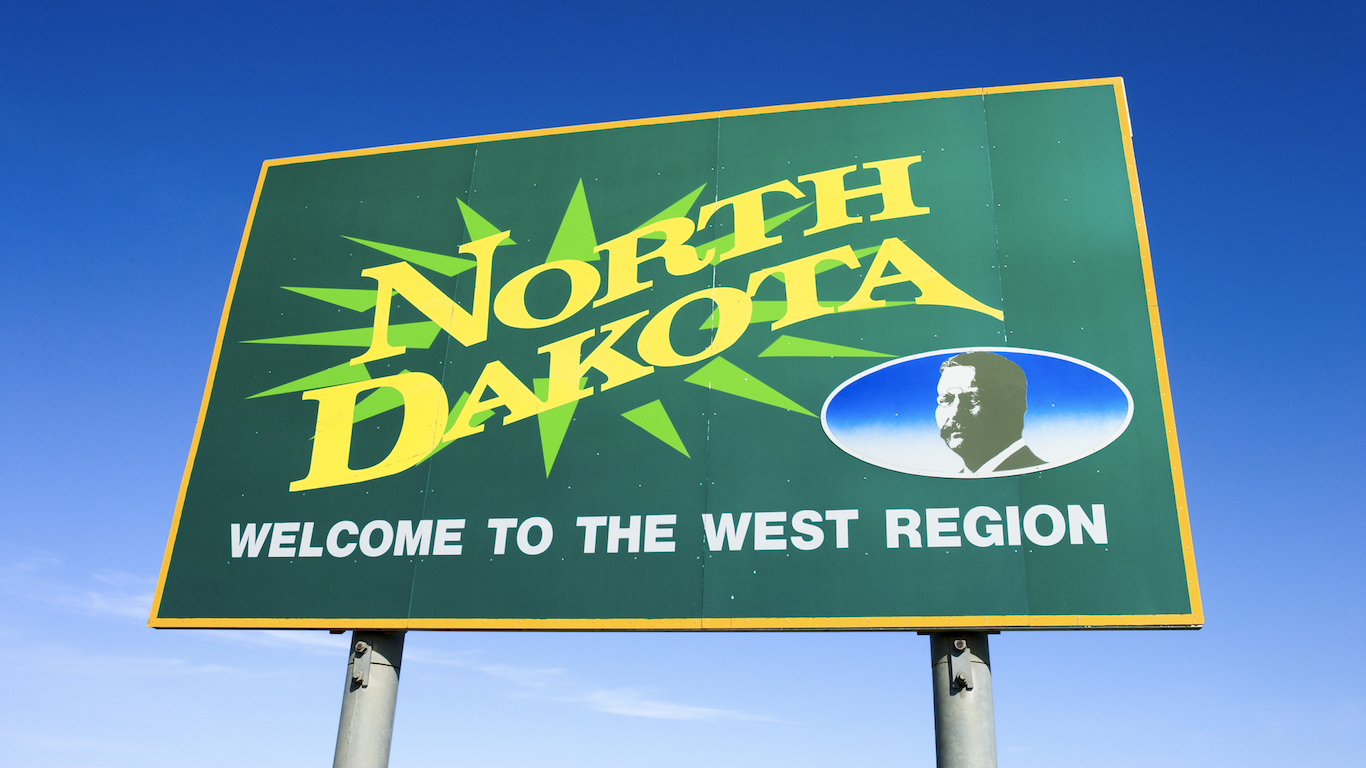
50. North Dakota
> 18-34 yr. old population living with parent 2015: 14.1%
> 18-34 yr. old population living with parent 2005: 17.6% (the lowest)
> Cost of living: 9.3% lower than nation (17th lowest)
> Median age to get married: 26.5 (5th youngest)
[in-text-ad]

49. South Dakota
> 18-34 yr. old population living with parent 2015: 19.9%
> 18-34 yr. old population living with parent 2005: 19.5% (tied-6th lowest)
> Cost of living: 13.6% lower than nation (4th lowest)
> Median age to get married: 26.3 (3rd youngest)

48. Wyoming
> 18-34 yr. old population living with parent 2015: 20.9%
> 18-34 yr. old population living with parent 2005: 18.1% (2nd lowest)
> Cost of living: 4.0% lower than nation (25th lowest)
> Median age to get married: 26.8 (8th youngest)

47. Nebraska
> 18-34 yr. old population living with parent 2015: 22.7%
> 18-34 yr. old population living with parent 2005: 20.2% (10th lowest)
> Cost of living: 10.4% lower than nation (13th lowest)
> Median age to get married: 27.7 (16th youngest)
[in-text-ad-2]

46. Iowa
> 18-34 yr. old population living with parent 2015: 22.8%
> 18-34 yr. old population living with parent 2005: 19.8% (tied-8th lowest)
> Cost of living: 10.7% lower than nation (11th lowest)
> Median age to get married: 27.3 (11th youngest)

45. Montana
> 18-34 yr. old population living with parent 2015: 24.1%
> 18-34 yr. old population living with parent 2005: 19.5% (tied-6th lowest)
> Cost of living: 6.2% lower than nation (23rd lowest)
> Median age to get married: 28.0 (20th youngest)
[in-text-ad]

44. Colorado
> 18-34 yr. old population living with parent 2015: 24.6%
> 18-34 yr. old population living with parent 2005: 18.6% (4th lowest)
> Cost of living: 2.0% higher than nation (12th highest)
> Median age to get married: 28.4 (24th oldest)

43. Kansas
> 18-34 yr. old population living with parent 2015: 26.0%
> 18-34 yr. old population living with parent 2005: 21.4% (14th lowest)
> Cost of living: 10.3% lower than nation (14th lowest)
> Median age to get married: 26.8 (7th youngest)

42. Washington
> 18-34 yr. old population living with parent 2015: 26.6%
> 18-34 yr. old population living with parent 2005: 21.2% (12th lowest)
> Cost of living: 3.8% higher than nation (10th highest)
> Median age to get married: 28.1 (21st youngest)
[in-text-ad-2]

41. Oregon
> 18-34 yr. old population living with parent 2015: 26.7%
> 18-34 yr. old population living with parent 2005: 18.5% (3rd lowest)
> Cost of living: 1.0% lower than nation (17th highest)
> Median age to get married: 29.1 (14th oldest)

40. Oklahoma
> 18-34 yr. old population living with parent 2015: 26.7%
> 18-34 yr. old population living with parent 2005: 21.3% (13th lowest)
> Cost of living: 11.0% lower than nation (9th lowest)
> Median age to get married: 26.7 (6th youngest)
[in-text-ad]

39. Idaho
> 18-34 yr. old population living with parent 2015: 26.9%
> 18-34 yr. old population living with parent 2005: 19.8% (tied-8th lowest)
> Cost of living: 7.1% lower than nation (tied-21st lowest)
> Median age to get married: 26.1 (2nd youngest)

38. Minnesota
> 18-34 yr. old population living with parent 2015: 27.3%
> 18-34 yr. old population living with parent 2005: 22.9% (tied-18th lowest)
> Cost of living: 2.5% lower than nation (21st highest)
> Median age to get married: 28.3 (25th youngest)

37. Wisconsin
> 18-34 yr. old population living with parent 2015: 27.4%
> 18-34 yr. old population living with parent 2005: 23.7% (23rd lowest)
> Cost of living: 7.1% lower than nation (tied-21st lowest)
> Median age to get married: 28.4 (22nd oldest)
[in-text-ad-2]

36. Arkansas
> 18-34 yr. old population living with parent 2015: 27.5%
> 18-34 yr. old population living with parent 2005: 22.5% (17th lowest)
> Cost of living: 14.3% lower than nation (2nd lowest)
> Median age to get married: 26.5 (4th youngest)

35. Utah
> 18-34 yr. old population living with parent 2015: 28.6%
> 18-34 yr. old population living with parent 2005: 21.7% (tied-15th lowest)
> Cost of living: 3.1% lower than nation (23rd highest)
> Median age to get married: 25.4 (the youngest)
[in-text-ad]

34. Missouri
> 18-34 yr. old population living with parent 2015: 28.6%
> 18-34 yr. old population living with parent 2005: 23.4% (22nd lowest)
> Cost of living: 11.9% lower than nation (8th lowest)
> Median age to get married: 27.4 (13th youngest)

33. Alaska
> 18-34 yr. old population living with parent 2015: 30.0%
> 18-34 yr. old population living with parent 2005: 24.0% (24th lowest)
> Cost of living: 5.7% higher than nation (8th highest)
> Median age to get married: 27.2 (10th youngest)

32. Kentucky
> 18-34 yr. old population living with parent 2015: 30.0%
> 18-34 yr. old population living with parent 2005: 25.0% (tied-21st highest)
> Cost of living: 12.7% lower than nation (5th lowest)
> Median age to get married: 27.1 (9th youngest)
[in-text-ad-2]

31. Vermont
> 18-34 yr. old population living with parent 2015: 30.4%
> 18-34 yr. old population living with parent 2005: 24.7% (tied-23rd highest)
> Cost of living: 1.2% higher than nation (14th highest)
> Median age to get married: 30.0 (4th oldest)

30. North Carolina
> 18-34 yr. old population living with parent 2015: 31.1%
> 18-34 yr. old population living with parent 2005: 21.7% (tied-15th lowest)
> Cost of living: 9.1% lower than nation (18th lowest)
> Median age to get married: 28.2 (24th youngest)
[in-text-ad]

29. Ohio
> 18-34 yr. old population living with parent 2015: 31.3%
> 18-34 yr. old population living with parent 2005: 25.8% (17th highest)
> Cost of living: 12.0% lower than nation (7th lowest)
> Median age to get married: 28.6 (17th oldest)

28. Nevada
> 18-34 yr. old population living with parent 2015: 31.3%
> 18-34 yr. old population living with parent 2005: 19.4% (5th lowest)
> Cost of living: 2.4% lower than nation (20th highest)
> Median age to get married: 28.8 (16th oldest)

27. Tennessee
> 18-34 yr. old population living with parent 2015: 31.4%
> 18-34 yr. old population living with parent 2005: 24.2% (25th lowest)
> Cost of living: 10.9% lower than nation (10th lowest)
> Median age to get married: 27.3 (12th youngest)
[in-text-ad-2]

26. Arizona
> 18-34 yr. old population living with parent 2015: 31.6%
> 18-34 yr. old population living with parent 2005: 20.4% (11th lowest)
> Cost of living: 3.7% lower than nation (25th highest)
> Median age to get married: 28.5 (19th oldest)

25. Maine
> 18-34 yr. old population living with parent 2015: 31.7%
> 18-34 yr. old population living with parent 2005: 25.0% (tied-21st highest)
> Cost of living: 3.0% lower than nation (22nd highest)
> Median age to get married: 28.4 (23rd oldest)
[in-text-ad]

24. Indiana
> 18-34 yr. old population living with parent 2015: 31.9%
> 18-34 yr. old population living with parent 2005: 23.2% (tied-20th lowest)
> Cost of living: 9.4% lower than nation (tied-16th lowest)
> Median age to get married: 27.8 (18th youngest)

23. Virginia
> 18-34 yr. old population living with parent 2015: 32.3%
> 18-34 yr. old population living with parent 2005: 24.7% (tied-23rd highest)
> Cost of living: 2.6% higher than nation (11th highest)
> Median age to get married: 28.5 (20th oldest)

22. West Virginia
> 18-34 yr. old population living with parent 2015: 32.9%
> 18-34 yr. old population living with parent 2005: 27.4% (15th highest)
> Cost of living: 12.5% lower than nation (6th lowest)
> Median age to get married: 28.1 (22nd youngest)
[in-text-ad-2]

21. Texas
> 18-34 yr. old population living with parent 2015: 33.2%
> 18-34 yr. old population living with parent 2005: 24.3% (25th highest)
> Cost of living: 3.5% lower than nation (24th highest)
> Median age to get married: 27.6 (14th youngest)

20. South Carolina
> 18-34 yr. old population living with parent 2015: 33.5%
> 18-34 yr. old population living with parent 2005: 25.7% (18th highest)
> Cost of living: 10.5% lower than nation (12th lowest)
> Median age to get married: 28.5 (21st oldest)
[in-text-ad]

19. Hawaii
> 18-34 yr. old population living with parent 2015: 33.7%
> 18-34 yr. old population living with parent 2005: 32.5% (4th highest)
> Cost of living: 16.8% higher than nation (the highest)
> Median age to get married: 28.6 (18th oldest)

18. Louisiana
> 18-34 yr. old population living with parent 2015: 33.8%
> 18-34 yr. old population living with parent 2005: 30.5% (tied-5th highest)
> Cost of living: 9.4% lower than nation (tied-16th lowest)
> Median age to get married: 28.3 (25th oldest)

17. Georgia
> 18-34 yr. old population living with parent 2015: 34.2%
> 18-34 yr. old population living with parent 2005: 23.2% (tied-20th lowest)
> Cost of living: 8.7% lower than nation (19th lowest)
> Median age to get married: 28.1 (23rd youngest)
[in-text-ad-2]

16. Michigan
> 18-34 yr. old population living with parent 2015: 34.9%
> 18-34 yr. old population living with parent 2005: 27.6% (tied-13th highest)
> Cost of living: 6.3% lower than nation (22nd lowest)
> Median age to get married: 29.0 (15th oldest)

15. Alabama
> 18-34 yr. old population living with parent 2015: 35.0%
> 18-34 yr. old population living with parent 2005: 26.9% (16th highest)
> Cost of living: 13.9% lower than nation (3rd lowest)
> Median age to get married: 27.6 (15th youngest)
[in-text-ad]

14. New Mexico
> 18-34 yr. old population living with parent 2015: 36.0%
> 18-34 yr. old population living with parent 2005: 25.6% (19th highest)
> Cost of living: 5.3% lower than nation (24th lowest)
> Median age to get married: 28.0 (19th youngest)

13. Delaware
> 18-34 yr. old population living with parent 2015: 36.2%
> 18-34 yr. old population living with parent 2005: 22.9% (tied-18th lowest)
> Cost of living: 1.9% higher than nation (13th highest)
> Median age to get married: 29.1 (13th oldest)

12. New Hampshire
> 18-34 yr. old population living with parent 2015: 36.5%
> 18-34 yr. old population living with parent 2005: 27.6% (tied-13th highest)
> Cost of living: 5.2% higher than nation (9th highest)
> Median age to get married: 29.4 (10th oldest)
[in-text-ad-2]

11. Illinois
> 18-34 yr. old population living with parent 2015: 36.5%
> 18-34 yr. old population living with parent 2005: 28.4% (11th highest)
> Cost of living: 0.7% higher than nation (15th highest)
> Median age to get married: 29.5 (9th oldest)

10. Mississippi
> 18-34 yr. old population living with parent 2015: 36.8%
> 18-34 yr. old population living with parent 2005: 30.3% (7th highest)
> Cost of living: 15.3% lower than nation (the lowest)
> Median age to get married: 27.8 (17th youngest)
[in-text-ad]

9. Massachusetts
> 18-34 yr. old population living with parent 2015: 37.0%
> 18-34 yr. old population living with parent 2005: 28.7% (9th highest)
> Cost of living: 7.1% higher than nation (7th highest)
> Median age to get married: 30.4 (the oldest)

8. Rhode Island
> 18-34 yr. old population living with parent 2015: 37.1%
> 18-34 yr. old population living with parent 2005: 28.6% (10th highest)
> Cost of living: 1.3% lower than nation (18th highest)
> Median age to get married: 30.4 (2nd oldest)

7. Pennsylvania
> 18-34 yr. old population living with parent 2015: 37.1%
> 18-34 yr. old population living with parent 2005: 30.5% (tied-5th highest)
> Cost of living: 1.8% lower than nation (19th highest)
> Median age to get married: 29.4 (12th oldest)
[in-text-ad-2]

6. California
> 18-34 yr. old population living with parent 2015: 38.1%
> 18-34 yr. old population living with parent 2005: 27.9% (12th highest)
> Cost of living: 12.4% higher than nation (4th highest)
> Median age to get married: 29.7 (8th oldest)

5. Florida
> 18-34 yr. old population living with parent 2015: 38.3%
> 18-34 yr. old population living with parent 2005: 25.3% (20th highest)
> Cost of living: 0.9% lower than nation (16th highest)
> Median age to get married: 29.4 (11th oldest)
[in-text-ad]

4. Maryland
> 18-34 yr. old population living with parent 2015: 38.5%
> 18-34 yr. old population living with parent 2005: 29.1% (8th highest)
> Cost of living: 10.3% higher than nation (5th highest)
> Median age to get married: 29.7 (7th oldest)

3. New York
> 18-34 yr. old population living with parent 2015: 40.6%
> 18-34 yr. old population living with parent 2005: 33.2% (2nd highest)
> Cost of living: 15.7% higher than nation (2nd highest)
> Median age to get married: 30.3 (3rd oldest)

2. Connecticut
> 18-34 yr. old population living with parent 2015: 41.6%
> 18-34 yr. old population living with parent 2005: 32.8% (3rd highest)
> Cost of living: 8.8% higher than nation (6th highest)
> Median age to get married: 29.9 (6th oldest)
[in-text-ad-2]

1. New Jersey
> 18-34 yr. old population living with parent 2015: 46.9%
> 18-34 yr. old population living with parent 2005: 36.1% (the highest)
> Cost of living: 14.5% higher than nation (3rd highest)
> Median age to get married: 29.9 (5th oldest)
Detailed Findings & Methodology
Most Americans believe completing one’s education should be a top priority for people facing adulthood. In a National Opinion Research Center survey, 60% of U.S. adults said it is extremely important to complete one’s schooling. In states where a large share of people graduate from college, especially with a graduate or professional degree, more people live with their parents.
Even after graduation, when student debt can contribute to financial insecurity, adults often choose to live with their parents.
Finding a full-time job and being economically secure is the next most important aspect of the transition to adulthood, according to the NORC survey. Since a low unemployment rate generally indicates that it is easier to find a job in an area, it is not especially surprising that states with the lowest jobless rates tend to have the lowest shares of people living with their parents. In contrast, states that have higher unemployment rates tend to have high shares of people living with their parents.
To identify the states where the most people live with their parents, 24/7 Wall St. reviewed the share of 18 to 34 year olds living with their parents in each state with data from the U.S. Census Bureau’s 2017 report, “The Changing Economics and Demographics of Young Adulthood: 1975–2016.” The cost of living in each state, or regional price parity, came from the Bureau of Economic Analysis and are for 2014. The median age of men and women when they were first married in each state came from the U.S. Census Bureau’s 2015 American Consumer Survey. We calculated an average age at first marriage weighted using the ratio of male to female populations in each state between 15-54 years old — the same age group considered within the male and female median age at first marriage figures.
Ever wanted an extra set of eyes on an investment you’re considering? Now you can speak with up to 3 financial experts in your area for FREE. By simply clicking here you can begin to match with financial professionals who can help guide you through the financial decisions you’re making. And the best part? The first conversation with them is free.Click here to match with up to 3 financial pros who would be excited to help you make financial decisions.
Thank you for reading! Have some feedback for us?
Contact the 24/7 Wall St. editorial team.