Special Report
39 Cities Where Most Americans Can't Afford Their Homes

Published:
Last Updated:

The U.S. Census recommends Americans spend no more than 30% of their income on housing costs per month. Still, an estimated 19 million U.S. households spend over 50% of their income on housing.
As the United States continues to recover from the housing crisis and recession, housing costs, including home prices and rent, are rising faster than incomes. While the recovering housing market is a boon for the economy, it is simultaneously saddling millions of Americans with additional financial burden.
Even at a higher affordability threshold, many American households simply cannot make the cut, particularly those in some major metropolitan areas. 24/7 Wall St. reviewed the share of households spending more than 36% of their income on housing based on data from “The State of the Nation’s Housing 2017,” a report compiled by the Joint Center for Housing Studies of Harvard University. In 39 major U.S. metropolitan areas the majority of households are spending beyond their means on housing.
Click here to see the cities where Americans can’t afford their homes.
Click here to see our detailed findings and methodology.

39. Eugene, OR
> Households able to afford monthly payments: 49.9%
> Median single-family house price: $220,700
> 2015 median household income: $47,318
> 5 yr. pop. change: 4.5%
The population of Eugene increased 4.5% between 2011 and 2016, slightly faster than the 3.7% national growth rate. The influx of new residents has likely driven demand for housing and has likely driven demand for housing and helped push prices of area homes higher. The typical monthly mortgage payment in Eugene became 18% more expensive in the past five years, a larger increase than in most metro areas. Today, the typical Eugene household spends 34.8% of its income on housing payments, one of the larger shares in the nation.
[in-text-ad]

38. Carson City, NV
> Households able to afford monthly payments: 49.6%
> Median single-family house price: $246,300
> 2015 median household income: $42,251
> 5 yr. pop. change: 0.0%
Based on 2016 median income projections, the typical home in Carson City costs about 6.1 times the median income in the area, well above the 4.1 home price-to-income ratio nationwide. As a result, housing is unaffordable for most area residents. The typical Carson City household spends about 44% of its monthly income on housing, while the typical American spends less than 30% of his or her monthly income.

37. Hilton Head Island-Bluffton-Beaufort, SC
> Households able to afford monthly payments: 49.1%
> Median single-family house price: $290,000
> 2015 median household income: $55,923
> 5 yr. pop. change: 11.7%
As the housing market improved since the recession, homes prices have gone up 25% faster than incomes between 2011 and 2016. The Hilton Head metro area bucked this trend as homes became 3% more affordable over the same time period. Still only 49% of all households, and 37.8% renters, spend a disproportionate share of their income on housing.

36. Mount Vernon-Anacortes, WA
> Households able to afford monthly payments: 49.1%
> Median single-family house price: $300,800
> 2015 median household income: $57,122
> 5 yr. pop. change: 5.0%
The Joint Center for Housing Studies of Harvard University defines affordable housing payments as spending less than 36% of a household’s income. While nationwide 41% of households typically pay about 36% of income on rent and mortgage payments, in the Mount Vernon metro area 51% of all households exceed the affordable housing payment threshold.
[in-text-ad-2]

35. Seattle-Tacoma-Bellevue, WA
> Households able to afford monthly payments: 48.6%
> Median single-family house price: $377,300
> 2015 median household income: $75,331
> 5 yr. pop. change: 8.6%
The Seattle metro area is among the most affluent in the United States. The typical area household earns $75,331 a year, roughly $20,000 more than the typical American household. Still, higher incomes are not enough to cover the area’s housing costs for a majority of residents. The price of a typical single family home in the area is $377,300, higher than in all but 18 other U.S. metro areas.
34. Reno, NV
> Households able to afford monthly payments: 48.6%
> Median single-family house price: $282,900
> 2015 median household income: $56,611
> 5 yr. pop. change: 6.7%
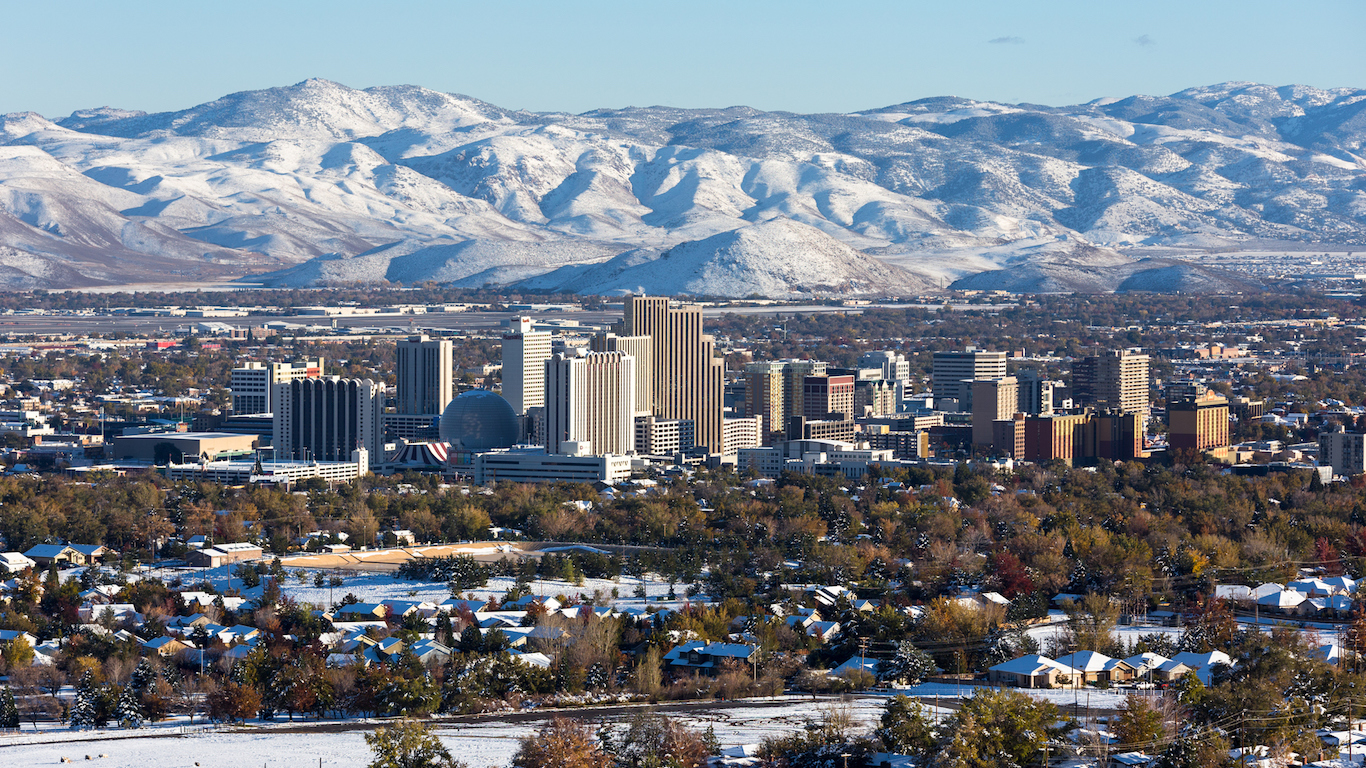
Few metro areas have reported a greater decrease in housing affordability in the last five years than Reno. Partially due to recovery from the housing crisis, housing prices have gone up 69.1% faster than incomes in the area between 2011 and 2016 — more than double the five-year change nationwide.
[in-text-ad]

33. Boston-Cambridge-Newton, MA-NH
> Households able to afford monthly payments: 48.3%
> Median single-family house price: $400,900
> 2015 median household income: $78,800
> 5 yr. pop. change: 4.0%
The typical Boston metro area household earns $78,800 a year, the eighth most of any city nationwide. Despite the area’s general wealth, many Boston households struggle to afford their housing payments. The typical home in Boston costs $400,900, more than five times the city’s median household income — one of the highest home price-to-income ratios of any metro.

32. Denver-Aurora-Lakewood, CO
> Households able to afford monthly payments: 48.0%
> Median single-family house price: $352,100
> 2015 median household income: $70,283
> 5 yr. pop. change: 9.7%
The population of the Denver metro area rose 9.7% from 2011 to 2016, one of the largest increases of any city. The influx of new residents has likely contributed to the rising cost of real estate in the area. The typical mortgage payment became 50% more expensive in the past five years, compared to a 28% increase nationwide. The typical Denver household now pays 37.9% of its income on housing, one of the largest shares in the United States.

31. Riverside-San Bernardino-Ontario, CA
> Households able to afford monthly payments: 48.0%
> Median single-family house price: $290,300
> 2015 median household income: $56,087
> 5 yr. pop. change: 5.3%
Real estate can be very expensive in California, and for many in the Riverside-San Bernardino metro area housing costs are a severe financial burden. About 15% of renters and 31% of homeowners spend over half of their income on housing, well above the respective nationwide shares of 10% and 26%.
[in-text-ad-2]

30. Vallejo-Fairfield, CA
> Households able to afford monthly payments: 47.0%
> Median single-family house price: $358,600
> 2015 median household income: $67,443
> 5 yr. pop. change: 5.7%
Situated between San Francisco and the Napa Valley wine region, it is no surprise that homes in the Vallejo-Fairfield metro area are expensive — but are nevertheless in high demand. The area’s population grew at a 5.7% pace in the last five years, faster than the national population growth rate. Partially due to increasing demand, the typical area home sells for about 5.7 times the area’s median income.

29. Santa Fe, NM
> Households able to afford monthly payments: 46.5%
> Median single-family house price: $290,800
> 2015 median household income: $55,676
> 5 yr. pop. change: 2.3%
The cost of the median monthly mortgage payment in Santa Fe fell 6.6% over the past five years, compared to a 28.0% increase nationwide. While the price of housing has fallen more in Sante Fe than in nearly any other metro area, the area remains among the least affordable in the United States. The typical household spends 38.6% of its income on home payments each month, one of the largest shares of any metro.
[in-text-ad]

28. Barnstable Town, MA
> Households able to afford monthly payments: 46.4%
> Median single-family house price: $362,300
> 2015 median household income: $66,102
> 5 yr. pop. change: -0.5%
The typical Barnstable Town household earns $66,102 a year, over $10,000 more than the $55,775 national median. Meanwhile, the median price for a single-family home in the area of $362,300 is nearly $127,000 more than the $235,500 national value. The median home payment is 38.7% of the metro area’s median income, one of the largest shares in the United States.

27. Medford, OR
> Households able to afford monthly payments: 45.6%
> Median single-family house price: $244,800
> 2015 median household income: $43,948
> 5 yr. pop. change: 5.7%
Over the last five years, housing across the United States has become less affordable, as home prices have increased 16.5% faster than incomes. However, Medford is one of a minority of metro areas that has become more affordable as housing costs — such as mortgages and rents — rose less than incomes. Still, despite income growth outpacing housing costs by 6.7% since 2011, only about 45.6% of Medford residents live in affordable housing.

26. Ocean City, NJ
> Households able to afford monthly payments: 45.5%
> Median single-family house price: $299,600
> 2015 median household income: $57,116
> 5 yr. pop. change: -2.3%
Across the vast majority of metro areas, housing costs increased faster than income over the past year. Ocean City, where incomes have gone up 0.8% faster than housing costs since 2015, is an exception. Despite increasing affordability, only 45.5% of all households, and and even a smaller 17.6% share of renters, can easily afford monthly housing costs.
[in-text-ad-2]

25. Stockton-Lodi, CA
> Households able to afford monthly payments: 45.2%
> Median single-family house price: $288,200
> 2015 median household income: $53,705
> 5 yr. pop. change: 5.6%
Partially due to the housing market recovery, housing costs in the Stockton-Lodi metro area have gone up 64.2% faster than area incomes in the last five years, and more than double the comparable increase nationwide. As of 2016, the typical home price in the area was 5.6 times the median household income, well above the 4.1 income-to-home price ratio nationwide.

24. New York-Newark-Jersey City, NY-NJ-PA
> Households able to afford monthly payments: 44.4%
> Median single-family house price: $388,200
> 2015 median household income: $68,743
> 5 yr. pop. change: 2.0%
Notorious for its high cost of living, the New York metro area has the highest share of severely burdened homeowners of any U.S. metro area. About 17% of area homeowners spend more than 50% of their income on housing, compared to only 10% of homeowners nationwide. Housing remains unaffordable for many New Yorkers, even as the area’s income growth has outpaced mortgage payment increases in the last year, a break from the national trend.
[in-text-ad]
23. Miami-Fort Lauderdale-West Palm Beach, FL
> Households able to afford monthly payments: 44.0%
> Median single-family house price: $282,300
> 2015 median household income: $50,441
> 5 yr. pop. change: 6.5%
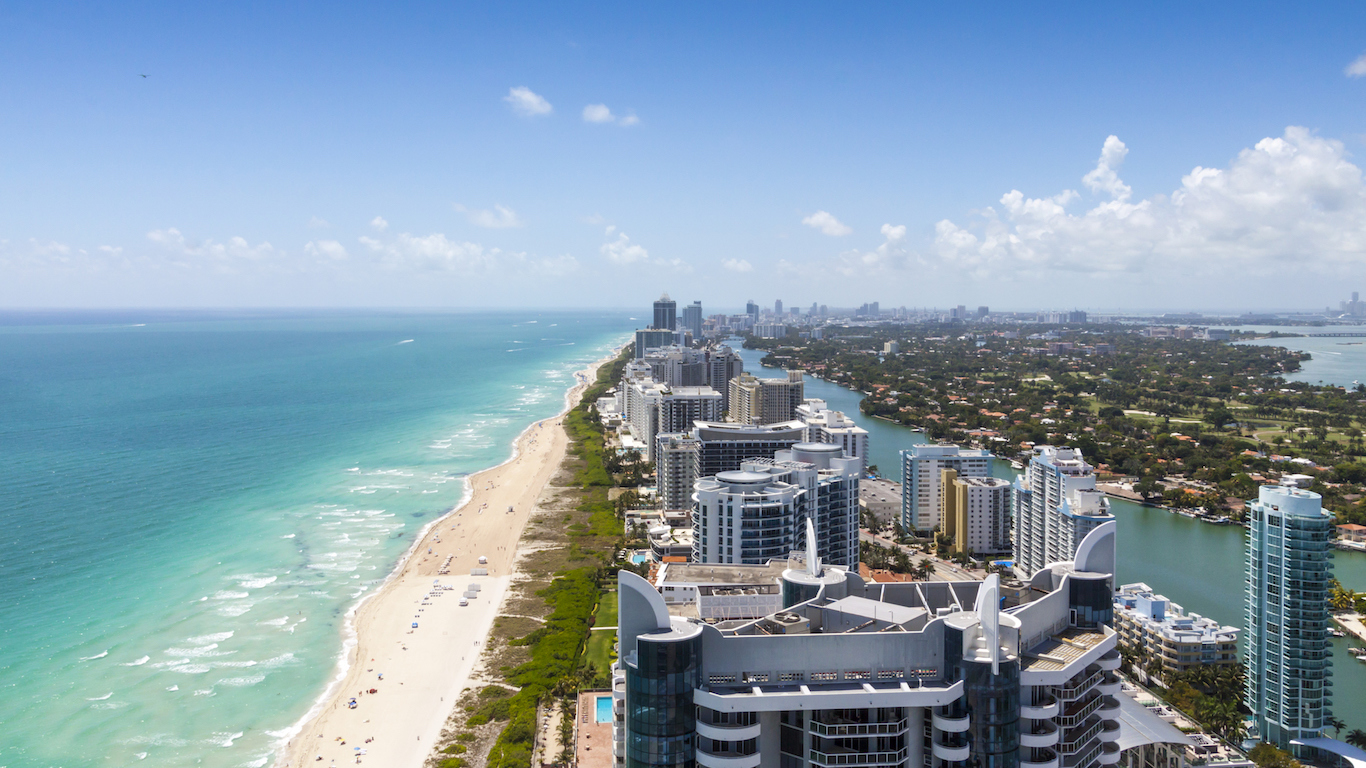
Although Miami has some of the most expensive homes in the country, incomes are not that high across the metro area. The typical Miami household earns $50,441 a year, about $5,000 less than the national median household income. Despite the lower incomes, the typical single-family home in the Miami metro area costs $282,300, nearly $47,000 more than the U.S. median home value and nearly six times the city’s estimated 2016 median household income — one of the highest such ratios nationwide.

22. Bellingham, WA
> Households able to afford monthly payments: 43.3%
> Median single-family house price: $317,300
> 2015 median household income: $55,016
> 5 yr. pop. change: 6.5%
The median home price in the Bellingham metro area has gone up 5.6% faster than incomes in the last year — nearly double the corresponding national home price-to-income ratio change. Rising home prices are also affecting renters. Just 22% of renters in the Bellingham metro area can comfortably budget their monthly housing costs.

21. Redding, CA
> Households able to afford monthly payments: 43.2%
> Median single-family house price: $259,800
> 2015 median household income: $46,693
> 5 yr. pop. change: 0.9%
The typical Redding household earns $46,693 a year, far less than the $55,775 national median household income. While the median household income in Redding is about $9,000 less than the U.S. value, the typical single-family home in the metro area is worth $259,900, over $24,000 more than the $235,500 national median home price. The typical Redding household spends 40.4% of their income on housing payments, one of the largest shares in the United States.
[in-text-ad-2]

20. Missoula, MT
> Households able to afford monthly payments: 41.5%
> Median single-family house price: $271,200
> 2015 median household income: $42,815
> 5 yr. pop. change: 5.4%
Only about one in five renters in the Missoula metro can afford housing. The typical Missoulan spending less than 36% of income on rent — one of the smallest shares of any U.S. metro area. Many area homeowners are also spending beyond their means. The typical area home costs about 6.6 times the area’s projected 2016 median income, a higher housing price-to-income ratio than in all but 14 other U.S. metro areas.

19. Boulder, CO
> Households able to afford monthly payments: 40.4%
> Median single-family house price: $456,700
> 2015 median household income: $72,009
> 5 yr. pop. change: 7.2%
The population of the Boulder metro area increased 7.2% between 2011 and 2016, nearly twice the national growth rate. As more residents moved to the city, the demand for housing increased. The typical Boulder mortgage payment rose 28% over the past five years, faster than in most metro areas. Today, the typical Boulder household spends 50% of its income on housing payments, compared to the 29% share that is typical nationwide.
[in-text-ad]

18. Chico, CA
> Households able to afford monthly payments: 39.7%
> Median single-family house price: $267,800
> 2015 median household income: $45,644
> 5 yr. pop. change: 3.1%
The typical Chico household earns $45,644 a year, far less than the $55,775 national median household income. While incomes in Chico are among the lowest of any metro area, the typical single-family home in the metro area costs $267,800, roughly $32,000 more than the national median home value. The typical Chico household spends 43.5% of its income to housing payments, far more than is typical nationwide.
17. Corvallis, OR
> Households able to afford monthly payments: 39.4%
> Median single-family house price: $306,100
> 2015 median household income: $52,852
> 5 yr. pop. change: 3.9%
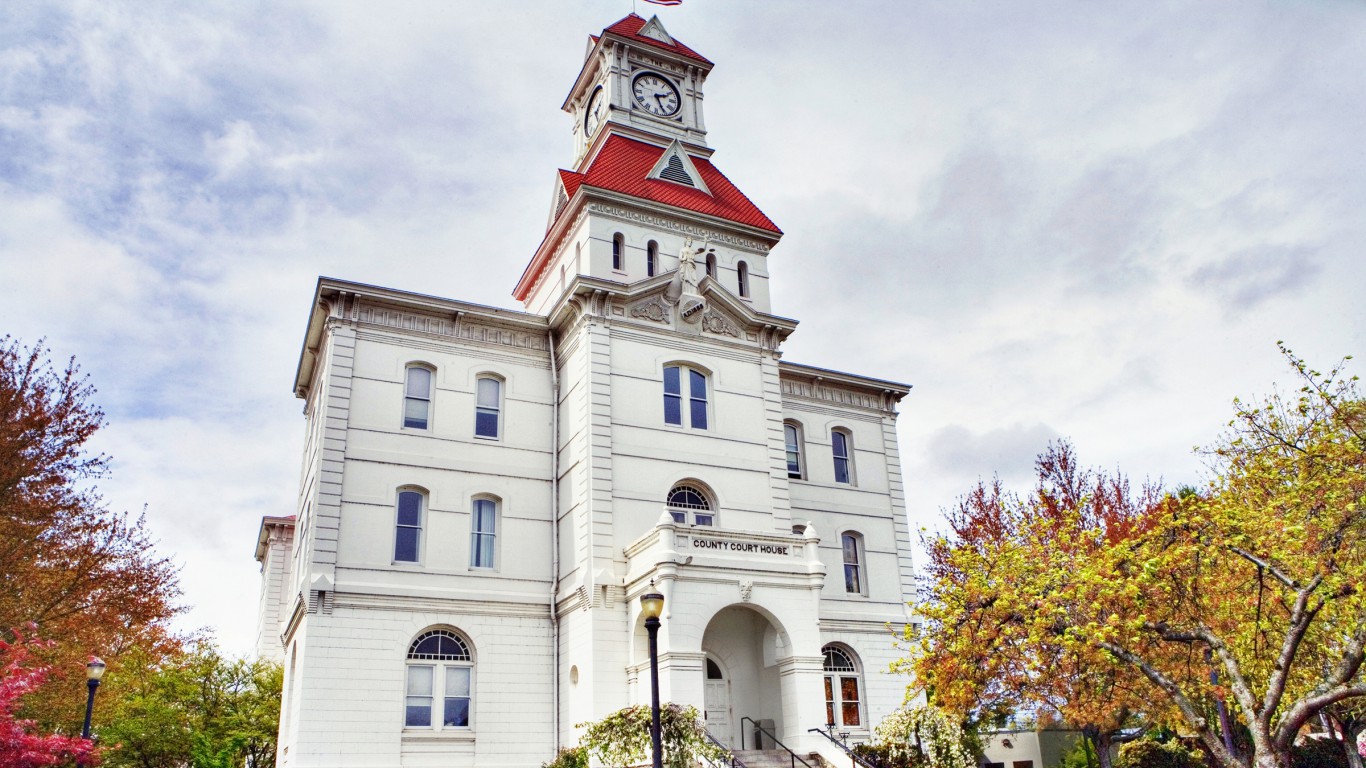
Nationwide, due largely to the housing crisis, home prices have increased 10.8% slower than incomes since 2006. In the Corvallis metro area, however, home prices have gone up 1.7% faster than incomes over the same 10 year period. Today, the area’s median home price is nearly six times the projected 2016 median income — far more than the 4.1 home price-to-income ratio nationwide.
16. Grants Pass, OR
> Households able to afford monthly payments: 37.4%
> Median single-family house price: $256,400
> 2015 median household income: $41,493
> 5 yr. pop. change: 4.0%
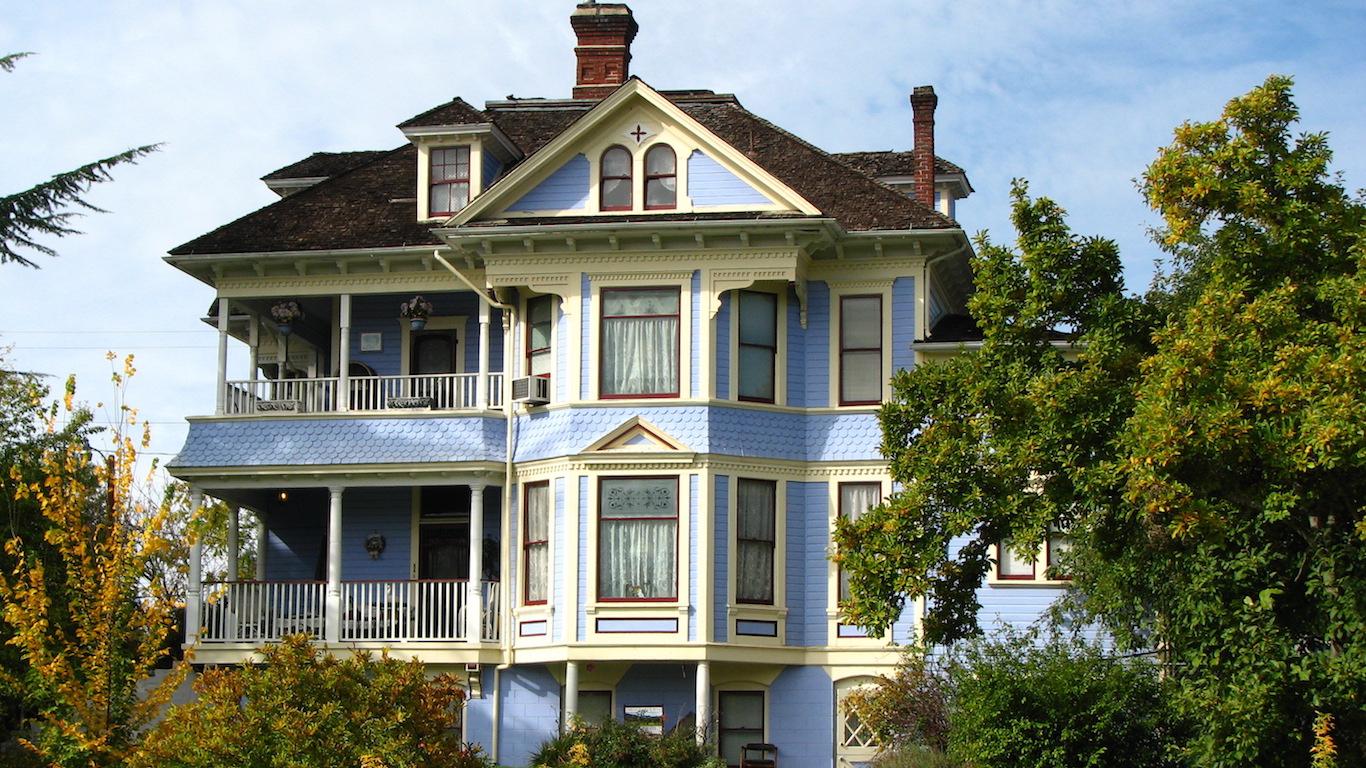
The typical household in Grants Pass, Oregon earns only $41,493 a year, far less than the $55,775 the typical American household earns. Even though incomes are lower, the typical single-family home in the area is costs about $256,400 — or about than $20,000 more than the what the typical U.S. home is priced at. Partially as a result, about 63% of area residents pay unsustainably high amount on housing relative to their incomes each month.
[in-text-ad-2]

15. Naples-Immokalee-Marco Island, FL
> Households able to afford monthly payments: 35.9%
> Median single-family house price: $408,200
> 2015 median household income: $62,126
> 5 yr. pop. change: 11.5%
A typical single-family home in the Naples metro area costs over $400,000, ranking it among the most expensive housing markets in the country. Though incomes also tend to be higher than usual across the metro area, for a majority of households even the higher incomes are not enough to make housing affordable. Demand has likely driven home values and prices up in recent years as the metro area’s population has increased by 11.5% since 2011.

14. Port St. Lucie, FL
> Households able to afford monthly payments: 34.0%
> Median single-family house price: $177,800
> 2015 median household income: $48,002
> 5 yr. pop. change: 8.5%
The population of the Port St. Lucie metro area rose 8.5% between 2011 and 2016, more than twice the national rate. As new residents moved to the city, housing prices grew far faster than area incomes. The cost of the median monthly mortgage payment rose 65.7%, faster than in all but eight metro areas. Today, nearly two-thirds of Port St. Lucie households spend more than 36% of their income on housing, one of the largest shares of any U.S. metro area.
[in-text-ad]

13. Oxnard-Thousand Oaks-Ventura, CA
> Households able to afford monthly payments: 33.3%
> Median single-family house price: $547,300
> 2015 median household income: $80,032
> 5 yr. pop. change: 2.3%
Only one out of every three households in the Oxnard metro area can afford the cost of housing — a smaller share than in all but a dozen other U.S. metro areas. High property values are largely to blame as the typical area home is worth over half a million dollars. In addition to high homeownership costs, 29.6% of renters spend between 30% and 50% of their income on monthly housing, the largest share of any U.S. metro area.

12. Napa, CA
> Households able to afford monthly payments: 32.2%
> Median single-family house price: $550,100
> 2015 median household income: $75,513
> 5 yr. pop. change: 3.1%
While incomes tend to be high in the Napa metro area, housing costs are even higher. Across the metro area, the typical monthly housing payment is equal to for 55.6% of median monthly income, well above the 29.5% nationwide payment-to-income ratio. Renters in the area are squeezed even tighter, as only about 15% pay a reasonable share of their income on housing.

11. Salinas, CA
> Households able to afford monthly payments: 32.1%
> Median single-family house price: $450,100
> 2015 median household income: $60,494
> 5 yr. pop. change: 3.3%
Salinas is one of many metro areas in California struggling with housing affordability as housing prices shot much higher than income rose in the last five years. A typical single-family home in the metro area costs $450,100, nearly twice the $235,500 national median home price. The median annual household income in Salinas, however, is $60,494, about 8% more than the corresponding U.S. figure. The typical Salinas household spends 56.4% of its income on housing — the 11th largest share in the U.S.
[in-text-ad-2]

10. Santa Rosa, CA
> Households able to afford monthly payments: 27.2%
> Median single-family house price: $532,500
> 2015 median household income: $66,674
> 5 yr. pop. change: 3.2%
In many of the least affordable housing markets, the typical single-family home is valued at over half a million dollars — and Santa Rosa is no exception. The typical single-family area home sells for about $532,000. This appears to be well out-of-budget for for many area households, as the area’s median annual household income is $66,674. As a result, only about 27% of area households are paying less than 36% of their income on housing.

9. San Diego-Carlsbad, CA
> Households able to afford monthly payments: 27.0%
> Median single-family house price: $539,800
> 2015 median household income: $67,320
> 5 yr. pop. change: 5.6%
The population of the San Diego metro area rose 5.6% between 2011 and 2016, far more than the 3.7% national growth rate. As the number of area residents grew over that five year period, the typical monthly mortgage payment in San Diego rose 41.8%, one of the largest increases of any city. Today, roughly one in seven households in the city spends more than 50% of its income on housing, one of the highest proportions in the country.
[in-text-ad]

8. Santa Maria-Santa Barbara, CA
> Households able to afford monthly payments: 26.8%
> Median single-family house price: $551,500
> 2015 median household income: $63,625
> 5 yr. pop. change: 4.7%
The typical household in the Santa Maria-Santa Barbara metro area spends 64.3% of its income on housing — well above the 30% recommended threshold. As is often the case, renters are squeezed hardest by the area’s high cost of housing. Only 13.7% of area renters spend within their means on housing, one of the smallest such shares of any U.S. metro area.

7. San Luis Obispo-Paso Robles-Arroyo Grande, CA
> Households able to afford monthly payments: 25.7%
> Median single-family house price: $524,900
> 2015 median household income: $62,648
> 5 yr. pop. change: 4.3%
The typical single-family home in the San Luis Obispo-Paso Robles-Arroyo Grande metro area costs nearly $525,000, more than double the median home price nationwide. Over the last year, the typical monthly mortgage payment has increased by 5.4% — well above the 3.5% national increase — further adding to the area’s housing affordability problem.

6. San Francisco-Oakland-Hayward, CA
> Households able to afford monthly payments: 25.2%
> Median single-family house price: $774,900
> 2015 median household income: $88,518
> 5 yr. pop. change: 6.4%
The San Francisco metro area is one of the most expensive housing markets in the world. The typical price tag of a single-family home in San Francisco — at $774,900 — is more than three times the U.S. median single-family home price. While the median annual household income of $88,518 is the third highest of any U.S. metro area, it amounts to just about 11% of San Francisco’s median home value — compared to the 24% national income-to-home price ratio.
[in-text-ad-2]

5. Los Angeles-Long Beach-Anaheim, CA f/c
> Households able to afford monthly payments: 25.1%
> Median single-family house price: $559,600
> 2015 median household income: $62,544
> 5 yr. pop. change: 2.8%
Only about one in four households in the country’s second largest metro area can comfortably afford monthly housing costs. Across the Los Angeles metro area, 16.7% of homeowners and 31.0% of renters spend more than 50% of their monthly income on housing, each among the largest shares of any metro area in the country.
4. San Jose-Sunnyvale-Santa Clara, CA
> Households able to afford monthly payments: 22.3%
> Median single-family house price: $946,800
> 2015 median household income: $101,980
> 5 yr. pop. change: 5.9%
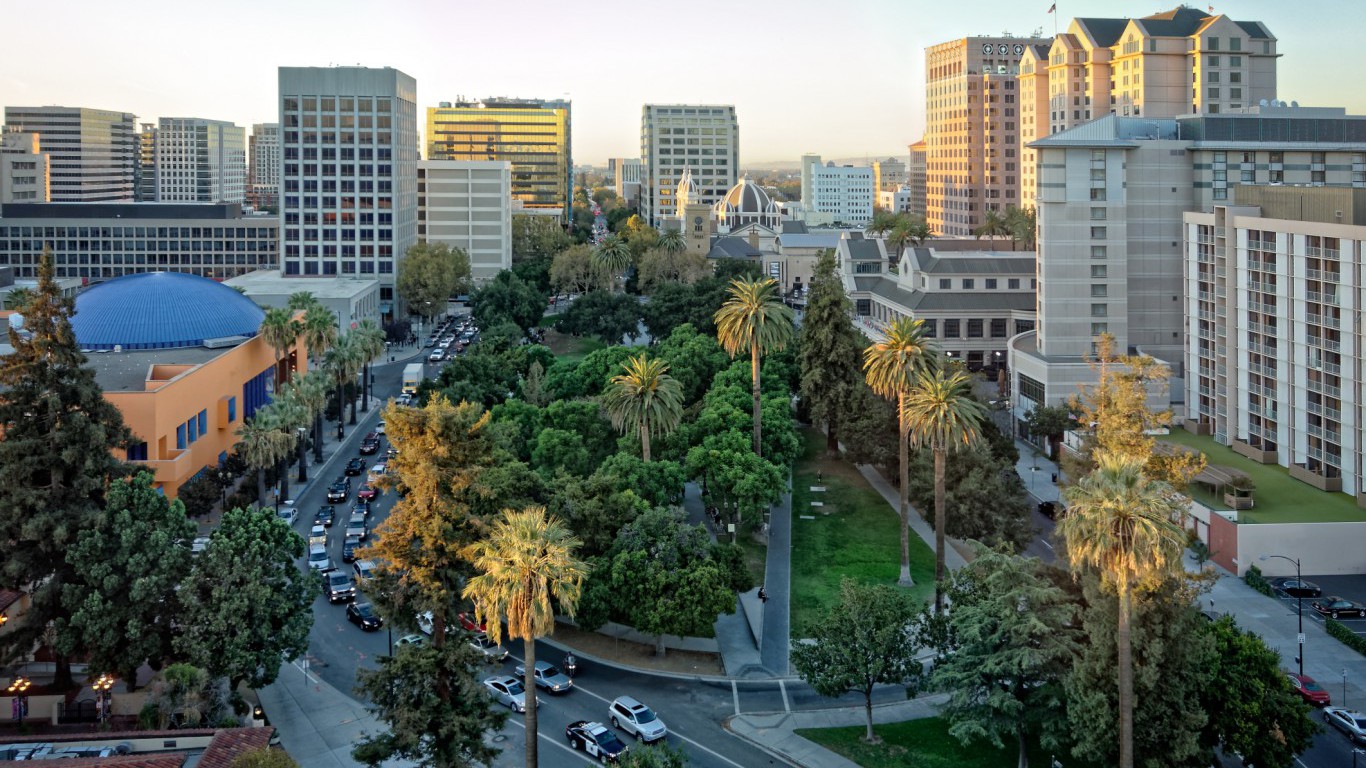
The price of a typical San Jose metro area home — $946,800 — is the highest in the U.S. and more than four times the national median home value. While the city’s $101,980 median annual household income is also the highest in the country, it amounts to a small fraction of the area’s housing prices. The typical San Jose household spends 68.6% of its income on housing payments, the second largest share of any metro area.
[in-text-ad]

3. Urban Honolulu, HI
> Households able to afford monthly payments: 19.6%
> Median single-family house price: $707,100
> 2015 median household income: $77,273
> 5 yr. pop. change: 2.7%
Urban Honolulu is one of only three U.S. metro areas where fewer than one in five households can comfortably afford monthly housing costs. The cost of a typical area single-family home is over $700,000, and the median monthly mortgage payment is nearly $4,400 — each among the highest such costs in the country. Partially as a result, 13.2% of area homeowners spend more than half their income on housing.

2. Kahului-Wailuku-Lahaina, HI
> Households able to afford monthly payments: 19.3%
> Median single-family house price: $622,400
> 2015 median household income: $70,468
> 5 yr. pop. change: 5.5%
Kahului-Wailuku-Lahaina metro area has the least affordable housing market in Hawaii and the second least affordable in the country. Over 80% of area households spend a disproportionate share of their income on housing. The median home price in the area is 9.4 times the projected 2016 median income, well more than double the comparable national ratio.

1. Santa Cruz-Watsonville, CA
> Households able to afford monthly payments: 16.6%
> Median single-family house price: $755,100
> 2015 median household income: $65,139
> 5 yr. pop. change: 3.7%
Less than 7% of renters in the Santa Cruz metro area pay a reasonable share of their income on housing. Homeowners are not spared the area’s high cost of living either. The median home price in the area is 12.3 times the projected 2016 median income, by far the highest income-to-home price ratio in the country.
Detailed Findings:
Geography appears to play a considerable role in housing affordability. Of the 39 metro areas where over half of all households struggle to pay monthly housing bills, 31 are in western states, including Hawaii. Among the places with unaffordable housing, California real estate in particular stands out as especially pricey. In 16 of the 26 metro areas in the state, the majority of households pay more than 36% of income on housing. The vast majority of California’s population lives in these cities, which includes places like Los Angeles, San Francisco, and San Diego.
One factor driving up housing prices across the country is population growth. An influx of new residents can increase demand for housing and ultimately drive up real estate prices in an area. Of the 39 metro areas with unaffordable housing, 25 had population growth exceeding the U.S. five-year 3.7% growth rate. Over the same period, Naples, Florida’s population increased by 11.5%, while the metro area’s median home price rose 52%.
In cities where most new residents are much wealthier than the general population, the drastic rise in home values can hurt overall housing affordability. In some cases it can even make it difficult for poorer residents to continue to afford living there. This often occurs in the form of gentrification in low-cost neighborhoods. In seven of the 10 fastest growing cities on this list, the ratio of housing payments to income rose faster than it did nationwide.
While the U.S. economy as a whole has largely recovered from the Great Recession by a number of metrics, income gains have been heavily concentrated among wealthier households. The resulting increase in home values has outpaced income growth among many of the poorer households in the country, reducing affordability for lower income Americans. As the share of households earning less than $15,000 annually that also pay more than half of income on housing costs rose from 59.0% to 67.2% between 2001 and 2015, the share of households earning at least $75,000 a year that are severely housing cost-burdened fell from 0.9% to 0.8%.
Methodology:
In order to identify the U.S. cities where the majority of households cannot afford their homes, 24/7 Wall St. reviewed data from “The State of the Nation’s Housing 2017,” a report compiled by the Joint Center for Housing Studies of Harvard University. The rank is based on the share of households in a given metro area paying more than 36% of their monthly income on housing. The rank was calculated using median household income, adjusted to a monthly rate, and the median price of an existing single-family home. Only those cities where over half of all households spend more than 36% of monthly income were included. Income-to-home price ratios were calculated using Moody’s 2016 income projections. All other measures of income are from the 2015 U.S. Census Bureau’s American Community Survey. Population estimates are also from the ACS.
The thought of burdening your family with a financial disaster is most Americans’ nightmare. However, recent studies show that over 100 million Americans still don’t have proper life insurance in the event they pass away.
Life insurance can bring peace of mind – ensuring your loved ones are safeguarded against unforeseen expenses and debts. With premiums often lower than expected and a variety of plans tailored to different life stages and health conditions, securing a policy is more accessible than ever.
A quick, no-obligation quote can provide valuable insight into what’s available and what might best suit your family’s needs. Life insurance is a simple step you can take today to help secure peace of mind for your loved ones tomorrow.
Click here to learn how to get a quote in just a few minutes.
Thank you for reading! Have some feedback for us?
Contact the 24/7 Wall St. editorial team.