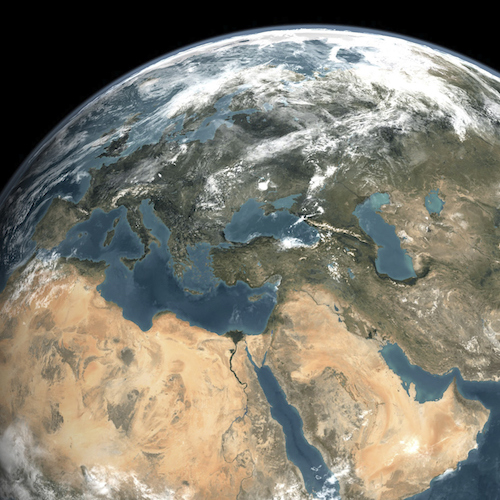
Mankind’s footprint grows larger than ever, with 7.5 billion people on the planet. The population is increasing because of rising birth rates in the developing world, improving health care and a decline in the number of armed conflicts worldwide.
Other factors contribute to an increase in a nation’s population. In the case of the United States, growth is driven by migration.
24/7 Wall St. reviewed a 2017 United Nations population report that estimated the population totals of all countries and their projected changes.
Around 60% of the world’s population lives in Asia, though the population growth rate there is slowing. Despite this, with nations such as China and India — who combined have one-third of the world’s people — it is unlikely another continent will surpass Asia in population size.
China had been the world’s-fastest growing nation, doubling its population to 1 billion over the 30-year span ending in 1981. The pace of the population increase has slowed because of several factors, among them: the implementation of the one-child policy in 1979 that has been phased out, and China’s transition to a more urban society of typically smaller families from an agrarian one that features larger families.
On the other hand, certain regions in Africa are blossoming with the most rapid population growth rates in the world. The continent is benefiting from better health care, rising living standards and a decline in wars. Estimates by the United Nations project that Nigeria could grow to 1 billion people by 2100 from 186 million.
The global population is projected to reach 11 billion in the next 80 years, according to estimates from the United Nations. The population increase will stretch Earth’s resources and require us to develop innovative solutions to manage the land.
While six of the 10 most populated countries in the world are in Asia, the rest are quite evenly dispersed. Where do you think the rest of the world stands?
Click here to see the 25 largest countries in the world.
To identify the most populated countries in the world, 24/7 Wall St. analyzed social and economic data from 232 countries provided in the United Nations Department of Economic and Social Affairs’ “World Population Prospects: 2017 Revision”. This report released up-to-date information on total population counts, land size, growth trends and future population estimates for both sexes, where the medium variant of estimates was used.
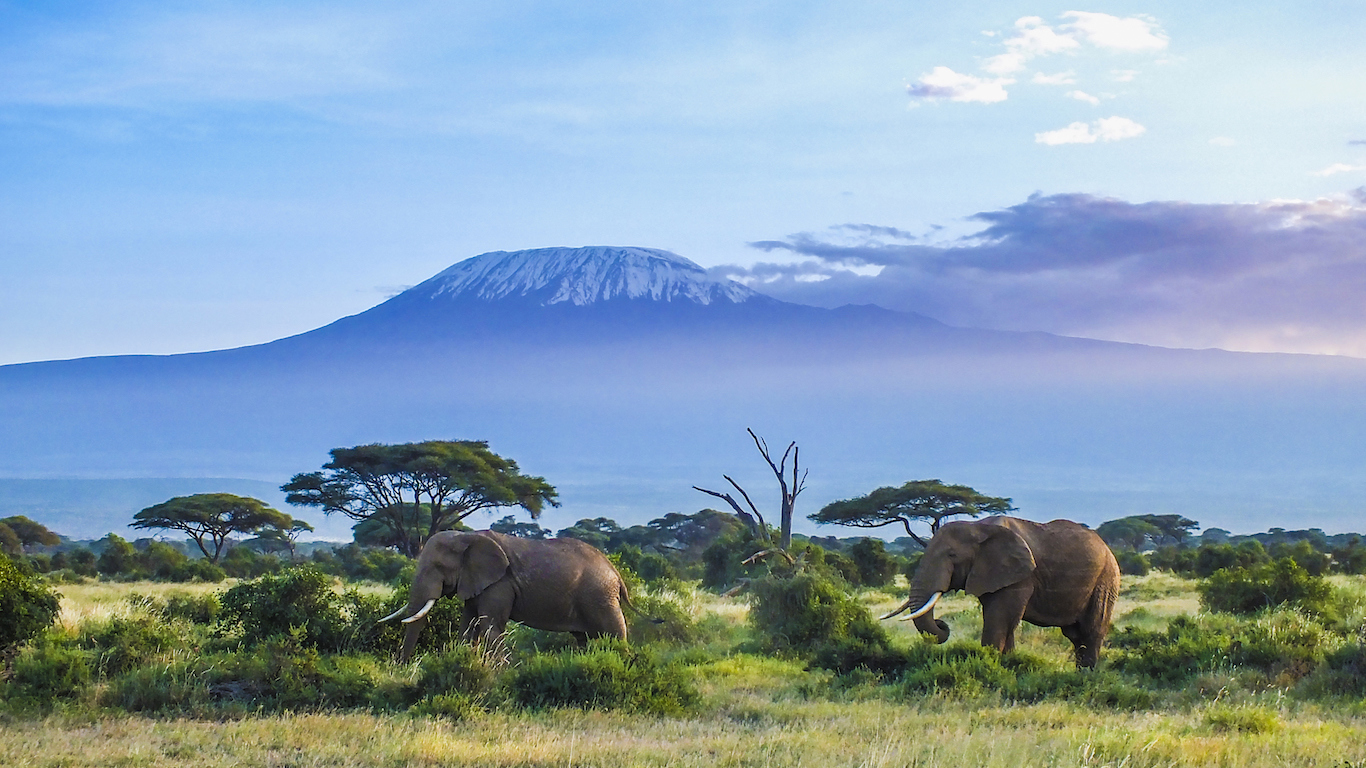
25. United Republic of Tanzania
> 2016 population: 55.6 million
> Land area: 364,900 square miles
> 1950 population: 7.6 million
> Proj. 25 year pop. increase: 106.2%
[in-text-ad]

24. South Africa
> 2016 population: 56.0 million
> Land area: 471,445 square miles
> 1950 population: 13.6 million
> Proj. 25 year pop. increase: 24.8%

23. Italy
> 2016 population: 59.4 million
> Land area: 116,339 square miles
> 1950 population: 46.6 million
> Proj. 25 year pop. increase: -4.8%

22. France
> 2016 population: 64.7 million
> Land area: 212,935 square miles
> 1950 population: 41.9 million
> Proj. 25 year pop. increase: 8.0%
[in-text-ad-2]

21. United Kingdom
> 2016 population: 65.8 million
> Land area: 93,784 square miles
> 1950 population: 50.6 million
> Proj. 25 year pop. increase: 11.9%

20. Thailand
> 2016 population: 68.9 million
> Land area: 198,115 square miles
> 1950 population: 20.7 million
> Proj. 25 year pop. increase: -1.4%
[in-text-ad]
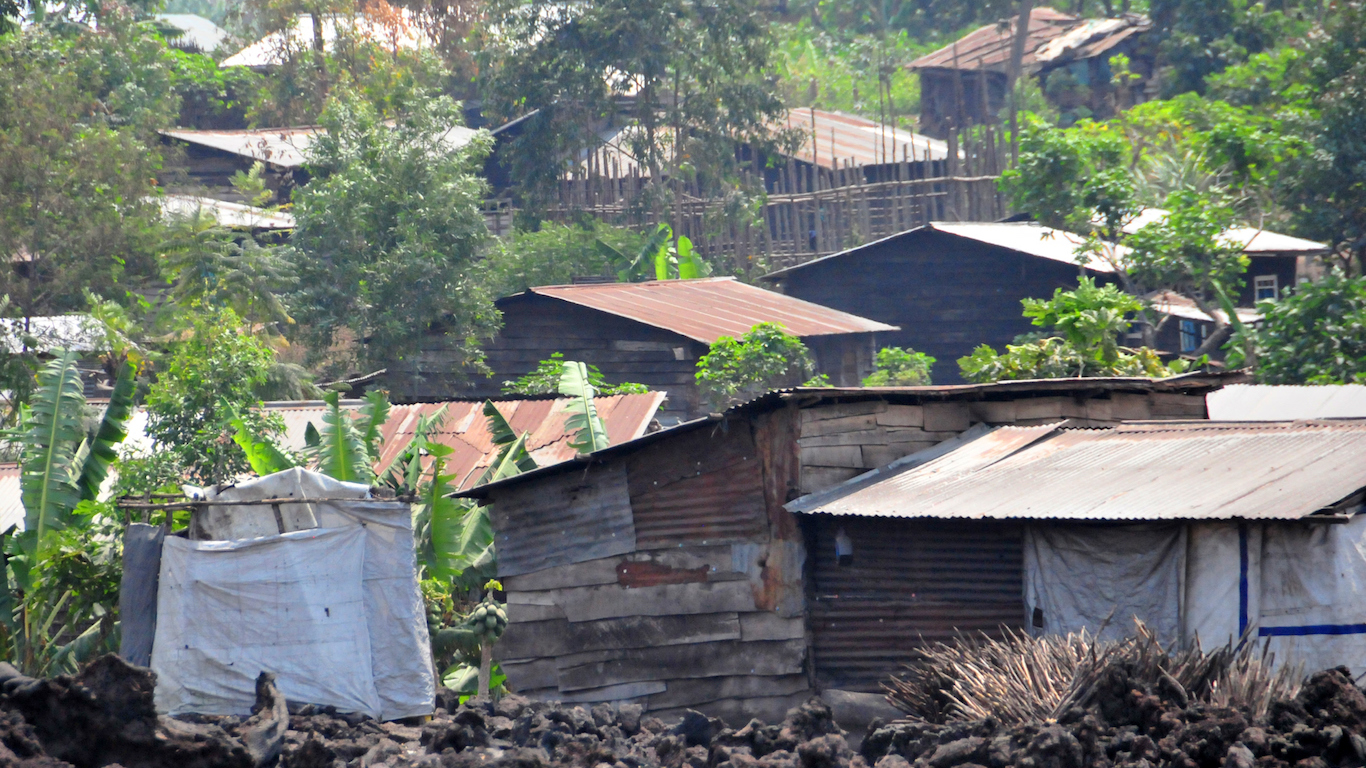
19. Democratic Republic of the Congo
> 2016 population: 78.7 million
> Land area: 132,047 square miles
> 1950 population: 12.2 million
> Proj. 25 year pop. increase: 109.5%

18. Turkey
> 2016 population: 79.5 million
> Land area: 302,535 square miles
> 1950 population: 21.4 million
> Proj. 25 year pop. increase: 17.8%
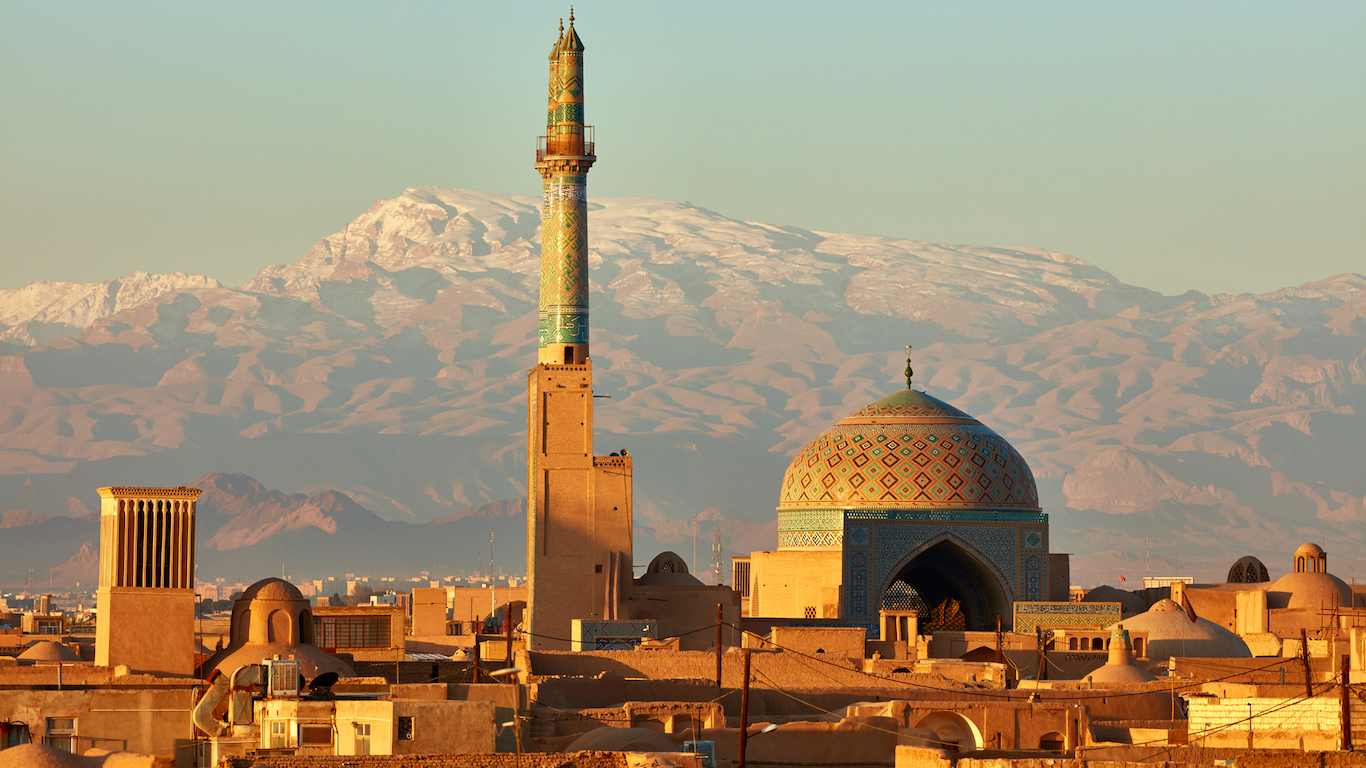
17. Iran (Islamic Republic of)
> 2016 population: 80.3 million
> Land area: 636,371 square miles
> 1950 population: 17.1 million
> Proj. 25 year pop. increase: 15.1%
[in-text-ad-2]

16. Germany
> 2016 population: 81.9 million
> Land area: 137,847 square miles
> 1950 population: 70.0 million
> Proj. 25 year pop. increase: -1.4%

15. Vietnam
> 2016 population: 94.6 million
> Land area: 128,066 square miles
> 1950 population: 24.8 million
> Proj. 25 year pop. increase: 18.5%
[in-text-ad]

14. Egypt
> 2016 population: 95.7 million
> Land area: 386,661 square miles
> 1950 population: 20.7 million
> Proj. 25 year pop. increase: 46.9%

13. Ethiopia
> 2016 population: 102.4 million
> Land area: 426,372 square miles
> 1950 population: 18.1 million
> Proj. 25 year pop. increase: 67.3%

12. Philippines
> 2016 population: 103.3 million
> Land area: 115,831 square miles
> 1950 population: 18.6 million
> Proj. 25 year pop. increase: 37.4%
[in-text-ad-2]

11. Mexico
> 2016 population: 127.5 million
> Land area: 756,065 square miles
> 1950 population: 28.0 million
> Proj. 25 year pop. increase: 24.9%

10. Japan
> 2016 population: 127.7 million
> Land area: 145,898 square miles
> 1950 population: 82.8 million
> Proj. 25 year pop. increase: -10.9%
[in-text-ad]

9. Russian Federation
> 2016 population: 144.0 million
> Land area: 6,601,665 square miles
> 1950 population: 102.8 million
> Proj. 25 year pop. increase: -6.2%

8. Bangladesh
> 2016 population: 163.0 million
> Land area: 55,598 square miles
> 1950 population: 37.9 million
> Proj. 25 year pop. increase: 21.4%
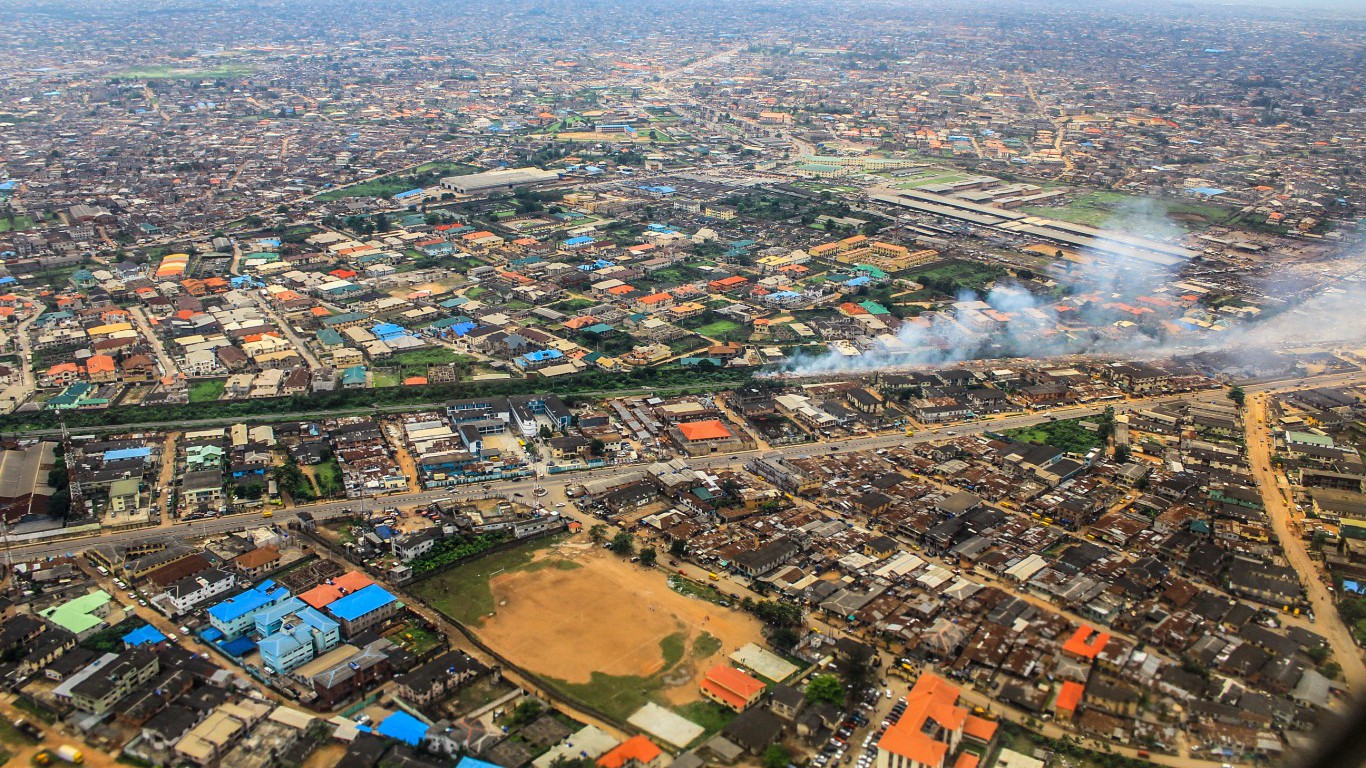
7. Nigeria
> 2016 population: 186.0 million
> Land area: 356,669 square miles
> 1950 population: 37.9 million
> Proj. 25 year pop. increase: 87.2%
[in-text-ad-2]

6. Pakistan
> 2016 population: 193.2 million
> Land area: 307,374 square miles
> 1950 population: 37.5 million
> Proj. 25 year pop. increase: 46.9%

5. Brazil
> 2016 population: 207.7 million
> Land area: 3,287,611 square miles
> 1950 population: 54.0 million
> Proj. 25 year pop. increase: 11.8%
[in-text-ad]
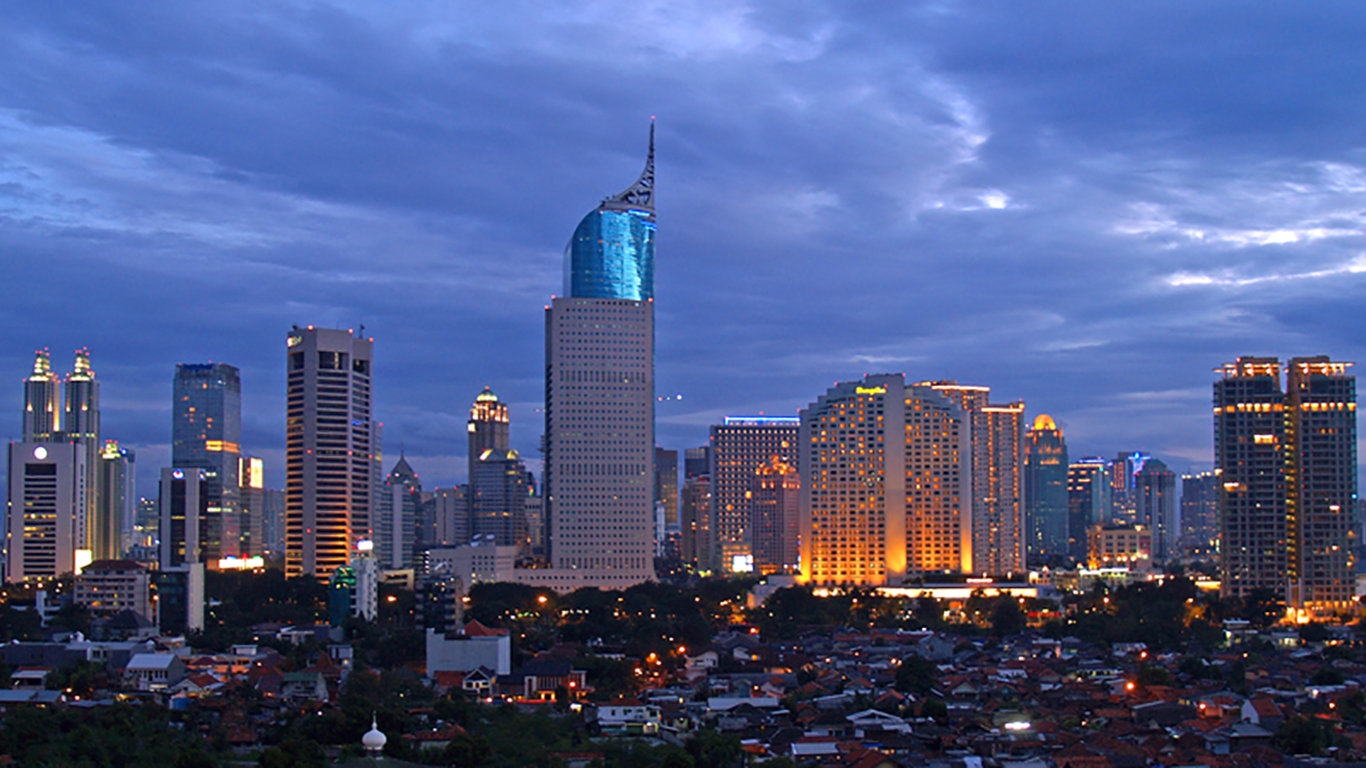
4. Indonesia
> 2016 population: 261.1 million
> Land area: 735,358 square miles
> 1950 population: 69.5 million
> Proj. 25 year pop. increase: 20.5%

3. United States of America
> 2016 population: 322.2 million
> Land area: 3,717,811 square miles
> 1950 population: 158.8 million
> Proj. 25 year pop. increase: 17.1%

2. India
> 2016 population: 1324.2 million
> Land area: 1,269,219 square miles
> 1950 population: 376.3 million
> Proj. 25 year pop. increase: 22.3%
[in-text-ad-2]

1. China
> 2016 population: 1403.5 million
> Land area: 3,705,406 square miles
> 1950 population: 554.4 million
> Proj. 25 year pop. increase: 0.4%
Take Charge of Your Retirement In Just A Few Minutes (Sponsor)
Retirement planning doesn’t have to feel overwhelming. The key is finding expert guidance—and SmartAsset’s simple quiz makes it easier than ever for you to connect with a vetted financial advisor.
Here’s how it works:
- Answer a Few Simple Questions. Tell us a bit about your goals and preferences—it only takes a few minutes!
- Get Matched with Vetted Advisors Our smart tool matches you with up to three pre-screened, vetted advisors who serve your area and are held to a fiduciary standard to act in your best interests. Click here to begin
- Choose Your Fit Review their profiles, schedule an introductory call (or meet in person), and select the advisor who feel is right for you.
Why wait? Start building the retirement you’ve always dreamed of. Click here to get started today!
Thank you for reading! Have some feedback for us?
Contact the 24/7 Wall St. editorial team.
 24/7 Wall St.
 24/7 Wall St.


