As the United States recovered from the recession and began one of its longest periods of economic growth, the unemployment rate fell to 4.4%, nearly its lowest point in a decade and far less than its peak of 10.0% in October 2009. One driver of economic growth was the nation’s cities, which together added approximately 83% of all U.S. jobs over the past five years.
High-density urban areas often act as engines of economic activity and can increase productivity and spur job growth in surrounding areas. Since 2009, employment in metropolitan areas has grown at three times the rate in nonmetropolitan areas. Cities added a total of 10.2 million of the 12.4 million jobs the U.S. economy added as a whole over the past five years.
To determine the cities adding the most jobs in every state, 24/7 Wall St. reviewed employment growth in 398 metropolitan areas over the past five years with data from the Bureau of Labor Statistics. The cities adding the most jobs tended to have strong employment growth in either the professional and business services sector, the leisure and hospitality sector, or construction.
Click here to see the cities adding the most jobs in every state.
Click here to see our detailed findings and methodology.

1. Auburn-Opelika, AL
> Employment increase 2012-2017: 12.4%
> Statewide employment chg. 2012-2017: 3.4%
> June unemployment: 4.7%
> Industry contributing most to job growth: Trade, transportation, and utilities
> Employment growth in trade, transportation, and utilities sector: 2,500
[in-text-ad]

2. Anchorage, AK
> Employment increase 2012-2017: 2.5%
> Statewide employment chg. 2012-2017: 0.5%
> June unemployment: 6.5%
> Industry contributing most to job growth: Education and health services
> Employment growth in education and health services sector: 2,700

3. Phoenix-Mesa-Scottsdale, AZ
> Employment increase 2012-2017: 16.4%
> Statewide employment chg. 2012-2017: 13.2%
> June unemployment: 4.5%
> Industry contributing most to job growth: Professional and business services
> Employment growth in professional and business services sector: 57,300

4. Fayetteville-Springdale-Rogers, AR-MO
> Employment increase 2012-2017: 22.4%
> Statewide employment chg. 2012-2017: 6.0%
> June unemployment: 2.8%
> Industry contributing most to job growth: Professional and business services
> Employment growth in professional and business services sector: 14,300
[in-text-ad-2]

5. Riverside-San Bernardino-Ontario, CA
> Employment increase 2012-2017: 14.0%
> Statewide employment chg. 2012-2017: 9.8%
> June unemployment: 5.5%
> Industry contributing most to job growth: Trade, transportation, and utilities
> Employment growth in trade, transportation, and utilities sector: 62,500

6. Fort Collins, CO
> Employment increase 2012-2017: 20.8%
> Statewide employment chg. 2012-2017: 14.6%
> June unemployment: 2.1%
> Industry contributing most to job growth: Government
> Employment growth in government sector: 9,500
[in-text-ad]

7. Danbury, CT
> Employment increase 2012-2017: 7.5%
> Statewide employment chg. 2012-2017: 6.3%
> June unemployment: 4.3%
> Industry contributing most to job growth: Trade, transportation, and utilities
> Employment growth in trade, transportation, and utilities sector: 1,100

8. Dover, DE
> Employment increase 2012-2017: 8.7%
> Statewide employment chg. 2012-2017: 9.8%
> June unemployment: 5.7%
> Industry contributing most to job growth: Education and health services
> Employment growth in education and health services sector: 1,900

9. North Port-Sarasota-Bradenton, FL
> Employment increase 2012-2017: 20.0%
> Statewide employment chg. 2012-2017: 12.9%
> June unemployment: 3.9%
> Industry contributing most to job growth: Professional and business services
> Employment growth in professional and business services sector: 13,200
[in-text-ad-2]

10. Gainesville, GA
> Employment increase 2012-2017: 15.6%
> Statewide employment chg. 2012-2017: 10.5%
> June unemployment: 4.3%
> Industry contributing most to job growth: Trade, transportation, and utilities
> Employment growth in trade, transportation, and utilities sector: 1,400

11. Kahului-Wailuku-Lahaina, HI
> Employment increase 2012-2017: 15.3%
> Statewide employment chg. 2012-2017: 10.9%
> June unemployment: 3.4%
> Industry contributing most to job growth: Leisure and hospitality
> Employment growth in leisure and hospitality sector: 3,100
[in-text-ad]

12. Boise City, ID
> Employment increase 2012-2017: 16.7%
> Statewide employment chg. 2012-2017: 11.2%
> June unemployment: 2.8%
> Industry contributing most to job growth: Trade, transportation, and utilities
> Employment growth in trade, transportation, and utilities sector: 9,500

13. Chicago-Naperville-Elgin, IL-IN-WI
> Employment increase 2012-2017: 4.9%
> Statewide employment chg. 2012-2017: 2.7%
> June unemployment: 4.9%
> Industry contributing most to job growth: Professional and business services
> Employment growth in professional and business services sector: 88,300

14. Elkhart-Goshen, IN
> Employment increase 2012-2017: 22.4%
> Statewide employment chg. 2012-2017: 11.4%
> June unemployment: 2.3%
> Industry contributing most to job growth: Manufacturing
> Employment growth in manufacturing sector: 15,000
[in-text-ad-2]

15. Des Moines-West Des Moines, IA
> Employment increase 2012-2017: 10.9%
> Statewide employment chg. 2012-2017: 4.3%
> June unemployment: 3.0%
> Industry contributing most to job growth: Professional and business services
> Employment growth in professional and business services sector: 11,000

16. Manhattan, KS
> Employment increase 2012-2017: 9.4%
> Statewide employment chg. 2012-2017: 1.7%
> June unemployment: 3.4%
> Industry contributing most to job growth: Government
> Employment growth in government sector: 4,500
[in-text-ad]

17. Louisville/Jefferson County, KY-IN
> Employment increase 2012-2017: 9.4%
> Statewide employment chg. 2012-2017: 3.0%
> June unemployment: 4.6%
> Industry contributing most to job growth: Trade, transportation, and utilities
> Employment growth in trade, transportation, and utilities sector: 18,700

18. Lake Charles, LA
> Employment increase 2012-2017: 23.4%
> Statewide employment chg. 2012-2017: 2.6%
> June unemployment: 4.5%
> Industry contributing most to job growth: Construction
> Employment growth in construction sector: 15,100

19. Portland-South Portland, ME
> Employment increase 2012-2017: 6.1%
> Statewide employment chg. 2012-2017: 3.9%
> June unemployment: 3.0%
> Industry contributing most to job growth: Education and health services
> Employment growth in education and health services sector: 4,000
[in-text-ad-2]

20. Salisbury, MD-DE
> Employment increase 2012-2017: 7.9%
> Statewide employment chg. 2012-2017: 6.9%
> June unemployment: 4.7%
> Industry contributing most to job growth: Leisure and hospitality
> Employment growth in leisure and hospitality sector: 3,700

21. New Bedford, MA
> Employment increase 2012-2017: 10.1%
> Statewide employment chg. 2012-2017: 8.5%
> June unemployment: 6.0%
> Industry contributing most to job growth: Education and health services
> Employment growth in education and health services sector: 2,800
[in-text-ad]

22. Grand Rapids-Wyoming, MI
> Employment increase 2012-2017: 15.5%
> Statewide employment chg. 2012-2017: 9.8%
> June unemployment: 3.2%
> Industry contributing most to job growth: Manufacturing
> Employment growth in manufacturing sector: 20,700

23. Minneapolis-St. Paul-Bloomington, MN-WI
> Employment increase 2012-2017: 8.3%
> Statewide employment chg. 2012-2017: 5.7%
> June unemployment: 3.5%
> Industry contributing most to job growth: Education and health services
> Employment growth in education and health services sector: 52,100

24. Hattiesburg, MS
> Employment increase 2012-2017: 6.1%
> Statewide employment chg. 2012-2017: 1.7%
> June unemployment: 5.4%
> Industry contributing most to job growth: Government
> Employment growth in government sector: 1,100
[in-text-ad-2]

25. Kansas City, MO-KS
> Employment increase 2012-2017: 7.0%
> Statewide employment chg. 2012-2017: 4.1%
> June unemployment: 3.8%
> Industry contributing most to job growth: Professional and business services
> Employment growth in professional and business services sector: 31,500

26. Missoula, MT
> Employment increase 2012-2017: 7.1%
> Statewide employment chg. 2012-2017: 6.0%
> June unemployment: 3.4%
> Industry contributing most to job growth: Leisure and hospitality
> Employment growth in leisure and hospitality sector: 1,500
[in-text-ad]

27. Omaha-Council Bluffs, NE-IA
> Employment increase 2012-2017: 3.2%
> Statewide employment chg. 2012-2017: 0.4%
> June unemployment: 3.2%
> Industry contributing most to job growth: Mining, logging, and construction
> Employment growth in mining, logging, and construction sector: 8,200

28. Las Vegas-Henderson-Paradise, NV
> Employment increase 2012-2017: 14.0%
> Statewide employment chg. 2012-2017: 12.5%
> June unemployment: 5.1%
> Industry contributing most to job growth: Professional and business services
> Employment growth in professional and business services sector: 36,200

29. Manchester, NH
> Employment increase 2012-2017: 8.0%
> Statewide employment chg. 2012-2017: 4.6%
> June unemployment: 2.7%
> Industry contributing most to job growth: Education and health services
> Employment growth in education and health services sector: 3,800
[in-text-ad-2]

30. Trenton, NJ
> Employment increase 2012-2017: 8.1%
> Statewide employment chg. 2012-2017: 3.6%
> June unemployment: 3.8%
> Industry contributing most to job growth: Trade, transportation, and utilities
> Employment growth in trade, transportation, and utilities sector: 7,500

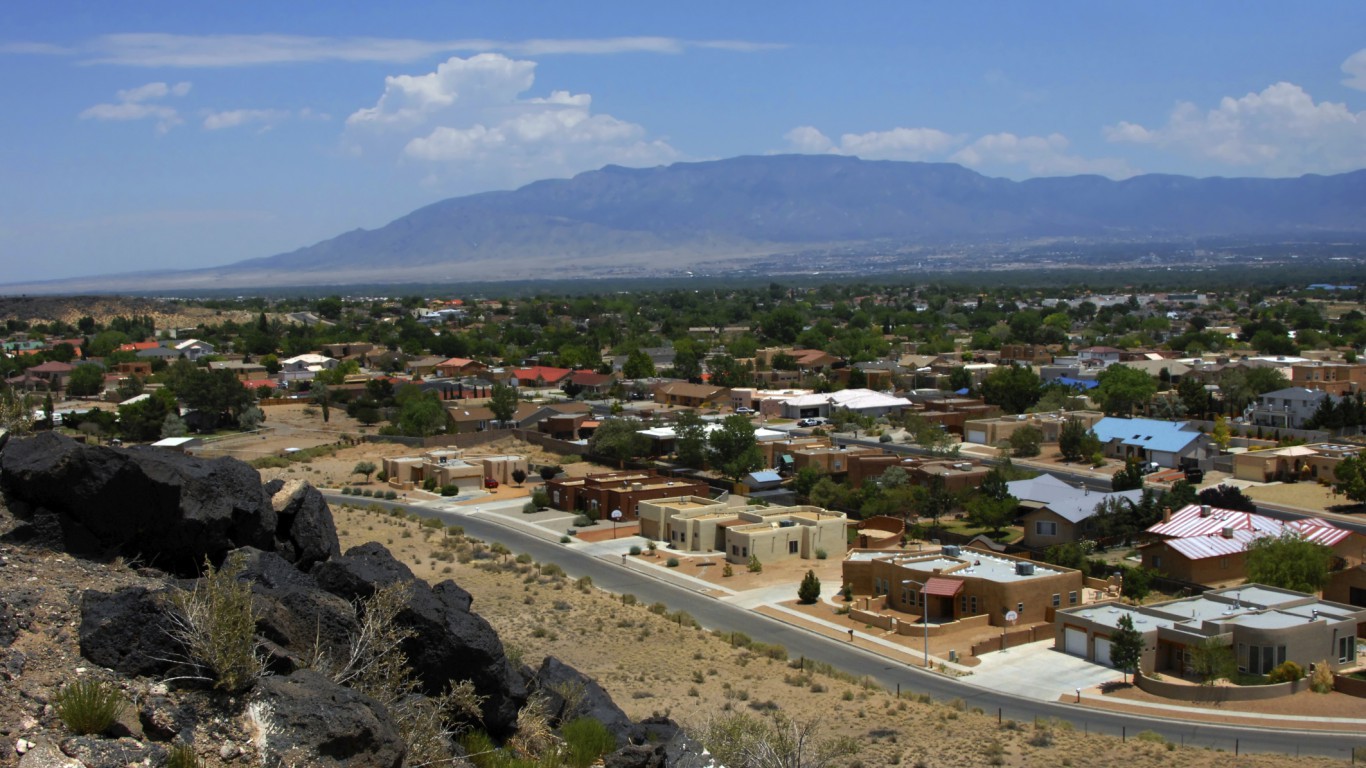
31. Albuquerque, NM
> Employment increase 2012-2017: 4.5%
> Statewide employment chg. 2012-2017: 1.6%
> June unemployment: 6.2%
> Industry contributing most to job growth: Education and health services
> Employment growth in education and health services sector: 10,800
[in-text-ad]

32. New York-Newark-Jersey City, NY-NJ-PA
> Employment increase 2012-2017: 6.7%
> Statewide employment chg. 2012-2017: 5.0%
> June unemployment: 4.3%
> Industry contributing most to job growth: Education and health services
> Employment growth in education and health services sector: 261,200

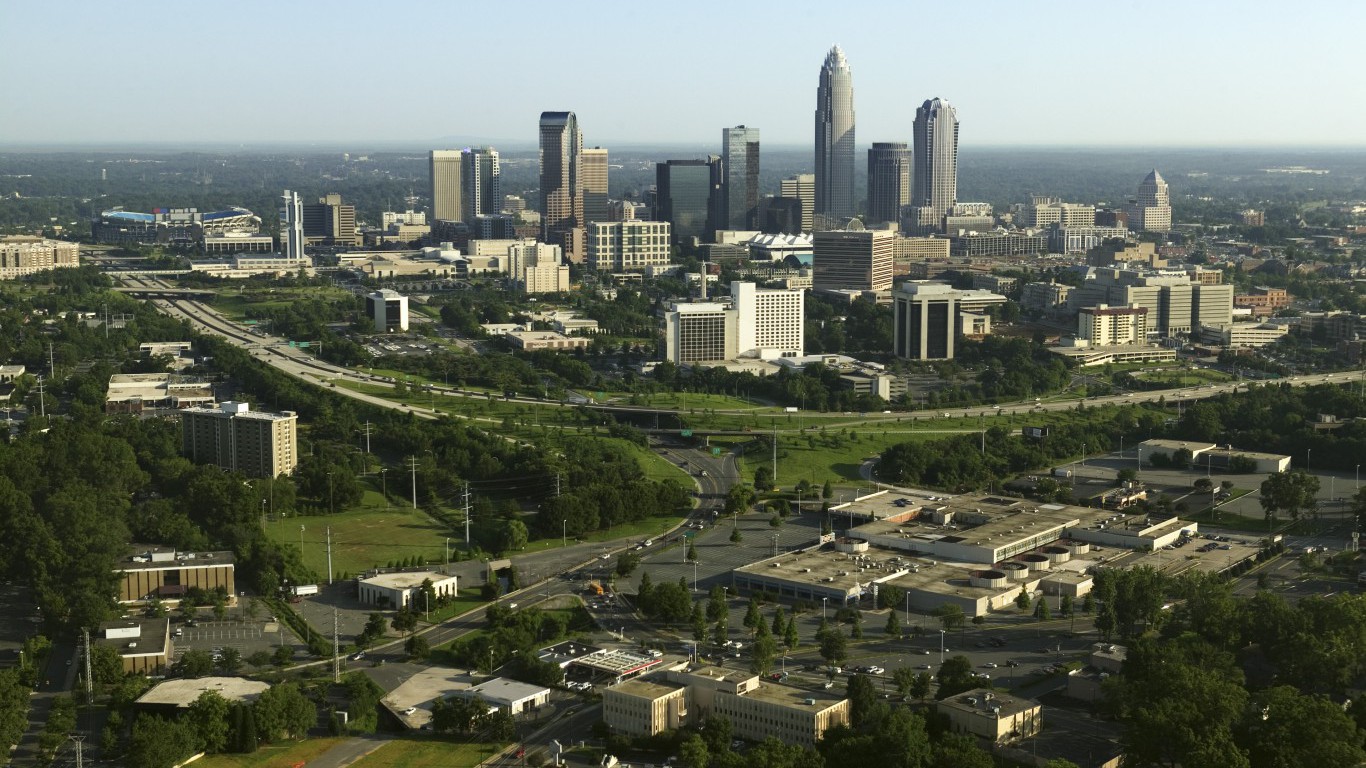
33. Charlotte-Concord-Gastonia, NC-SC
> Employment increase 2012-2017: 18.3%
> Statewide employment chg. 2012-2017: 10.8%
> June unemployment: 4.0%
> Industry contributing most to job growth: Professional and business services
> Employment growth in professional and business services sector: 48,400

34. Fargo, ND-MN
> Employment increase 2012-2017: 12.6%
> Statewide employment chg. 2012-2017: 5.4%
> June unemployment: 2.3%
> Industry contributing most to job growth: Education and health services
> Employment growth in education and health services sector: 3,000
[in-text-ad-2]

35. Columbus, OH
> Employment increase 2012-2017: 9.1%
> Statewide employment chg. 2012-2017: 3.5%
> June unemployment: 4.4%
> Industry contributing most to job growth: Professional and business services
> Employment growth in professional and business services sector: 26,500

36. Oklahoma City, OK
> Employment increase 2012-2017: 4.1%
> Statewide employment chg. 2012-2017: 0.9%
> June unemployment: 4.4%
> Industry contributing most to job growth: Leisure and hospitality
> Employment growth in leisure and hospitality sector: 11,800
[in-text-ad]

37. Bend-Redmond, OR
> Employment increase 2012-2017: 27.9%
> Statewide employment chg. 2012-2017: 14.0%
> June unemployment: 3.9%
> Industry contributing most to job growth: Professional and business services
> Employment growth in professional and business services sector: 3,500

38. Lancaster, PA
> Employment increase 2012-2017: 8.6%
> Statewide employment chg. 2012-2017: 3.0%
> June unemployment: 4.1%
> Industry contributing most to job growth: Trade, transportation, and utilities
> Employment growth in trade, transportation, and utilities sector: 6,800

39. Providence-Warwick, RI-MA
> Employment increase 2012-2017: 7.0%
> Statewide employment chg. 2012-2017: 6.7%
> June unemployment: 4.3%
> Industry contributing most to job growth: Professional and business services
> Employment growth in professional and business services sector: 9,600
[in-text-ad-2]

40. Hilton Head Island-Bluffton-Beaufort, SC
> Employment increase 2012-2017: 15.9%
> Statewide employment chg. 2012-2017: 12.0%
> June unemployment: 3.9%
> Industry contributing most to job growth: Service-providing
> Employment growth in private service providing sector: 9,700

41. Sioux Falls, SD
> Employment increase 2012-2017: 9.9%
> Statewide employment chg. 2012-2017: 4.3%
> June unemployment: 2.5%
> Industry contributing most to job growth: Trade, transportation, and utilities
> Employment growth in trade, transportation, and utilities sector: 3,200
[in-text-ad]

42. Nashville-Davidson–Murfreesboro–Franklin, TN
> Employment increase 2012-2017: 15.0%
> Statewide employment chg. 2012-2017: 6.4%
> June unemployment: 3.3%
> Industry contributing most to job growth: Professional and business services
> Employment growth in professional and business services sector: 44,300

43. Austin-Round Rock, TX
> Employment increase 2012-2017: 18.4%
> Statewide employment chg. 2012-2017: 8.8%
> June unemployment: 3.4%
> Industry contributing most to job growth: Professional and business services
> Employment growth in professional and business services sector: 42,800

44. St. George, UT
> Employment increase 2012-2017: 28.6%
> Statewide employment chg. 2012-2017: 16.8%
> June unemployment: 4.1%
> Industry contributing most to job growth: Trade, transportation, and utilities
> Employment growth in trade, transportation, and utilities sector: 3,800
[in-text-ad-2]

45. Burlington-South Burlington, VT
> Employment increase 2012-2017: 0.9%
> Statewide employment chg. 2012-2017: -1.5%
> June unemployment: 2.6%
> Industry contributing most to job growth: Education and health services
> Employment growth in education and health services sector: 2,700

46. Richmond, VA
> Employment increase 2012-2017: 9.7%
> Statewide employment chg. 2012-2017: 5.3%
> June unemployment: 4.0%
> Industry contributing most to job growth: Professional and business services
> Employment growth in professional and business services sector: 15,100
[in-text-ad]

47. Wenatchee, WA
> Employment increase 2012-2017: 15.9%
> Statewide employment chg. 2012-2017: 10.8%
> June unemployment: 4.0%
> Industry contributing most to job growth: Leisure and hospitality
> Employment growth in leisure and hospitality sector: 1,500

48. Morgantown, WV
> Employment increase 2012-2017: 5.5%
> Statewide employment chg. 2012-2017: -0.4%
> June unemployment: 4.2%
> Industry contributing most to job growth: Education and health services
> Employment growth in education and health services sector: 1,500

49. Janesville-Beloit, WI
> Employment increase 2012-2017: 11.6%
> Statewide employment chg. 2012-2017: 7.1%
> June unemployment: 3.8%
> Industry contributing most to job growth: Professional and business services
> Employment growth in professional and business services sector: 1,500
[in-text-ad-2]

50. Cheyenne, WY
> Employment increase 2012-2017: 4.9%
> Statewide employment chg. 2012-2017: -2.5%
> June unemployment: 3.7%
> Industry contributing most to job growth: Mining, logging, and construction
> Employment growth in mining, logging, and construction sector: 800
Detailed Findings and Methodology:
One of the two principal factors that can spur economic growth is population growth. People often relocate to a new city for educational and occupational opportunities. With population growth, the labor force also grows — and this often coincides with an increase in the number of jobs. In 45 of the 50 metropolitan areas that added the most jobs, labor force growth was the sharpest over the five years ending June 2017 in their respective states.
Population growth alone, however, is not enough to drive economic and employment growth. The health of the labor market is also an important factor. A healthy job market should be able to accommodate newcomers without losing any of its strength. This was indeed the case in a majority of cities that added the most jobs. In 49 of the 50 cities on this list, the increase in the size of the labor force coincided with a decrease in the number of unemployed workers in the metro area — meaning the majority of new residents were able to find employment, and the job market became healthier overall.
In Anchorage, Alaska, however, the increase in the labor force coincided with an increase in the number of unemployed residents — an indication of unsustainable growth and a job market in declining health.
A number of economic trends have emerged in the wake of the Great Recession. For example, employment in the U.S. construction sector rose 22% between 2012 and 2017, more than twice the 9% growth rate across all industries and the fastest of any sector. Employment grew more than 15% in both in the professional and business services and leisure and hospitality sectors, the second and third most of any industry. Meanwhile, as the price oil fell by nearly 50%, the number of workers in the mining and logging sector fell 17% — the only sector to shed jobs over the past five years.
To determine the cities adding the most jobs in every state, 24/7 Wall St. reviewed employment growth for 398 metropolitan statistical areas for the period of June 2012 to June 2017 with data from the Bureau of Labor Statistics. Supplementary data on unemployment and employment by industry also came from the BLS. Data are not seasonally adjusted.
In 20 Years, I Haven’t Seen A Cash Back Card This Good
After two decades of reviewing financial products I haven’t seen anything like this. Credit card companies are at war, handing out free rewards and benefits to win the best customers.
A good cash back card can be worth thousands of dollars a year in free money, not to mention other perks like travel, insurance, and access to fancy lounges.
Our top pick today pays up to 5% cash back, a $200 bonus on top, and $0 annual fee. Click here to apply before they stop offering rewards this generous.
Flywheel Publishing has partnered with CardRatings for our coverage of credit card products. Flywheel Publishing and CardRatings may receive a commission from card issuers.
Thank you for reading! Have some feedback for us?
Contact the 24/7 Wall St. editorial team.
 24/7 Wall St.
 24/7 Wall St.
 24/7 Wall St.
 24/7 Wall St.


