Special Report
36 Worst Cities to Find a Job for Recent Graduates

Published:
Last Updated:

With student debt levels at record highs, the pressure on college graduates to quickly get a decent paying job is higher than ever. The typical student debt among Americans with a bachelor’s degree is close to $20,000. Among those with a master’s degree it is $36,000, and among those with a professional degree or doctoral degree holder it is $100,000.
While obtaining a college degree is by far the most reliable method of boosting earning potential, stable high paying jobs are by no means guaranteed to college graduates. It pays to consider an area’s economic conditions and labor market before trying to find a job there.
For each U.S. metro area, 24/7 Wall St. examined the concentration of jobs in select industries that tend to require highly educated workers. Nationwide, these industries — professional and business services, education and health services, information, and financial activities — are hiring college graduates.
While it is not a direct measure of job openings for college graduates, in the metro areas with below-average concentrations of jobs in these industries it stands to reason that fewer jobs will also be available to college graduates. Nationwide, 43.5% of workers work in these four white collar industries.
In the 37 metro areas on this list, the share of workers employed across the four white collar sectors tends to be relatively low. Wages across all jobs tend to be relatively low. And the percentage of adults with at least a bachelor’s degree is almost always lower than the national average share.
Click here to see the worst cities to find a job for recent college graduates.
To identify the worst cities to find a job for new grads, 24/7 Wall St. reviewed the annual average employment location quotient for the professional and business service, education and health services, information, and financial activities sectors in each metropolitan statistical area. The location quotient is a measure of concentration that in this case shows the industry’s share of an area’s employment relative to the national average. These are the metro areas with the lowest average location quotients across these four sectors. The four sectors were selected based on having relatively many job openings as well as currently high shares of college-educated workers.
We also reviewed average weekly wages for 22 to 24 year old recent hires of all education levels employed in all industries for at least one quarter obtained from the Quarterly Workforce Indicators (QWI) extraction tool. The percentage of adults in each metropolitan area with at least a bachelor’s degree, and the percentage of people with incomes below the poverty line, came from the U.S. Census Bureau’s 2015 American Community Survey.

36. Bremerton-Silverdale, WA
> White collar sector employment: 43.2%
> Avg. weekly wage, all sectors: $745
> Adults with at least a bachelor’s degree: 30.5%
> June unemployment rate: 4.7%
> Poverty rate: 9.6%
[in-text-ad]
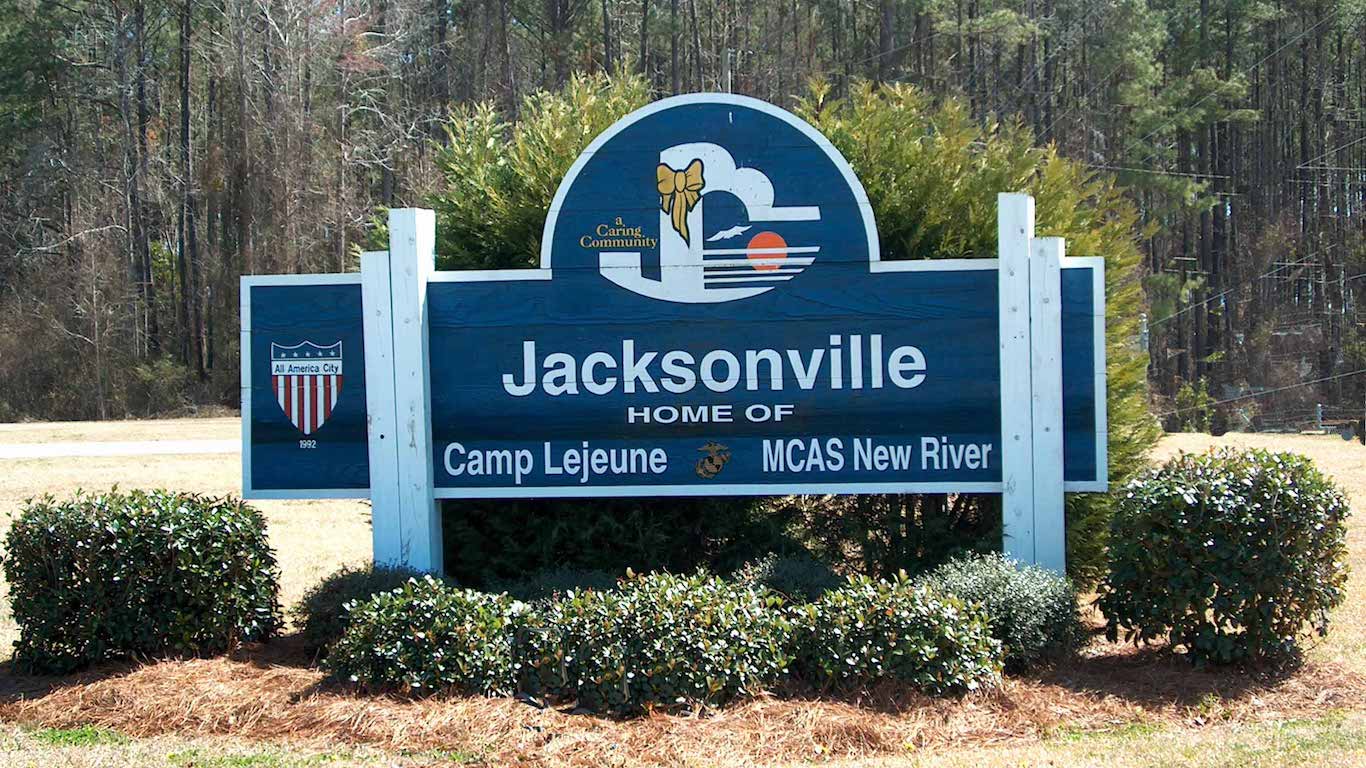
35. Jacksonville, NC
> White collar sector employment: 34.1%
> Avg. weekly wage, all sectors: $544
> Adults with at least a bachelor’s degree: 20.8%
> June unemployment rate: 4.6%
> Poverty rate: 15.4%

34. Ocean City, NJ
> White collar sector employment: 26.8%
> Avg. weekly wage, all sectors: $640
> Adults with at least a bachelor’s degree: 30.7%
> June unemployment rate: 6.1%
> Poverty rate: 8.7%
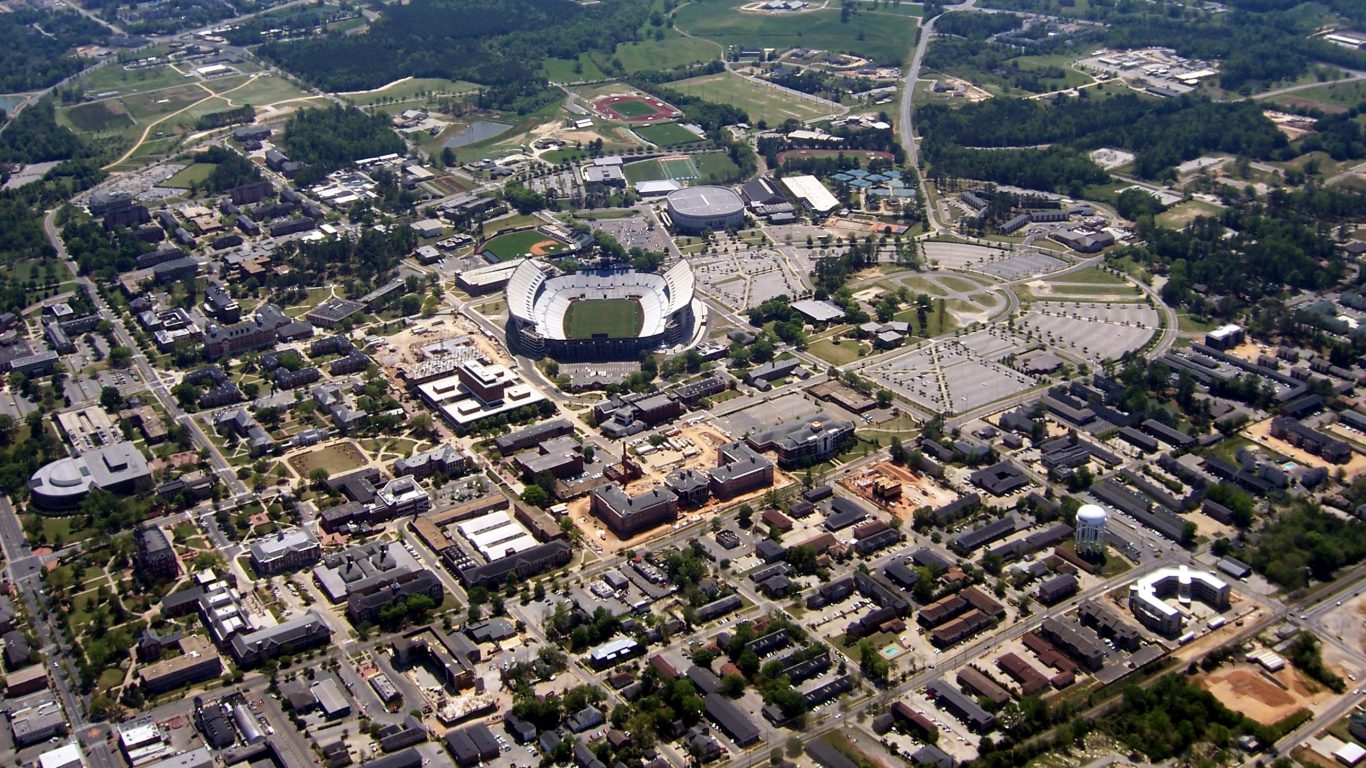
33. Auburn-Opelika, AL
> White collar sector employment: 31.8%
> Avg. weekly wage, all sectors: $624
> Adults with at least a bachelor’s degree: 34.3%
> June unemployment rate: 4.7%
> Poverty rate: 21.9%
[in-text-ad-2]

32. Watertown-Fort Drum, NY
> White collar sector employment: 35.4%
> Avg. weekly wage, all sectors: $691
> Adults with at least a bachelor’s degree: 23.0%
> June unemployment rate: 5.4%
> Poverty rate: 13.4%

31. Albany, OR
> White collar sector employment: 27.4%
> Avg. weekly wage, all sectors: $790
> Adults with at least a bachelor’s degree: 17.2%
> June unemployment rate: 4.6%
> Poverty rate: 15.9%
[in-text-ad]

30. Rocky Mount, NC
> White collar sector employment: 28.0%
> Avg. weekly wage, all sectors: $699
> Adults with at least a bachelor’s degree: 16.4%
> June unemployment rate: 6.4%
> Poverty rate: 22.0%

29. Farmington, NM
> White collar sector employment: 30.7%
> Avg. weekly wage, all sectors: $846
> Adults with at least a bachelor’s degree: 14.1%
> June unemployment rate: 8.0%
> Poverty rate: 19.6%

28. Columbus, IN
> White collar sector employment: 24.7%
> Avg. weekly wage, all sectors: $1,001
> Adults with at least a bachelor’s degree: 29.6%
> June unemployment rate: 2.4%
> Poverty rate: 13.9%
[in-text-ad-2]

27. Mount Vernon-Anacortes, WA
> White collar sector employment: 28.0%
> Avg. weekly wage, all sectors: $804
> Adults with at least a bachelor’s degree: 24.4%
> June unemployment rate: 5.1%
> Poverty rate: 16.0%

26. Jefferson City, MO
> White collar sector employment: 34.6%
> Avg. weekly wage, all sectors: $756
> Adults with at least a bachelor’s degree: 27.1%
> June unemployment rate: 3.5%
> Poverty rate: 13.5%
[in-text-ad]

25. Anniston-Oxford-Jacksonville, AL
> White collar sector employment: 33.4%
> Avg. weekly wage, all sectors: $659
> Adults with at least a bachelor’s degree: 17.3%
> June unemployment rate: 5.9%
> Poverty rate: 20.0%

24. Norwich-New London, CT
> White collar sector employment: 33.7%
> Avg. weekly wage, all sectors: $1,034
> Adults with at least a bachelor’s degree: 33.4%
> June unemployment rate: 0.0%
> Poverty rate: 11.4%

23. East Stroudsburg, PA
> White collar sector employment: 27.9%
> Avg. weekly wage, all sectors: $722
> Adults with at least a bachelor’s degree: 24.9%
> June unemployment rate: 6.0%
> Poverty rate: 12.5%
[in-text-ad-2]

22. New Bern, NC
> White collar sector employment: 36.5%
> Avg. weekly wage, all sectors: $680
> Adults with at least a bachelor’s degree: 23.0%
> June unemployment rate: 4.3%
> Poverty rate: 13.7%

21. Ames, IA
> White collar sector employment: 35.3%
> Avg. weekly wage, all sectors: $800
> Adults with at least a bachelor’s degree: 51.6%
> June unemployment rate: 2.6%
> Poverty rate: 20.7%
[in-text-ad]
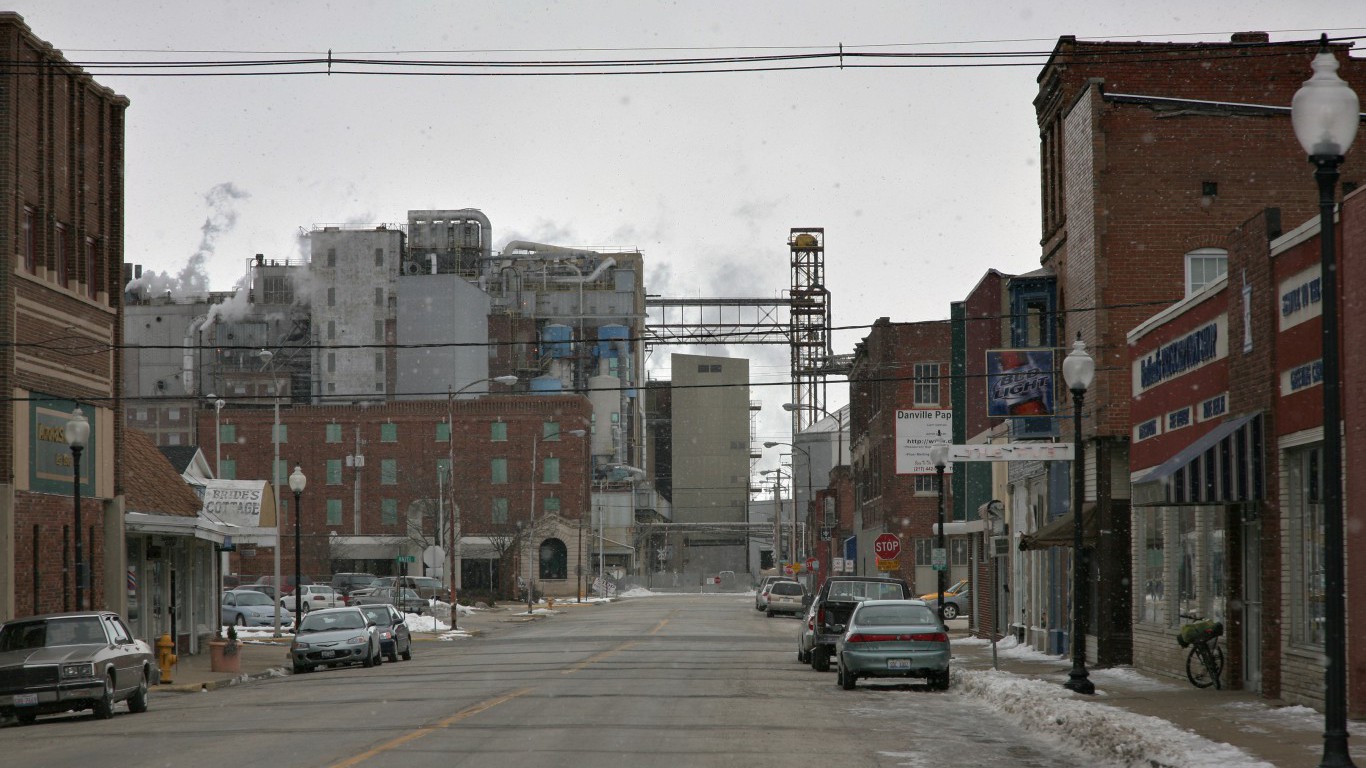
22. Danville, IL
> White collar sector employment: 26.5%
> Avg. weekly wage, all sectors: $771
> Adults with at least a bachelor’s degree: 13.0%
> June unemployment rate: 6.8%
> Poverty rate: 18.1%

19. Odessa, TX
> White collar sector employment: 21.6%
> Avg. weekly wage, all sectors: $1,016
> Adults with at least a bachelor’s degree: 16.2%
> June unemployment rate: 4.7%
> Poverty rate: 11.7%

18. Morristown, TN
> White collar sector employment: 26.7%
> Avg. weekly wage, all sectors: $739
> Adults with at least a bachelor’s degree: 14.9%
> June unemployment rate: 4.4%
> Poverty rate: 17.7%
[in-text-ad-2]

17. Gulfport-Biloxi-Pascagoula, MS
> White collar sector employment: 27.8%
> Avg. weekly wage, all sectors: $764
> Adults with at least a bachelor’s degree: 20.4%
> June unemployment rate: 6.0%
> Poverty rate: 20.0%

16. Blacksburg-Christiansburg-Radford, VA
> White collar sector employment: 31.2%
> Avg. weekly wage, all sectors: $714
> Adults with at least a bachelor’s degree: 35.2%
> June unemployment rate: 4.5%
> Poverty rate: 19.0%
[in-text-ad]

15. Bakersfield, CA
> White collar sector employment: 27.9%
> Avg. weekly wage, all sectors: $785
> Adults with at least a bachelor’s degree: 16.2%
> June unemployment rate: 9.5%
> Poverty rate: 21.9%

14. Flagstaff, AZ
> White collar sector employment: 31.0%
> Avg. weekly wage, all sectors: $710
> Adults with at least a bachelor’s degree: 33.1%
> June unemployment rate: 5.8%
> Poverty rate: 20.0%

13. Madera, CA
> White collar sector employment: 29.1%
> Avg. weekly wage, all sectors: $738
> Adults with at least a bachelor’s degree: 15.4%
> June unemployment rate: 8.1%
> Poverty rate: 23.4%

12. Elkhart-Goshen, IN
> White collar sector employment: 20.4%
> Avg. weekly wage, all sectors: $891
> Adults with at least a bachelor’s degree: 18.3%
> June unemployment rate: 2.3%
> Poverty rate: 15.1%
[in-text-ad]

11. College Station-Bryan, TX
> White collar sector employment: 34.3%
> Avg. weekly wage, all sectors: $721
> Adults with at least a bachelor’s degree: 36.3%
> June unemployment rate: 3.8%
> Poverty rate: 23.0%

10. Wenatchee, WA
> White collar sector employment: 24.8%
> Avg. weekly wage, all sectors: $654
> Adults with at least a bachelor’s degree: 21.6%
> June unemployment rate: 4.0%
> Poverty rate: 11.4%

9. Yakima, WA
> White collar sector employment: 24.8%
> Avg. weekly wage, all sectors: $671
> Adults with at least a bachelor’s degree: 15.7%
> June unemployment rate: 5.0%
> Poverty rate: 18.8%
[in-text-ad-2]

8. Dalton, GA
> White collar sector employment: 20.9%
> Avg. weekly wage, all sectors: $801
> Adults with at least a bachelor’s degree: 13.4%
> June unemployment rate: 5.5%
> Poverty rate: 15.2%

7. Salinas, CA
> White collar sector employment: 23.5%
> Avg. weekly wage, all sectors: $795
> Adults with at least a bachelor’s degree: 23.3%
> June unemployment rate: 5.5%
> Poverty rate: 15.3%
[in-text-ad]
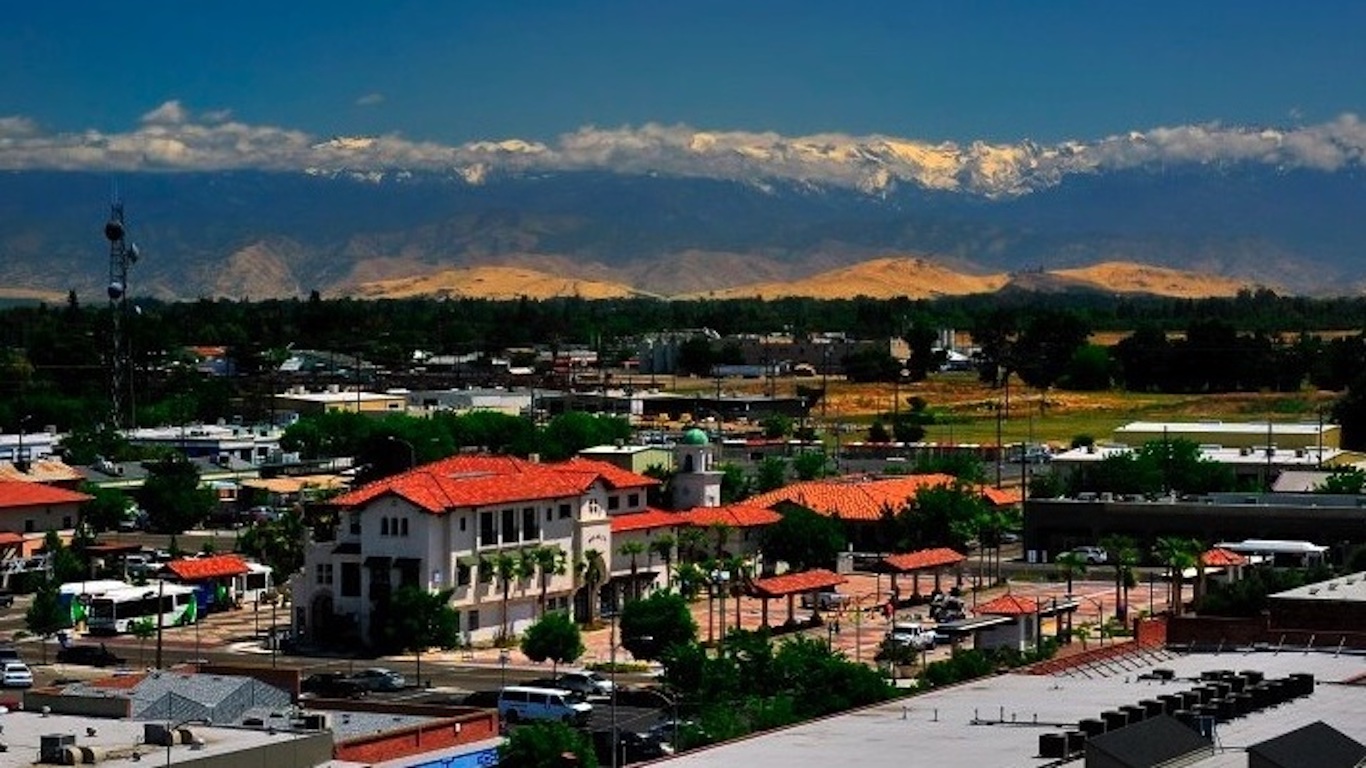
6. Visalia-Porterville, CA
> White collar sector employment: 23.1%
> Avg. weekly wage, all sectors: $670
> Adults with at least a bachelor’s degree: 14.2%
> June unemployment rate: 9.9%
> Poverty rate: 27.6%

5. Merced, CA
> White collar sector employment: 25.1%
> Avg. weekly wage, all sectors: $711
> Adults with at least a bachelor’s degree: 14.4%
> June unemployment rate: 9.4%
> Poverty rate: 26.7%

4. El Centro, CA
> White collar sector employment: 28.7%
> Avg. weekly wage, all sectors: $566
> Adults with at least a bachelor’s degree: 14.3%
> June unemployment rate: 20.8%
> Poverty rate: 25.1%
[in-text-ad-2]

3. Warner Robins, GA
> White collar sector employment: 31.0%
> Avg. weekly wage, all sectors: $692
> Adults with at least a bachelor’s degree: 20.7%
> June unemployment rate: 5.2%
> Poverty rate: 17.8%

2. Hanford-Corcoran, CA
> White collar sector employment: 26.7%
> Avg. weekly wage, all sectors: $704
> Adults with at least a bachelor’s degree: 16.1%
> June unemployment rate: 9.2%
> Poverty rate: 23.6%
[in-text-ad]

1. Hinesville, GA
> White collar sector employment: 27.3%
> Avg. weekly wage, all sectors: $686
> Adults with at least a bachelor’s degree: 17.5%
> June unemployment rate: 5.3%
> Poverty rate: 22.0%
The last few years made people forget how much banks and CD’s can pay. Meanwhile, interest rates have spiked and many can afford to pay you much more, but most are keeping yields low and hoping you won’t notice.
But there is good news. To win qualified customers, some accounts are paying almost 10x the national average! That’s an incredible way to keep your money safe and earn more at the same time. Our top pick for high yield savings accounts includes other benefits as well. You can earn up to 3.80% with a Checking & Savings Account today Sign up and get up to $300 with direct deposit. No account fees. FDIC Insured.
Click here to see how much more you could be earning on your savings today. It takes just a few minutes to open an account to make your money work for you.
Thank you for reading! Have some feedback for us?
Contact the 24/7 Wall St. editorial team.