From Europeans heading west in the 19th century to immigrants searching for a fresh start, leaving home in pursuit of opportunity has long been a central part of the American dream. Today, cities and local areas across the United States are actually competing for new residents. Just 11.2% of Americans moved in the past year — an all-time low.
These days, most people who move do not relocate very far, but move within the same general area. With the presence of friends and family, a job, and familiar general surrounding, people often move to improve living conditions. Other reasons could include end of a lease, moving to be closer to work or family, to a better school district, to cut costs, or to a more suitable neighborhood, among many other reasons.
Of course, just as different cities are more or less expensive places to live, moving costs within different U.S. cities vary significantly.
24/7 Wall St. reviewed the total cost to move within major U.S. metro areas and ranked the top 25 most expensive cities to move. The ranking is based on calculations by real estate data company Moving Inc. that reflect the costs of moving within the principal city of large metropolitan regions. We also considered the median price of one month’s rent plus a deposit for a three bedroom housing unit.
Click here to see the most expensive cities to move.
Click here to see the detailed findings and methodology.

25. Las Vegas-Henderson-Paradise, NV
> Average total moving cost: $3,715
> 1st month’s rent and deposit: $2,482
> Cost of living: 1.3% less than nation
> Median household income: $51,552
> Population change from migration: 6.4%
[in-text-ad]

24. Philadelphia-Camden-Wilmington, PA-NJ-DE-MO
> Average total moving cost: $3,744
> 1st month’s rent and deposit: $2,462
> Cost of living: 6.3% greater than nation
> Median household income: $65,123
> Population change from migration: -0.1%

23. Chicago-Naperville-Elgin, IL-IN-WI
> Average total moving cost: $3,748
> 1st month’s rent and deposit: $2,446
> Cost of living: 4.6% greater than nation
> Median household income: $63,153
> Population change from migration: -2.8%

22. Stockton-Lodi, CA
> Average total moving cost: $3,820
> 1st month’s rent and deposit: $2,558
> Cost of living: 0.4% greater than nation
> Median household income: $53,705
> Population change from migration: 2.5%
[in-text-ad-2]

21. New Haven-Milford, CT
> Average total moving cost: $3,868
> 1st month’s rent and deposit: $2,610
> Cost of living: 12.1% greater than nation
> Median household income: $61,760
> Population change from migration: -1.5%

20. Colorado Springs, CO
> Average total moving cost: $3,909
> 1st month’s rent and deposit: $2,670
> Cost of living: 0.2% greater than nation
> Median household income: $60,458
> Population change from migration: 5.1%
[in-text-ad]

19. Virginia Beach-Norfolk-Newport News, VA-NC
> Average total moving cost: $3,912
> 1st month’s rent and deposit: $2,678
> Cost of living: 2.0% less than nation
> Median household income: $60,093
> Population change from migration: -0.5%

18. Minneapolis-St. Paul-Bloomington, MN-WI
> Average total moving cost: $3,942
> 1st month’s rent and deposit: $2,666
> Cost of living: 2.4% greater than nation
> Median household income: $71,008
> Population change from migration: 1.7%

17. Riverside-San Bernardino-Ontario, CA
> Average total moving cost: $3,977
> 1st month’s rent and deposit: $2,728
> Cost of living: 6.7% greater than nation
> Median household income: $56,087
> Population change from migration: 2.2%
[in-text-ad-2]

16. Portland-Vancouver-Hillsboro, OR-WA
> Average total moving cost: $4,027
> 1st month’s rent and deposit: $2,734
> Cost of living: 1.8% greater than nation
> Median household income: $63,850
> Population change from migration: 5.6%

15. Austin-Round Rock, TX
> Average total moving cost: $4,098
> 1st month’s rent and deposit: $2,860
> Cost of living: 0.5% less than nation
> Median household income: $67,195
> Population change from migration: 13.4%
[in-text-ad]

14. Sacramento–Roseville–Arden-Arcade, CA
> Average total moving cost: $4,120
> 1st month’s rent and deposit: $2,858
> Cost of living: 2.6% greater than nation
> Median household income: $62,813
> Population change from migration: 3.5%

13. Baltimore-Columbia-Towson, MD
> Average total moving cost: $4,158
> 1st month’s rent and deposit: $2,888
> Cost of living: 7.5% greater than nation
> Median household income: $72,520
> Population change from migration: 1.0%

12. Denver-Aurora-Lakewood, CO
> Average total moving cost: $4,288
> 1st month’s rent and deposit: $3,016
> Cost of living: 6.0% greater than nation
> Median household income: $70,283
> Population change from migration: 7.5%
[in-text-ad-2]

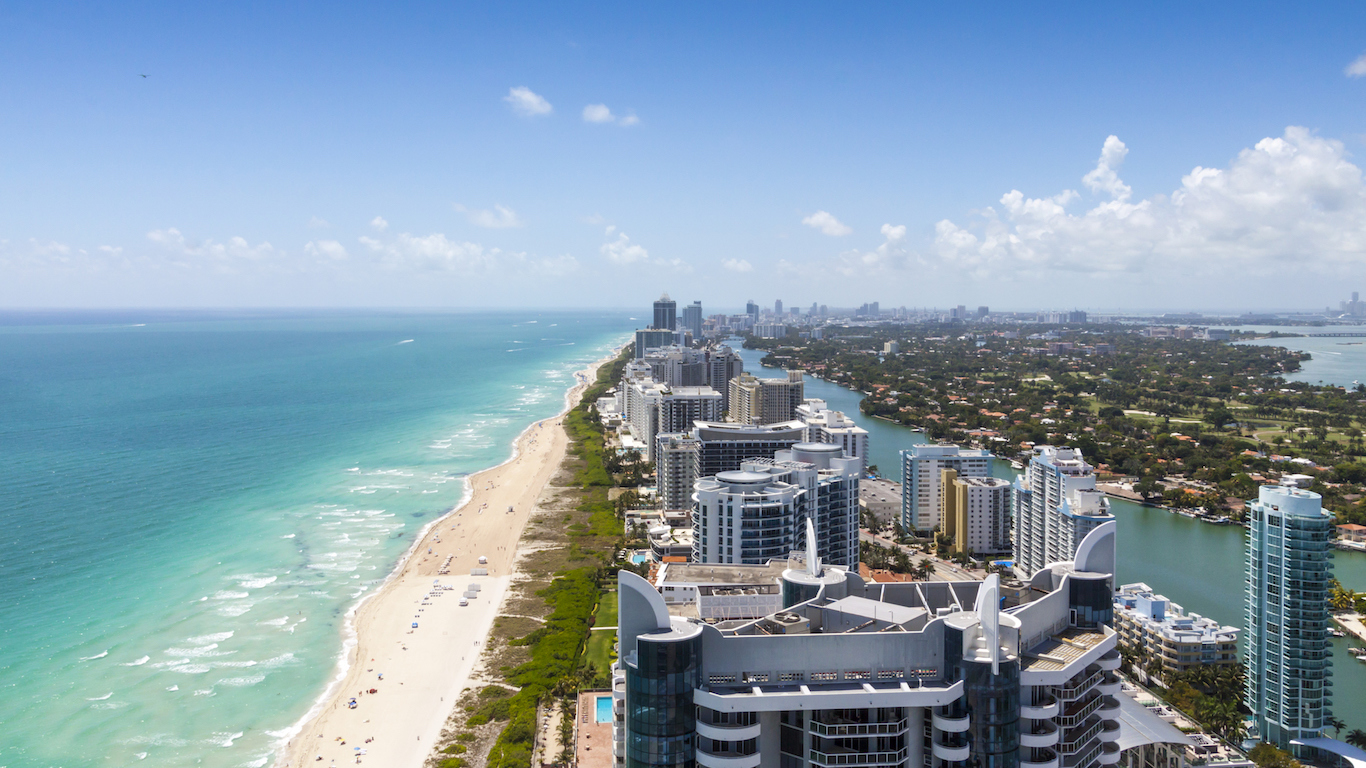
11. Miami-Fort Lauderdale-West Palm Beach, FL
> Average total moving cost: $4,357
> 1st month’s rent and deposit: $3,100
> Cost of living: 6.8% greater than nation
> Median household income: $50,441
> Population change from migration: 6.7%

10. Seattle-Tacoma-Bellevue, WA
> Average total moving cost: $4,395
> 1st month’s rent and deposit: $3,110
> Cost of living: 9.4% greater than nation
> Median household income: $75,331
> Population change from migration: 6.4%
[in-text-ad]

9. Boston-Cambridge-Newton, MA-NH
> Average total moving cost: $4,450
> 1st month’s rent and deposit: $3,144
> Cost of living: 10.3% greater than nation
> Median household income: $78,800
> Population change from migration: 3.2%

8. New York-Newark-Jersey City, NY-NJ-PA
> Average total moving cost: $4,631
> 1st month’s rent and deposit: $3,130
> Cost of living: 21.9% greater than nation
> Median household income: $68,743
> Population change from migration: -0.3%

7. Bridgeport-Stamford-Norwalk, CT
> Average total moving cost: $4,921
> 1st month’s rent and deposit: $3,510
> Cost of living: 20.1% greater than nation
> Median household income: $86,414
> Population change from migration: 0.7%
[in-text-ad-2]

6. Washington-Arlington-Alexandria, DC-VA-MD-WV
> Average total moving cost: $4,926
> 1st month’s rent and deposit: $3,636
> Cost of living: 19.1% greater than nation
> Median household income: $93,294
> Population change from migration: 3.5%

5. Los Angeles-Long Beach-Anaheim, CA
> Average total moving cost: $4,962
> 1st month’s rent and deposit: $3,658
> Cost of living: 17.6% greater than nation
> Median household income: $62,544
> Population change from migration: -0.4%
[in-text-ad]

4. San Diego-Carlsbad, CA
> Average total moving cost: $5,098
> 1st month’s rent and deposit: $3,778
> Cost of living: 16.6% greater than nation
> Median household income: $67,320
> Population change from migration: 2.4%

3. Oxnard-Thousand Oaks-Ventura, CA
> Average total moving cost: $5,190
> 1st month’s rent and deposit: $3,884
> Cost of living: 16.1% greater than nation
> Median household income: $80,032
> Population change from migration: -0.7%

2. San Francisco-Oakland-Hayward, CA
> Average total moving cost: $5,302
> 1st month’s rent and deposit: $3,996
> Cost of living: 21.9% greater than nation
> Median household income: $88,518
> Population change from migration: 4.8%
[in-text-ad-2]

1. San Jose-Sunnyvale-Santa Clara, CA
> Average total moving cost: $5,798
> 1st month’s rent and deposit: $4,496
> Cost of living: 24.1% greater than nation
> Median household income: $101,980
> Population change from migration: 3.0%
Detailed Findings & Methodology
Generally, the most expensive cities to live are also the most expensive cities to move — although this is not always the case. Usually, a security deposit equal to one or more month’s rent is the largest cost when moving. In cities where rents are high, security deposits are therefore high as well. The list is dominated by cities with high average rents. The median rent for a three-bedroom housing unit in the five most expensive cities to move — all in California — is between $1,850 and $2,250 per month.
Of the 25 cities on this list, all but three are more expensive to live compared to the average cost of living nationwide.
The vast majority of these areas also report relatively strong population growth. However, seven of the 25 most expensive cities to move reported population declines.
To identify the most expensive cities to move, 24/7 Wall St. calculated a total moving cost in the 100 largest U.S. metropolitan areas based on two measurements: 1. The median price of one month’s rent plus a security deposit of one month’s rent for a three-bedroom housing unit from the U.S. Census Bureau’s 2015 American Community Survey. 2. The estimated moving cost within the most populated zip code in the principal city of each metro area with data from real estate data company Moving Inc.
The cost of living, based on regional price parity in 2015, came from the Bureau of Economic Analysis. We also considered the 2015 median household income, as well as population change due to net migration from 2010 to 2016 from the U.S. Census Bureau’s American Community Survey.
Are You Still Paying With a Debit Card?
The average American spends $17,274 on debit cards a year, and it’s a HUGE mistake. First, debit cards don’t have the same fraud protections as credit cards. Once your money is gone, it’s gone. But more importantly you can actually get something back from this spending every time you swipe.
Issuers are handing out wild bonuses right now. With some you can earn up to 5% back on every purchase. That’s like getting a 5% discount on everything you buy!
Our top pick is kind of hard to imagine. Not only does it pay up to 5% back, it also includes a $200 cash back reward in the first six months, a 0% intro APR, and…. $0 annual fee. It’s quite literally free money for any one that uses a card regularly. Click here to learn more!
Flywheel Publishing has partnered with CardRatings to provide coverage of credit card products. Flywheel Publishing and CardRatings may receive a commission from card issuers.
Thank you for reading! Have some feedback for us?
Contact the 24/7 Wall St. editorial team.
 24/7 Wall St.
 24/7 Wall St.
 24/7 Wall St.


