Special Report
How Many People Have Preexisting Conditions in Every State

Published:
Last Updated:

Prior to the passing of the Affordable Care Act in 2010 – commonly referred to as “Obamacare” – most insurance providers would issue policies based on a customer’s current health and health history. For this reason, many Americans with preexisting conditions were denied access to private health insurance and treatment. According to the Kaiser Family Foundation, the number of American adults under 65 years old with such health conditions is now 27%.
The share of people with preexisting conditions that would be denied coverage under the pre-ACA system varies from state to state. Poorer states such as West Virginia, Mississippi, and Alabama often have the largest shares of the population with a preexisting condition. In fact, the five states with the lowest median household incomes in the country are also those with the greatest shares of people suffering preexisting conditions.
The average life expectancy in these states is also lower than average – likely, at least in part, due to the poor health of the populations.While the national life expectancy at birth is nearly 79 years, life expectancies do not exceed 76 years in seven of the 10 states with the highest share of people with preexisting conditions. Conversely, the life expectancy of the populations in those states with the lowest shares of people with preexisting conditions is generally around 80 years.

Before the Affordable Care Act, insurance companies could deny coverage based on conditions such as Crohn’s disease, obesity, and even pregnancy. Repeal may result in the return of such policies, unless other protections are put in place.
Click here to see how many people have preexisting conditions in every state.
24/7 Wall St. analyzed data from the Kaiser Family Foundation on the number of Americans that have health conditions that would likely leave them uninsurable by private providers prior to the ACA. Data on the percentage of the each state’s population without health insurance coverage and median household income for each state is from the U.S. Census Bureau’s 2015 American Community Survey one-year estimates. We also included 2013 life expectancy at birth from the Institute for Health Metrics and Evaluation, a global health research center affiliated with the University of Washington.

50. Colorado
> Population w/ preexisting conditions: 22% (tied)
> Pct. uninsured: 8.1% (22nd lowest)
> Median household income: $63,909 (11th highest)
> Life expectancy at birth: 80.3 (tied for 7th highest)
[in-text-ad]

49. Minnesota
> Population w/ preexisting conditions: 22% (tied)
> Pct. uninsured: 4.5% (4th lowest)
> Median household income: $63,488 (12th highest)
> Life expectancy at birth: 80.7 (tied for 4th highest)

48. Alaska
> Population w/ preexisting conditions: 23% (tied)
> Pct. uninsured: 14.9% (2nd highest)
> Median household income: $73,355 (3rd highest)
> Life expectancy at birth: 78.8 (tied for 24th lowest)

47. New Jersey
> Population w/ preexisting conditions: 23% (tied)
> Pct. uninsured: 8.7% (25th highest)
> Median household income: $72,222 (4th highest)
> Life expectancy at birth: 80.3 (tied for 7th highest)
[in-text-ad-2]

46. Utah
> Population w/ preexisting conditions: 23% (tied)
> Pct. uninsured: 10.5% (16th highest)
> Median household income: $62,912 (13th highest)
> Life expectancy at birth: 79.9 (11th highest)

45. California
> Population w/ preexisting conditions: 24% (tied)
> Pct. uninsured: 8.6% (25th lowest)
> Median household income: $64,500 (9th highest)
> Life expectancy at birth: 80.9 (2nd highest)
[in-text-ad]

44. Connecticut
> Population w/ preexisting conditions: 24% (tied)
> Pct. uninsured: 6.0% (tied for 11th lowest)
> Median household income: $71,346 (5th highest)
> Life expectancy at birth: 80.8 (3rd highest)

43. Hawaii
> Population w/ preexisting conditions: 24% (tied)
> Pct. uninsured: 4.0% (3rd lowest)
> Median household income: $73,486 (2nd highest)
> Life expectancy at birth: 81.2 (the highest)

42. Iowa
> Population w/ preexisting conditions: 24% (tied)
> Pct. uninsured: 5.0% (5th lowest)
> Median household income: $54,736 (25th highest)
> Life expectancy at birth: 79.3 (tied for 21st highest)
[in-text-ad-2]

41. Massachusetts
> Population w/ preexisting conditions: 24% (tied)
> Pct. uninsured: 2.8% (the lowest)
> Median household income: $70,628 (6th highest)
> Life expectancy at birth: 80.7 (tied for 4th highest)

40. New Hampshire
> Population w/ preexisting conditions: 24% (tied)
> Pct. uninsured: 6.3% (13th lowest)
> Median household income: $70,303 (7th highest)
> Life expectancy at birth: 80.1 (10th highest)
[in-text-ad]

39. North Dakota
> Population w/ preexisting conditions: 24% (tied)
> Pct. uninsured: 7.8% (21st lowest)
> Median household income: $60,557 (16th highest)
> Life expectancy at birth: 79.5 (tied for 17th highest)

38. Idaho
> Population w/ preexisting conditions: 25% (tied)
> Pct. uninsured: 11.0% (12th highest)
> Median household income: $48,275 (11th lowest)
> Life expectancy at birth: 79.2 (tied for 23rd highest)

37. Montana
> Population w/ preexisting conditions: 25% (tied)
> Pct. uninsured: 11.6% (9th highest)
> Median household income: $49,509 (14th lowest)
> Life expectancy at birth: 78.8 (tied for 24th lowest)
[in-text-ad-2]

36. Nebraska
> Population w/ preexisting conditions: 25% (tied)
> Pct. uninsured: 8.2% (23rd lowest)
> Median household income: $54,996 (24th highest)
> Life expectancy at birth: 79.5 (tied for 17th highest)

35. Nevada
> Population w/ preexisting conditions: 25% (tied)
> Pct. uninsured: 12.3% (7th highest)
> Median household income: $52,431 (22nd lowest)
> Life expectancy at birth: 78.2 (tied for 17th lowest)
[in-text-ad]

34. New York
> Population w/ preexisting conditions: 25% (tied)
> Pct. uninsured: 7.1% (tied for 20th lowest)
> Median household income: $60,850 (15th highest)
> Life expectancy at birth: 80.5 (6th highest)

33. Rhode Island
> Population w/ preexisting conditions: 25% (tied)
> Pct. uninsured: 5.7% (tied for 7th lowest)
> Median household income: $58,073 (19th highest)
> Life expectancy at birth: 79.7 (tied for 13th highest)

32. South Dakota
> Population w/ preexisting conditions: 25% (tied)
> Pct. uninsured: 10.2% (18th highest)
> Median household income: $53,017 (23rd lowest)
> Life expectancy at birth: 79.5 (tied for 17th highest)
[in-text-ad-2]

31. Vermont
> Population w/ preexisting conditions: 25% (tied)
> Pct. uninsured: 3.8% (2nd lowest)
> Median household income: $56,990 (20th highest)
> Life expectancy at birth: 79.8 (12th highest)

30. Washington
> Population w/ preexisting conditions: 25% (tied)
> Pct. uninsured: 6.6% (tied for 17th lowest)
> Median household income: $64,129 (10th highest)
> Life expectancy at birth: 80.2 (9th highest)
[in-text-ad]

29. Wisconsin
> Population w/ preexisting conditions: 25% (tied)
> Pct. uninsured: 5.7% (tied for 7th lowest)
> Median household income: $55,638 (23rd highest)
> Life expectancy at birth: 79.6 (tied for 15th highest)

28. Arizona
> Population w/ preexisting conditions: 26% (tied)
> Pct. uninsured: 10.8% (15th highest)
> Median household income: $51,492 (20th lowest)
> Life expectancy at birth: 79.6 (tied for 15th highest)

27. Florida
> Population w/ preexisting conditions: 26% (tied)
> Pct. uninsured: 13.3% (5th highest)
> Median household income: $49,426 (13th lowest)
> Life expectancy at birth: 79.7 (tied for 13th highest)
[in-text-ad-2]

26. Illinois
> Population w/ preexisting conditions: 26% (tied)
> Pct. uninsured: 7.1% (tied for 20th lowest)
> Median household income: $59,588 (18th highest)
> Life expectancy at birth: 79.2 (tied for 23rd highest)

25. Maryland
> Population w/ preexisting conditions: 26% (tied)
> Pct. uninsured: 6.6% (tied for 17th lowest)
> Median household income: $75,847 (the highest)
> Life expectancy at birth: 79.3 (tied for 21st highest)
[in-text-ad]

24. Virginia
> Population w/ preexisting conditions: 26% (tied)
> Pct. uninsured: 9.1% (tied for 23rd highest)
> Median household income: $66,262 (8th highest)
> Life expectancy at birth: 79.1 (tied for 25th highest)

23. New Mexico
> Population w/ preexisting conditions: 27% (tied)
> Pct. uninsured: 10.9% (tied for13th highest)
> Median household income: $45,382 (6th lowest)
> Life expectancy at birth: 78.2 (tied for 17th lowest)

22. North Carolina
> Population w/ preexisting conditions: 27% (tied)
> Pct. uninsured: 11.2% (11th highest)
> Median household income: $47,830 (10th lowest)
> Life expectancy at birth: 77.9 (14th lowest)
[in-text-ad-2]

21. Oregon
> Population w/ preexisting conditions: 27% (tied)
> Pct. uninsured: 7.0% (18th lowest)
> Median household income: $54,148 (25th lowest)
> Life expectancy at birth: 79.5 (tied for 17th highest)

20. Pennsylvania
> Population w/ preexisting conditions: 27% (tied)
> Pct. uninsured: 6.4% (14th lowest)
> Median household income: $55,702 (21st highest)
> Life expectancy at birth: 78.6 (tied for 21st lowest)
[in-text-ad]

19. Texas
> Population w/ preexisting conditions: 27% (tied)
> Pct. uninsured: 17.1% (the highest)
> Median household income: $55,653 (22nd highest)
> Life expectancy at birth: 78.6 (tied for 21st lowest)

18. Wyoming
> Population w/ preexisting conditions: 27% (tied)
> Pct. uninsured: 11.5% (10th highest)
> Median household income: $60,214 (17th highest)
> Life expectancy at birth: 78.5 (18th lowest)

17. Michigan
> Population w/ preexisting conditions: 28% (tied)
> Pct. uninsured: 6.1% (12th lowest)
> Median household income: $51,084 (18th lowest)
> Life expectancy at birth: 78.1 (15th lowest)
[in-text-ad-2]

16. Ohio
> Population w/ preexisting conditions: 28% (tied)
> Pct. uninsured: 6.5% (15th lowest)
> Median household income: $51,075 (17th lowest)
> Life expectancy at birth: 77.6 (tied for 13th lowest)

15. South Carolina
> Population w/ preexisting conditions: 28% (tied)
> Pct. uninsured: 10.9% (tied for 13th highest)
> Median household income: $47,238 (8th lowest)
> Life expectancy at birth: 76.9 (9th lowest)
[in-text-ad]

14. Delaware
> Population w/ preexisting conditions: 29% (tied)
> Pct. uninsured: 5.9% (8th lowest)
> Median household income: $61,255 (14th highest)
> Life expectancy at birth: 78.8 (tied for 24th lowest)

13. Georgia
> Population w/ preexisting conditions: 29% (tied)
> Pct. uninsured: 13.9% (tied for 3rd highest)
> Median household income: $51,244 (19th lowest)
> Life expectancy at birth: 77.5 (11th lowest)

12. Maine
> Population w/ preexisting conditions: 29% (tied)
> Pct. uninsured: 8.4% (24th lowest)
> Median household income: $51,494 (21st lowest)
> Life expectancy at birth: 79.1 (tied for 25th highest)
[in-text-ad-2]

11. Indiana
> Population w/ preexisting conditions: 30% (tied)
> Pct. uninsured: 9.6% (21st highest)
> Median household income: $50,532 (16th lowest)
> Life expectancy at birth: 77.3 (10th lowest)

10. Kansas
> Population w/ preexisting conditions: 30% (tied)
> Pct. uninsured: 9.1% (tied for 23rd highest)
> Median household income: $53,906 (24th lowest)
> Life expectancy at birth: 78.6 (tied for 21st lowest)
[in-text-ad]

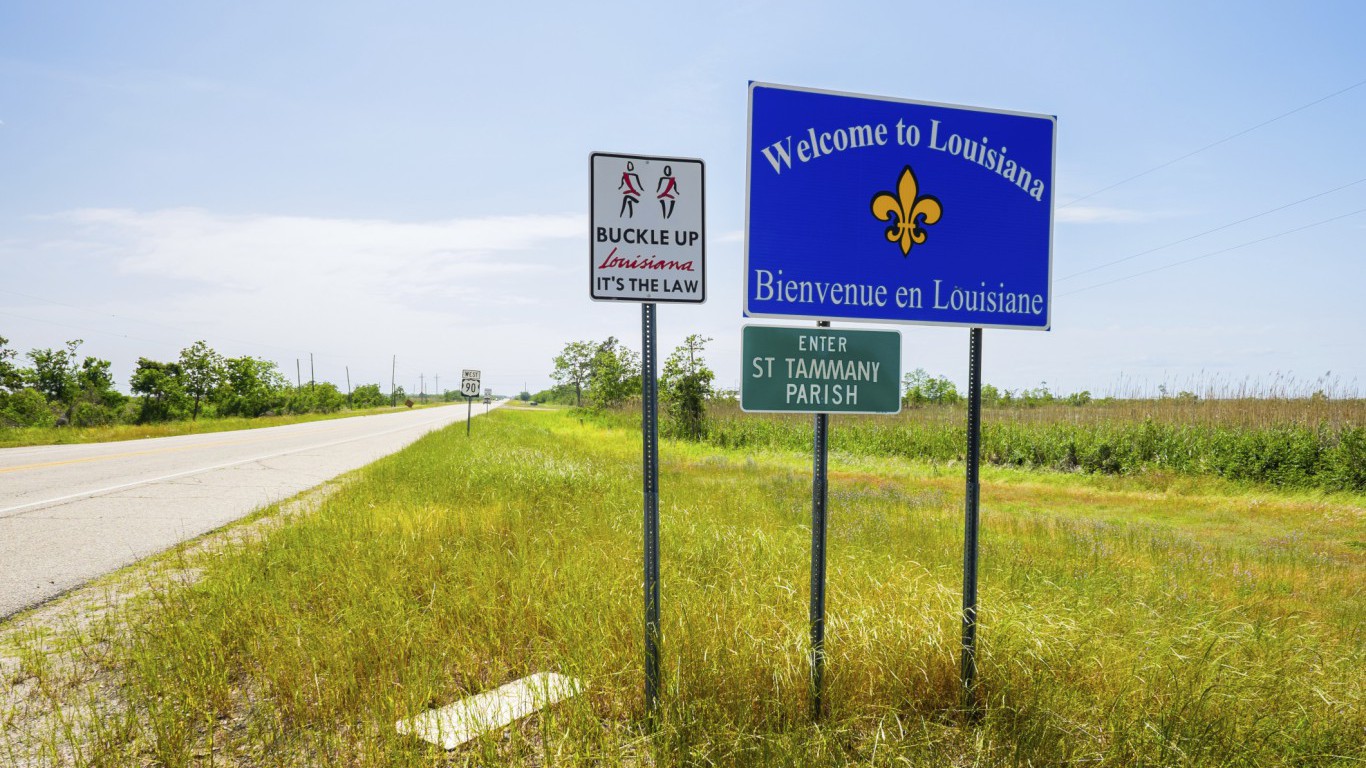
9. Louisiana
> Population w/ preexisting conditions: 30% (tied)
> Pct. uninsured: 11.9% (8th highest)
> Median household income: $45,727 (7th lowest)
> Life expectancy at birth: 75.8 (tied for 7th lowest)

8. Missouri
> Population w/ preexisting conditions: 30% (tied)
> Pct. uninsured: 9.8% (20th lowest)
> Median household income: $50,238 (15th lowest)
> Life expectancy at birth: 77.6 (tied for 13th lowest)

7. Oklahoma
> Population w/ preexisting conditions: 31%
> Pct. uninsured: 13.9% (tied for 3rd highest)
> Median household income: $48,568 (12th lowest)
> Life expectancy at birth: 75.8 (tied for 7th lowest)
[in-text-ad-2]

6. Arkansas
> Population w/ preexisting conditions: 32% (tied)
> Pct. uninsured: 9.5% (22nd highest)
> Median household income: $41,995 (2nd lowest)
> Life expectancy at birth: 75.8 (tied for 7th lowest)

5. Tennessee
> Population w/ preexisting conditions: 32% (tied)
> Pct. uninsured: 10.3% (17th highest)
> Median household income: $47,275 (9th lowest)
> Life expectancy at birth: 76.4 (8th lowest)
[in-text-ad]

4. Alabama
> Population w/ preexisting conditions: 33% (tied)
> Pct. uninsured: 10.1% (19th highest)
> Median household income: $44,765 (4th lowest)
> Life expectancy at birth: 75.4 (tied for 3rd lowest)

3. Kentucky
> Population w/ preexisting conditions: 33% (tied)
> Pct. uninsured: 6.0% (tied for 11th lowest)
> Median household income: $45,215 (5th lowest)
> Life expectancy at birth: 75.8 (tied for 7th lowest)

2. Mississippi
> Population w/ preexisting conditions: 34%
> Pct. uninsured: 12.7% (6th highest)
> Median household income: $40,593 (the lowest)
> Life expectancy at birth: 74.8 (the lowest)
[in-text-ad-2]

1. West Virginia
> Population w/ preexisting conditions: 36%
> Pct. uninsured: 6.0% (tied for 11th lowest)
> Median household income: $42,019 (3rd lowest)
> Life expectancy at birth: 75.4 (tied for 3rd lowest)
Start by taking a quick retirement quiz from SmartAsset that will match you with up to 3 financial advisors that serve your area and beyond in 5 minutes, or less.
Each advisor has been vetted by SmartAsset and is held to a fiduciary standard to act in your best interests.
Here’s how it works:
1. Answer SmartAsset advisor match quiz
2. Review your pre-screened matches at your leisure. Check out the advisors’ profiles.
3. Speak with advisors at no cost to you. Have an introductory call on the phone or introduction in person and choose whom to work with in the future
Thank you for reading! Have some feedback for us?
Contact the 24/7 Wall St. editorial team.