Special Report
American Cities Losing the Most Jobs

Published:
Last Updated:

Some 1.3 million people joined America’s civilian labor force over the past year. Thanks to a healthy economy, the total number of employed persons has also increased by 2.2 million, or 1.5%, over this period. Meanwhile, the nation’s unemployment rate fell from 4.9% in June 2016 to 4.4% in June 2017.
While the United States has experienced years of rapid post-recession economic growth, the recovery has eluded some parts of the country. Approximately 1 in 5 U.S. metro areas lost jobs over the past 12 months, and the number of employed persons has decreased by at least 1% in 25 of the country’s 388 metropolitan areas.
While the reasons behind each city’s job losses vary, many report job losses in one or more of three industrial sectors: mining and logging, manufacturing, and information. Multiple cities that have lost jobs in the past year previously underwent a period of rapid economic growth due to their oil and natural gas sector. In the past two years, however, the sector has struggled due to falling oil prices. Other cities – such as Binghamton, New York and Elmira, New York – have suffered from loss of manufacturing jobs.
In most metro areas on this list, an exodus of workers has resulted in a shrinking unemployment rate. While the overall number of jobs has decreased, those who are left without work choose to seek employment elsewhere, and therefore the unemployment rate actually declines.
Click here to see the cities losing the most jobs.
To determine the cities losing the most jobs, 24/7 Wall St. reviewed the change in total employment from June 2016 to June 2017 for 388 metropolitan statistical areas with data from the Bureau of Labor Statistics’ Local Area Unemployment Statistics program. Industry-specific data comes from the BLS’ Current Employment Statistics program. The 25 metropolitan areas included on the list are those in which the number of employed persons decreased by 1% or more.

25. Waterloo-Cedar Falls, IA
> Employment change: -1.0%
> No. of jobs June 2016: 85,902
> No. of jobs June 2017: 85,003
> Unemployment rate June 2017: 3.6%
[in-text-ad]

24. Binghamton, NY
> Employment change: -1.1%
> No. of jobs June 2016: 102,989
> No. of jobs June 2017: 101,890
> Unemployment rate June 2017: 5.5%

23. Goldsboro, NC
> Employment change: -1.1%
> No. of jobs June 2016: 50,457
> No. of jobs June 2017: 49,878
> Unemployment rate June 2017: 4.7%

22. San Angelo, TX
> Employment change: -1.2%
> No. of jobs June 2016: 52,670
> No. of jobs June 2017: 52,061
> Unemployment rate June 2017: 3.8%
[in-text-ad-2]

21. St. Louis, MO-IL
> Employment change: -1.2%
> No. of jobs June 2016: 1.4 million
> No. of jobs June 2017: 1.4 million
> Unemployment rate June 2017: 3.9%

20. Wichita Falls, TX
> Employment change: -1.2%
> No. of jobs June 2016: 61,305
> No. of jobs June 2017: 60,581
> Unemployment rate June 2017: 3.9%
[in-text-ad]

19. Williamsport, PA
> Employment change: -1.2%
> No. of jobs June 2016: 54,883
> No. of jobs June 2017: 54,231
> Unemployment rate June 2017: 5.6%

18. Lafayette, LA
> Employment change: -1.2%
> No. of jobs June 2016: 200,698
> No. of jobs June 2017: 198,281
> Unemployment rate June 2017: 5.7%

17. Decatur, IL
> Employment change: -1.2%
> No. of jobs June 2016: 46,955
> No. of jobs June 2017: 46,373
> Unemployment rate June 2017: 5.7%
[in-text-ad-2]

16. Beckley, WV
> Employment change: -1.3%
> No. of jobs June 2016: 42,750
> No. of jobs June 2017: 42,205
> Unemployment rate June 2017: 5.4%

15. Alexandria, LA
> Employment change: -1.3%
> No. of jobs June 2016: 61,912
> No. of jobs June 2017: 61,086
> Unemployment rate June 2017: 5.8%
[in-text-ad]

14. Sioux City, IA-NE-SD
> Employment change: -1.4%
> No. of jobs June 2016: 90,525
> No. of jobs June 2017: 89,298
> Unemployment rate June 2017: 3.2%

13. Rochester, NY
> Employment change: -1.4%
> No. of jobs June 2016: 499,241
> No. of jobs June 2017: 492,470
> Unemployment rate June 2017: 4.8%

12. Rocky Mount, NC
> Employment change: -1.4%
> No. of jobs June 2016: 62,182
> No. of jobs June 2017: 61,299
> Unemployment rate June 2017: 6.1%
[in-text-ad-2]
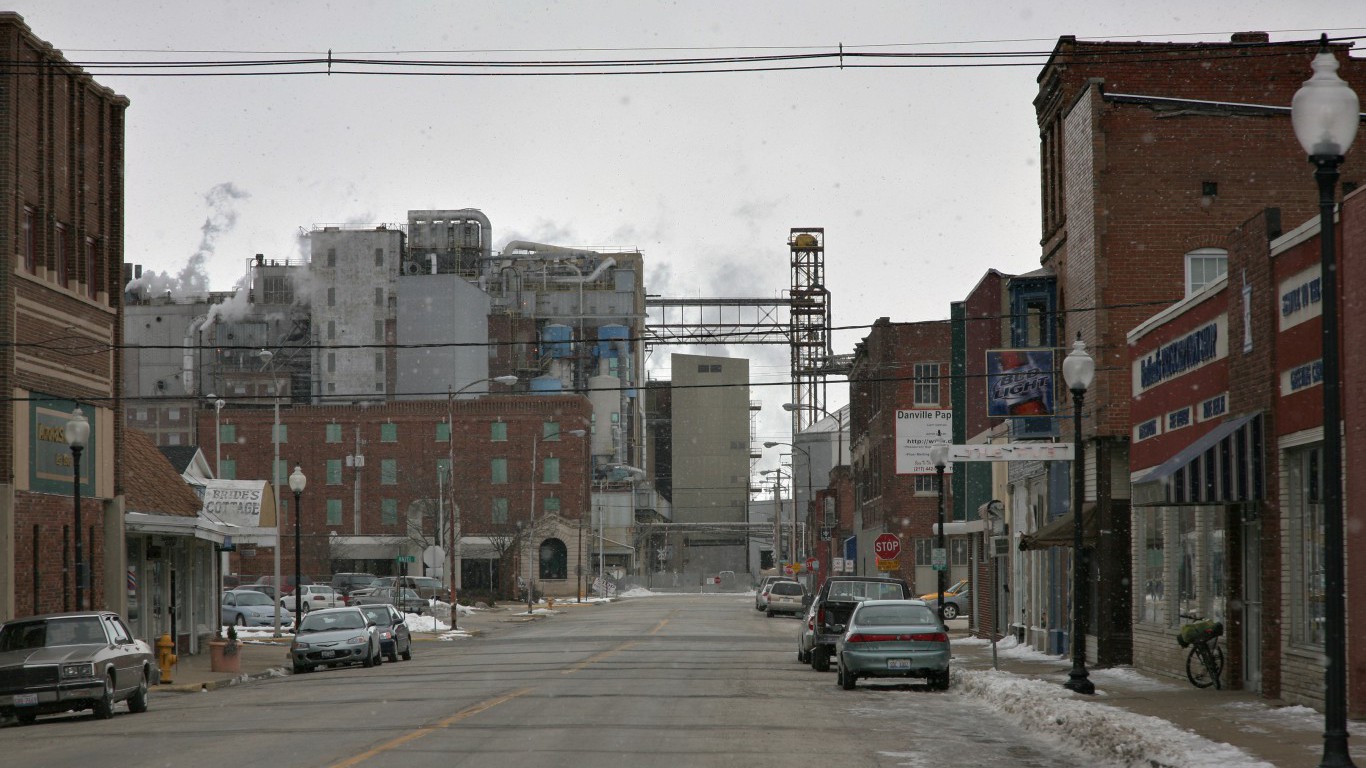
11. Danville, IL
> Employment change: -1.4%
> No. of jobs June 2016: 32,390
> No. of jobs June 2017: 31,922
> Unemployment rate June 2017: 6.7%

10. Shreveport-Bossier City, LA
> Employment change: -1.5%
> No. of jobs June 2016: 178,223
> No. of jobs June 2017: 175,606
> Unemployment rate June 2017: 5.7%
[in-text-ad]

9. Rockford, IL
> Employment change: -1.5%
> No. of jobs June 2016: 156,469
> No. of jobs June 2017: 154,119
> Unemployment rate June 2017: 6.3%

8. Jefferson City, MO
> Employment change: -1.5%
> No. of jobs June 2016: 73,754
> No. of jobs June 2017: 72,618
> Unemployment rate June 2017: 3.2%

7. St. Joseph, MO-KS
> Employment change: -2.1%
> No. of jobs June 2016: 63,468
> No. of jobs June 2017: 62,128
> Unemployment rate June 2017: 3.6%
[in-text-ad-2]

6. Elmira, NY
> Employment change: -2.2%
> No. of jobs June 2016: 34,294
> No. of jobs June 2017: 33,529
> Unemployment rate June 2017: 5.5%

5. Pocatello, ID
> Employment change: -2.3%
> No. of jobs June 2016: 41,009
> No. of jobs June 2017: 40,048
> Unemployment rate June 2017: 2.9%
[in-text-ad]
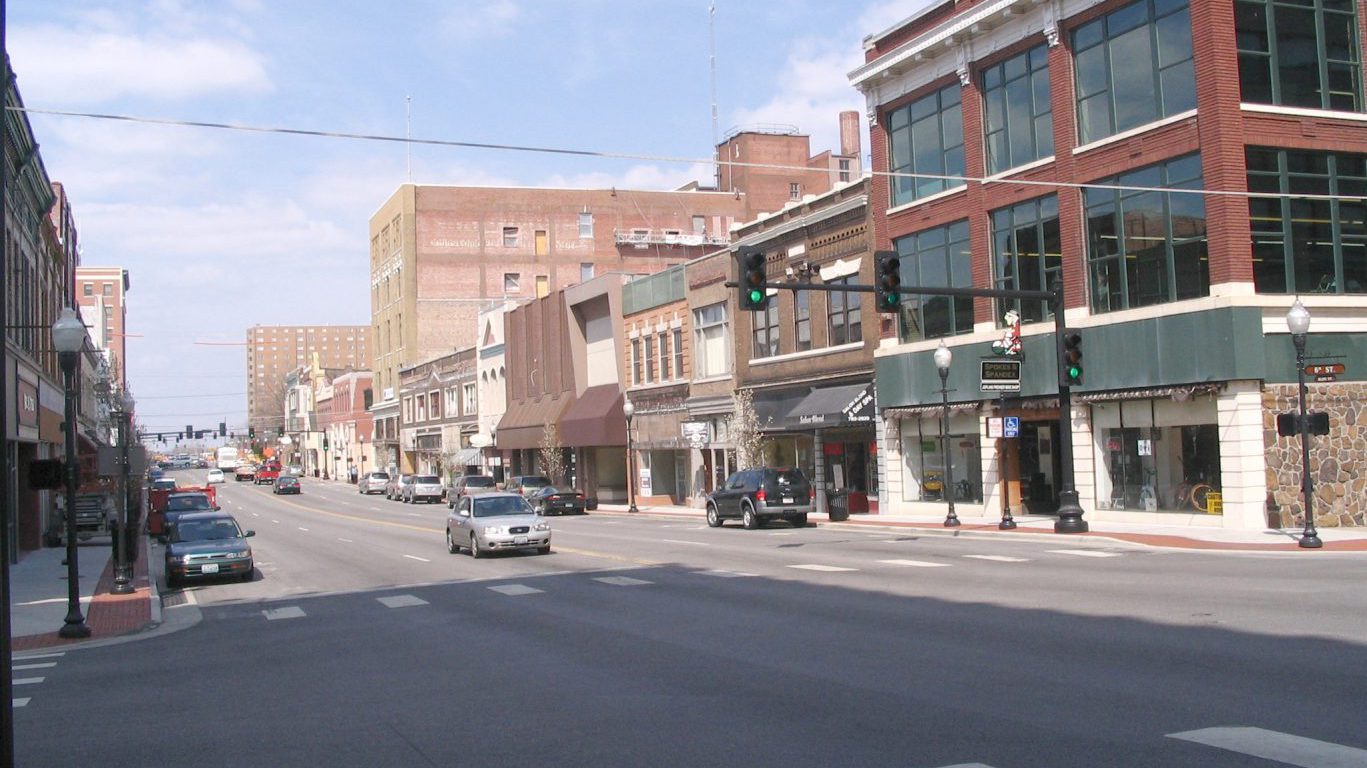
4. Joplin, MO
> Employment change: -2.7%
> No. of jobs June 2016: 83,636
> No. of jobs June 2017: 81,408

3. Casper, WY
> Employment change: -3.4%
> No. of jobs June 2016: 38,220
> No. of jobs June 2017: 36,929
> Unemployment rate June 2017: 5.2%

2. Houma-Thibodaux, LA
> Employment change: -3.5%
> No. of jobs June 2016: 86,392
> No. of jobs June 2017: 83,382
> Unemployment rate June 2017: 5.6%
[in-text-ad-2]

1. Cape Girardeau, MO-IL
> Employment change: -4.5%
> No. of jobs June 2016: 46,777
> No. of jobs June 2017: 44,678
> Unemployment rate June 2017: 4.0%
Start by taking a quick retirement quiz from SmartAsset that will match you with up to 3 financial advisors that serve your area and beyond in 5 minutes, or less.
Each advisor has been vetted by SmartAsset and is held to a fiduciary standard to act in your best interests.
Here’s how it works:
1. Answer SmartAsset advisor match quiz
2. Review your pre-screened matches at your leisure. Check out the advisors’ profiles.
3. Speak with advisors at no cost to you. Have an introductory call on the phone or introduction in person and choose whom to work with in the future
Thank you for reading! Have some feedback for us?
Contact the 24/7 Wall St. editorial team.