Special Report
America's Largest Sanctuaries

Published:
Last Updated:

In a nation divided over so many issues, the presence of so-called sanctuaries is one of the most contentious. The issue revolves around undocumented immigrants and the role that federal, county, state, and municipal governments play in it. There are an estimated 11 million undocumented immigrants in the United States.
The term sanctuary has been used to describe locations — states, cities, counties, and other jurisdictions — that limit cooperation between local law enforcement and federal agencies that enforce immigration laws. Estimates for the number of sanctuary cities and counties vary from 165 to more than 600.
24/7 Wall St. has compiled a list of the biggest counties by population that have placed some limitation on the authority of Immigration and Customs Enforcement officials to arrest and deport illegal immigrants within their borders. These places are called sanctuary cities or counties, often by the anti-immigrant politicians and activists, but sometimes by supporters. Most of these sanctuary designations are counties and the majority are located in 13 states.
Click here to see the biggest sanctuary counties in the United States
CLick here to see our detailed findings and methodology.

1. Arlington County, Virginia
> Population: 230,050
> Non-citizen, foreign-born pop.: 17,517
> Pct. population foreign-born: 7.4%
> Poverty rate: 15.4%
[in-text-ad]

2. Bucks County, Pennsylvania
> Population: 626,399
> Non-citizen, foreign-born pop.: 4,483
> Pct. population foreign-born: 4.4%
> Poverty rate: 14.6%
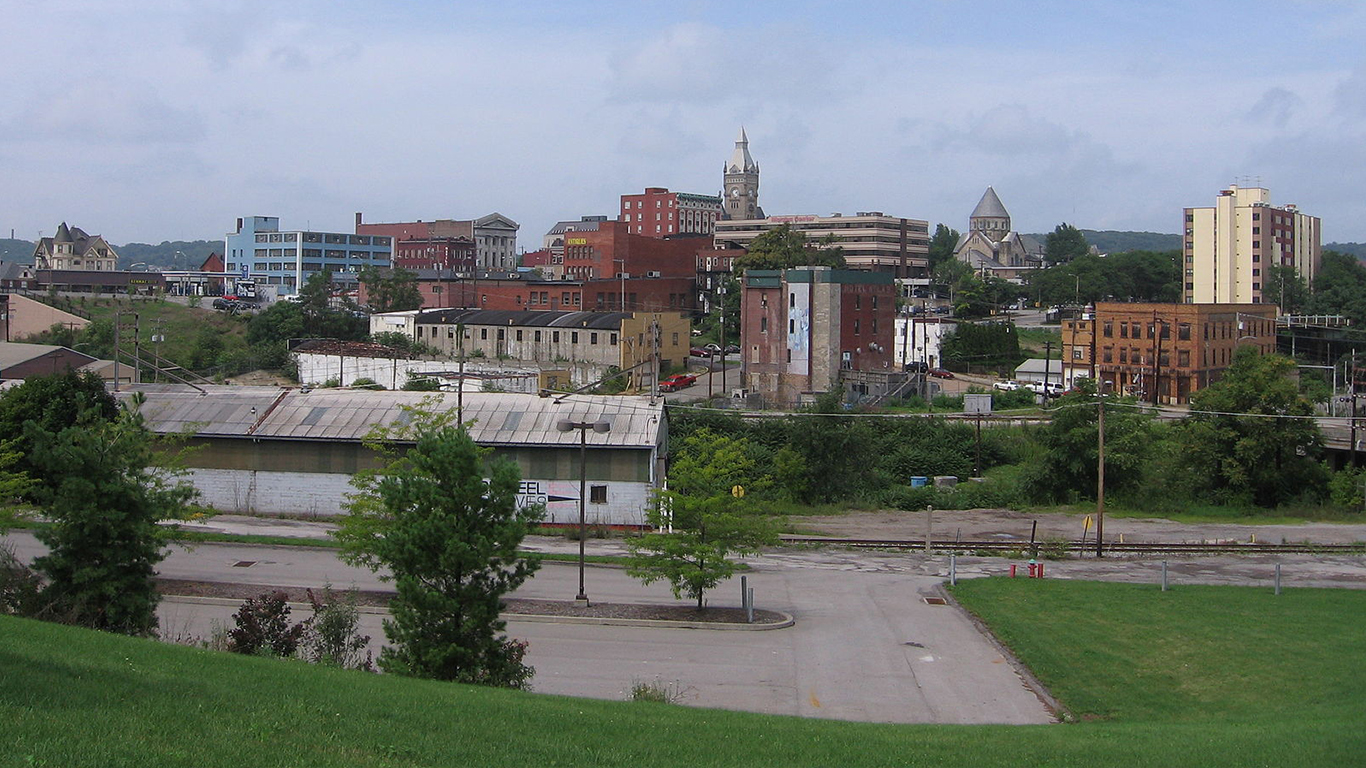
3. Butler County, Pennsylvania
> Population: 186,847
> Non-citizen, foreign-born pop.: 24,333
> Pct. population foreign-born: 8.6%
> Poverty rate: 15.1%
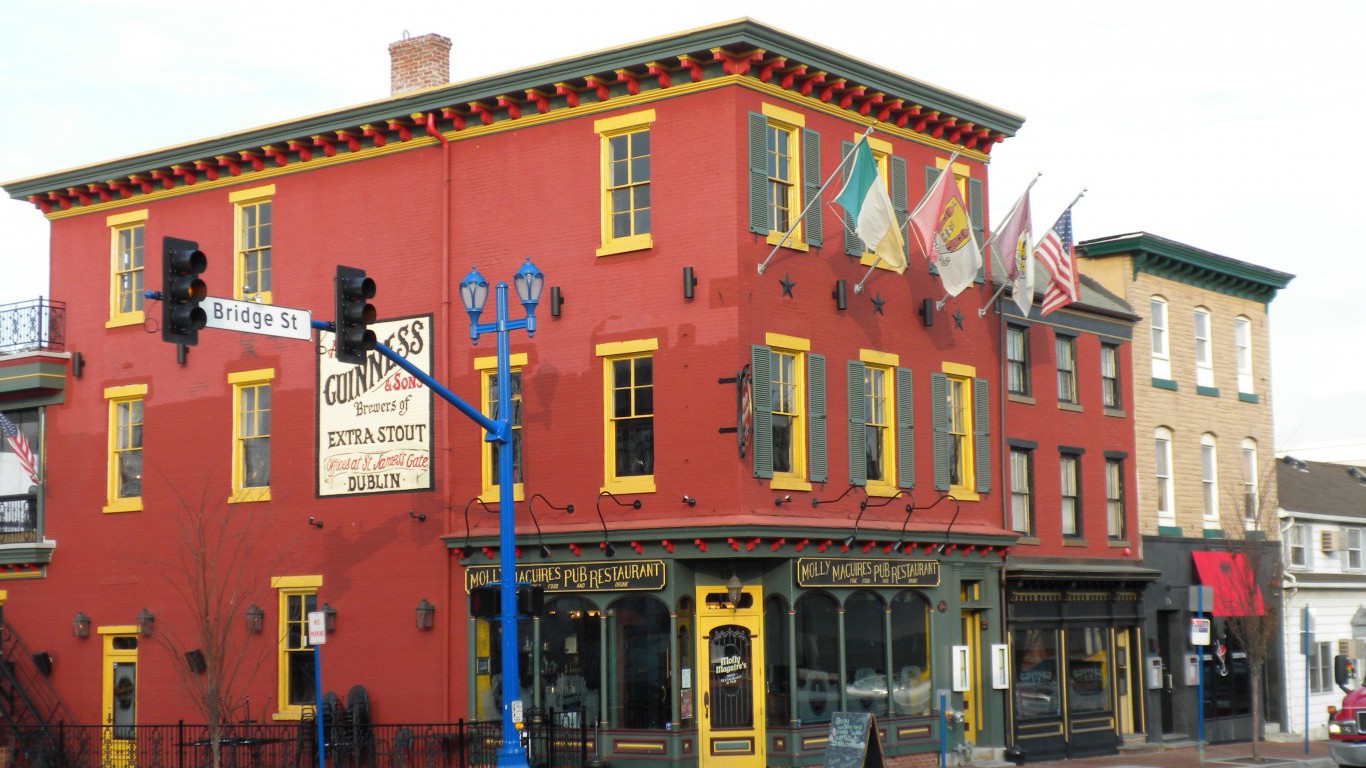
4. Chester County, Pennsylvania
> Population: 516,312
> Non-citizen, foreign-born pop.: 3,639
> Pct. population foreign-born: 6.5%
> Poverty rate: 15.9%
[in-text-ad-2]
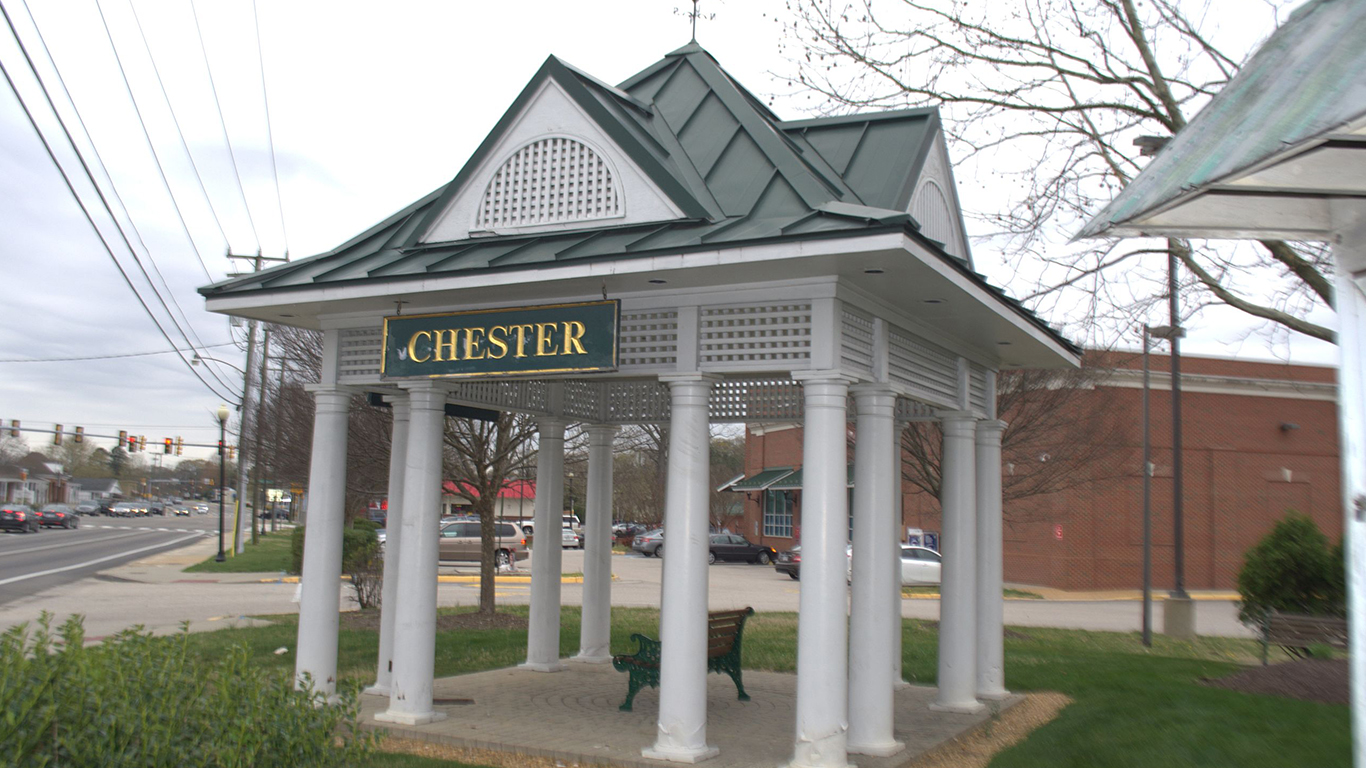
5. Chesterfield County, Virginia
> Population: 339,009
> Non-citizen, foreign-born pop.: 160,989
> Pct. population foreign-born: 32.6%
> Poverty rate: 6.7%

6. Clackamas County, Oregon
> Population: 408,062
> Non-citizen, foreign-born pop.: N/A
> Pct. population foreign-born: 1.5%
> Poverty rate: 14.5%
[in-text-ad]

7. Clark County, Washington
> Population: 467,018
> Non-citizen, foreign-born pop.: 224,207
> Pct. population foreign-born: 21.2%
> Poverty rate: 11.2%

8. Clark County, Nevada
> Population: 2,155,664
> Non-citizen, foreign-born pop.: 18,425
> Pct. population foreign-born: 8.3%
> Poverty rate: 6.0%

9. Clayton County, Georgia
> Population: 279,462
> Non-citizen, foreign-born pop.: 61,277
> Pct. population foreign-born: 14.2%
> Poverty rate: 18.1%
[in-text-ad-2]

10. Cook County, Illinois
> Population: 5,203,499
> Non-citizen, foreign-born pop.: 29,180
> Pct. population foreign-born: 23.0%
> Poverty rate: 9.0%

11. Cowlitz County, Washington
> Population: 105,160
> Non-citizen, foreign-born pop.: 11,107
> Pct. population foreign-born: 11.0%
> Poverty rate: 16.0%
[in-text-ad]

12. DeKalb County, Georgia
> Population: 740,321
> Non-citizen, foreign-born pop.: 72,588
> Pct. population foreign-born: 16.4%
> Poverty rate: 19.3%

13. Deschutes County, Oregon
> Population: 181,307
> Non-citizen, foreign-born pop.: 7,827
> Pct. population foreign-born: 9.9%
> Poverty rate: 16.0%

14. Douglas County, Oregon
> Population: 108,457
> Non-citizen, foreign-born pop.: N/A
> Pct. population foreign-born: 1.5%
> Poverty rate: 10.4%
[in-text-ad-2]
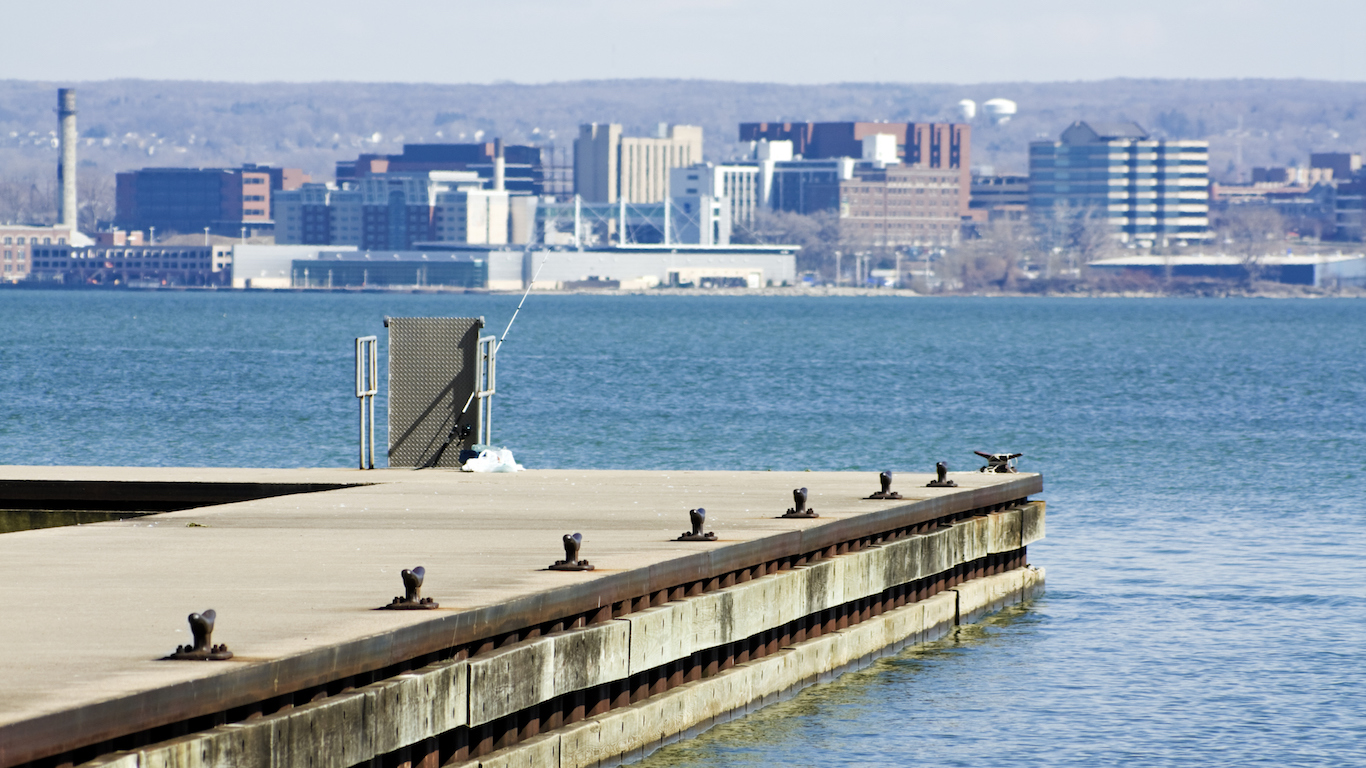
15. Erie County, Pennsylvania
> Population: 276,207
> Non-citizen, foreign-born pop.: 112,765
> Pct. population foreign-born: 21.7%
> Poverty rate: 6.2%

16. Franklin County, Pennsylvania
> Population: 153,851
> Non-citizen, foreign-born pop.: 9,295
> Pct. population foreign-born: 7.9%
> Poverty rate: 12.4%
[in-text-ad]
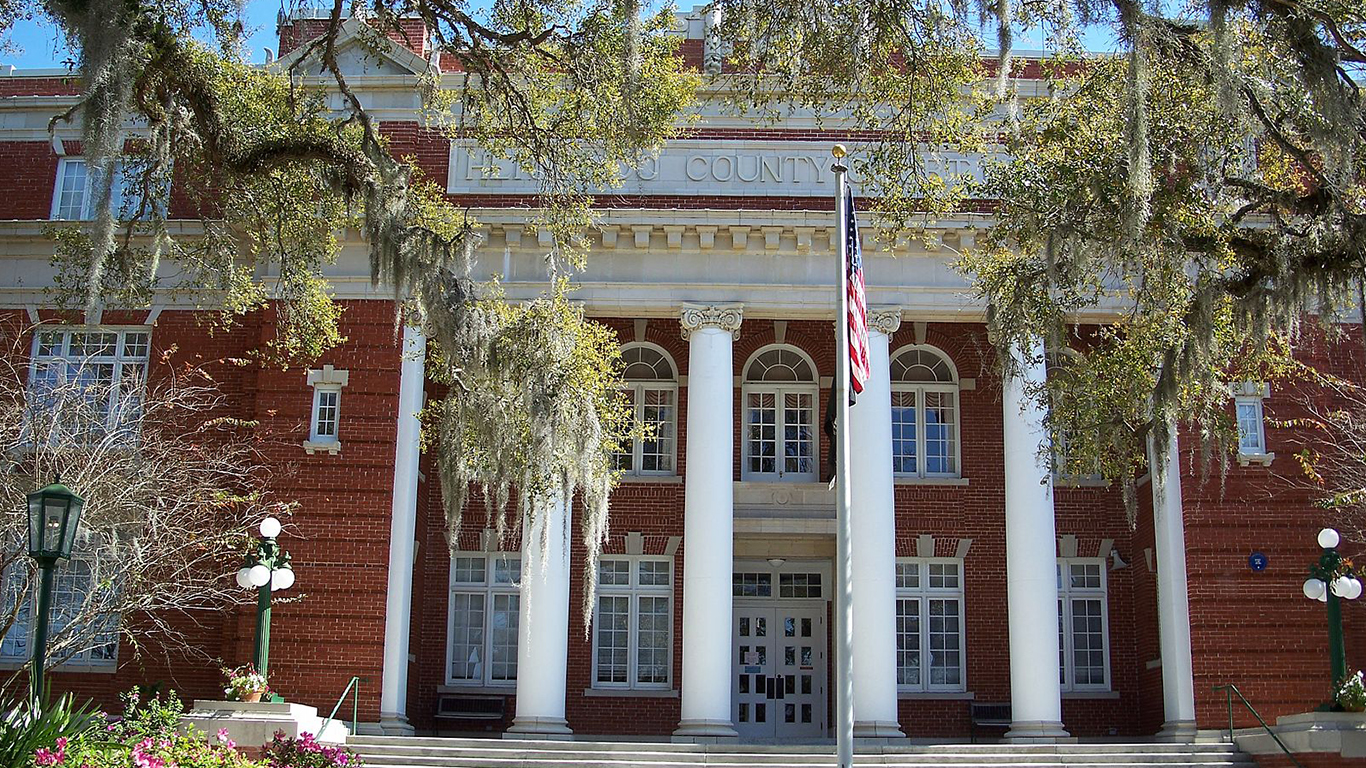
17. Hernando County, Florida
> Population: 182,835
> Non-citizen, foreign-born pop.: 5,225
> Pct. population foreign-born: 4.5%
> Poverty rate: 15.2%

18. Jackson County, Oregon
> Population: 216,527
> Non-citizen, foreign-born pop.: 4,795
> Pct. population foreign-born: 5.3%
> Poverty rate: 6.4%

19. King County, Washington
> Population: 2,149,970
> Non-citizen, foreign-born pop.: N/A
> Pct. population foreign-born: 2.0%
> Poverty rate: 9.1%
[in-text-ad-2]

20. Lebanon County, Pennsylvania
> Population: 138,863
> Non-citizen, foreign-born pop.: 139,352
> Pct. population foreign-born: 17.8%
> Poverty rate: 16.4%

21. Lehigh County, Pennsylvania
> Population: 363,147
> Non-citizen, foreign-born pop.: 30,260
> Pct. population foreign-born: 13.2%
> Poverty rate: 18.4%
[in-text-ad]

22. Lycoming County, Pennsylvania
> Population: 115,248
> Non-citizen, foreign-born pop.: 54,455
> Pct. population foreign-born: 16.9%
> Poverty rate: 11.8%

23. Marion County, Oregon
> Population: 336,316
> Non-citizen, foreign-born pop.: 36,963
> Pct. population foreign-born: 10.2%
> Poverty rate: 6.6%
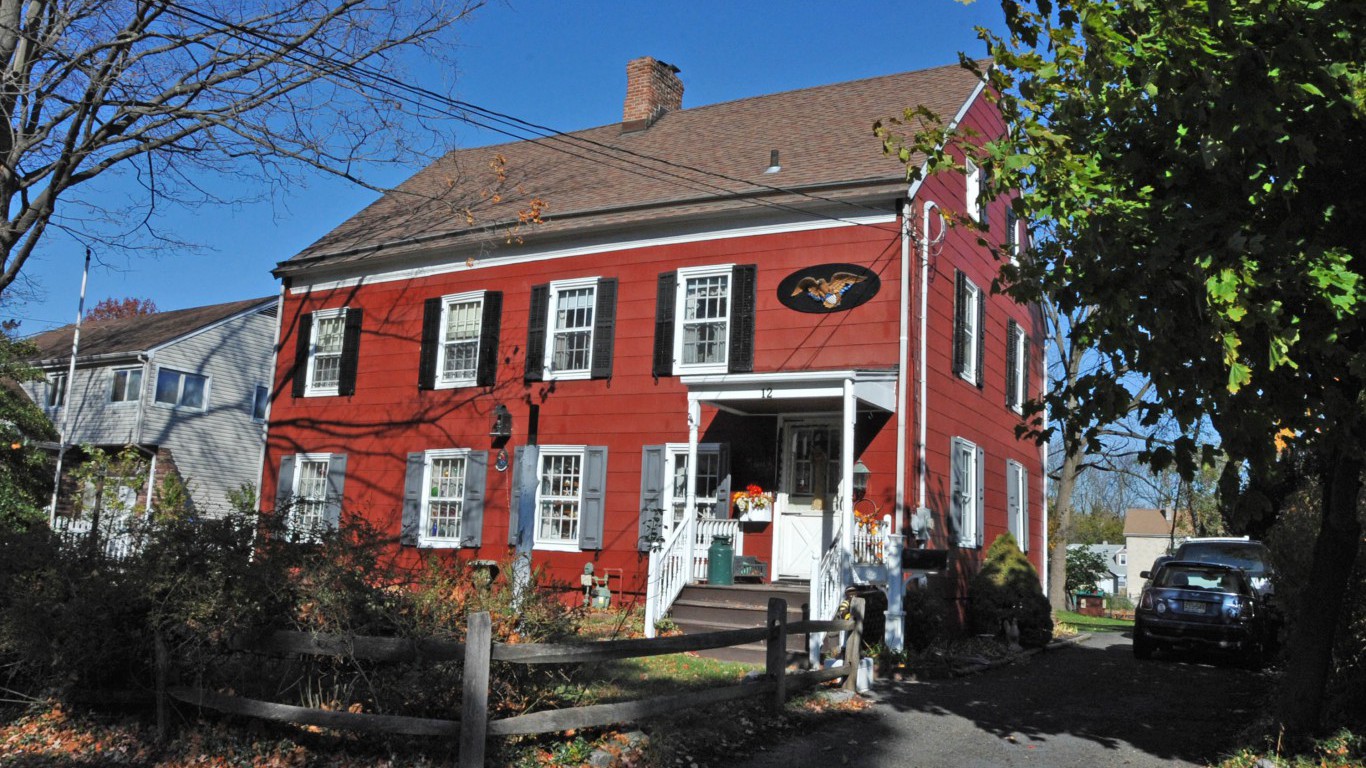
24. Middlesex County, New Jersey
> Population: 837,073
> Non-citizen, foreign-born pop.: 241,572
> Pct. population foreign-born: 21.9%
> Poverty rate: 15.7%
[in-text-ad-2]

25. Montgomery County, Maryland
> Population: 1,043,863
> Non-citizen, foreign-born pop.: 14,960
> Pct. population foreign-born: 8.2%
> Poverty rate: 9.5%
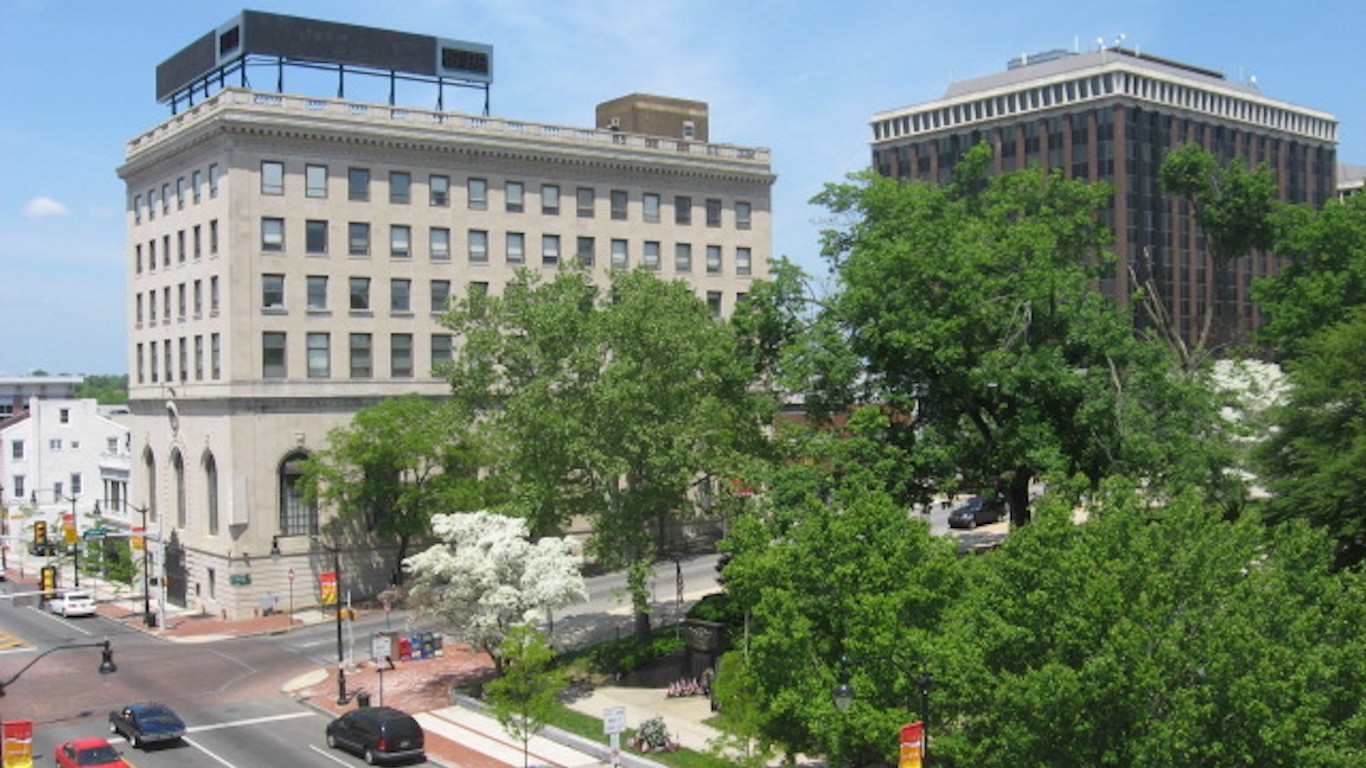
26. Montgomery County, Pennsylvania
> Population: 821,725
> Non-citizen, foreign-born pop.: 24,051
> Pct. population foreign-born: 14.9%
> Poverty rate: 25.1%
[in-text-ad]

27. Multnomah County, Oregon
> Population: 799,766
> Non-citizen, foreign-born pop.: 578,527
> Pct. population foreign-born: 21.2%
> Poverty rate: 17.1%

28. Nassau County, New York
> Population: 1,361,500
> Non-citizen, foreign-born pop.: 26,092
> Pct. population foreign-born: 9.1%
> Poverty rate: 7.1%
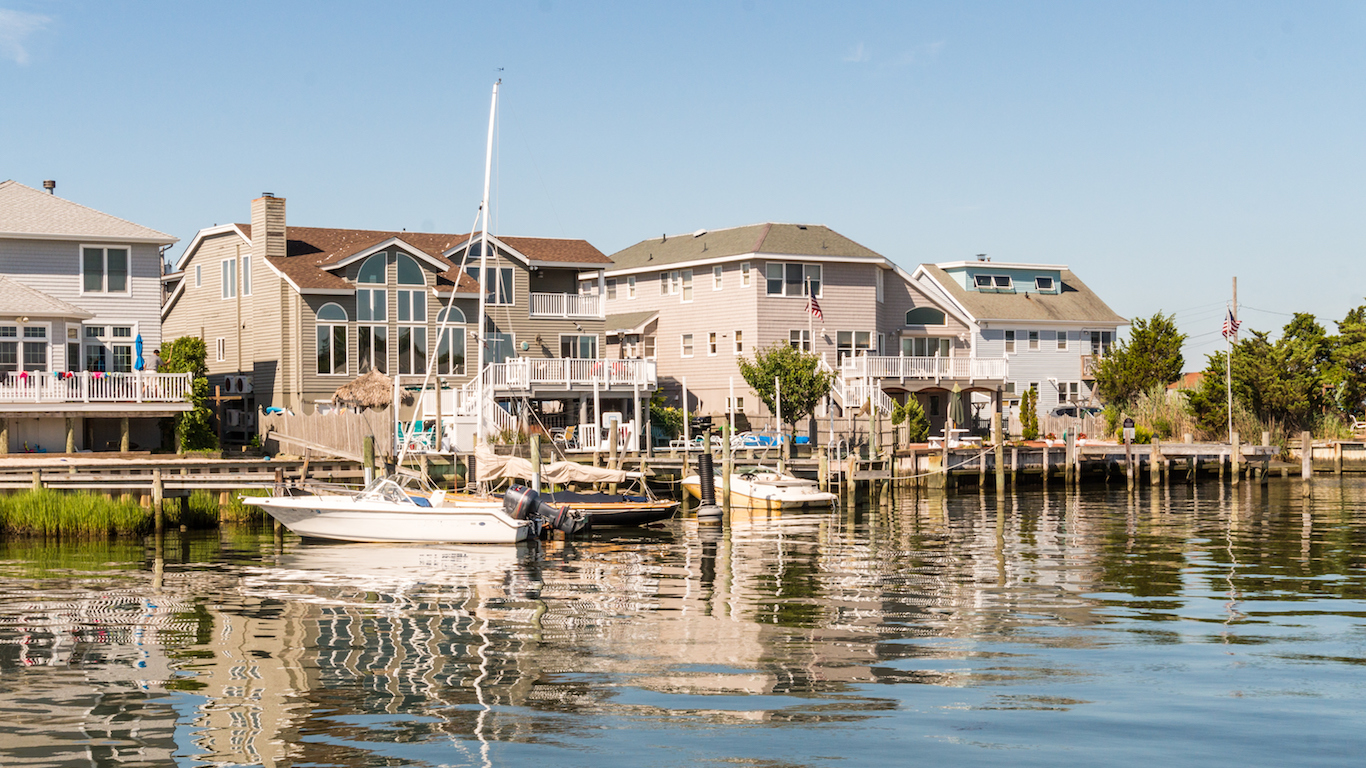
29. Ocean County, New Jersey
> Population: 592,497
> Non-citizen, foreign-born pop.: N/A
> Pct. population foreign-born: 2.7%
> Poverty rate: 19.3%
[in-text-ad-2]
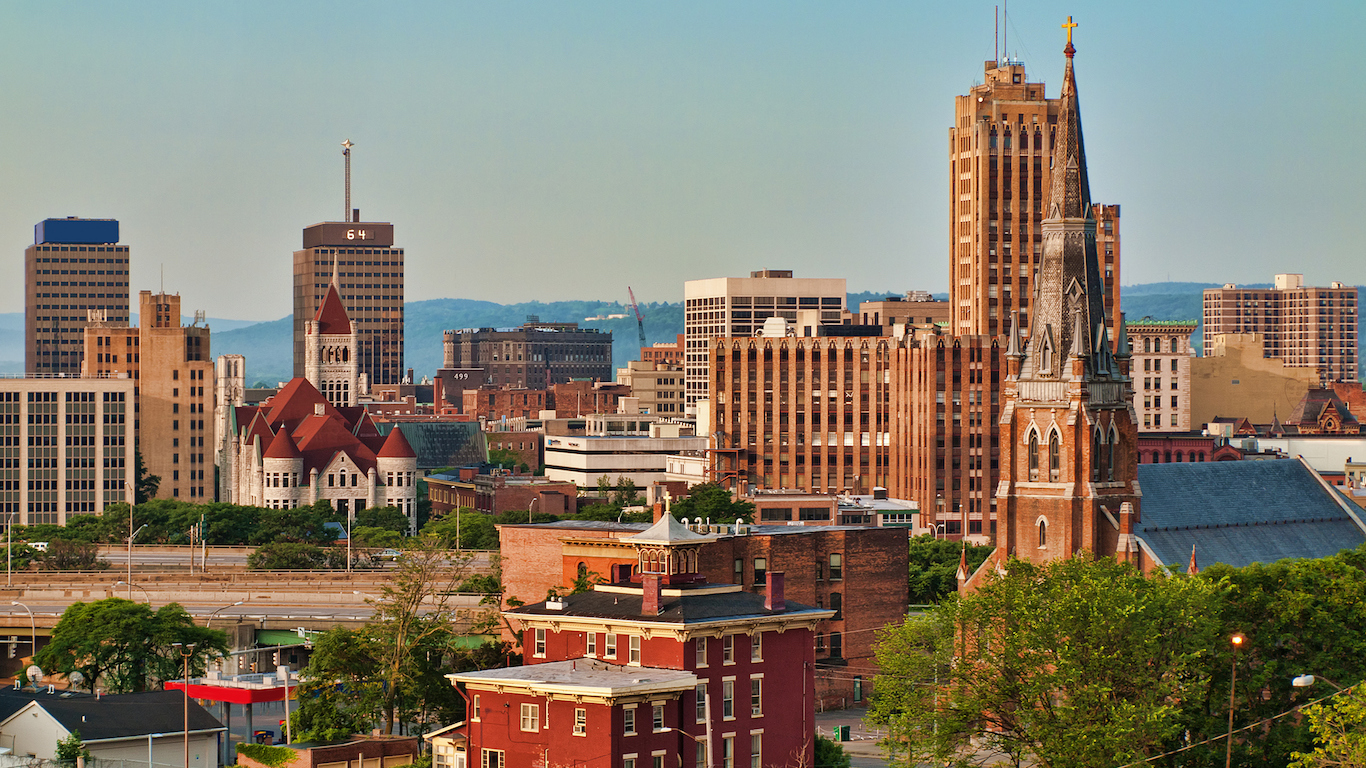
30. Onondaga County, New York
> Population: 466,194
> Non-citizen, foreign-born pop.: N/A
> Pct. population foreign-born: 3.9%
> Poverty rate: 11.3%
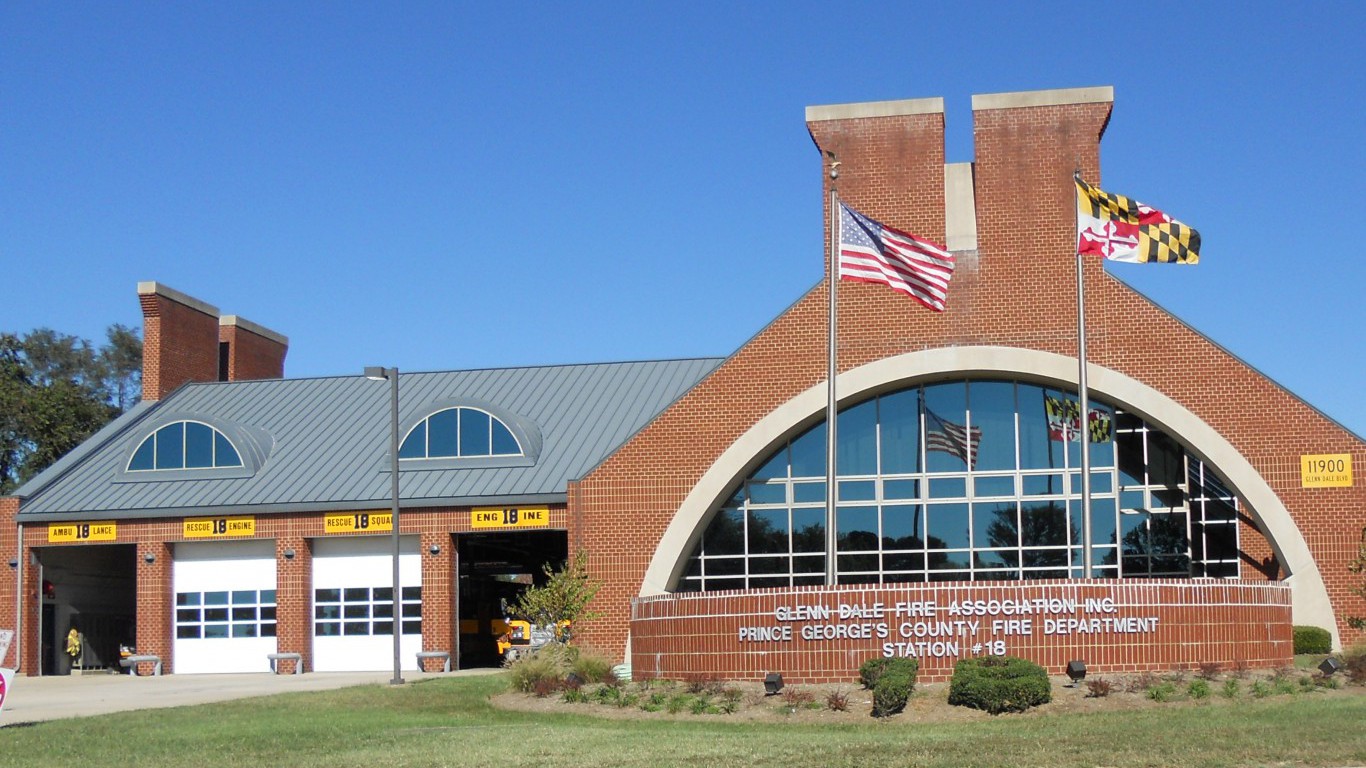
31. Prince George’s County, Maryland
> Population: 908,049
> Non-citizen, foreign-born pop.: 21,735
> Pct. population foreign-born: 10.1%
> Poverty rate: 11.2%
[in-text-ad]
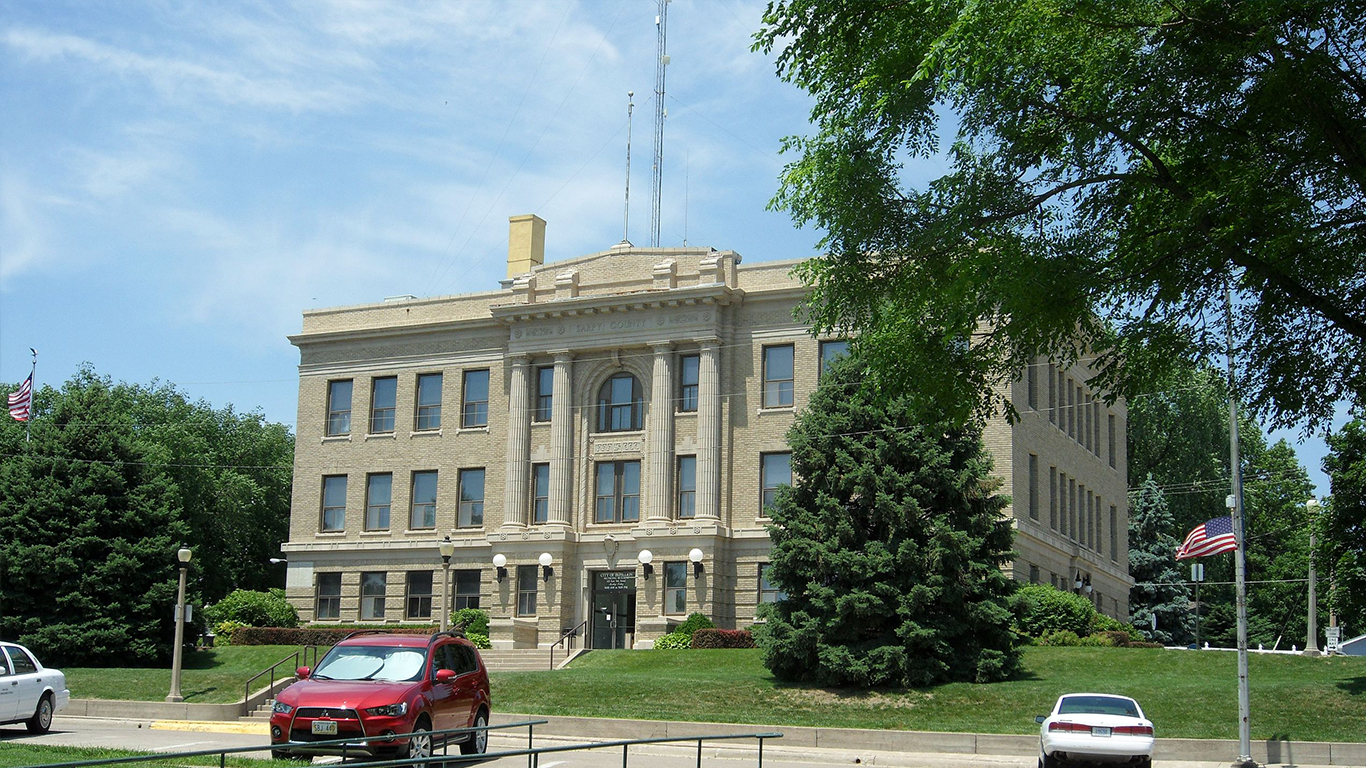
32. Sarpy County, Nebraska
> Population: 179,023
> Non-citizen, foreign-born pop.: 53,068
> Pct. population foreign-born: 14.8%
> Poverty rate: 10.2%

33. Sedgwick County, Kansas
> Population: 511,995
> Non-citizen, foreign-born pop.: 7,560
> Pct. population foreign-born: 5.7%
> Poverty rate: 19.0%

34. Shawnee County, Kansas
> Population: 178,146
> Non-citizen, foreign-born pop.: N/A
> Pct. population foreign-born: 4.4%
> Poverty rate: 19.4%
[in-text-ad-2]

35. Skagit County, Washington
> Population: 123,681
> Non-citizen, foreign-born pop.: 81,745
> Pct. population foreign-born: 29.5%
> Poverty rate: 10.9%

36. Snohomish County, Washington
> Population: 787,620
> Non-citizen, foreign-born pop.: N/A
> Pct. population foreign-born: 4.2%
> Poverty rate: 17.5%
[in-text-ad]
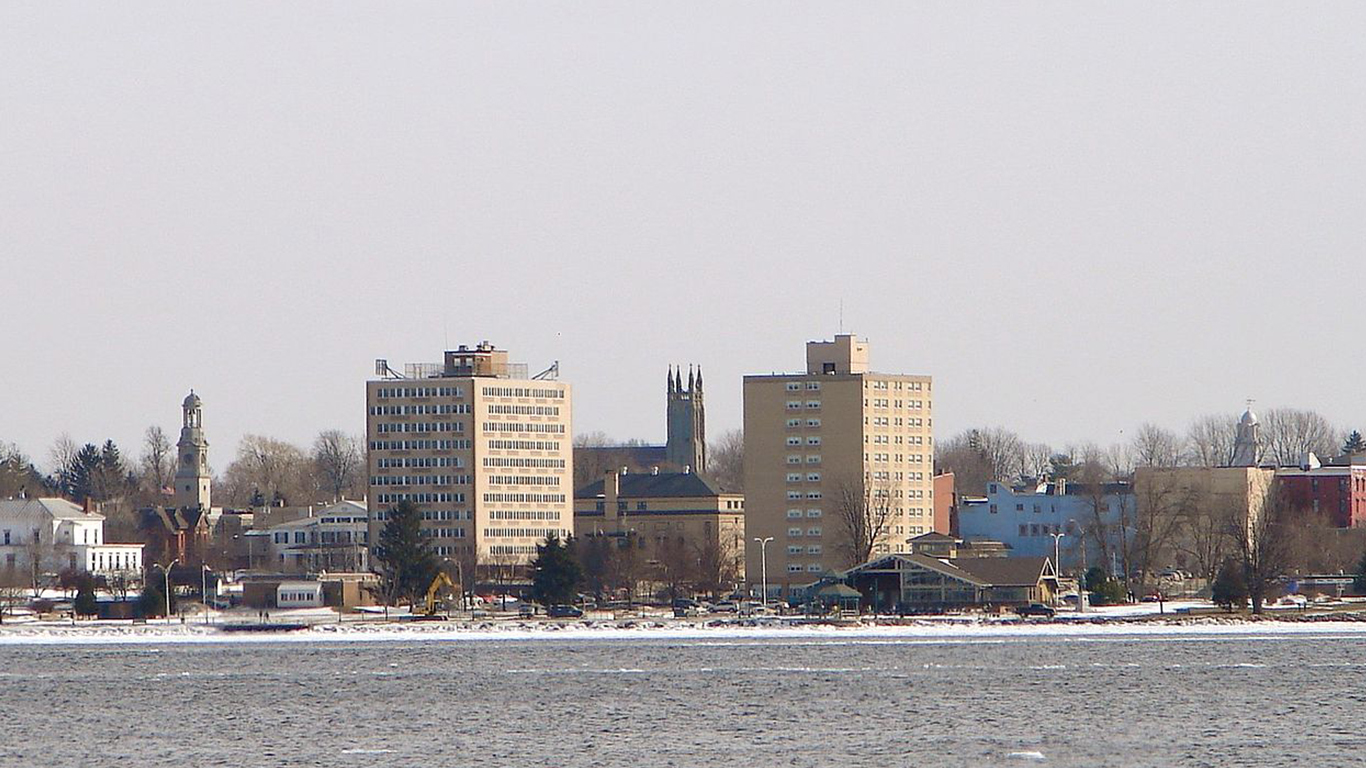
37. St. Lawrence County, New York
> Population: 110,038
> Non-citizen, foreign-born pop.: 35,813
> Pct. population foreign-born: 14.8%
> Poverty rate: 15.2%

38. Thurston County, Washington
> Population: 275,222
> Non-citizen, foreign-born pop.: 21,202
> Pct. population foreign-born: 7.9%
> Poverty rate: 11.3%

39. Travis County, Texas
> Population: 1,199,323
> Non-citizen, foreign-born pop.: 13,609
> Pct. population foreign-born: 8.1%
> Poverty rate: 7.4%
[in-text-ad-2]

40. Union County, New Jersey
> Population: 555,630
> Non-citizen, foreign-born pop.: N/A
> Pct. population foreign-born: 3.3%
> Poverty rate: 11.7%

41. Washington County, Oregon
> Population: 582,779
> Non-citizen, foreign-born pop.: 6,608
> Pct. population foreign-born: 4.3%
> Poverty rate: 16.7%
[in-text-ad]

42. Washoe County, Nevada
> Population: 453,616
> Non-citizen, foreign-born pop.: 16,569
> Pct. population foreign-born: 10.5%
> Poverty rate: 13.1%

43. Westmoreland County, Pennsylvania
> Population: 355,458
> Non-citizen, foreign-born pop.: 126,725
> Pct. population foreign-born: 31.9%
> Poverty rate: 8.8%

44. Whatcom County, Washington
> Population: 216,800
> Non-citizen, foreign-born pop.: 113,620
> Pct. population foreign-born: 21.2%
> Poverty rate: 9.6%
[in-text-ad-2]

45. Yamhill County, Oregon
> Population: 105,035
> Non-citizen, foreign-born pop.: 5,947
> Pct. population foreign-born: 8.7%
> Poverty rate: 16.6%
Trying to determine the number of sanctuary cities is tricky, a problem the Department of Homeland Security faced earlier this year. The federal agency tried to create a list of sanctuary cities in an effort to target those municipalities it believed were not cooperating with federal authorities to deport undocumented immigrants. The DHS suspended its sanctuary city report in April after some jurisdictions objected when they were included on the list.
Sanctuary city opponents claim these jurisdictions allow criminals among undocumented immigrants to go free, leading to crimes that could have been prevented if the undocumented immigrants had been deported. Opponents also say undocumented immigrants put financial burdens on towns and drive down wages.
Those who support sanctuary communities say they protect families from being broken up by deportations of undocumented immigrants. Supporters also maintain that deporting undocumented immigrants alienates legal immigrant communities.
The undocumented population includes those who entered the country legally but overstayed the terms of their temporary visit. Being illegally present in the United States has always been a civil, not criminal, violation of the Immigration and Nationality Act. However, someone who enters the country illegally and re-enters after being removed or falsifies documents to enter the country are all punishable crimes.
Even though immigration was one of President Donald Trump major issues when he ran for president, undocumented immigrants and sanctuary cities were already hot-button topics. Deportation policies that begun under the President Barack Obama’s administration were supposed to target hardened criminals but led mostly to the expulsion of those who committed minor infractions such as traffic violations. Deportation was a controversial issue also during the Obama administration.
The issue moved to the forefront of the national debate five days after Trump was sworn in as president when he signed an executive order to block federal funding to sanctuary cities. In late June, the House of Representatives passed a bill that would deny federal grants to sanctuary cities. Some sanctuary communities are fighting back. On Aug. 7, Chicago sued the federal government over what it claims are illegal attempts to withhold public safety grants from sanctuary cities.
Methodology:
24/7 Wall St. has compiled a list of the biggest U.S. cities or districts called sanctuary cities. There is no agreed upon definition for a sanctuary city and it is not a legal term. Also, the number of communities called sanctuary cities varies. Some jurisdictions have outlined specific policies related to their status as a sanctuary locale, while others merely call themselves a sanctuary city or county without providing detailed criteria. The term has been used to describe those places — cities, counties, and jurisdictions such as jails — that limit how local law enforcement can work with federal agents in enforcing immigration laws. Because the jails where undocumented immigrants are held before they are deported are typically run by counties rather than cities, county policies can matter more regarding the issue, and that is why counties dominate the list.
The thought of burdening your family with a financial disaster is most Americans’ nightmare. However, recent studies show that over 100 million Americans still don’t have proper life insurance in the event they pass away.
Life insurance can bring peace of mind – ensuring your loved ones are safeguarded against unforeseen expenses and debts. With premiums often lower than expected and a variety of plans tailored to different life stages and health conditions, securing a policy is more accessible than ever.
A quick, no-obligation quote can provide valuable insight into what’s available and what might best suit your family’s needs. Life insurance is a simple step you can take today to help secure peace of mind for your loved ones tomorrow.
Click here to learn how to get a quote in just a few minutes.
Thank you for reading! Have some feedback for us?
Contact the 24/7 Wall St. editorial team.