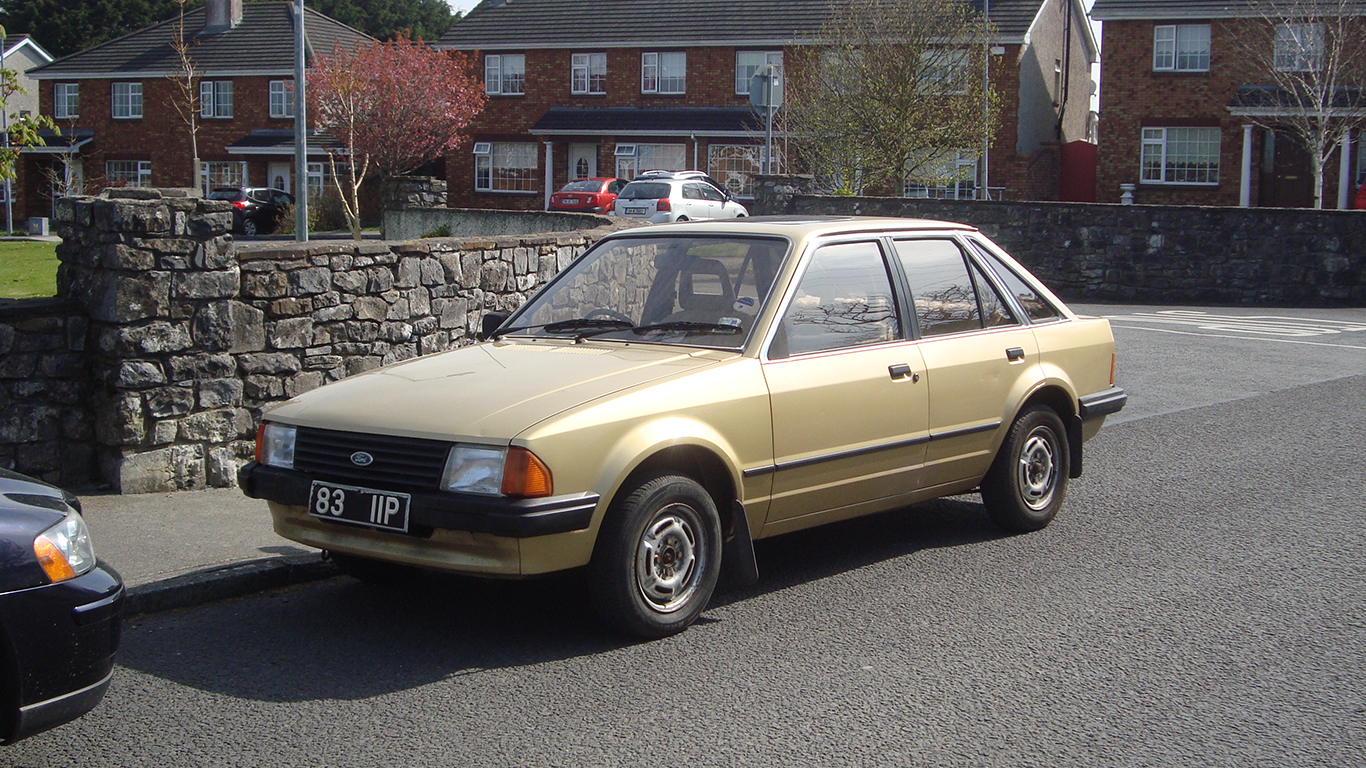
There were an estimated 218 million motorists in the United States in 2015, accounting for a combined 3.1 trillion vehicle miles traveled the same year — more than in any year prior. Because of our dependence on personal vehicles, the price of gasoline can have a considerable impact on Americans’ budgets and can also have much broader economic implications.
The price at the pump across the country is subject to global forces of supply and demand of crude oil. Shortages and relatively high demand will cause prices to spike, while a glut in supply tends to keep gas prices low.
In recent years, American motorists have caught a break at the pump, following a roughly 50% drop in the price of a barrel of crude oil from 2014 to 2015. Nationwide, a gallon of gas cost an average of $2.45 in 2015 — down from an all-time non-inflation adjusted high of $3.64 per gallon on average nationwide in 2012.
Despite the fall in crude oil prices, for much of the last several decades, gas has been even less expensive than it currently is. 24/7 Wall St. reviewed data from the U.S. Energy Information Administration to identify the average cost of a gallon of gas every year since 1945.
Click here to see how much a gallon of gas cost the year you were born.
Click here to see our detailed findings and methodology.

1945
> Price per gallon (inflation adj.): $0.21 ($2.19)
> Price per barrel (inflation adj.): $1.22 ($16.00)
> U.S. gas consumption: 579.3 million barrels
> Per capita consumption: 173.9 gallons
[in-text-ad]

1946
> Price per gallon (inflation adj.): $0.21 ($1.96)
> Price per barrel (inflation adj.): $1.41 ($15.65)
> U.S. gas consumption: 722.5 million barrels
> Per capita consumption: 214.6 gallons

1947
> Price per gallon (inflation adj.): $0.23 ($1.97)
> Price per barrel (inflation adj.): $1.93 ($19.68)
> U.S. gas consumption: 773.4 million barrels
> Per capita consumption: 225.4 gallons

1948
> Price per gallon (inflation adj.): $0.26 ($2.09)
> Price per barrel (inflation adj.): $2.60 ($25.75)
> U.S. gas consumption: 834.6 million barrels
> Per capita consumption: 239.0 gallons
 24/7 Wall St.
1949
> Price per gallon (inflation adj.): $0.27 ($2.17)
> Price per barrel (inflation adj.): $2.54 ($25.69)
> U.S. gas consumption: 879.7 million barrels
> Per capita consumption: 247.7 gallons
1950
> Price per gallon (inflation adj.): $0.27 ($2.14)
> Price per barrel (inflation adj.): $2.51 ($23.96)
> U.S. gas consumption: 954.8 million barrels
> Per capita consumption: 263.3 gallons

1951
> Price per gallon (inflation adj.): $0.27 ($2.03)
> Price per barrel (inflation adj.): $2.53 ($22.78)
> U.S. gas consumption: 1.1 billion barrels
> Per capita consumption: 295.5 gallons
[in-text-ad-2]
1952
> Price per gallon (inflation adj.): $0.27 ($2.01)
> Price per barrel (inflation adj.): $2.53 ($22.61)
> U.S. gas consumption: 1.1 billion barrels
> Per capita consumption: 288.2 gallons
1953
> Price per gallon (inflation adj.): $0.29 ($2.08)
> Price per barrel (inflation adj.): $2.68 ($23.78)
> U.S. gas consumption: 1.1 billion barrels
> Per capita consumption: 297.6 gallons

1954
> Price per gallon (inflation adj.): $0.29 ($2.08)
> Price per barrel (inflation adj.): $2.78 ($24.85)
> U.S. gas consumption: 1.2 billion barrels
> Per capita consumption: 300.3 gallons

1955
> Price per gallon (inflation adj.): $0.29 ($2.05)
> Price per barrel (inflation adj.): $2.77 ($24.67)
> U.S. gas consumption: 1.3 billion barrels
> Per capita consumption: 320.0 gallons
[in-text-ad]

1956
> Price per gallon (inflation adj.): $0.30 ($2.04)
> Price per barrel (inflation adj.): $2.79 ($24.12)
> U.S. gas consumption: 1.3 billion barrels
> Per capita consumption: 322.9 gallons

1957
> Price per gallon (inflation adj.): $0.31 ($2.05)
> Price per barrel (inflation adj.): $3.09 ($25.97)
> U.S. gas consumption: 1.3 billion barrels
> Per capita consumption: 322.2 gallons
1958
> Price per gallon (inflation adj.): $0.30 ($1.96)
> Price per barrel (inflation adj.): $3.01 ($24.86)
> U.S. gas consumption: 1.4 billion barrels
> Per capita consumption: 325.3 gallons
 24/7 Wall St.
1959
> Price per gallon (inflation adj.): $0.31 ($1.94)
> Price per barrel (inflation adj.): $2.90 ($23.54)
> U.S. gas consumption: 1.4 billion barrels
> Per capita consumption: 332.7 gallons

1960
> Price per gallon (inflation adj.): $0.31 ($1.95)
> Price per barrel (inflation adj.): $2.88 ($23.06)
> U.S. gas consumption: 1.5 billion barrels
> Per capita consumption: 337.7 gallons

1961
> Price per gallon (inflation adj.): $0.31 ($1.91)
> Price per barrel (inflation adj.): $2.89 ($22.99)
> U.S. gas consumption: 1.5 billion barrels
> Per capita consumption: 337.4 gallons
[in-text-ad-2]

1962
> Price per gallon (inflation adj.): $0.31 ($1.88)
> Price per barrel (inflation adj.): $2.90 ($22.77)
> U.S. gas consumption: 1.5 billion barrels
> Per capita consumption: 345.1 gallons

1963
> Price per gallon (inflation adj.): $0.30 ($1.84)
> Price per barrel (inflation adj.): $2.89 ($22.40)
> U.S. gas consumption: 1.6 billion barrels
> Per capita consumption: 351.1 gallons

1964
> Price per gallon (inflation adj.): $0.30 ($1.82)
> Price per barrel (inflation adj.): $2.88 ($22.03)
> U.S. gas consumption: 1.6 billion barrels
> Per capita consumption: 352.7 gallons
1965
> Price per gallon (inflation adj.): $0.31 ($1.83)
> Price per barrel (inflation adj.): $2.86 ($21.46)
> U.S. gas consumption: 1.7 billion barrels
> Per capita consumption: 362.3 gallons
[in-text-ad]
1966
> Price per gallon (inflation adj.): $0.32 ($1.83)
> Price per barrel (inflation adj.): $2.88 ($20.89)
> U.S. gas consumption: 1.8 billion barrels
> Per capita consumption: 375.0 gallons
1967
> Price per gallon (inflation adj.): $0.33 ($1.84)
> Price per barrel (inflation adj.): $2.92 ($20.56)
> U.S. gas consumption: 1.8 billion barrels
> Per capita consumption: 382.5 gallons

1968
> Price per gallon (inflation adj.): $0.34 ($1.79)
> Price per barrel (inflation adj.): $2.94 ($19.76)
> U.S. gas consumption: 1.9 billion barrels
> Per capita consumption: 402.9 gallons
 24/7 Wall St.
1969
> Price per gallon (inflation adj.): $0.35 ($1.77)
> Price per barrel (inflation adj.): $3.09 ($19.56)
> U.S. gas consumption: 2.0 billion barrels
> Per capita consumption: 418.0 gallons
1970
> Price per gallon (inflation adj.): $0.36 ($1.72)
> Price per barrel (inflation adj.): $3.18 ($19.07)
> U.S. gas consumption: 2.1 billion barrels
> Per capita consumption: 432.5 gallons

1971
> Price per gallon (inflation adj.): $0.36 ($1.67)
> Price per barrel (inflation adj.): $3.39 ($19.68)
> U.S. gas consumption: 2.2 billion barrels
> Per capita consumption: 444.0 gallons
[in-text-ad-2]
1972
> Price per gallon (inflation adj.): $0.36 ($1.59)
> Price per barrel (inflation adj.): $3.39 ($19.04)
> U.S. gas consumption: 2.3 billion barrels
> Per capita consumption: 467.0 gallons
1973
> Price per gallon (inflation adj.): $0.39 ($1.62)
> Price per barrel (inflation adj.): $3.89 ($20.09)
> U.S. gas consumption: 2.4 billion barrels
> Per capita consumption: 482.8 gallons
1974
> Price per gallon (inflation adj.): $0.53 ($2.03)
> Price per barrel (inflation adj.): $6.87 ($31.59)
> U.S. gas consumption: 2.4 billion barrels
> Per capita consumption: 468.6 gallons
1975
> Price per gallon (inflation adj.): $0.57 ($1.98)
> Price per barrel (inflation adj.): $7.67 ($32.98)
> U.S. gas consumption: 2.4 billion barrels
> Per capita consumption: 473.8 gallons
[in-text-ad]
1976
> Price per gallon (inflation adj.): $0.59 ($1.96)
> Price per barrel (inflation adj.): $8.19 ($33.58)
> U.S. gas consumption: 2.6 billion barrels
> Per capita consumption: 491.9 gallons

1977
> Price per gallon (inflation adj.): $0.62 ($1.94)
> Price per barrel (inflation adj.): $8.57 ($32.94)
> U.S. gas consumption: 2.6 billion barrels
> Per capita consumption: 499.6 gallons
1978
> Price per gallon (inflation adj.): $0.63 ($1.83)
> Price per barrel (inflation adj.): $9.00 ($31.73)
> U.S. gas consumption: 2.7 billion barrels
> Per capita consumption: 510.5 gallons
 24/7 Wall St.
1979
> Price per gallon (inflation adj.): $0.86 ($2.31)
> Price per barrel (inflation adj.): $12.64 ($39.33)
> U.S. gas consumption: 2.6 billion barrels
> Per capita consumption: 479.2 gallons
1980
> Price per gallon (inflation adj.): $1.19 ($2.95)
> Price per barrel (inflation adj.): $21.59 ($59.70)
> U.S. gas consumption: 2.4 billion barrels
> Per capita consumption: 445.0 gallons
1981
> Price per gallon (inflation adj.): $1.31 ($2.97)
> Price per barrel (inflation adj.): $31.77 ($80.66)
> U.S. gas consumption: 2.4 billion barrels
> Per capita consumption: 440.1 gallons
[in-text-ad-2]
1982
> Price per gallon (inflation adj.): $1.22 ($2.60)
> Price per barrel (inflation adj.): $28.52 ($69.74)
> U.S. gas consumption: 2.4 billion barrels
> Per capita consumption: 432.7 gallons
1983
> Price per gallon (inflation adj.): $1.16 ($2.37)
> Price per barrel (inflation adj.): $26.19 ($61.70)
> U.S. gas consumption: 2.4 billion barrels
> Per capita consumption: 434.2 gallons
1984
> Price per gallon (inflation adj.): $1.13 ($2.23)
> Price per barrel (inflation adj.): $25.88 ($58.65)
> U.S. gas consumption: 2.4 billion barrels
> Per capita consumption: 436.2 gallons
1985
> Price per gallon (inflation adj.): $1.12 ($2.14)
> Price per barrel (inflation adj.): $24.09 ($52.60)
> U.S. gas consumption: 2.5 billion barrels
> Per capita consumption: 440.1 gallons
[in-text-ad]
1986
> Price per gallon (inflation adj.): $0.86 ($1.61)
> Price per barrel (inflation adj.): $12.51 ($27.02)
> U.S. gas consumption: 2.6 billion barrels
> Per capita consumption: 449.1 gallons
1987
> Price per gallon (inflation adj.): $0.90 ($1.64)
> Price per barrel (inflation adj.): $15.40 ($31.85)
> U.S. gas consumption: 2.6 billion barrels
> Per capita consumption: 455.9 gallons

1988
> Price per gallon (inflation adj.): $0.90 ($1.59)
> Price per barrel (inflation adj.): $12.58 ($24.92)
> U.S. gas consumption: 2.7 billion barrels
> Per capita consumption: 461.3 gallons
1989
> Price per gallon (inflation adj.): $1.00 ($1.70)
> Price per barrel (inflation adj.): $15.86 ($30.02)
> U.S. gas consumption: 2.7 billion barrels
> Per capita consumption: 455.1 gallons
1990
> Price per gallon (inflation adj.): $1.15 ($1.89)
> Price per barrel (inflation adj.): $20.03 ($35.73)
> U.S. gas consumption: 2.6 billion barrels
> Per capita consumption: 444.6 gallons
1991
> Price per gallon (inflation adj.): $1.14 ($1.81)
> Price per barrel (inflation adj.): $16.54 ($28.62)
> U.S. gas consumption: 2.6 billion barrels
> Per capita consumption: 437.0 gallons
[in-text-ad-2]
1992
> Price per gallon (inflation adj.): $1.13 ($1.75)
> Price per barrel (inflation adj.): $15.99 ($26.89)
> U.S. gas consumption: 2.7 billion barrels
> Per capita consumption: 438.1 gallons
1993
> Price per gallon (inflation adj.): $1.11 ($1.68)
> Price per barrel (inflation adj.): $14.25 ($23.33)
> U.S. gas consumption: 2.7 billion barrels
> Per capita consumption: 444.6 gallons
1994
> Price per gallon (inflation adj.): $1.11 ($1.65)
> Price per barrel (inflation adj.): $13.19 ($21.03)
> U.S. gas consumption: 2.8 billion barrels
> Per capita consumption: 447.6 gallons
1995
> Price per gallon (inflation adj.): $1.15 ($1.67)
> Price per barrel (inflation adj.): $14.62 ($22.73)
> U.S. gas consumption: 2.8 billion barrels
> Per capita consumption: 454.3 gallons
[in-text-ad]

1996
> Price per gallon (inflation adj.): $1.23 ($1.76)
> Price per barrel (inflation adj.): $18.46 ($27.78)
> U.S. gas consumption: 2.9 billion barrels
> Per capita consumption: 457.3 gallons
1997
> Price per gallon (inflation adj.): $1.23 ($1.74)
> Price per barrel (inflation adj.): $17.23 ($25.49)
> U.S. gas consumption: 2.9 billion barrels
> Per capita consumption: 458.9 gallons
1998
> Price per gallon (inflation adj.): $1.06 ($1.47)
> Price per barrel (inflation adj.): $10.87 ($15.83)
> U.S. gas consumption: 3.0 billion barrels
> Per capita consumption: 468.2 gallons
1999
> Price per gallon (inflation adj.): $1.17 ($1.60)
> Price per barrel (inflation adj.): $15.56 ($22.06)
> U.S. gas consumption: 3.1 billion barrels
> Per capita consumption: 474.0 gallons
2000
> Price per gallon (inflation adj.): $1.51 ($2.02)
> Price per barrel (inflation adj.): $26.72 ($36.65)
> U.S. gas consumption: 3.1 billion barrels
> Per capita consumption: 461.6 gallons

2001
> Price per gallon (inflation adj.): $1.46 ($1.91)
> Price per barrel (inflation adj.): $21.84 ($29.50)
> U.S. gas consumption: 3.1 billion barrels
> Per capita consumption: 463.2 gallons
[in-text-ad-2]
2002
> Price per gallon (inflation adj.): $1.36 ($1.75)
> Price per barrel (inflation adj.): $22.51 ($29.70)
> U.S. gas consumption: 3.2 billion barrels
> Per capita consumption: 471.6 gallons
2003
> Price per gallon (inflation adj.): $1.59 ($2.01)
> Price per barrel (inflation adj.): $27.56 ($35.69)
> U.S. gas consumption: 3.3 billion barrels
> Per capita consumption: 472.1 gallons

2004
> Price per gallon (inflation adj.): $1.88 ($2.32)
> Price per barrel (inflation adj.): $36.77 ($46.11)
> U.S. gas consumption: 3.3 billion barrels
> Per capita consumption: 478.0 gallons

2005
> Price per gallon (inflation adj.): $2.30 ($2.74)
> Price per barrel (inflation adj.): $50.28 ($60.97)
> U.S. gas consumption: 3.3 billion barrels
> Per capita consumption: 475.1 gallons
2006
> Price per gallon (inflation adj.): $2.59 ($3.00)
> Price per barrel (inflation adj.): $59.69 ($70.59)
> U.S. gas consumption: 3.4 billion barrels
> Per capita consumption: 475.4 gallons

2007
> Price per gallon (inflation adj.): $2.80 ($3.16)
> Price per barrel (inflation adj.): $66.52 ($75.58)
> U.S. gas consumption: 3.2 billion barrels
> Per capita consumption: 440.5 gallons
2008
> Price per gallon (inflation adj.): $3.27 ($3.61)
> Price per barrel (inflation adj.): $94.04 ($106.76)
> U.S. gas consumption: 3.2 billion barrels
> Per capita consumption: 440.5 gallons
2009
> Price per gallon (inflation adj.): $2.35 ($2.58)
> Price per barrel (inflation adj.): $56.35 ($62.27)
> U.S. gas consumption: 3.2 billion barrels
> Per capita consumption: 442.2 gallons
2010
> Price per gallon (inflation adj.): $2.79 ($3.02)
> Price per barrel (inflation adj.): $74.71 ($81.35)
> U.S. gas consumption: 3.3 billion barrels
> Per capita consumption: 445.6 gallons
2011
> Price per gallon (inflation adj.): $3.53 ($3.75)
> Price per barrel (inflation adj.): $95.73 ($101.24)
> U.S. gas consumption: 3.2 billion barrels
> Per capita consumption: 430.5 gallons
2012
> Price per gallon (inflation adj.): $3.64 ($3.80)
> Price per barrel (inflation adj.): $94.52 ($98.25)
> U.S. gas consumption: 3.2 billion barrels
> Per capita consumption: 424.9 gallons
2013
> Price per gallon (inflation adj.): $3.53 ($3.62)
> Price per barrel (inflation adj.): $95.99 ($98.30)
> U.S. gas consumption: 3.0 billion barrels
> Per capita consumption: 394.1 gallons
2014
> Price per gallon (inflation adj.): $3.37 ($3.40)
> Price per barrel (inflation adj.): $87.39 ($88.82)
> U.S. gas consumption: 3.3 billion barrels
> Per capita consumption: 428.8 gallons
2015
> Price per gallon (inflation adj.): $2.45 ($2.45)
> Price per barrel (inflation adj.): $44.39 ($44.39)
> U.S. gas consumption: 3.4 billion barrels
> Per capita consumption: 437.8 gallons
Detailed Findings
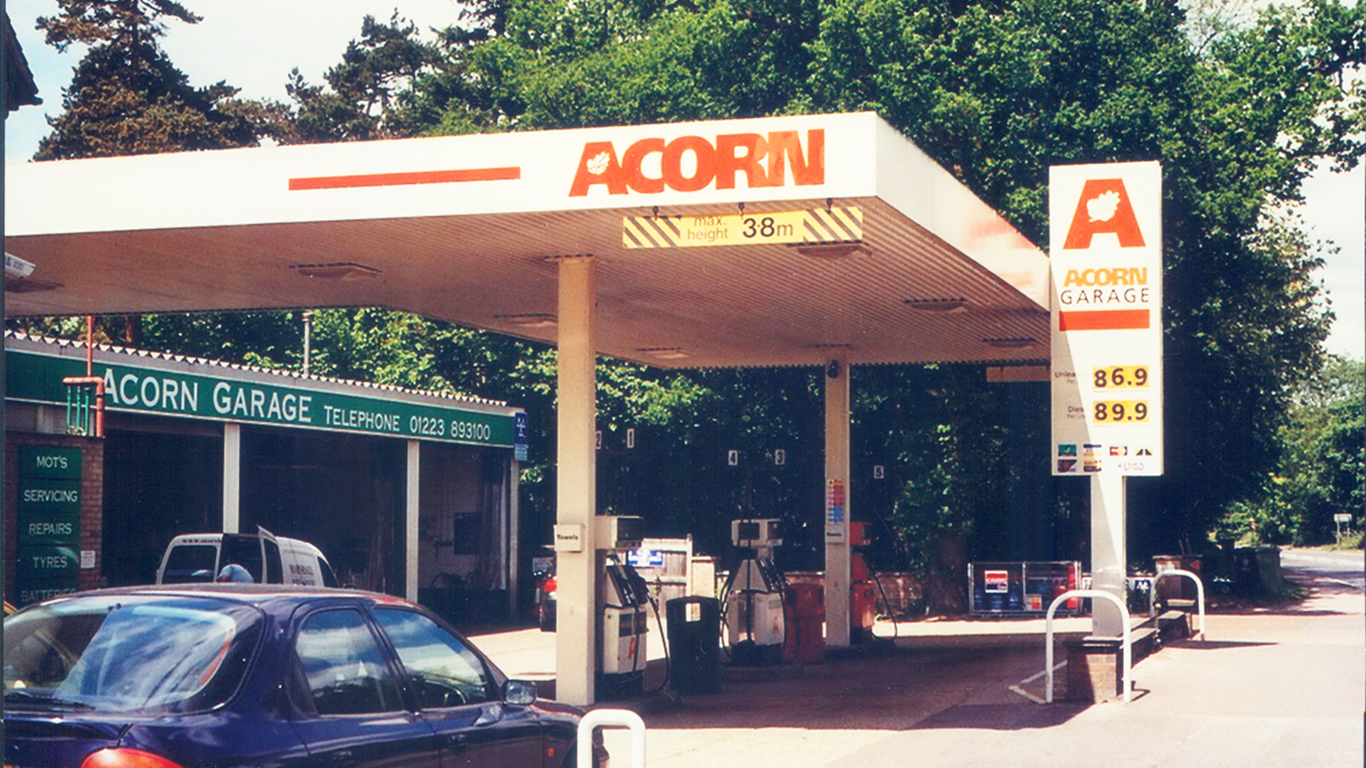
A gallon of gas cost less than a quarter in 1945. However, after adjusting for inflation, fuel costs that year were roughly in line with today’s prices. Still, gas prices have ranged dramatically in the last several decades, from an inflation adjusted average national low of $1.47 in 1998, to a high of $3.80 in 2012.
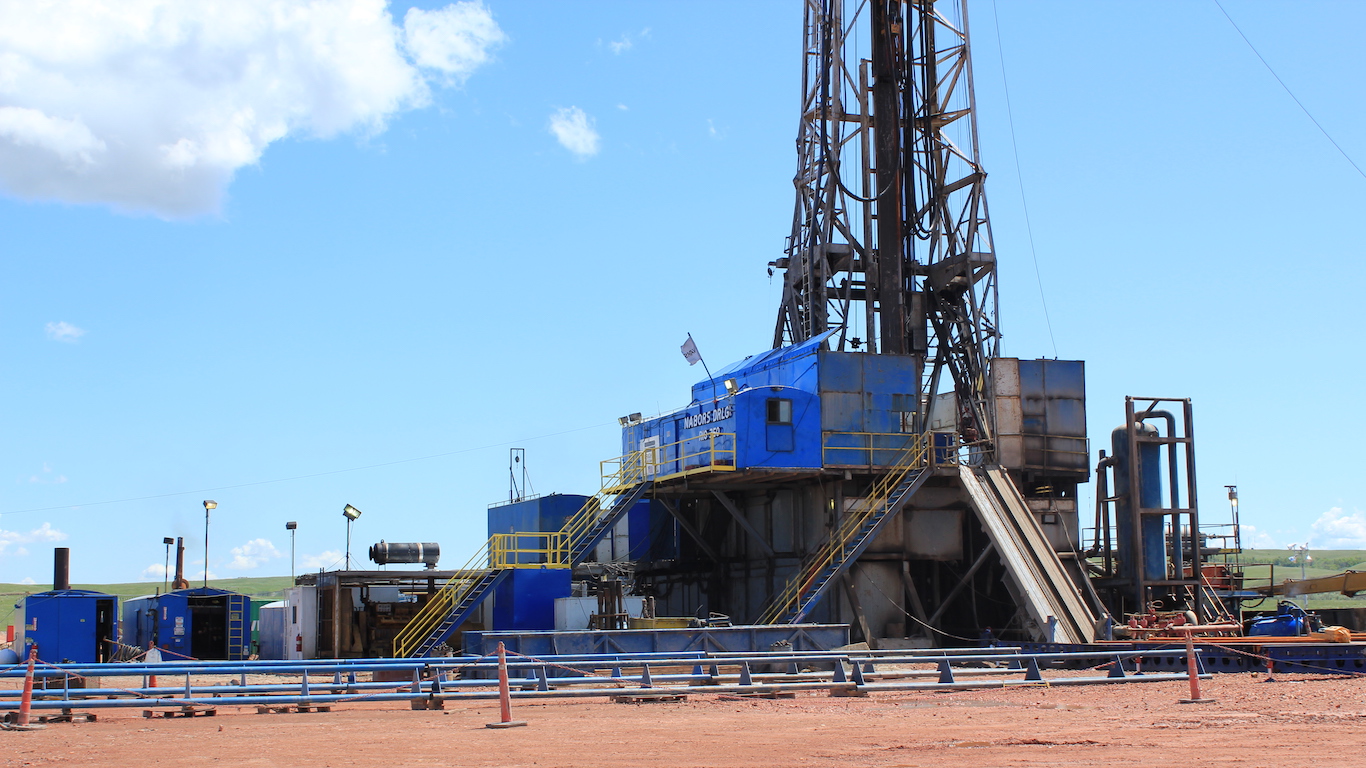
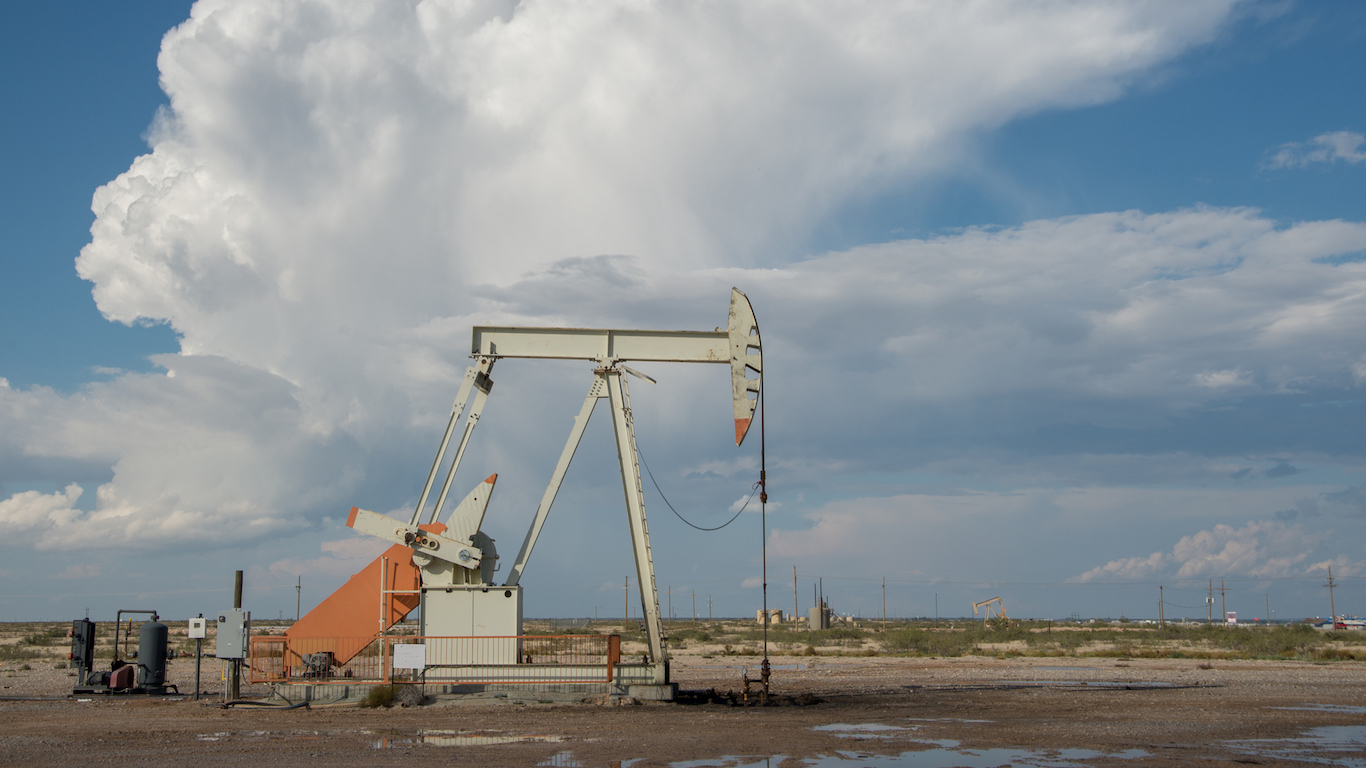
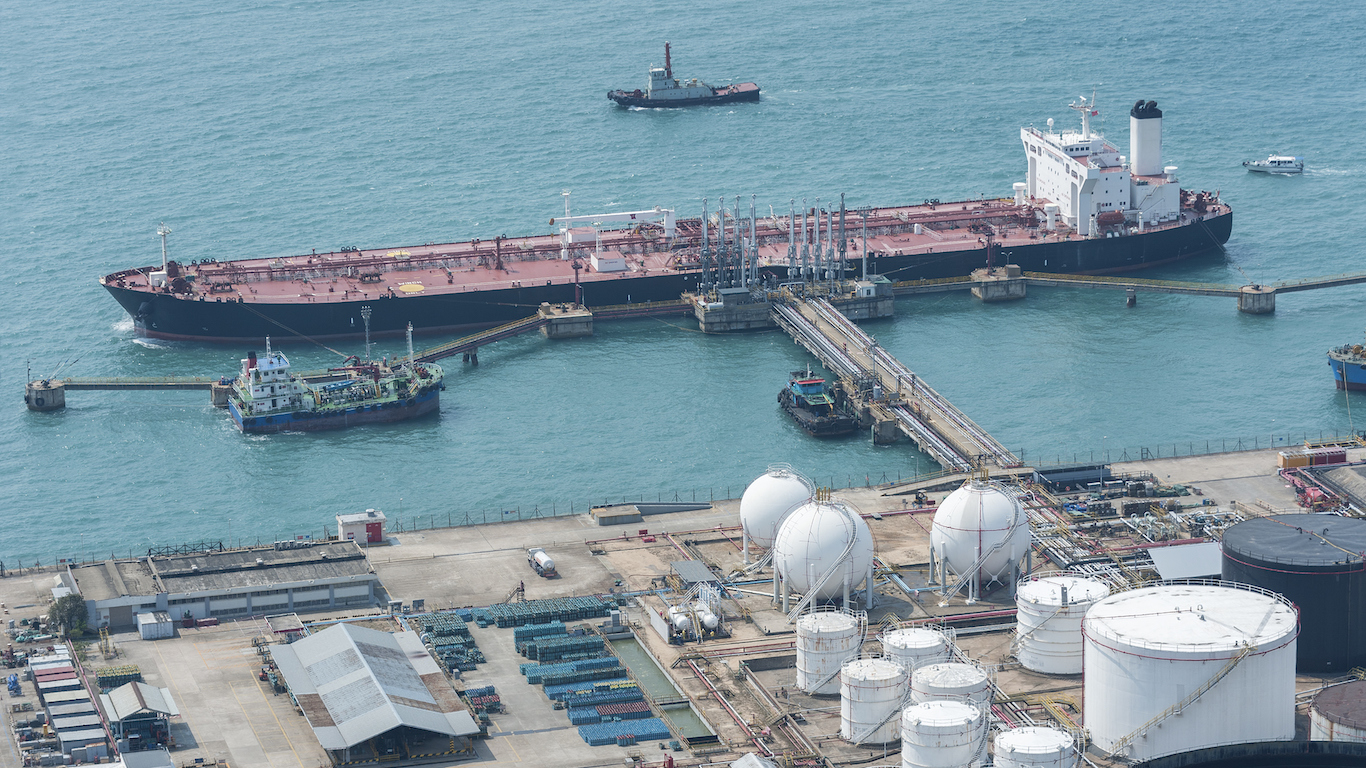
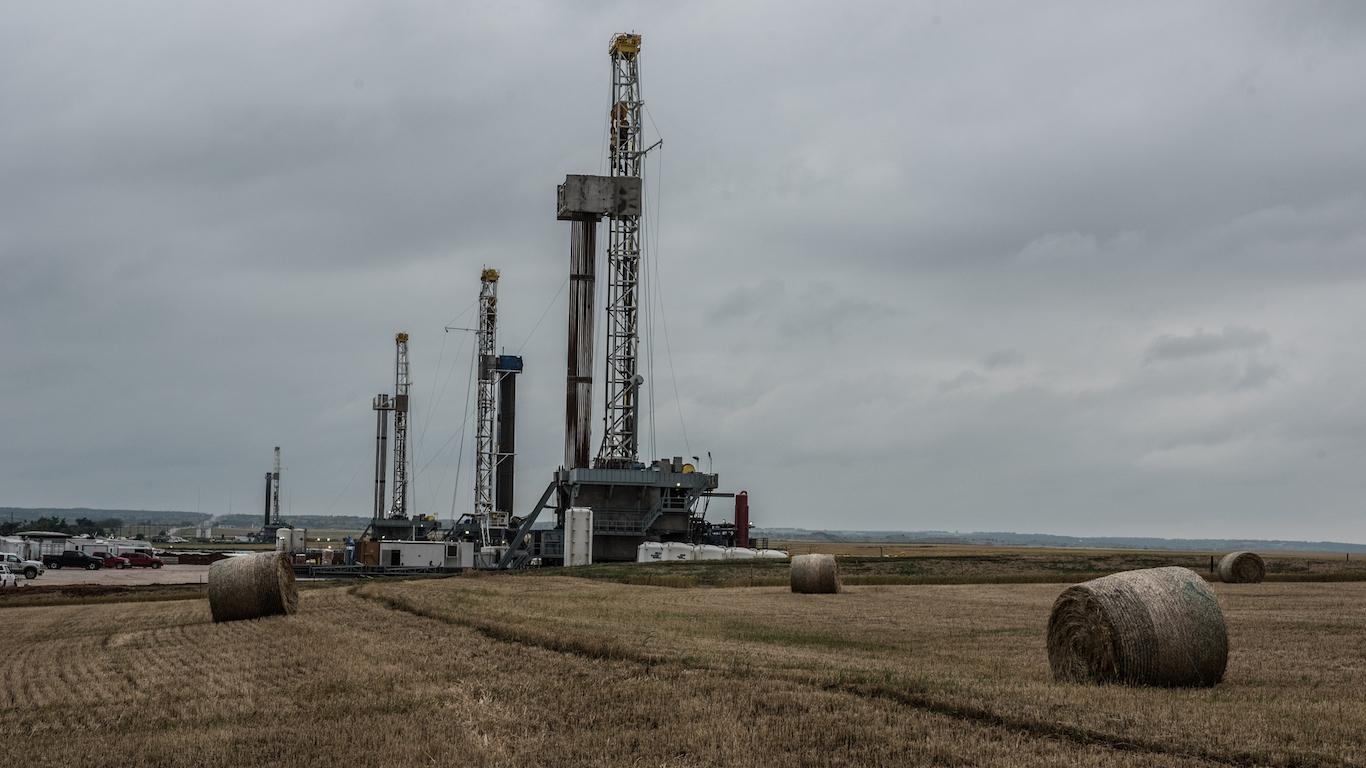
Meeting demand for gasoline in the U.S. is no small task. Oil companies extracted some 3.4 billion barrels of crude oil in the U.S. in 2015 — up considerably from 3.2 billion barrels the previous year.
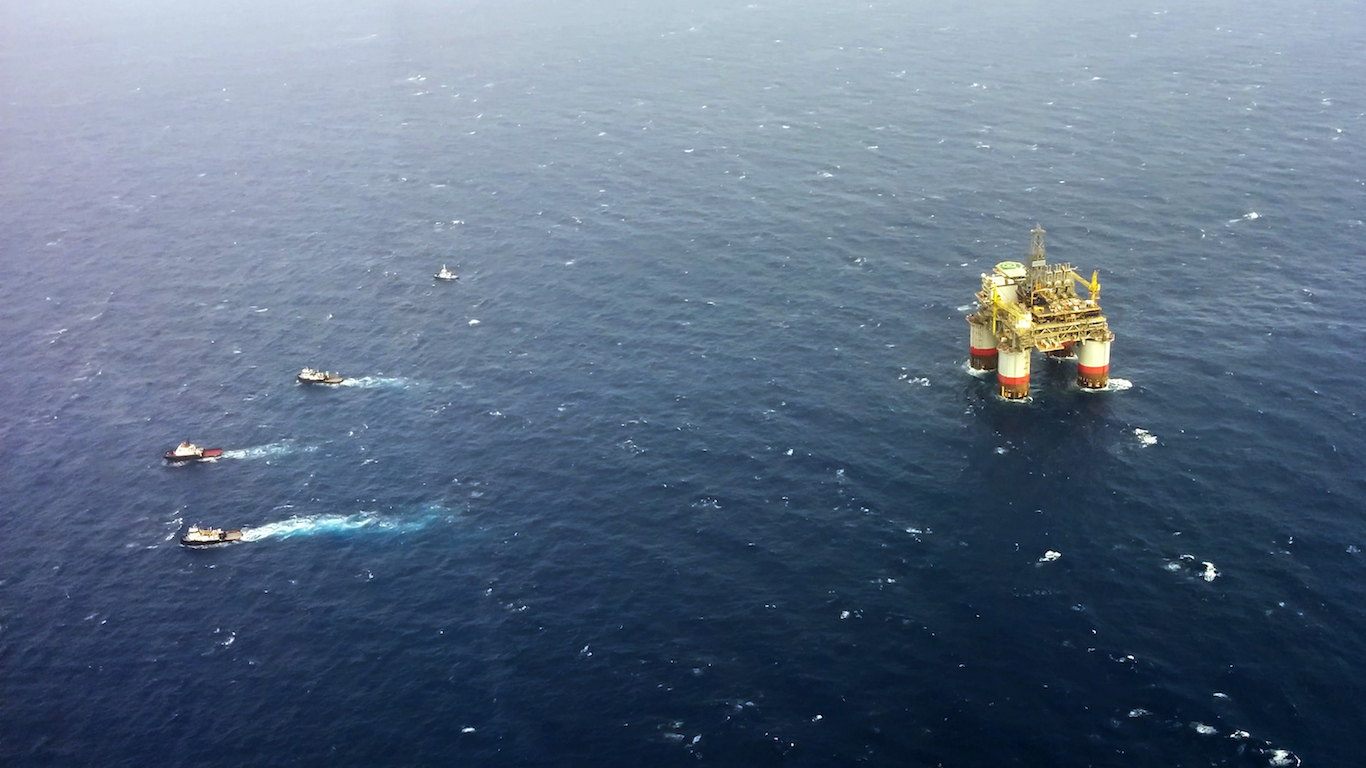
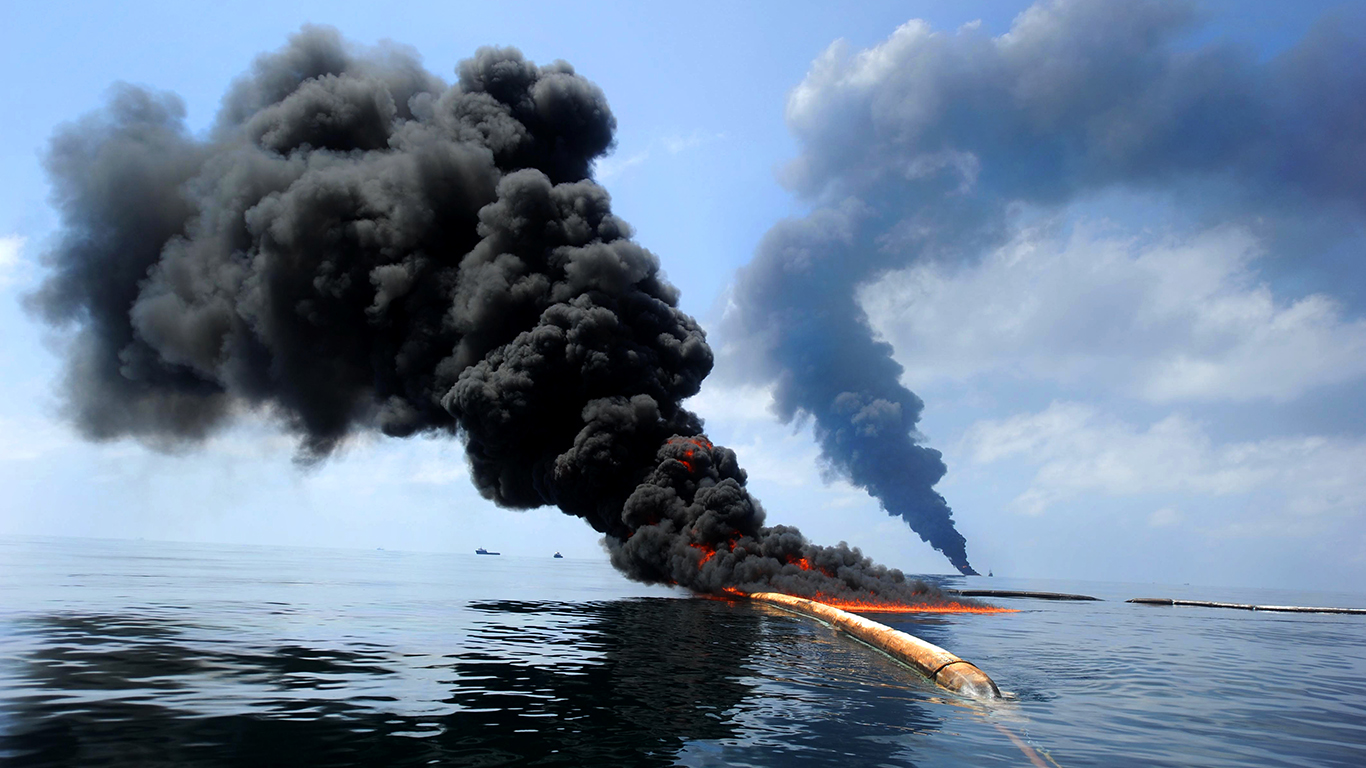
The country also depends heavily on foreign oil. The U.S. imported 2.7 billion barrels of crude oil in 2015, roughly the same amount as in 2014. However, the broader trend reflects a reduced reliance on foreign oil. Due to a range of factors, including decreased demand and increased U.S. production, crude oil imports have fallen 27% since an all time high of 3.7 billion barrels in 2005.
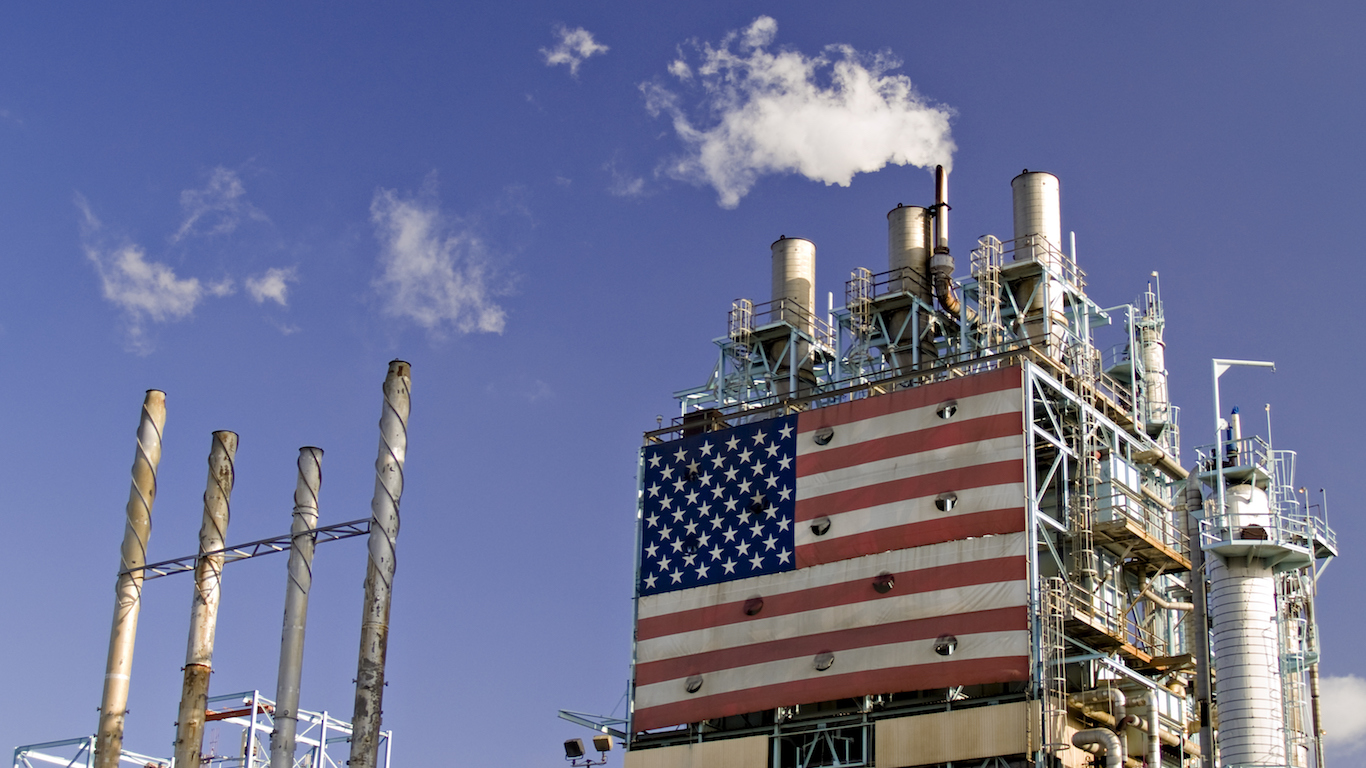
About half of all petroleum in the U.S. is refined into gasoline. Though it can be used for a wide range of purposes, personal automobiles account for 90% of gasoline consumption nationwide.
Though the progression is not always linear, Americans appear to be driving more and more each year. While 2015 was a record year for total vehicle miles traveled, it was not a record year for fuel consumption. Due in large part to increasingly fuel-efficient vehicles, Americans consumed some 437.8 gallons of gasoline per capita in 2015 — well below the all-time high of 510.5 gallons in 1978.
Methodology
To identify the cost of a gallon of gas every year since 1945, 24/7 Wall St. used historical data from the U.S. Energy Information Administration. The prices reflect annual averages of the price at the pump for a gallon of gasoline. We also considered average annual motor oil consumption and the average price of a barrel of crude oil from the EIA. Per-capita gas consumption was calculated using population estimates from the U.S. Census Bureau. All inflation-adjusted prices are tied to 2015 dollars. Annual U.S. crude oil imports and production also came from the EIA.
It’s Your Money, Your Future—Own It (sponsor)
Retirement can be daunting, but it doesn’t need to be.
Imagine having an expert in your corner to help you with your financial goals. Someone to help you determine if you’re ahead, behind, or right on track. With SmartAsset, that’s not just a dream—it’s reality. This free tool connects you with pre-screened financial advisors who work in your best interests. It’s quick, it’s easy, so take the leap today and start planning smarter!
Don’t waste another minute; get started right here and help your retirement dreams become a retirement reality.
Thank you for reading! Have some feedback for us?
Contact the 24/7 Wall St. editorial team.
Latest from 24/7


Our expert who first called NVIDIA in 2009 is predicting 2025 will see a historic AI breakthrough.
You can follow him investing $500,000 of his own money on our top AI stocks for free.