
In the United States, violent crime is classified as aggravated assault, robbery, rape, and homicide. Nationwide, there were 397 violent crimes for every 100,000 Americans in 2016 — up from 385 violent crimes per 100,000 in 2015. The uptick marked the second in as many years and the first time in a decade the U.S. violent crime rate climbed for two consecutive years.
The recent increases in violent crime rates, however, pale in comparison to those of only a few decades ago. The U.S. violent crime rate climbed 40% from 1984 to 1991, when the crime rate hit a peak of 758 crimes for every 100,000 people.
There has been widespread media coverage of recent alarming spikes in violence in a select few metropolitan areas — in particular, Chicago. However, the recent uptick does not appear to be caused solely by rising crime in isolated pockets of the country, as the violent crime rate increased in 38 states from 2015 to 2016. Despite a widespread increase in violence in most states, some states remain far safer than the nation as a whole. In other states, crime rates are approaching — or have in some cases have exceeded — levels not seen nationwide since the early 1990s.
24/7 Wall St. reviewed the FBI’s 2016 Uniform Crime Report to identify the most dangerous — and the safest — states in the country. Violent crime rates range by state from less than 200 to more than 800 incidents per 100,000 residents.
Click here to see the most dangerous states in America.
Click here to see our detailed findings and methodology.

50. Maine
> Violent crimes per 100,000: 124
> Total 2016 murders: 20 (5th fewest)
> Imprisonment rate: 163 adults per 100,000 (the lowest)
> Poverty rate: 12.5% (21st lowest)
> Most dangerous metro area: Lewiston-Auburn
[in-text-ad]

49. Vermont
> Violent crimes per 100,000: 158
> Total 2016 murders: 14 (the fewest)
> Imprisonment rate: 255 adults per 100,000 (4th lowest)
> Poverty rate: 11.9% (19th lowest)
> Most dangerous metro area: N/A

48. New Hampshire
> Violent crimes per 100,000: 198
> Total 2016 murders: 17 (3rd fewest)
> Imprisonment rate: 271 adults per 100,000 (6th lowest)
> Poverty rate: 7.3% (the lowest)
> Most dangerous metro area: Manchester-Nashua

47. Virginia
> Violent crimes per 100,000: 218
> Total 2016 murders: 484 (14th most)
> Imprisonment rate: 588 adults per 100,000 (13th highest)
> Poverty rate: 11.0% (12th lowest)
> Most dangerous metro area: Virginia Beach-Norfolk-Newport News
[in-text-ad-2]

46. Connecticut
> Violent crimes per 100,000: 227
> Total 2016 murders: 78 (16th fewest)
> Imprisonment rate: 396 adults per 100,000 (15th lowest)
> Poverty rate: 9.8% (4th lowest)
> Most dangerous metro area: New Haven-Milford

45. Idaho
> Violent crimes per 100,000: 230
> Total 2016 murders: 49 (11th fewest)
> Imprisonment rate: 590 adults per 100,000 (12th highest)
> Poverty rate: 14.4% (19th highest)
> Most dangerous metro area: Idaho Falls
[in-text-ad]

44. Kentucky
> Violent crimes per 100,000: 232
> Total 2016 murders: 260 (21st most)
> Imprisonment rate: 634 adults per 100,000 (10th highest)
> Poverty rate: 18.5% (4th highest)
> Most dangerous metro area: Louisville/Jefferson County

43. Rhode Island
> Violent crimes per 100,000: 239
> Total 2016 murders: 29 (7th fewest)
> Imprisonment rate: 254 adults per 100,000 (3rd lowest)
> Poverty rate: 12.8% (22nd lowest)
> Most dangerous metro area: Providence-Warwick

42. Minnesota
> Violent crimes per 100,000: 243
> Total 2016 murders: 101 (18th fewest)
> Imprisonment rate: 256 adults per 100,000 (5th lowest)
> Poverty rate: 9.9% (6th lowest)
> Most dangerous metro area: Minneapolis-St. Paul-Bloomington
[in-text-ad-2]
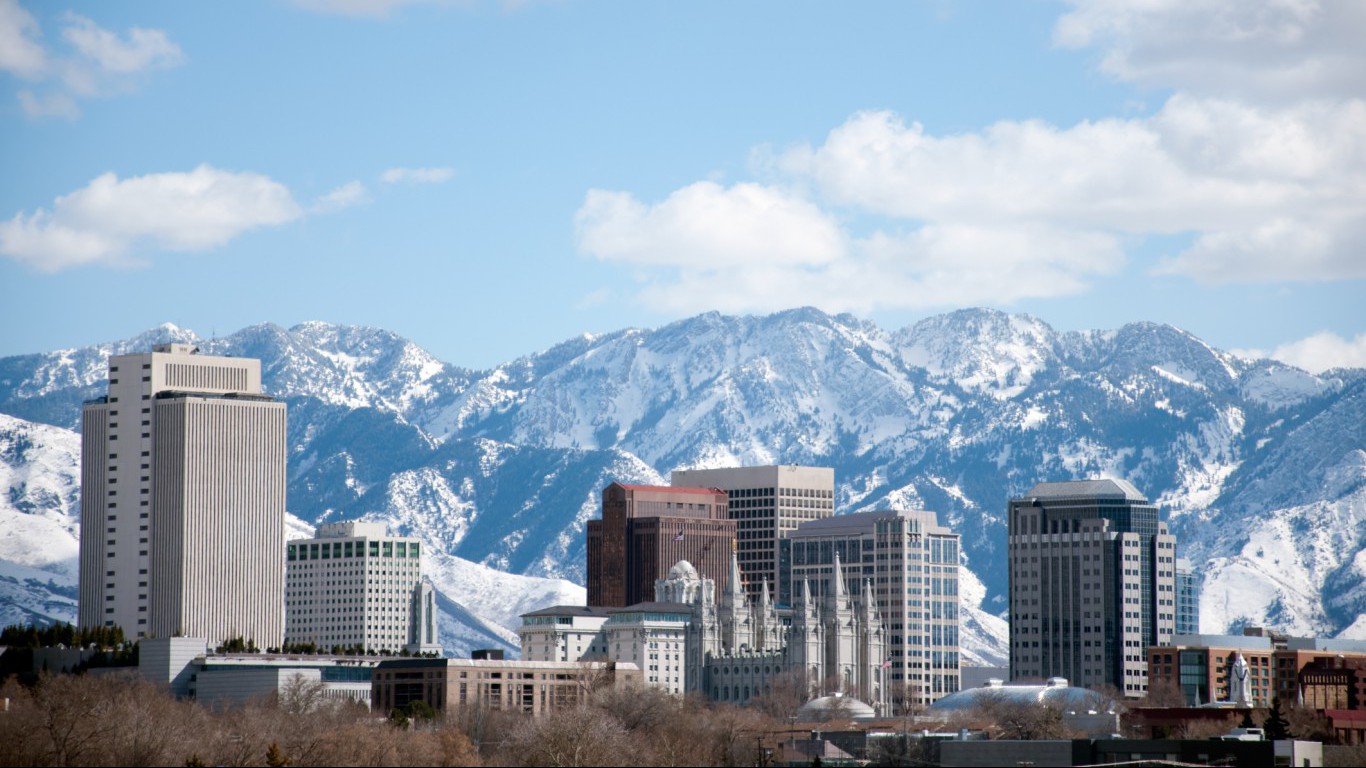
41. Utah
> Violent crimes per 100,000: 243
> Total 2016 murders: 72 (15th fewest)
> Imprisonment rate: 309 adults per 100,000 (9th lowest)
> Poverty rate: 10.2% (7th lowest)
> Most dangerous metro area: Salt Lake City

40. Wyoming
> Violent crimes per 100,000: 244
> Total 2016 murders: 20 (5th fewest)
> Imprisonment rate: 541 adults per 100,000 (20th highest)
> Poverty rate: 11.3% (14th lowest)
> Most dangerous metro area: Cheyenne
[in-text-ad]

39. New Jersey
> Violent crimes per 100,000: 245
> Total 2016 murders: 372 (19th most)
> Imprisonment rate: 293 adults per 100,000 (7th lowest)
> Poverty rate: 10.4% (9th lowest)
> Most dangerous metro area: Vineland-Bridgeton

38. North Dakota
> Violent crimes per 100,000: 251
> Total 2016 murders: 15 (2nd fewest)
> Imprisonment rate: 302 adults per 100,000 (8th lowest)
> Poverty rate: 10.7% (10th lowest)
> Most dangerous metro area: Bismarck

37. Oregon
> Violent crimes per 100,000: 265
> Total 2016 murders: 113 (20th fewest)
> Imprisonment rate: 477 adults per 100,000 (25th lowest)
> Poverty rate: 13.3% (24th highest)
> Most dangerous metro area: Medford
[in-text-ad-2]
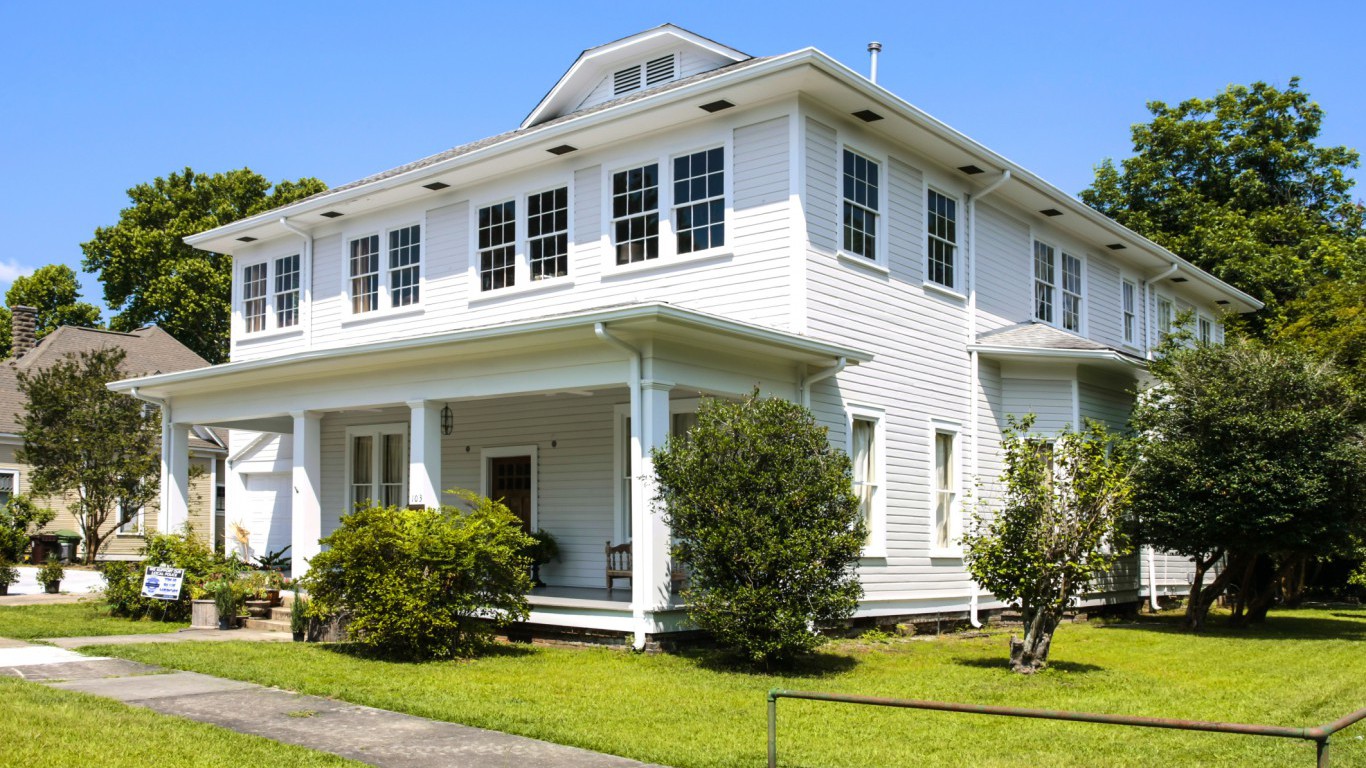
36. Mississippi
> Violent crimes per 100,000: 281
> Total 2016 murders: 238 (23rd most)
> Imprisonment rate: 803 adults per 100,000 (3rd highest)
> Poverty rate: 20.8% (the highest)
> Most dangerous metro area: Hattiesburg

35. Iowa
> Violent crimes per 100,000: 291
> Total 2016 murders: 71 (14th fewest)
> Imprisonment rate: 367 adults per 100,000 (13th lowest)
> Poverty rate: 11.8% (18th lowest)
> Most dangerous metro area: Waterloo-Cedar Falls
[in-text-ad]
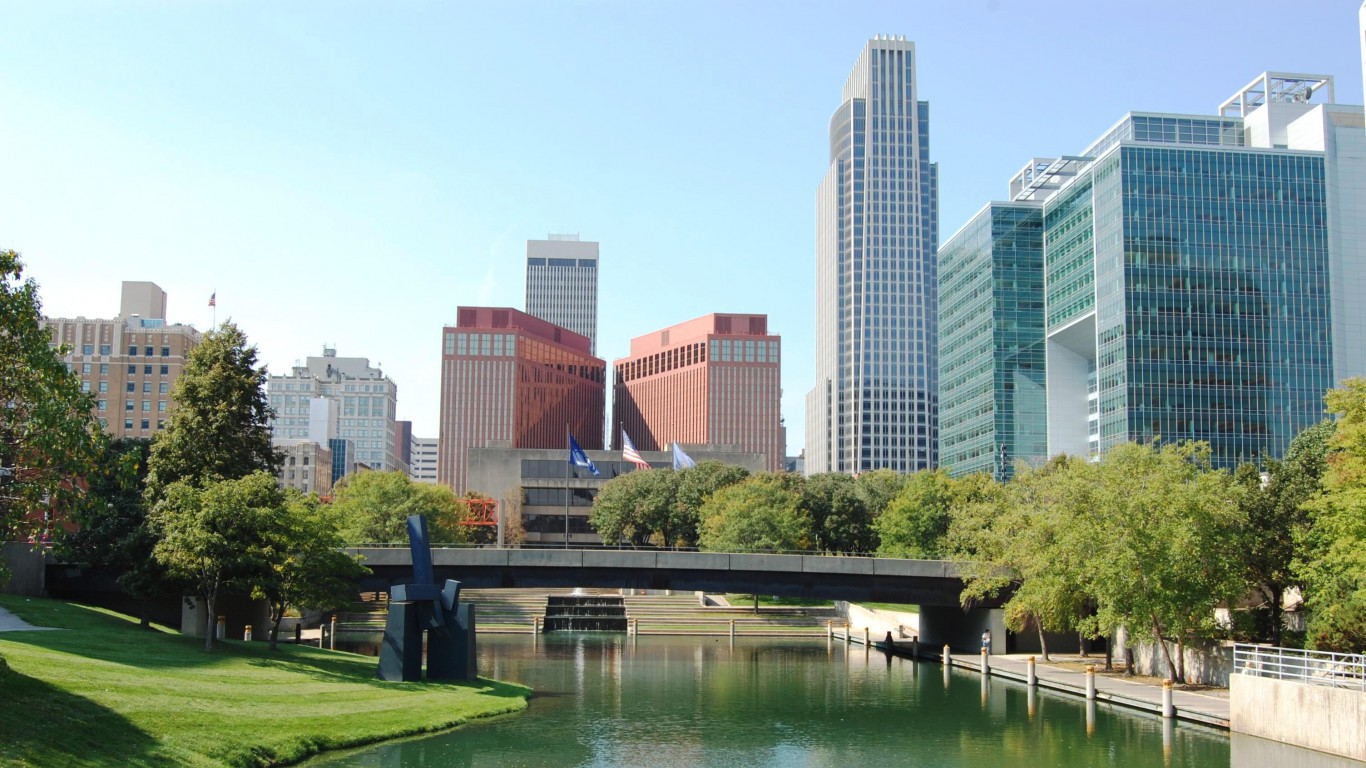
34. Nebraska
> Violent crimes per 100,000: 291
> Total 2016 murders: 49 (11th fewest)
> Imprisonment rate: 371 adults per 100,000 (14th lowest)
> Poverty rate: 11.4% (15th lowest)
> Most dangerous metro area: Omaha-Council Bluffs

33. Ohio
> Violent crimes per 100,000: 300
> Total 2016 murders: 654 (8th most)
> Imprisonment rate: 580 adults per 100,000 (14th highest)
> Poverty rate: 14.6% (18th highest)
> Most dangerous metro area: Toledo

32. Washington
> Violent crimes per 100,000: 302
> Total 2016 murders: 195 (23rd fewest)
> Imprisonment rate: 325 adults per 100,000 (10th lowest)
> Poverty rate: 11.3% (14th lowest)
> Most dangerous metro area: Seattle-Tacoma-Bellevue
[in-text-ad-2]

31. Wisconsin
> Violent crimes per 100,000: 306
> Total 2016 murders: 229 (24th most)
> Imprisonment rate: 485 adults per 100,000 (25th highest)
> Poverty rate: 11.8% (18th lowest)
> Most dangerous metro area: Milwaukee-Waukesha-West Allis

30. Hawaii
> Violent crimes per 100,000: 309
> Total 2016 murders: 35 (8th fewest)
> Imprisonment rate: 335 adults per 100,000 (12th lowest)
> Poverty rate: 9.3% (2nd lowest)
> Most dangerous metro area: Urban Honolulu
[in-text-ad]
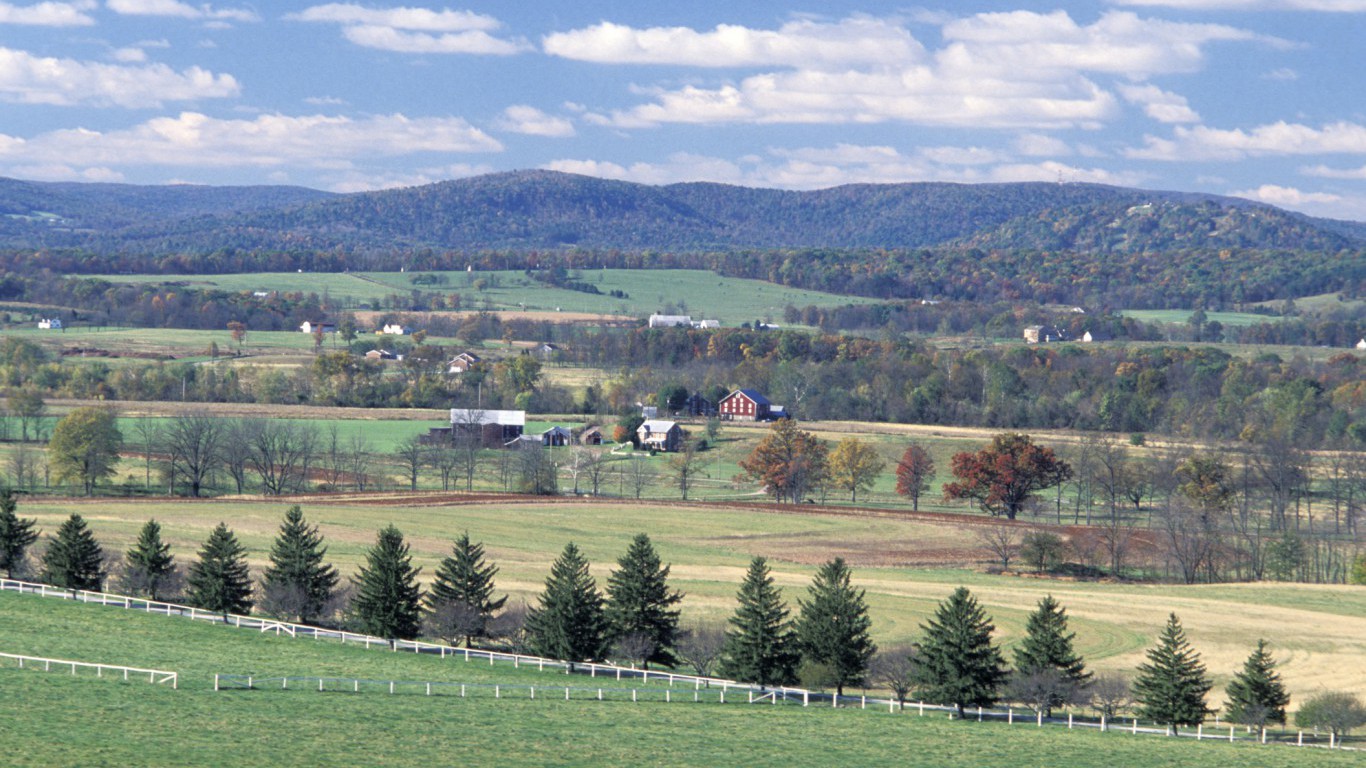
29. Pennsylvania
> Violent crimes per 100,000: 316
> Total 2016 murders: 661 (7th most)
> Imprisonment rate: 489 adults per 100,000 (23rd highest)
> Poverty rate: 12.9% (23rd lowest)
> Most dangerous metro area: Philadelphia-Camden-Wilmington

28. Colorado
> Violent crimes per 100,000: 343
> Total 2016 murders: 204 (24th fewest)
> Imprisonment rate: 473 adults per 100,000 (24th lowest)
> Poverty rate: 11.0% (12th lowest)
> Most dangerous metro area: Pueblo

27. West Virginia
> Violent crimes per 100,000: 358
> Total 2016 murders: 81 (17th fewest)
> Imprisonment rate: 486 adults per 100,000 (24th highest)
> Poverty rate: 17.9% (5th highest)
> Most dangerous metro area: Charleston
[in-text-ad-2]

26. Montana
> Violent crimes per 100,000: 368
> Total 2016 murders: 36 (9th fewest)
> Imprisonment rate: 455 adults per 100,000 (22nd lowest)
> Poverty rate: 13.3% (24th highest)
> Most dangerous metro area: Missoula

25. North Carolina
> Violent crimes per 100,000: 372
> Total 2016 murders: 678 (6th most)
> Imprisonment rate: 455 adults per 100,000 (22nd lowest)
> Poverty rate: 15.4% (13th highest)
> Most dangerous metro area: Fayetteville
[in-text-ad]

24. New York
> Violent crimes per 100,000: 376
> Total 2016 murders: 630 (9th most)
> Imprisonment rate: 330 adults per 100,000 (11th lowest)
> Poverty rate: 14.7% (16th highest)
> Most dangerous metro area: Buffalo-Cheektowaga-Niagara Falls

23. Massachusetts
> Violent crimes per 100,000: 377
> Total 2016 murders: 134 (21st fewest)
> Imprisonment rate: 225 adults per 100,000 (2nd lowest)
> Poverty rate: 10.4% (9th lowest)
> Most dangerous metro area: Springfield

22. Kansas
> Violent crimes per 100,000: 380
> Total 2016 murders: 111 (19th fewest)
> Imprisonment rate: 436 adults per 100,000 (18th lowest)
> Poverty rate: 12.1% (20th lowest)
> Most dangerous metro area: Wichita
[in-text-ad-2]

21. Georgia
> Violent crimes per 100,000: 398
> Total 2016 murders: 681 (5th most)
> Imprisonment rate: 666 adults per 100,000 (9th highest)
> Poverty rate: 16.0% (10th highest)
> Most dangerous metro area: Albany

20. Indiana
> Violent crimes per 100,000: 405
> Total 2016 murders: 439 (16th most)
> Imprisonment rate: 541 adults per 100,000 (20th highest)
> Poverty rate: 14.1% (21st highest)
> Most dangerous metro area: Indianapolis-Carmel-Anderson
[in-text-ad]

19. South Dakota
> Violent crimes per 100,000: 418
> Total 2016 murders: 27 (6th fewest)
> Imprisonment rate: 548 adults per 100,000 (19th highest)
> Poverty rate: 13.3% (24th highest)
> Most dangerous metro area: Rapid City
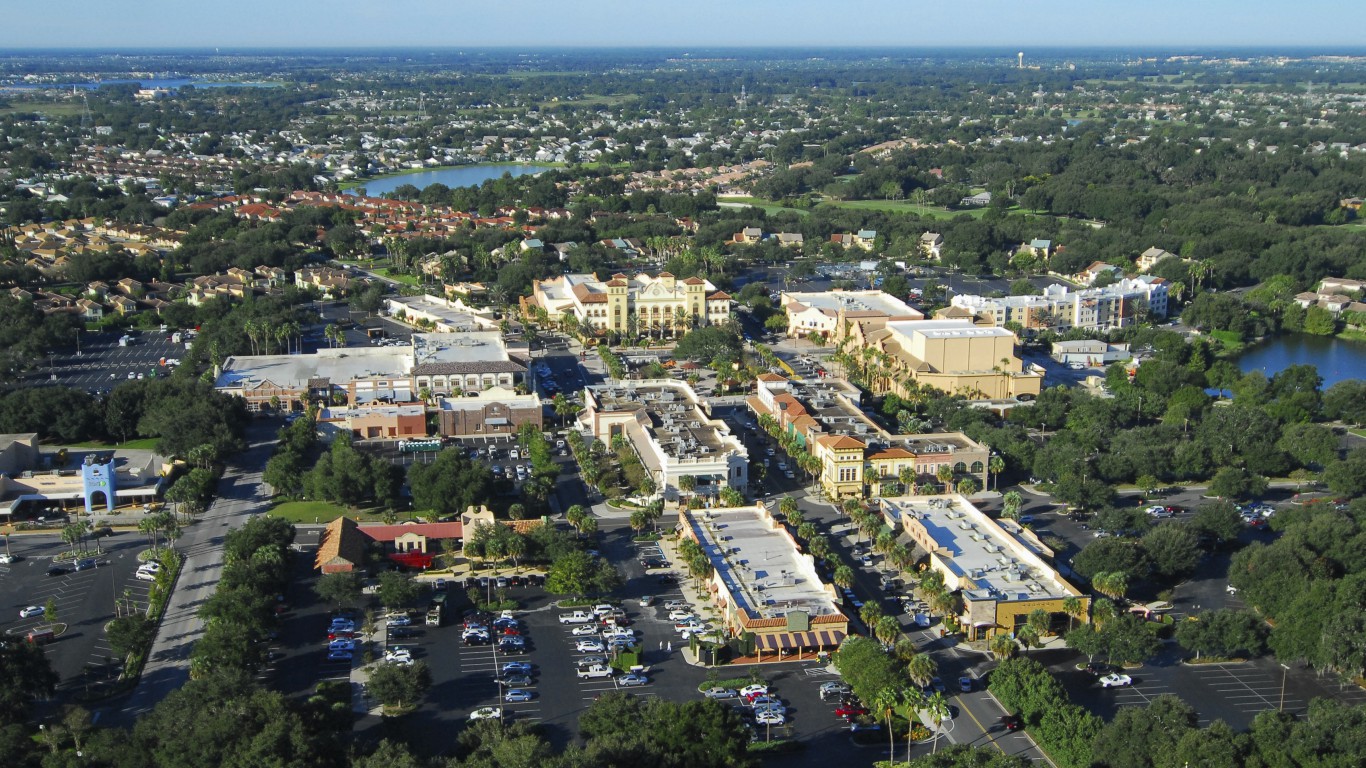
18. Florida
> Violent crimes per 100,000: 430
> Total 2016 murders: 1111 (3rd most)
> Imprisonment rate: 621 adults per 100,000 (11th highest)
> Poverty rate: 14.7% (16th highest)
> Most dangerous metro area: Tallahassee

17. Texas
> Violent crimes per 100,000: 434
> Total 2016 murders: 1478 (2nd most)
> Imprisonment rate: 769 adults per 100,000 (7th highest)
> Poverty rate: 15.6% (12th highest)
> Most dangerous metro area: Lubbock
[in-text-ad-2]

16. Illinois
> Violent crimes per 100,000: 436
> Total 2016 murders: 1054 (4th most)
> Imprisonment rate: 466 adults per 100,000 (23rd lowest)
> Poverty rate: 13.0% (24th lowest)
> Most dangerous metro area: Rockford

15. California
> Violent crimes per 100,000: 445
> Total 2016 murders: 1930 (the most)
> Imprisonment rate: 428 adults per 100,000 (17th lowest)
> Poverty rate: 14.3% (20th highest)
> Most dangerous metro area: Stockton-Lodi
[in-text-ad]

14. Oklahoma
> Violent crimes per 100,000: 450
> Total 2016 murders: 245 (22nd most)
> Imprisonment rate: 948 adults per 100,000 (2nd highest)
> Poverty rate: 16.3% (9th highest)
> Most dangerous metro area: Lawton

13. Michigan
> Violent crimes per 100,000: 459
> Total 2016 murders: 598 (10th most)
> Imprisonment rate: 551 adults per 100,000 (17th highest)
> Poverty rate: 15.0% (15th highest)
> Most dangerous metro area: Battle Creek

12. Arizona
> Violent crimes per 100,000: 470
> Total 2016 murders: 380 (18th most)
> Imprisonment rate: 781 adults per 100,000 (5th highest)
> Poverty rate: 16.4% (8th highest)
> Most dangerous metro area: Tucson
[in-text-ad-2]

11. Maryland
> Violent crimes per 100,000: 472
> Total 2016 murders: 481 (15th most)
> Imprisonment rate: 437 adults per 100,000 (19th lowest)
> Poverty rate: 9.7% (3rd lowest)
> Most dangerous metro area: Baltimore-Columbia-Towson

10. South Carolina
> Violent crimes per 100,000: 502
> Total 2016 murders: 366 (20th most)
> Imprisonment rate: 532 adults per 100,000 (22nd highest)
> Poverty rate: 15.3% (14th highest)
> Most dangerous metro area: Florence
[in-text-ad]

9. Delaware
> Violent crimes per 100,000: 509
> Total 2016 murders: 56 (13th fewest)
> Imprisonment rate: 561 adults per 100,000 (16th highest)
> Poverty rate: 11.7% (16th lowest)
> Most dangerous metro area: Dover

8. Missouri
> Violent crimes per 100,000: 519
> Total 2016 murders: 537 (12th most)
> Imprisonment rate: 687 adults per 100,000 (8th highest)
> Poverty rate: 14.0% (22nd highest)
> Most dangerous metro area: Springfield

7. Alabama
> Violent crimes per 100,000: 532
> Total 2016 murders: 407 (17th most)
> Imprisonment rate: 790 adults per 100,000 (4th highest)
> Poverty rate: 17.1% (7th highest)
> Most dangerous metro area: Anniston-Oxford-Jacksonville
[in-text-ad-2]

6. Arkansas
> Violent crimes per 100,000: 551
> Total 2016 murders: 216 (25th fewest)
> Imprisonment rate: 774 adults per 100,000 (6th highest)
> Poverty rate: 17.2% (6th highest)
> Most dangerous metro area: Pine Bluff

5. Louisiana
> Violent crimes per 100,000: 566
> Total 2016 murders: 554 (11th most)
> Imprisonment rate: 1019 adults per 100,000 (the highest)
> Poverty rate: 20.2% (2nd highest)
> Most dangerous metro area: Monroe
[in-text-ad]

4. Tennessee
> Violent crimes per 100,000: 633
> Total 2016 murders: 486 (13th most)
> Imprisonment rate: 549 adults per 100,000 (18th highest)
> Poverty rate: 15.8% (11th highest)
> Most dangerous metro area: Memphis

3. Nevada
> Violent crimes per 100,000: 678
> Total 2016 murders: 224 (25th most)
> Imprisonment rate: 577 adults per 100,000 (15th highest)
> Poverty rate: 13.8% (23rd highest)
> Most dangerous metro area: Las Vegas-Henderson-Paradise
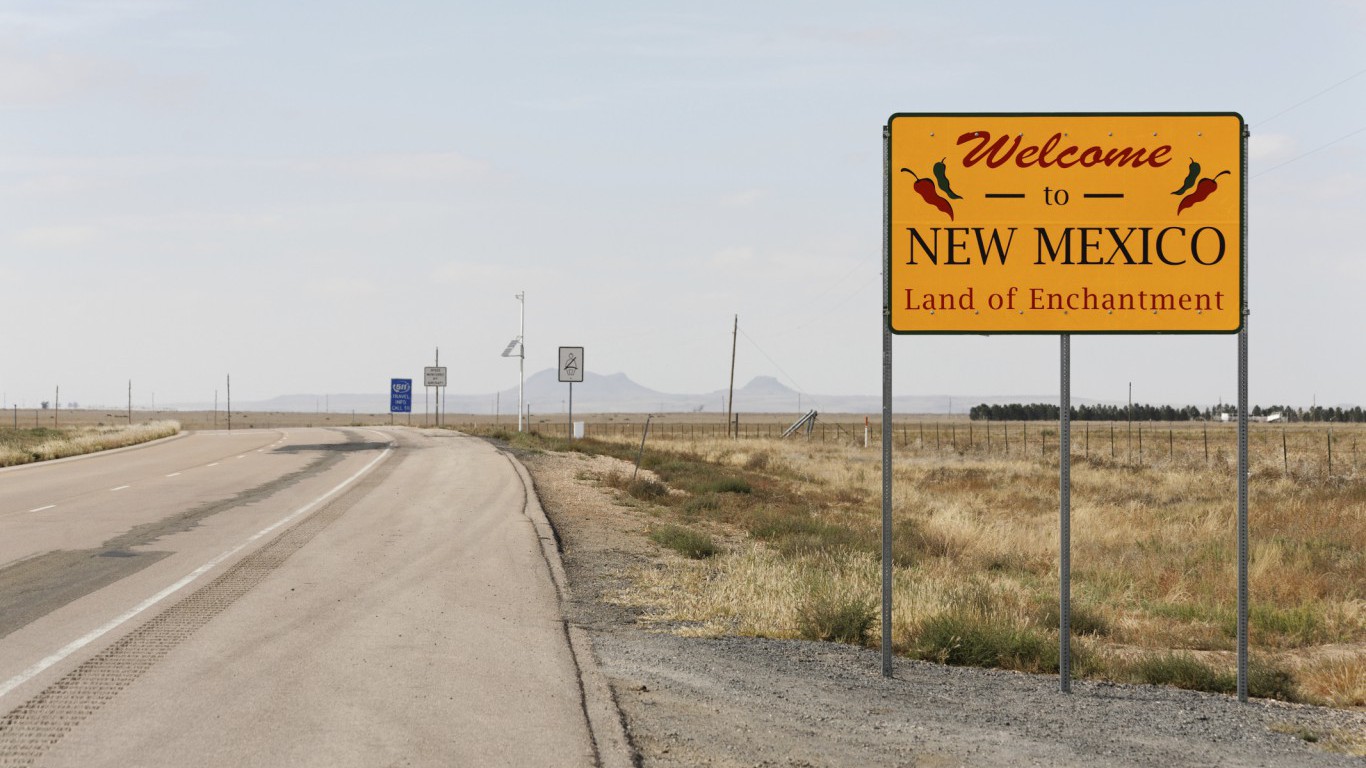
2. New Mexico
> Violent crimes per 100,000: 703
> Total 2016 murders: 139 (22nd fewest)
> Imprisonment rate: 440 adults per 100,000 (20th lowest)
> Poverty rate: 19.8% (3rd highest)
> Most dangerous metro area: Farmington
[in-text-ad-2]

1. Alaska
> Violent crimes per 100,000: 804
> Total 2016 murders: 52 (12th fewest)
> Imprisonment rate: 409 adults per 100,000 (16th lowest)
> Poverty rate: 9.9% (6th lowest)
> Most dangerous metro area: Anchorage
Though the exact cause of the uptick in violent crime is unclear, some experts cite poverty as a possible explanation. Nationwide, 14.0% of Americans live below the poverty line. Of the 10 states with the highest violent crime rates, seven have a higher poverty rate greater than or equal to the nation as a whole. Meanwhile, eight of the 10 safest states have poverty rates below that of the U.S. as a whole.
In almost every state, major metropolitan areas largely drive violent crime rates. Delaware, Mississippi, and Vermont are the only states that do not have metro areas that are more dangerous than the state as a whole. In Monroe, the most dangerous metro area in Louisiana and the country, there were 1,187 violent crimes for every 100,000 people, more than double the comparable statewide rate, which itself is one of the highest in the nation.
The U.S. prison population climbed from about 1.5 million in 1994 to 2.2 million in 2017.But while the increase in nationwide prison population has coincided with the decline in violent crime rate, states with higher incarceration rates tend to also have higher violent crime rates. In Louisiana, the fifth most dangerous state, there are 1,019 state and federal prisoners for every 100,000 adults in the state, the highest imprisonment rate in the country. Maine, the safest state in the county, has the lowest imprisonment rate at only 163 inmates per 100,000 adults.
Certain regions of the country appear to be more violent than others. Of the 10 most violent states, nine are either in the South or western United States. Meanwhile, New England states comprise half of the country’s 10 safest states.
To identify the most dangerous states, 24/7 Wall St. reviewed the number of violent crimes reported per 100,000 people in each state from the FBI’s 2016 Uniform Crime Report. The total number and rates of murder, nonnegligent manslaughter, rape, robbery, and aggravated assault, which comprise the violent crime rate, also came from the FBI’s report. Poverty rates came from the U.S. Census Bureau’s 2016 American Community Survey. Imprisonment rates are for 2015 and represent the number of people in state and federal correctional facilities sentenced to one year or more per 100,000 state residents age 18 and older, and are from the Bureau of Justice Statistics, a division of the U.S. Department of Justice.
Want to Retire Early? Start Here (Sponsor)
Want retirement to come a few years earlier than you’d planned? Or are you ready to retire now, but want an extra set of eyes on your finances?
Now you can speak with up to 3 financial experts in your area for FREE. By simply clicking here you can begin to match with financial professionals who can help you build your plan to retire early. And the best part? The first conversation with them is free.
Click here to match with up to 3 financial pros who would be excited to help you make financial decisions.
Thank you for reading! Have some feedback for us?
Contact the 24/7 Wall St. editorial team.
 24/7 Wall St.
 24/7 Wall St.
 24/7 Wall St.
 24/7 Wall St.


