Special Report
11 School Districts Spending the Most on Students

Published:
Last Updated:

Few municipal services in the United States are as uneven as the public school system. The quality of schools across the country largely depends on local property values, with the best school districts in the wealthiest parts of the nation and the worst districts in the poorest.
In school districts with the most funding, per-pupil expenditure can be dozens of times higher than per-pupil spending in districts with the least funding. Many of the districts that spend the most per student are in Long Island, New York, where revenue from property taxes are high due to high property values, and in Alaska, where high transportation costs significantly increase the cost of running a school district.
To identify the 11 American school districts spending the most per pupil, 24/7 Wall St. reviewed annual per pupil expenditures across the 9,545 U.S. school districts serving at least 250 students in the 2015-16 school year from the U.S. Census Bureau’s Survey of School System Finances.
Click here to see the full list of the 11 school districts spending the most per student.
Click here to see our detailed findings and methodology.
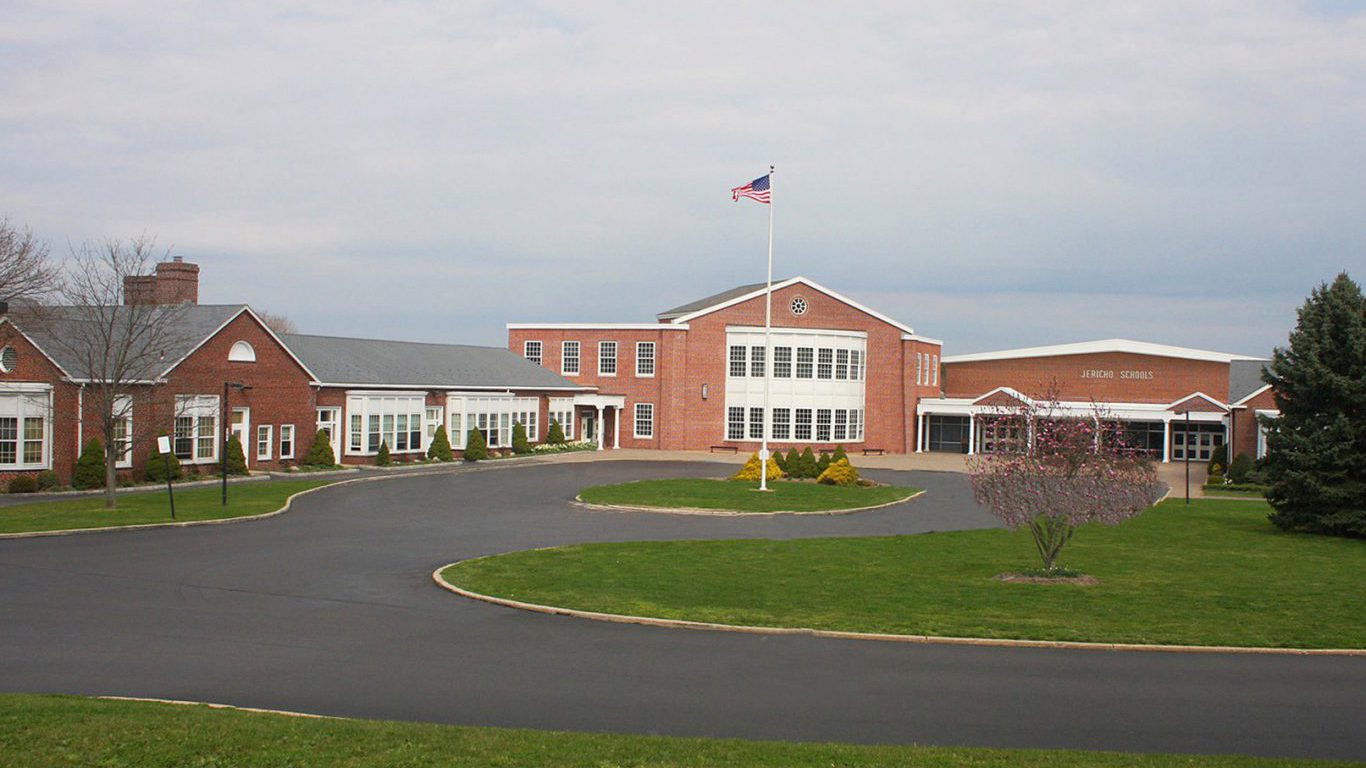
11. Jericho Union Free School District, New York
> District spending per pupil: $35,977
> Avg. state spending per pupil: $21,206
> Median household income: $148,750
> Enrollment: 2,960
High area incomes help boost the Jericho Union Free School District’s total budget. The typical household within the district earns $148,750 a year, far more than the national median of $53,889 and among the most of any district nationwide. Local sources account for 92.2% of total district funding, nearly the largest share of any district in the country. The Jericho Union Free School District spent a total of $35,977 per student in fiscal year 2015, far more than the national figure of $11,392. Higher per-pupil spending may have a positive effect on educational outcomes. Every member of the district’s Class of 2016 graduated, and 95.8% went to a four-year college.
[in-text-ad]
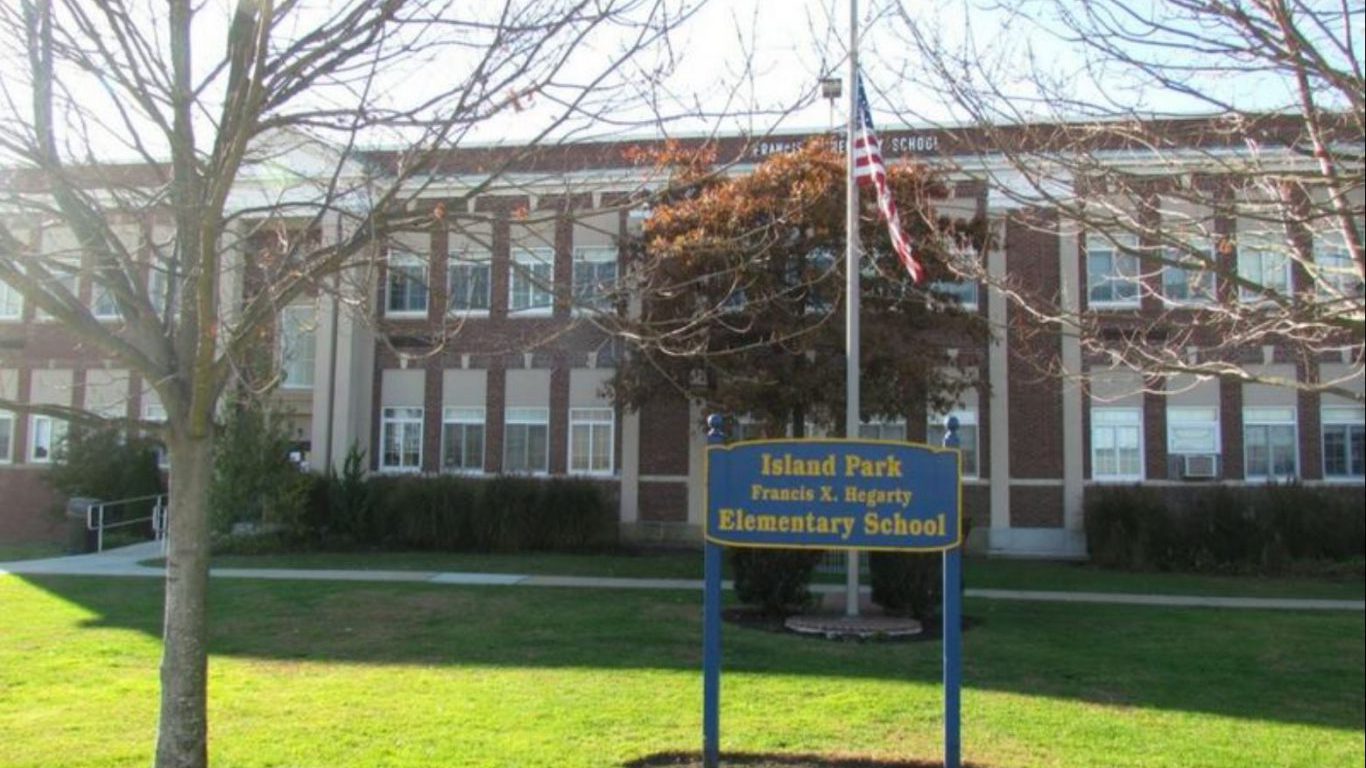
10. Island Park Union Free School District, New York
> District spending per pupil: $36,065
> Avg. state spending per pupil: $21,206
> Median household income: $72,292
> Enrollment: 753
The Island Park Union Free School District is located in Long Island and contains one elementary school, one middle school, and two high schools. The Island Park Union Free School District spends an average of $36,065 per student, more than three times the national figure of $11,392. Like many wealthy school districts in Long Island, local sources account for a bulk of the district’s funding. The typical household in the district earns $72,292 a year, and local funds account for 82.3% of the district’s total revenue, each some of the highest such figures in the country.

9. Southwest Region Schools, Alaska
> District spending per pupil: $36,860
> Avg. state spending per pupil: $20,172
> Median household income: $40,662
> Enrollment: 602
The Southwest Region School District serves the rural Bristol Bay region in Southwest Alaska. The district spends $36,860 per student, far more than the national average spending of $11,392 per student. The high per-pupil spending in the district is largely made possible by substantial state funding. Some 89.0% of the district’s total funding comes from state sources, nearly twice the national average of 47.1%.
Despite the high per-pupil spending, the Southwest Region School District student body has worse educational outcomes than the typical Alaska school district. Less than half of all high school students in the district graduate within four years, compared to 76.1% of students across the state.
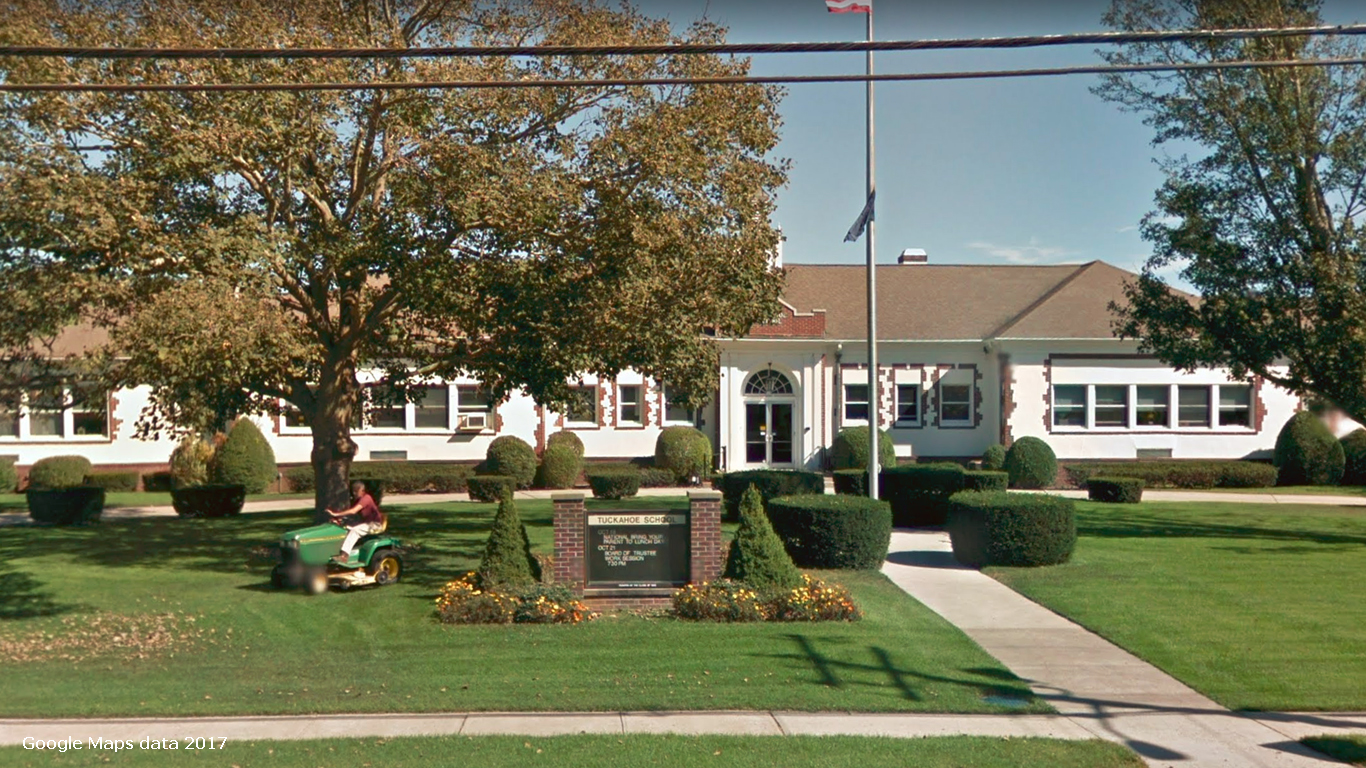
8. Tuckahoe Common School District, New York
> District spending per pupil: $37,479
> Avg. state spending per pupil: $21,206
> Median household income: $89,663
> Enrollment: 349
Located in the South Fork of Long Island, the Tuckahoe Common School District spends $37,479 per pupil annually, one of the highest per-pupil spending figures of any district. The high per-pupil spending is likely made possible by the wealth of the district’s taxpayers. The typical household in the district earns $89,663, approximately $36,000 more than the U.S. median household income. Local sources account for 91.3% of the district’s total funding, one of the largest shares nationwide. Despite the high per-pupil expenditure, the district’s student body has worse educational outcomes than the typical New York school district. Only 19% of third grade and 10% of fourth grade students in the district test proficient in English, compared to 42% of third graders and 41% of fourth graders statewide. Similarly, just 18% of third graders and 13% of fourth graders test proficient in math, less than the respective 44% and 45% state figures.

7. Bering Strait Regional Educational Attendance Area, Alaska
> District spending per pupil: $38,241
> Avg. state spending per pupil: $20,172
> Median household income: $35,897
> Enrollment: 1,846
Bering Strait Regional Education Attendance Area is located on the very western edge of Alaska, close to Russia. Getting children to and from school in such a remote area can be extremely complicated and costly. The district spends $38,241 per pupil annually, which is actually more than the area’s median household income.
With the area’s low income and yet necessary high per-pupil spending, federal and state governments foot much of the district’s bills. The federal government provides 35.8% of the district’s revenue, over four times the national average. The state provides more than 60% of funding, also a higher share than is typical. Local sources provide just 3.6% of the revenue — far below the 44.6% average across U.S. school districts.
[in-text-ad]
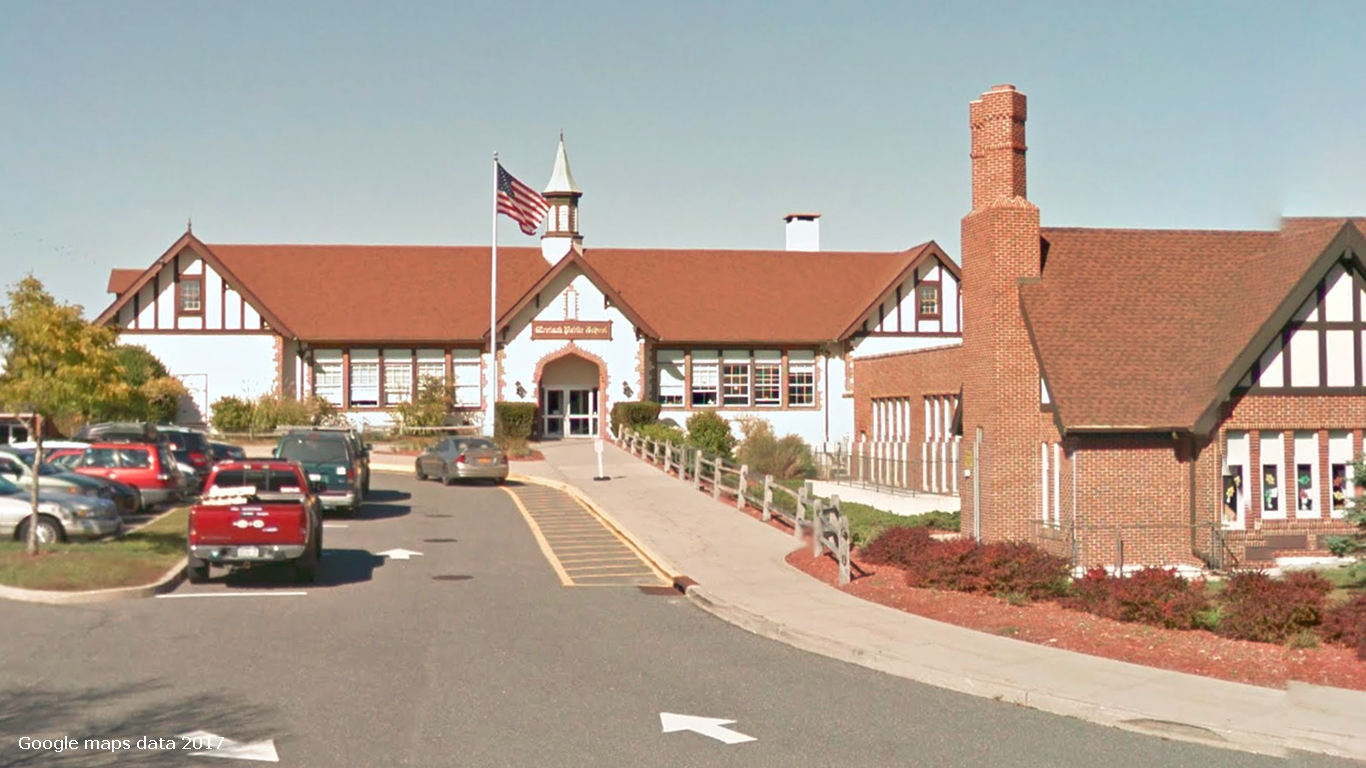
6. Montauk Union Free School District, New York
> District spending per pupil: $38,507
> Avg. state spending per pupil: $21,206
> Median household income: $72,903
> Enrollment: 355
The Montauk Union Free School District sits on the very edge of Long Island in New York, which spends more per student than all other states. The average school district in New York spends $21,206 per pupil annually, almost $10,000 more than the national average per pupil.
The Montauk Union Free School District is nearly twice as well-funded as the average New York school district. Almost all of its money — 93.6% — comes from local sources, more than double the national average. The federal government provides less than 1% of revenue for the district, far short of the 8.3% national average.
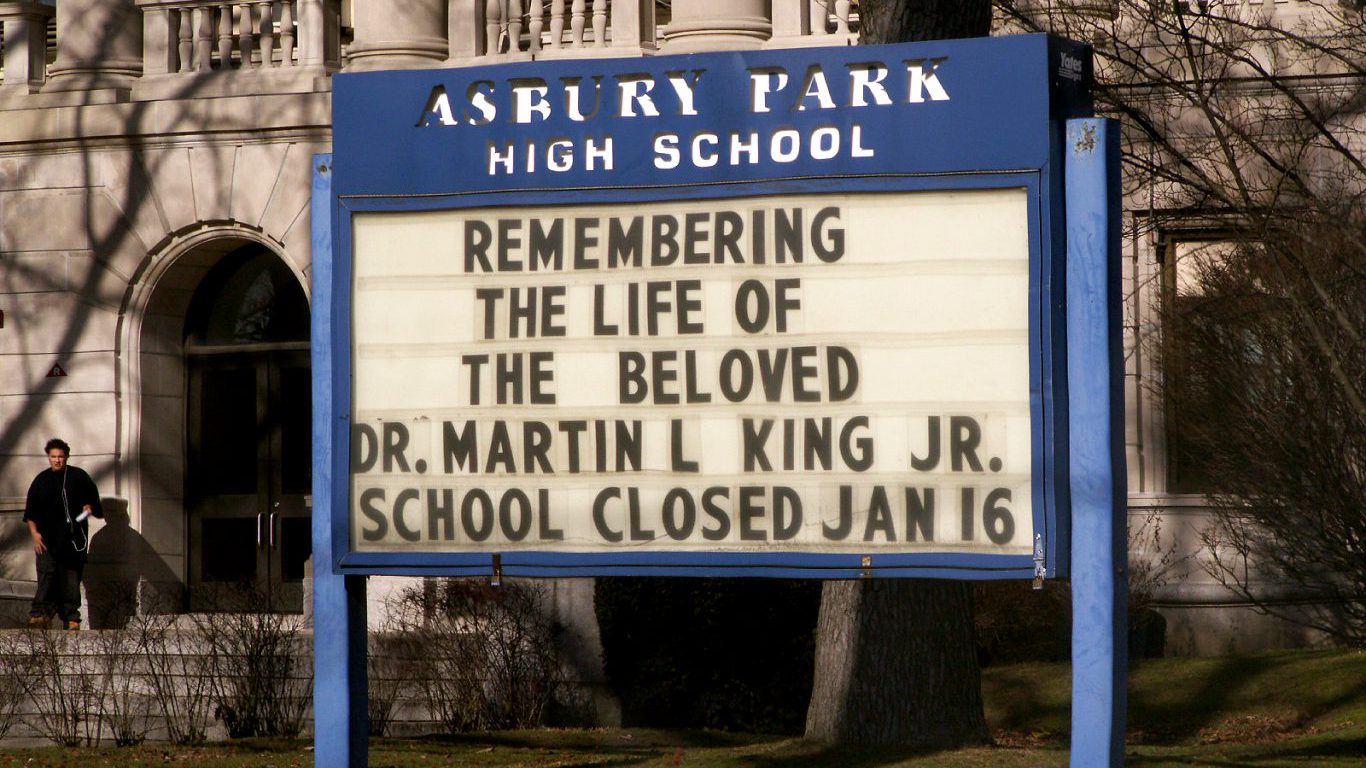
5. Asbury Park School District, New Jersey
> District spending per pupil: $39,922
> Avg. state spending per pupil: $18,235
> Median household income: $32,755
> Enrollment: 1,970
The Asbury Park School District has three elementary schools, a middle school, and a high school. Despite the high level of funding for Asbury Park School District students, most area families are struggling financially. Some 50.8% of children in the district live in poverty, well above the national poverty rate of 21.7% for children under 18.
The median household income in Asbury Park, New Jersey is $32,755 a year, compared with a median income nationwide of $53,889. Despite the low area incomes, the Asbury Park School District spends $39,922 per pupil annually, one of the highest figures in the country. The high per-pupil spending is largely made possible by the results of the 1985 Abbott v. Burke New Jersey Supreme Court case. Following the case and its subsequent hearings, New Jersey was legally required to fund 31 Abbott Districts — districts in poorer neighborhoods — at the level as the state’s wealthiest districts. As an Abbott District, Asbury Park receives 88.4% of its total funding from state sources, one of the largest shares in the country.
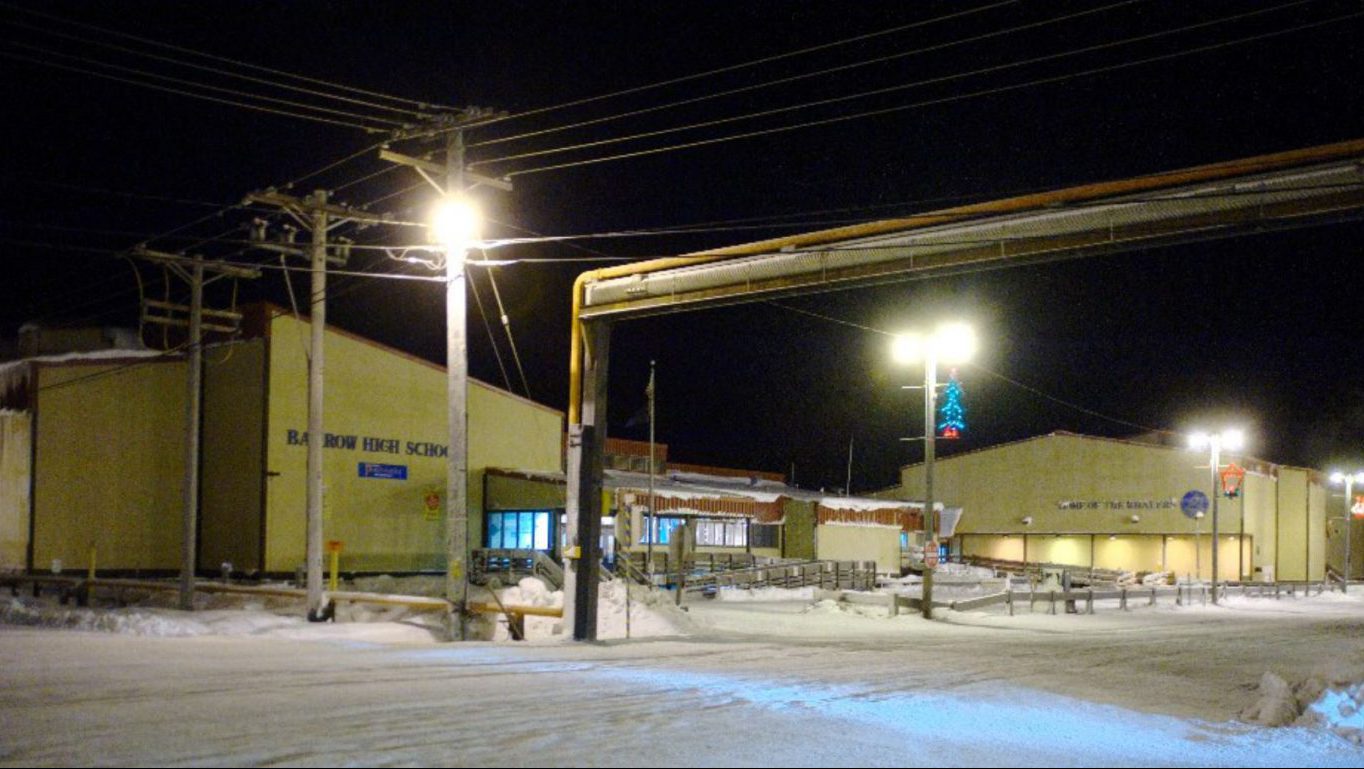
4. North Slope Borough School District, Alaska
> District spending per pupil: $40,833
> Avg. state spending per pupil: $20,172
> Median household income: $72,576
> Enrollment: 2,015
The North Slope Borough School District sits at the northernmost tip of Alaska, tucked away in one of the most remote parts of the country. Since navigating that area can be challenging, the district receives more than $2 million a year from the state’s pupil transportation program for getting students to and from school. This hikes up the district’s per-pupil spending by approximately $1,000 per student. District funding is also bolstered by high area income. The median household income in the district is $72,576 a year, far more than the $53,889 national figure. Local revenue sources provide 46.7% of the district’s funding.
Despite the high per-pupil funding, the district’s educational outcomes are relatively poor compared to the state as a whole. The district’s graduation rate for the 2015-16 school year was 58.4%, well below the statewide graduation rate of 76.1%.

3. Winchester Public Schools, Connecticut
> District spending per pupil: $41,127
> Avg. state spending per pupil: $18,377
> Median household income: $52,757
> Enrollment: 575
Winchester Public Schools spend the third most per pupil of all U.S. school districts at $41,127. That is more than double Connecticut’s average state spending per pupil of $18,377. The district has just two schools with a total enrollment of just 575 students.
Most of the revenue for those two schools, 50.1%, comes from local sources. While local sources account for a larger share of total funding than in a majority of districts, residents of the Winchester Public Schools district are not particularly affluent on average. The median household income for the area is $52,757 a year, which is below the national median income of $53,889.
[in-text-ad]

2. Lake And Peninsula School District, Alaska
> District spending per pupil: $51,215
> Avg. state spending per pupil: $20,172
> Median household income: $50,781
> Enrollment: 335
Though it has just 13 schools, the Lake And Peninsula School District encompasses an area that is about as large as West Virginia. Covering the strip of land extending from Alaska’s tip, there are two schools in the district that are over 300 miles apart. The area is so remote that it is impossible to drive to any of the schools. All schools must be accessed by boat or plane.
The remote location can make getting school supplies and students to and from school a daunting and expensive task. The district spends $51,215 per pupil annually, more than nearly any other school district nationwide.

1. Pocantico Hills Central School District, New York
> District spending per pupil: $60,345
> Avg. state spending per pupil: $21,206
> Median household income: $93,257
> Enrollment: 281
When it comes to student spending, no district even comes close to the Pocantico Hills Central School District in New York. The district spends $60,345 per student each year, over $9,000 more than the district with the next highest per-pupil spending.
There could be many different reasons as to why the district far outpaces all others in spending. Perhaps one large reason is that the district is supported by the wealthy Rockefeller family. In addition to funding provided the Rockefeller family, other area families provide substantial revenue to the district through property taxes. The typical household in the Pocantico Hills Central School District earns $93,257 a year, far more than the $53,889 national median. Some 84.8% of the district’s funding comes from local sources, one of the largest shares in the country.
Detailed Findings & Methodology
Nationwide, local sources account for 45% of total school funding. In wealthier districts, local sources account for a much larger share of school budgets. In the majority of schools spending the most on their students, district taxpayers tend to be relatively wealthy. In 21 of the 25 school districts spending the most per student outside of Alaska — where high transportation costs, typically covered by state or federal funds, increase overall per-pupil spending — the typical household earns more than the national median household income of $53,889 a year.
By far, the largest expense for a public school is the salary of its staff. Nationwide, salaries and benefits account for approximately 80% of public elementary and secondary school expenditure, with 8% going to supplies and 11% to purchased services, such as contracts for food, transportation, and janitorial services.
As a result, one of the largest differences between the school districts with the highest and lowest per-pupil expenditures may be the quality of the teaching staff. In many of the school districts on this list, qualifications of educators — such as the share of teachers with valid teaching certificates, with more than three years of experience, or with masters or doctorate degrees — are greater than the comparable state and U.S. shares.
High per-pupil spending does not necessarily lead to better educational outcomes. Many school districts on this list see their students test proficient in math and English more frequently than the average U.S. school district. However, many school districts with high per-pupil expenditure also test far below national benchmarks.
To identify the 10 American school districts spending the most per pupil, 24/7 Wall St. reviewed annual per-pupil expenditures across the 9,545 U.S. school districts serving at least 250 students from the U.S. Census Bureau’s Survey of School System Finances. School spending figures and all other district-based values are for the fiscal year 2015 and come from the U.S. Census Bureau’s Survey of School System Finances. Graduation rates come from National Center for Education Statistics. Data on median household income comes from the Census Bureau’s American Community Survey and are five-year averages for the period 2011 to 2015.
The thought of burdening your family with a financial disaster is most Americans’ nightmare. However, recent studies show that over 100 million Americans still don’t have proper life insurance in the event they pass away.
Life insurance can bring peace of mind – ensuring your loved ones are safeguarded against unforeseen expenses and debts. With premiums often lower than expected and a variety of plans tailored to different life stages and health conditions, securing a policy is more accessible than ever.
A quick, no-obligation quote can provide valuable insight into what’s available and what might best suit your family’s needs. Life insurance is a simple step you can take today to help secure peace of mind for your loved ones tomorrow.
Click here to learn how to get a quote in just a few minutes.
Thank you for reading! Have some feedback for us?
Contact the 24/7 Wall St. editorial team.