The United States has always been a nation of immigrants. Some 14% of U.S. residents today were born outside of the country, and 93% identify with an ancestry other than American.
On its annual American Community Survey, the U.S. Census Bureau asks Americans to identify their ancestry. Ancestry refers to a person’s lineage or ethnic origin. Ethnic composition varies heavily across the United States and is often a reflection of centuries-old migration patterns. Every state has a unique ethnic community whose history can in many cases be traced back hundreds of years.
To determine the most unusual ancestry in every state, 24/7 Wall St. reviewed data from the ACS on the 121 most commonly reported ancestries. The ancestry with the largest share of respondents in a state relative to the national share — a calculation known as the location quotient — is defined as the most unusual ancestry.
Click here to see the full list of the most unusual ancestry in every state.
Click here to see our detailed findings and methodology.
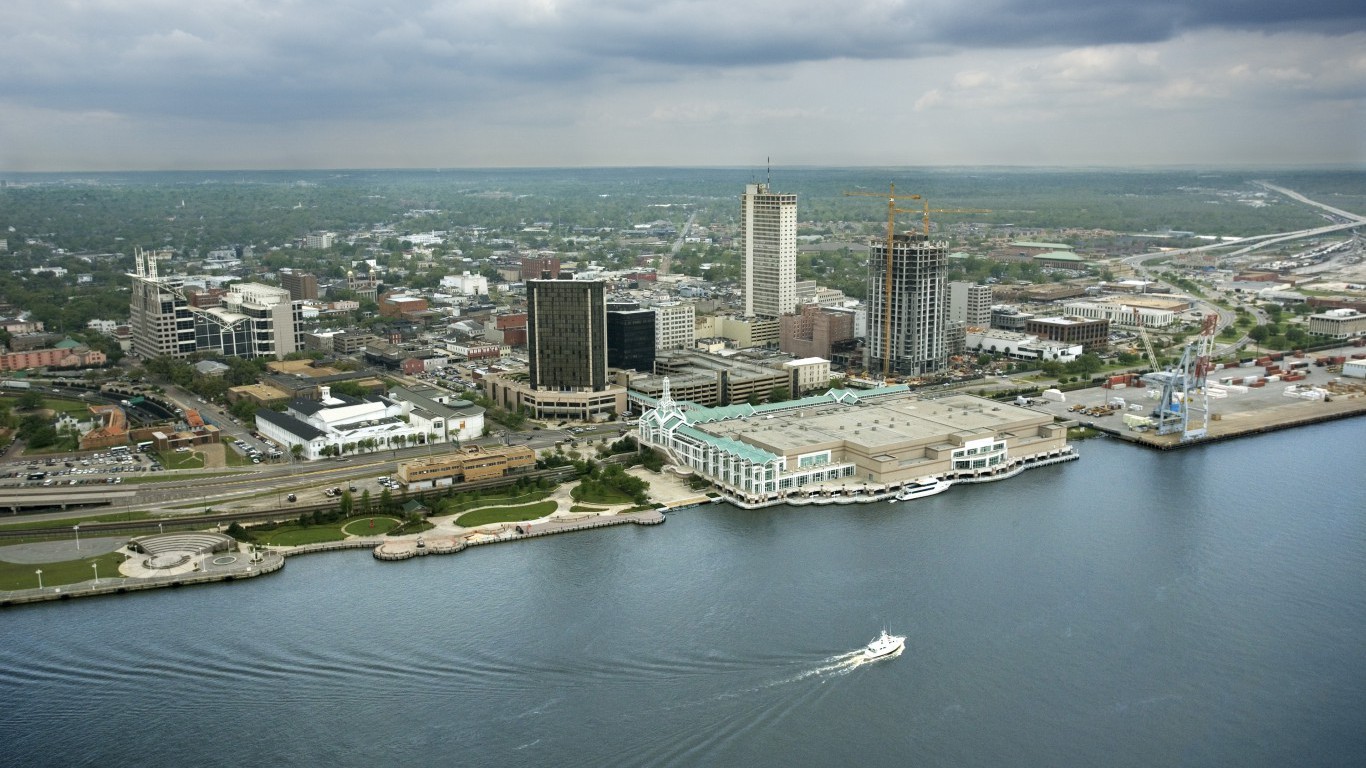
1. Alabama
> Most unique ancestry: American
> Location quotient: 2.2
> Pct. of residents identifying as American: 15.93% (AL), 7.14% (U.S.)
> Share of U.S. American population living in state: 3.39%
In a survey assessing the ancestry or ethnic origin of U.S. residents nationwide, 15.9% of respondents in Alabama identified as American, more than twice the 7.1% national share and more than any other ancestry in the state relative to the respective national share. Many individuals who identify as American are at least fourth-generation Americans, whose grandparents or great-grandparents were born in the United States. Many are also white Americans living in Southern states. Some 65.7% of Alabama residents are white, more than 61.1% of Americans nationwide.
The number of Americans claiming American ancestry rose from 12.4 million in 1990 to 20.5 million in 2005, a 65.7% increase — among the most of any ancestry. However, the number of respondents identifying as Americans in the past 10 years has fallen slightly.
[in-text-ad]

2. Alaska
> Most unique ancestry: Scandinavian
> Location quotient: 3.2
> Pct. of residents identifying as Scandinavian: 0.59% (AK), 0.19% (U.S.)
> Share of U.S. Scandinavian population living in state: 0.74%
Some 0.59% of Alaskans identify as Scandinavian, more than three times the 0.19% national figure and the most of any other ancestry relative to the respective national share. A larger share of Scandinavian Alaskans identify with a more specific ancestral homeland, as 3.7% of residents in the state identify as Norwegian, 2.2% as Swedish, and 0.8% as Danish.
The first major wave of Scandinavian immigration to Alaska was in the early 1800s, when Finland was under Russian rule and a number of Finnish citizens immigrated to Alaska as fur traders under the tutelage of the Russian-American Company. In addition to Alaska, droves of Scandinavians settled in a number of Pacific Northwest cities, such as Seattle and Ballard, Washington, and Astoria, Oregon.
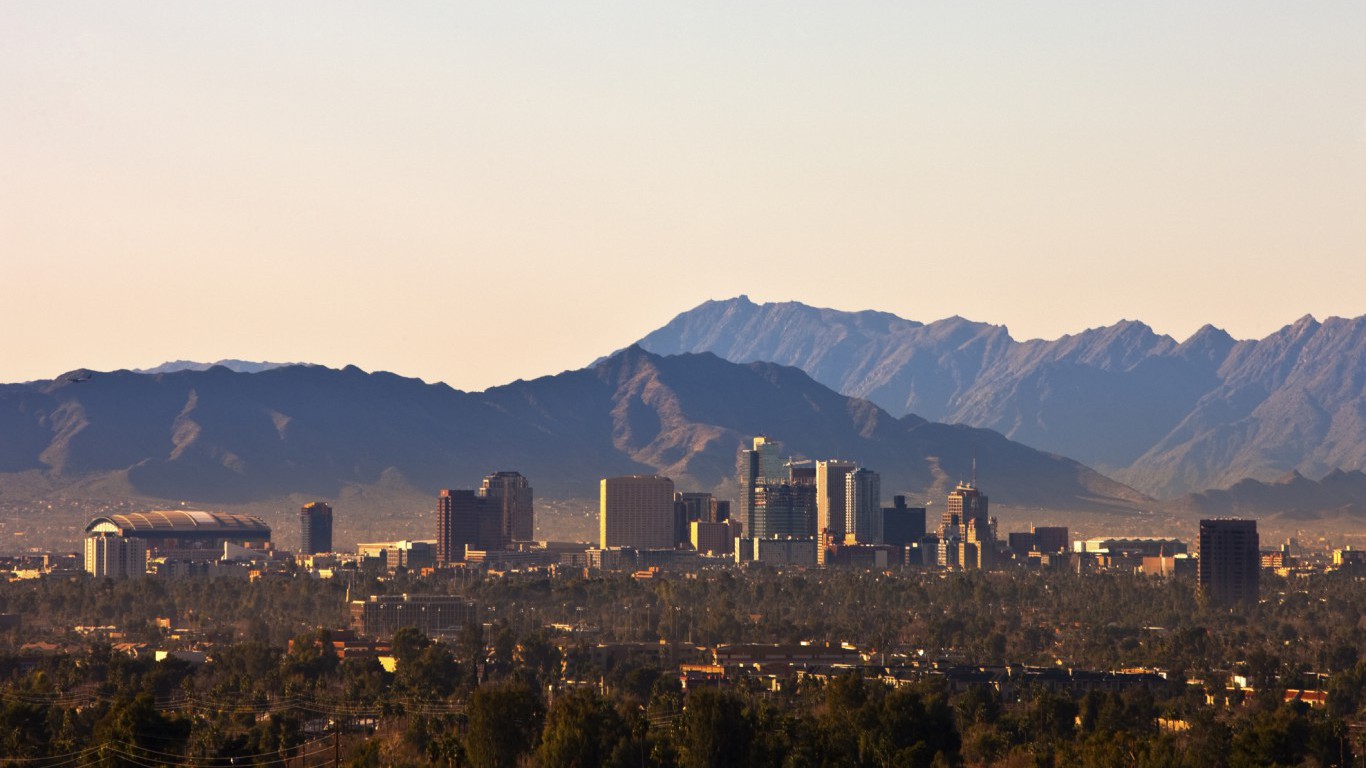
3. Arizona
> Most unique ancestry: Iraqi
> Location quotient: 2.5
> Pct. of residents identifying as Iraqi: 0.10% (AZ), 0.04% (U.S.)
> Share of U.S. Iraqi population living in state: 5.38%
Arizona took in 3,858 refugees in 2015, the fifth most of any state after Florida, Texas, California, or New York. Some 717 of these refugees were from Iraq, the most of any country. Today, 0.1% of Arizona residents identify as Iraqi, more than twice the comparable national share and the highest concentration of any ancestry in the state relative to the U.S. as a whole. Large refugee populations from the Democratic Republic of Congo, Somalia, and Cuba have also resettled in the state in recent years. While Arizona resettles more refugees than nearly any other state, many claim to be subject to racial discrimination, have difficulty finding employment, and struggle to make new lives for themselves in the area.

4. Arkansas
> Most unique ancestry: Dutch West Indian
> Location quotient: 4.9
> Pct. of residents identifying as Dutch West Indian: 0.08% (AR), 0.02% (U.S.)
> Share of U.S. Dutch West Indian population living in state: 4.58%
Dutch West Indian Americans are descendants of the Netherlands Antilles, a former country that consisted of a series of islands in the Caribbean under Dutch rule for approximately four centuries. The islands were conquered by settlers of the Dutch West India Company in the 17th century and were under Dutch rule until October 2010, when the five islands that comprised the Netherlands Antilles — Curacao, Sint Maarten, Bonaire, Saba, and Sint Eustatius — became fully autonomous territories. Approximately 2,300 Arkansas residents today identify as Dutch West Indian, more than any state other than Oklahoma or Texas. The 0.08% share of ACS respondents claiming Dutch West Indian ancestry in Arkansas is nearly five times the 0.02% national share, the highest concentration relative to the nation of any ancestry in the state.
[in-text-ad-2]
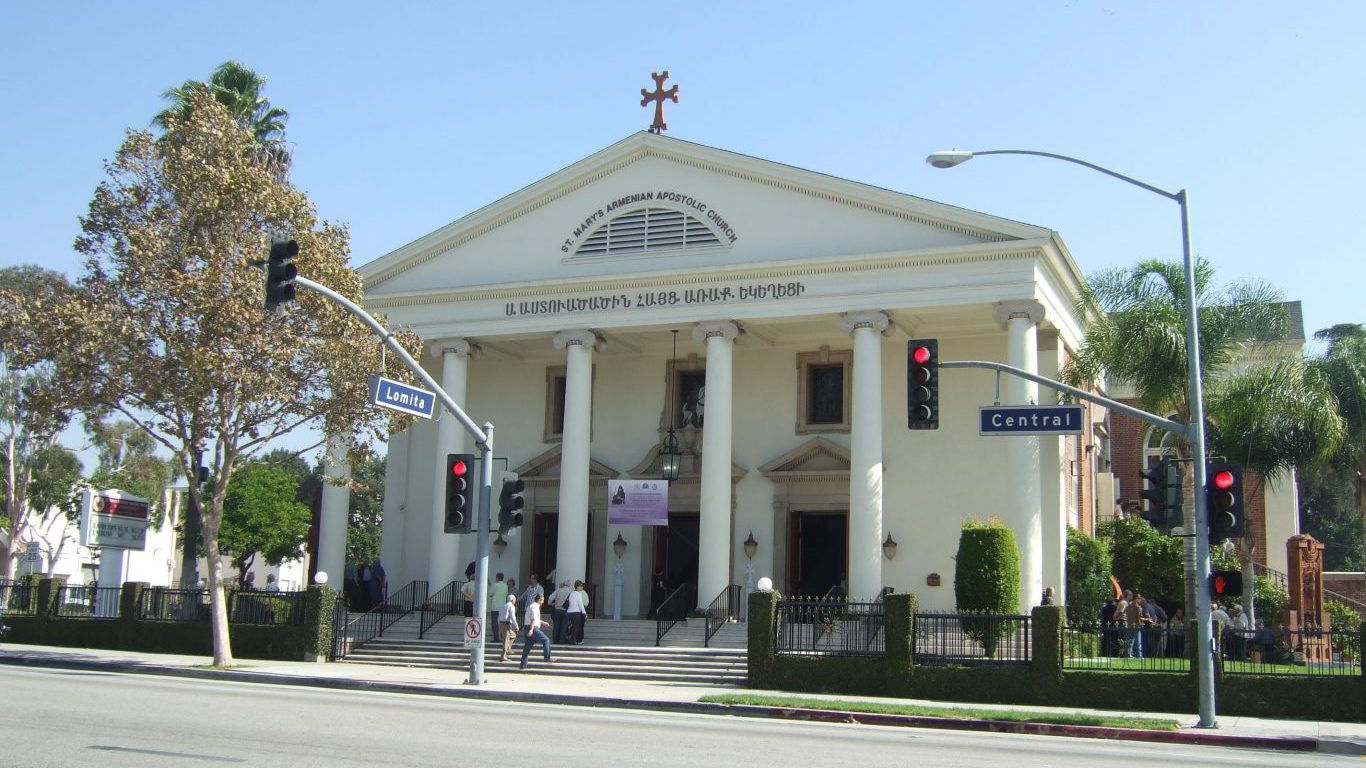
5. California
> Most unique ancestry: Armenian
> Location quotient: 4.6
> Pct. of residents identifying as Armenian: 0.67% (CA), 0.15% (U.S.)
> Share of U.S. Armenian population living in state: 55.39%
The first Armenian settled in California in 1874. The area is notable for its large agricultural output and high degree of ethnic diversity among its farmers. More Armenians migrated to the area in the 1920s, following the 1915 Armenian Genocide. Today, some 259,430 ACS respondents in California identify as Armenian, the most of any state and 55% of the total U.S. Armenian population. California’s large Armenian population was able to help some refugees of the genocide receive reparations. In the early 2000s, the California Legislature passed the Armenian Genocide Insurance Act, which authorized heirs and beneficiaries of victims of the atrocity to recover life insurance claims purchased between 1875 and 1923. In 2004, descendants of Armenian Genocide victims settled a case with New York Life Insurance, which paid $20 million to 2,400 heirs and nine Armenian civic organizations.
6. Colorado
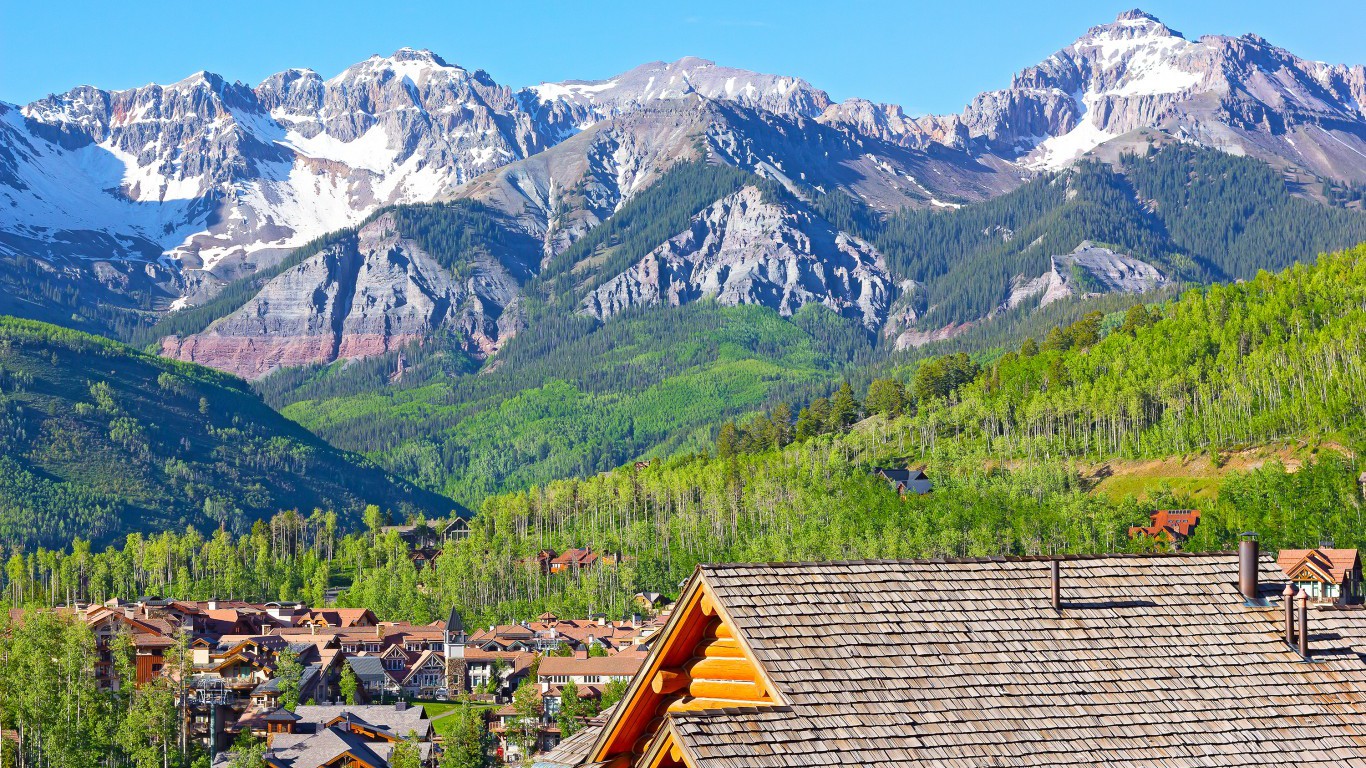
> Most unique ancestry: Basque
> Location quotient: 2.3
> Pct. of residents identifying as Basque: 0.04% (CO), 0.02% (U.S.)
> Share of U.S. Basque population living in state: 3.85%
Some 0.04% of ACS respondents in Colorado identify as Basque, twice the 0.02% national share and more than any other ancestry in the state relative to its respective national share. Basque Americans hail from Basque Country — a region that covers parts of northern Spain and southwestern France. The first major wave of Basque immigrants to the United States occurred during the California gold rush in 1848. Basques from France largely settled in California, Colorado, and central Nevada, while Basques from Spain predominantly settled in northern Nevada, Idaho, and Oregon.
The Spanish and French governments have historically suppressed Basque culture, and 23% of Basques today are in favor of an independent state. The extra effort to preserve Basque culture among descendants of Basque Country may be one reason for the emphasis some Americans place on their Basque ancestry over their Spanish or French heritage.
[in-text-ad]

7. Connecticut
> Most unique ancestry: Albanian
> Location quotient: 5.3
> Pct. of residents identifying as Albanian: 0.32% (CT), 0.06% (U.S.)
> Share of U.S. Albanian population living in state: 5.94%
Some 0.32% of ACS respondents in Connecticut identify as Albanian, more than five times the 0.06% of American who identify as Albanians nationwide and the highest concentration of any ancestry in the state relative to the nation. Other states with large Albanian populations include Massachusetts, Michigan, and New York. The first Albanian immigrated to America in 1884 and settled in Boston. One of the first major waves of Albanian immigrants to America came during World War II, when Albania came under communist control and a sect of Albanians living in Greece were forcibly expelled from the country.
8. Delaware
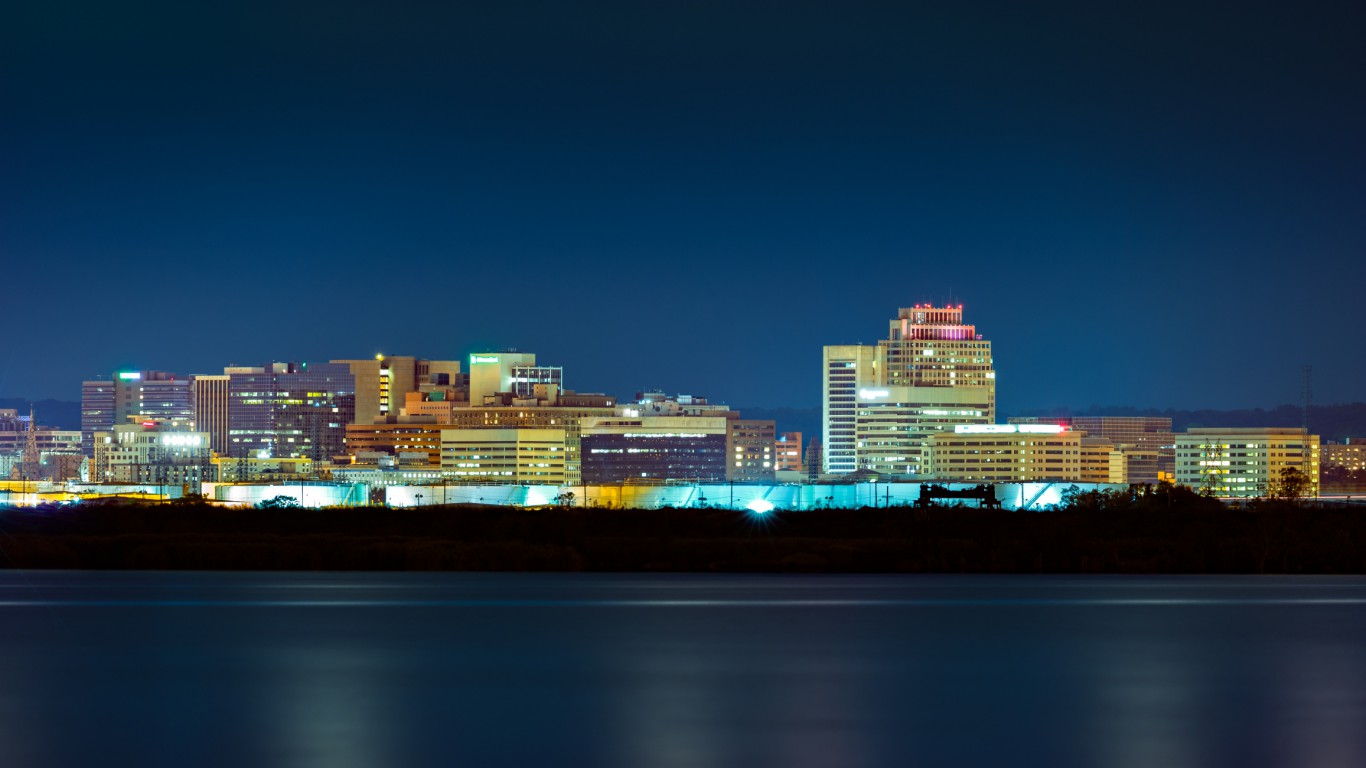
> Most unique ancestry: Pennsylvania German
> Location quotient: 2.8
> Pct. of residents identifying as Pennsylvania German: 0.27% (DE), 0.10% (U.S.)
> Share of U.S. Pennsylvania German population living in state: 0.84%
Named for the state of Pennsylvania and its name sake, William Penn, Pennsylvania Germans comprise 0.27% of Delaware’s population. Americans who claim Pennsylvania German ancestry have likely had family in the United States longer than most Americans. Pennsylvania Germans are the descendants of a group of southern German immigrants who settled in Pennsylvania in the 17th and 18th centuries.
Pennsylvania Germans are also commonly referred to as the Pennsylvania Dutch. The moniker is translation of the German word “Deutsch,” which means “German,” and is often mistakenly interpreted as being in relation to the Netherlands.
9. Florida
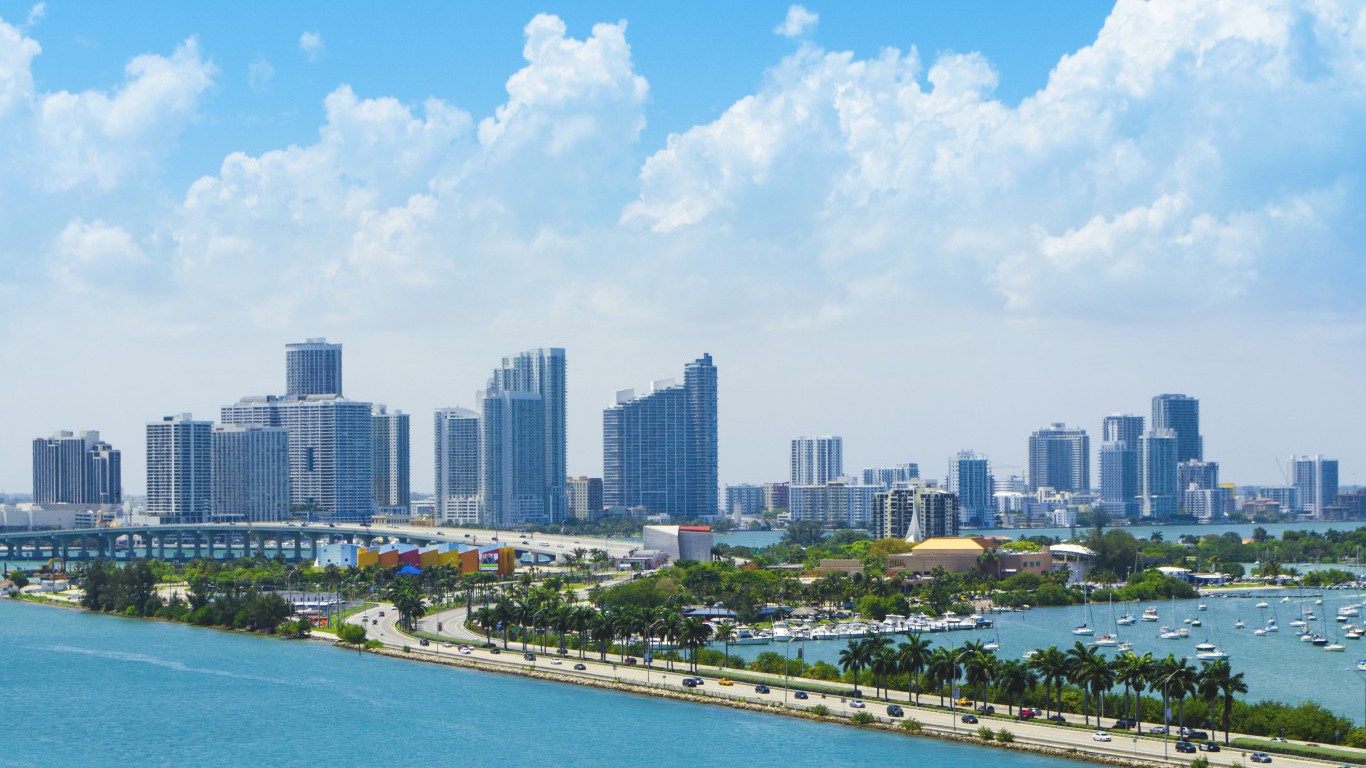
> Most unique ancestry: Bahamian
> Location quotient: 10.0
> Pct. of residents identifying as Bahamian: 0.16% (FL), 0.02% (U.S.)
> Share of U.S. Bahamian population living in state: 62.69%
Some 31,300 ACS respondents in Florida identify as Bahamian, approximately 63% of the total U.S. Bahamian population. Bahamians comprise 0.16% of the Florida population, 10 times the 0.02% national share and the most of any ancestry in Florida relative to the U.S. as a whole.
Proximity plays a large part in the decision of where to relocate, and Florida’s east coast is only a 50 mile boat ride from the western islands of the Bahamas. Bahamians began visiting the Florida Keys in large groups in the early 19th century to salvage cargo from downed ships in a process known as wrecking. More Bahamians settled in Florida as economic opportunities for immigrants expanded, and today the cities with the largest shares of Bahamian residents in the state include Brownsville, Ives Estates, and West Little River.
[in-text-ad-2]

10. Georgia
> Most unique ancestry: Kenyan
> Location quotient: 2.3
> Pct. of residents identifying as Kenyan: 0.05% (GA), 0.02% (U.S.)
> Share of U.S. Kenyan population living in state: 7.44%
Some 4,574 people in Georgia identify as Kenyan — about 7.4% of the total U.S. Kenyan population. Most Americans identifying as Kenyans are relatively new to the United States. Tens of thousands of Kenyans immigrated in the 1980s and 90s, breaking with a decades-old trend of Kenyans obtaining an education abroad and returning to Kenya to begin a career. A lagging economy, corruption, and political violence in the final decades of the 20th century drove many Kenyans away from their home country to Western Europe, Australia, Canada, and the United States. In 2008, Americans voted Barack Obama into the White House, making him the first Kenyan American president in U.S. history.

11. Hawaii
> Most unique ancestry: Portuguese
> Location quotient: 8.2
> Pct. of residents identifying as Portuguese: 3.55% (HI), 0.43% (U.S.)
> Share of U.S. Portuguese population living in state: 3.65%
The Portuguese began to immigrate to Hawaii in the late 19th century, when sugarcane plantations offered economic opportunities to skilled laborers from the Madeira and Azores Islands of Portugal. According to the Hawaiian Almanac and Annual, the number of Portuguese settlers in Hawaii rose from 395 in 1872 to 12,140 in 1878. Today, some 50,142 Hawaiians identify as Portuguese, 3.7% of the 1.4 million Americans who claim the ancestry nationwide. Portuguese Hawaiians make up 3.55% of the state’s population, more than eight times the 0.43% of Americans who identify as Portuguese nationwide.
[in-text-ad]
12. Idaho
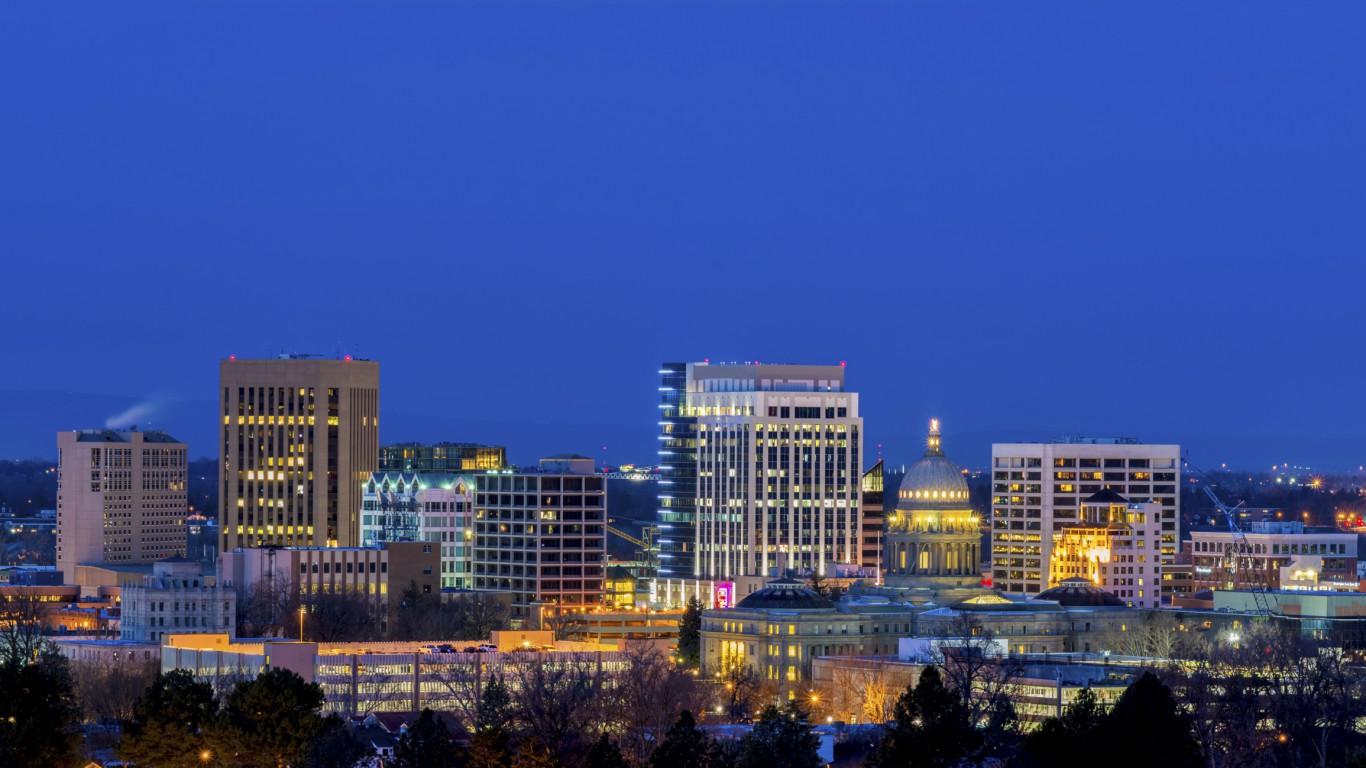
> Most unique ancestry: Basque
> Location quotient: 27.7
> Pct. of residents identifying as Basque: 0.50% (ID), 0.02% (U.S.)
> Share of U.S. Basque population living in state: 14.23%
Some 8,200 Americans in Idaho identify as Basque — or 0.5% of the state’s population — the highest Basque concentration of any state. Americans with Basque heritage trace their roots to a region along the Spanish and French border. Early Basque immigrants largely came to the United States through South America during the California gold rush. Today, Americans of Basque descent are heavily concentrated Western states like California, Nevada, and Oregon. Cities in Idaho with high concentrations of people who identify as Basque include Shoshone, Cascade, and Rupert.
13. Illinois
> Most unique ancestry: Assyrian/Chaldean/Syriac
> Location quotient: 3.8
> Pct. of residents identifying as Assyrian/Chaldean/Syriac: 0.13% (IL), 0.03% (U.S.)
> Share of U.S. Assyrian/Chaldean/Syriac population living in state: 15.16%
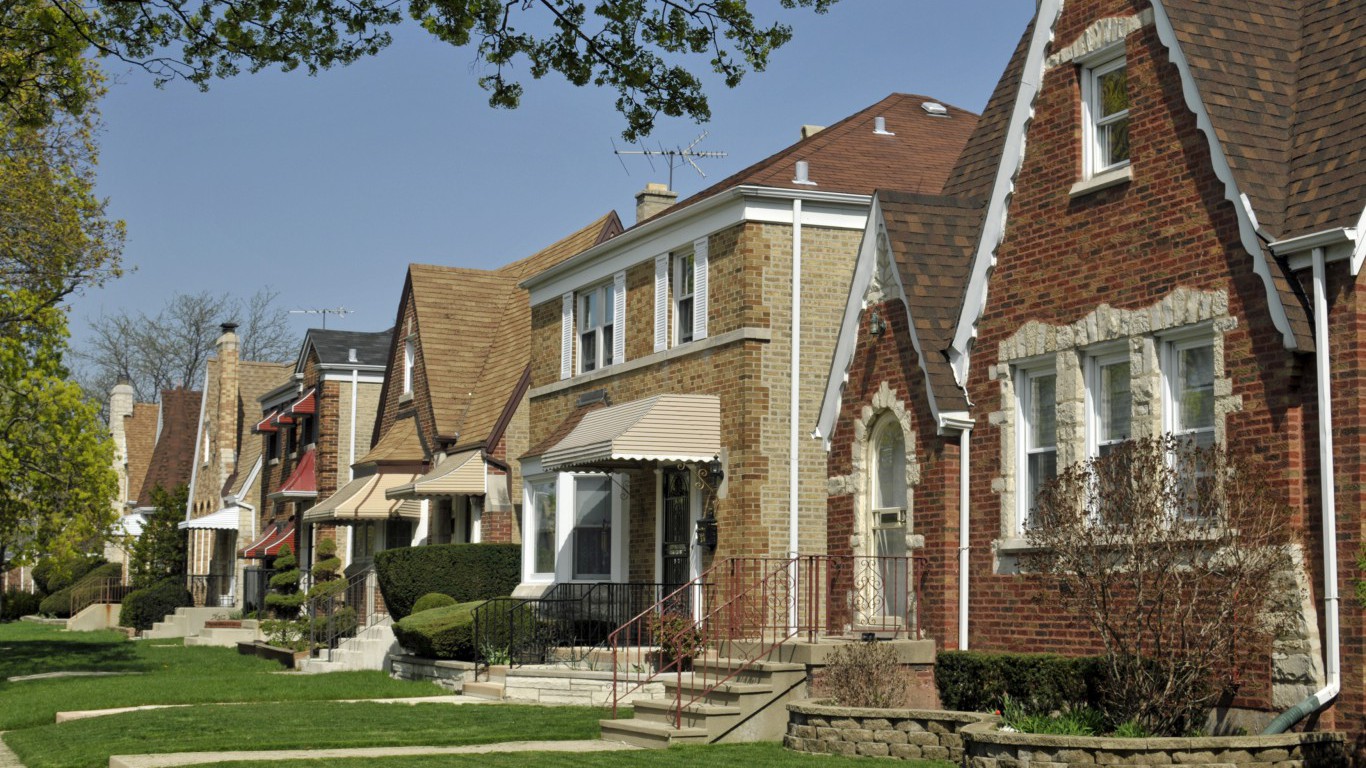
The Assyrian, Chaldean, and Syriac people are descendants of Assyria, an ancient Mesopotamian kingdom that encompassed modern day northern Iraq, southeastern Turkey, northwestern Iran, and northeastern Syria. The first large wave of Assyrian immigration to the United States occurred in the early 20th century, as Assyrians settled in Midwestern cities such
as Detroit and Chicago. A more recent wave of immigration has occurred over the past two decades, as political turmoil and violent conflict in the Middle East forced large groups of Iraqis from the region. There are currently 16,326 residents of Assyrian descent in Illinois, or 15.1% of the U.S. Assyrian population. Assyrians comprise 0.13% of the Illinois population, nearly four times the 0.03% national share.
14. Indiana
> Most unique ancestry: Macedonian
> Location quotient: 4.7
> Pct. of residents identifying as Macedonian: 0.08% (IN), 0.02% (U.S.)
> Share of U.S. Macedonian population living in state: 9.75%
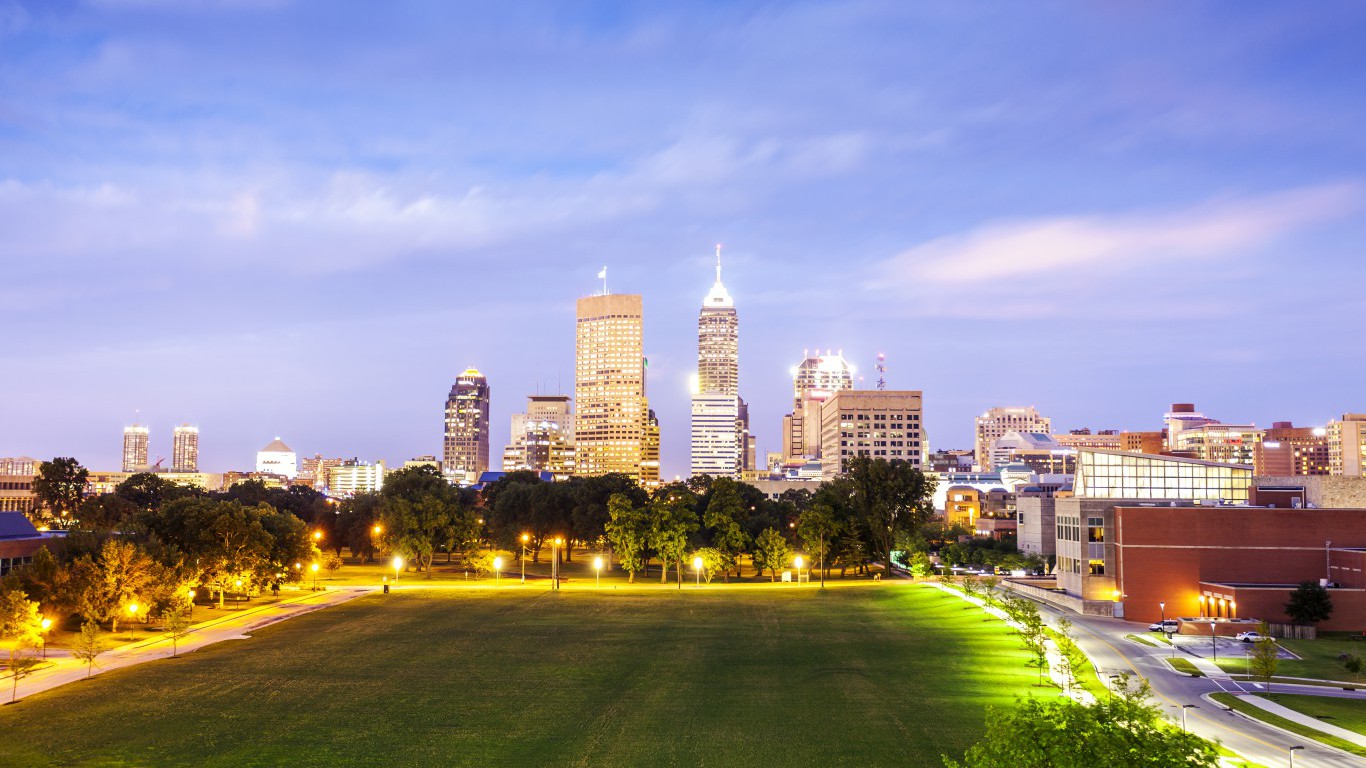
Macedonian Americans are descendants of an ethnic group originating from the Balkan Peninsula. Currently, some 57,300 Americans claim Macedonian heritage — and about 1 in every 10 of them live in Indiana. The largest waves of Macedonian immigration to the United States took place in the early 20th century, before the outbreak of World War I and again in the 1990s. Poor economic conditions in the Balkans and economic opportunity in the United States largely explain the mass migration.
[in-text-ad-2]
15. Iowa
> Most unique ancestry: Luxemburger
> Location quotient: 12.1
> Pct. of residents identifying as Luxemburger: 0.15% (IA), 0.01% (U.S.)
> Share of U.S. Luxemburger population living in state: 11.77%
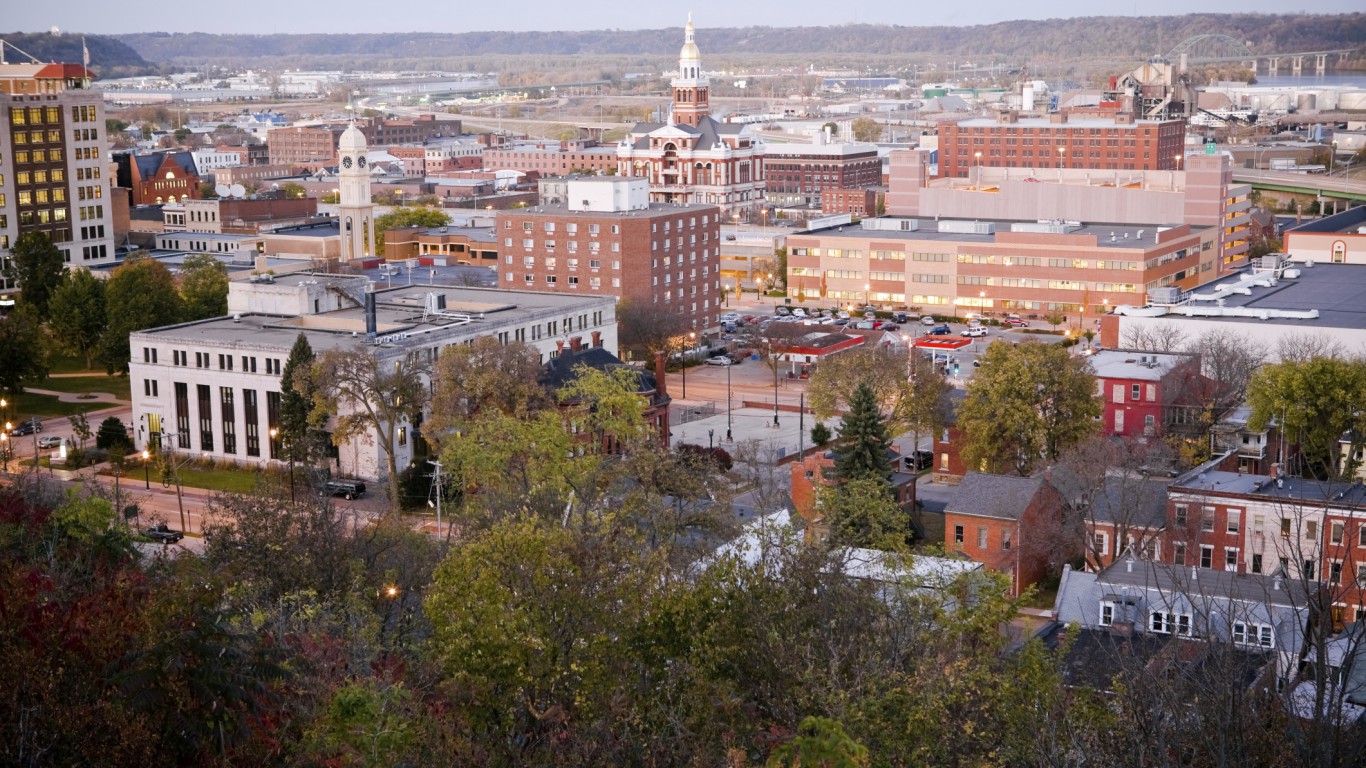
Though Luxemburgers can trace their ethnicity’s presence in the United States as far back as 1630, the first major wave of immigrants from Luxemburg came in the 1830s and 40s, after many faced difficulty attempting to settle in South America. Drawn by economic opportunity — inexpensive Midwestern farmland in particular — immigration from the landlocked Western European country to the United States continued through the later half of the 19th century. The looming threat of fascism and ethnic cleansing in Europe drove several hundred Jewish Luxembourgers to the United States in the early 20th century. Currently, about 1 in every 10 Americans claiming to be of Luxemburger descent live in Iowa.
16. Kansas
> Most unique ancestry: Kenyan
> Location quotient: 3.8
> Pct. of residents identifying as Kenyan: 0.07% (KS), 0.02% (U.S.)
> Share of U.S. Kenyan population living in state: 3.50%
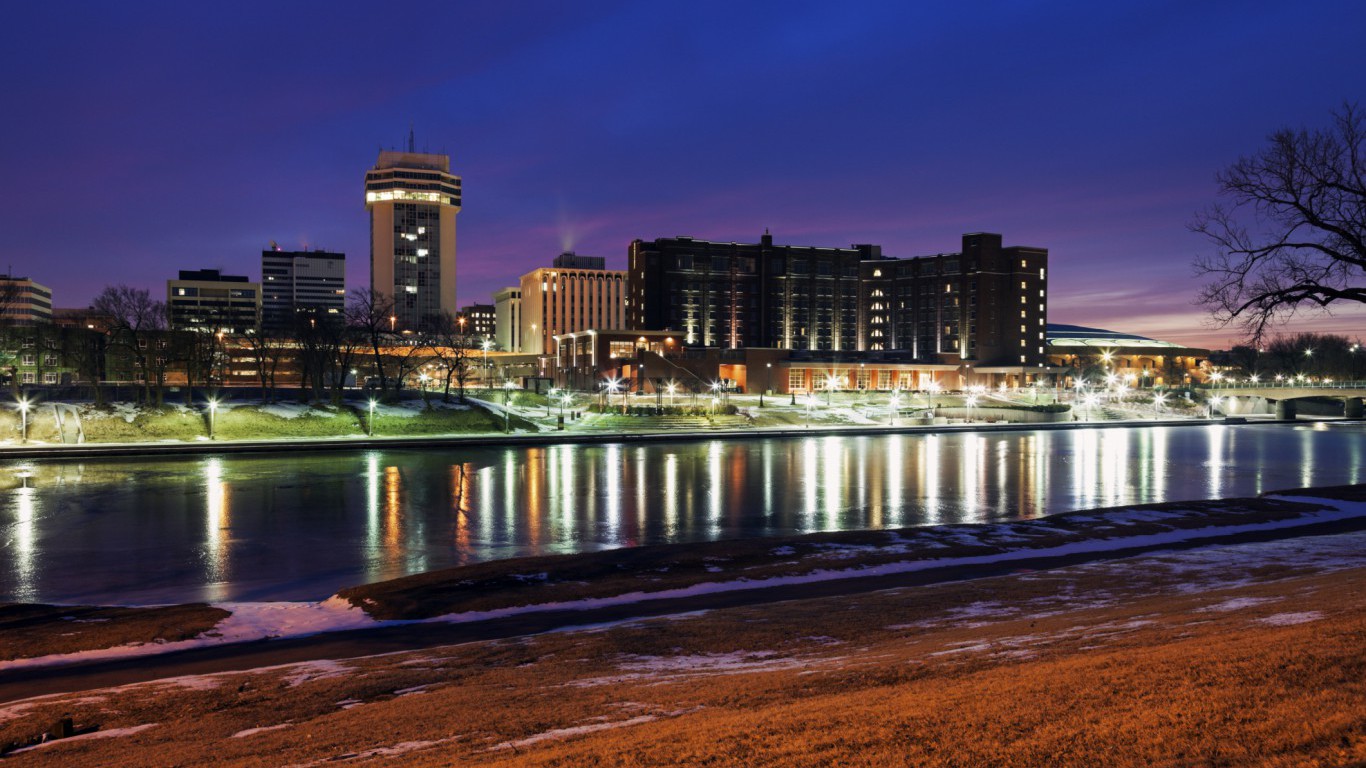
The massive wave of immigration from Kenya, like from many African countries, was the result of famine and war. While from the 1950s to the 1970s Kenyans emigrated to the United States for educational opportunities, Kenyans began to flee their country in the 1980s and 1990s due to economic decline, political strife, and violent conflict.
According to the Migration Policy Institute, some 75% of Kenyans in the United States are first generation Americans. Kansas is home to 2,150 Kenyan Americans among the most of any state. Kenyans comprise 0.07% of the Kansas population, nearly four times the 0.02% U.S. figure, and the most of any ancestry relative to the respective national share.
[in-text-ad]
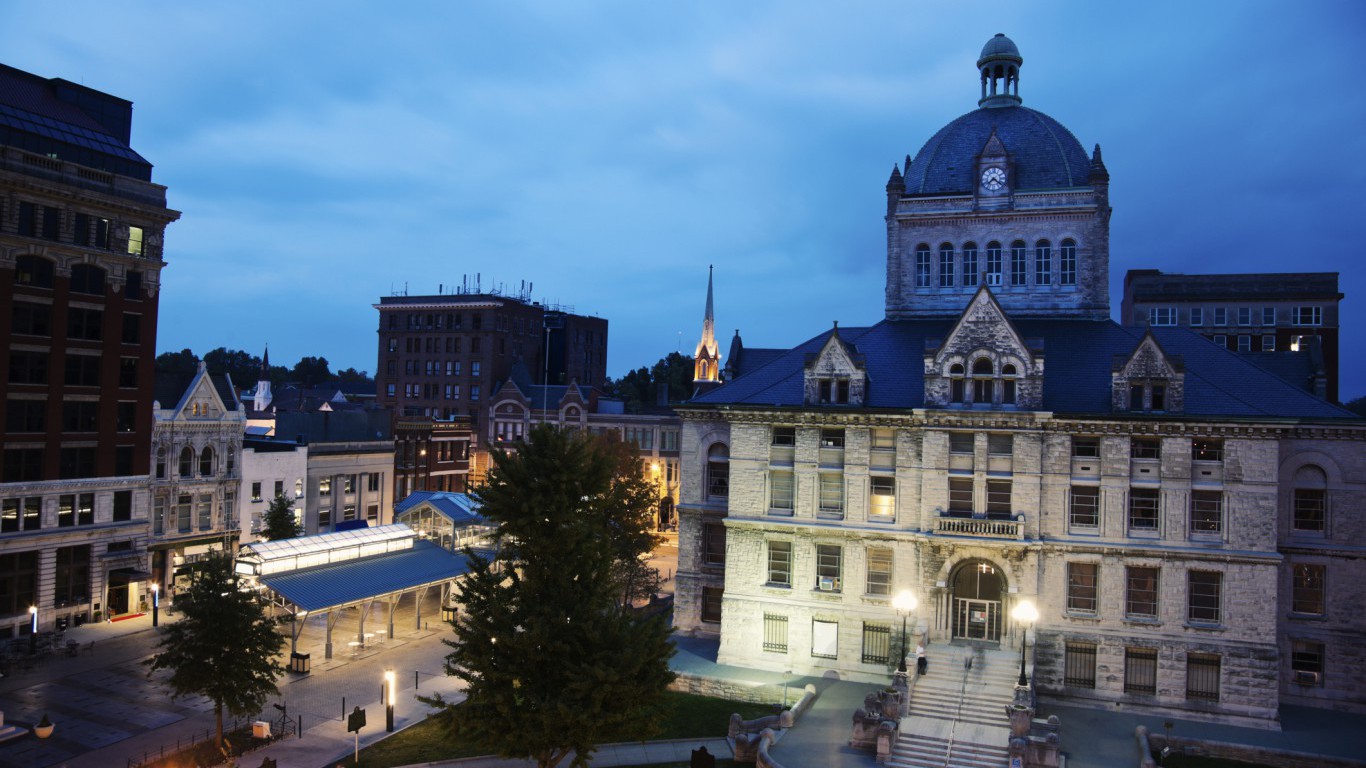
17. Kentucky
> Most unique ancestry: American
> Location quotient: 2.8
> Pct. of residents identifying as American: 19.89% (KY), 7.14% (U.S.)
> Share of U.S. American population living in state: 3.86%
Some 19.9% of Kentucky residents identify as American, the largest share of any state and nearly three times the 7.1% of Americans nationwide who do — the highest concentration of any ancestry in Kentucky relative to the U.S. as a whole. Individuals who claim American ancestry are often fourth-generation Americans whose grandparents or great-grandparents were born here. Many are also white Americans who live in the South. An estimated 84.9% of the Kentucky population is white, far more than the comparable 61.1% share of Americans nationwide and among the most of any state.
From 1990 to 2005, the number of Americans identifying as American rose by 65.7% from 12.4 million to 20.5 million, among the most of any ancestry. In the past 10 years, however, the number has fallen slightly.
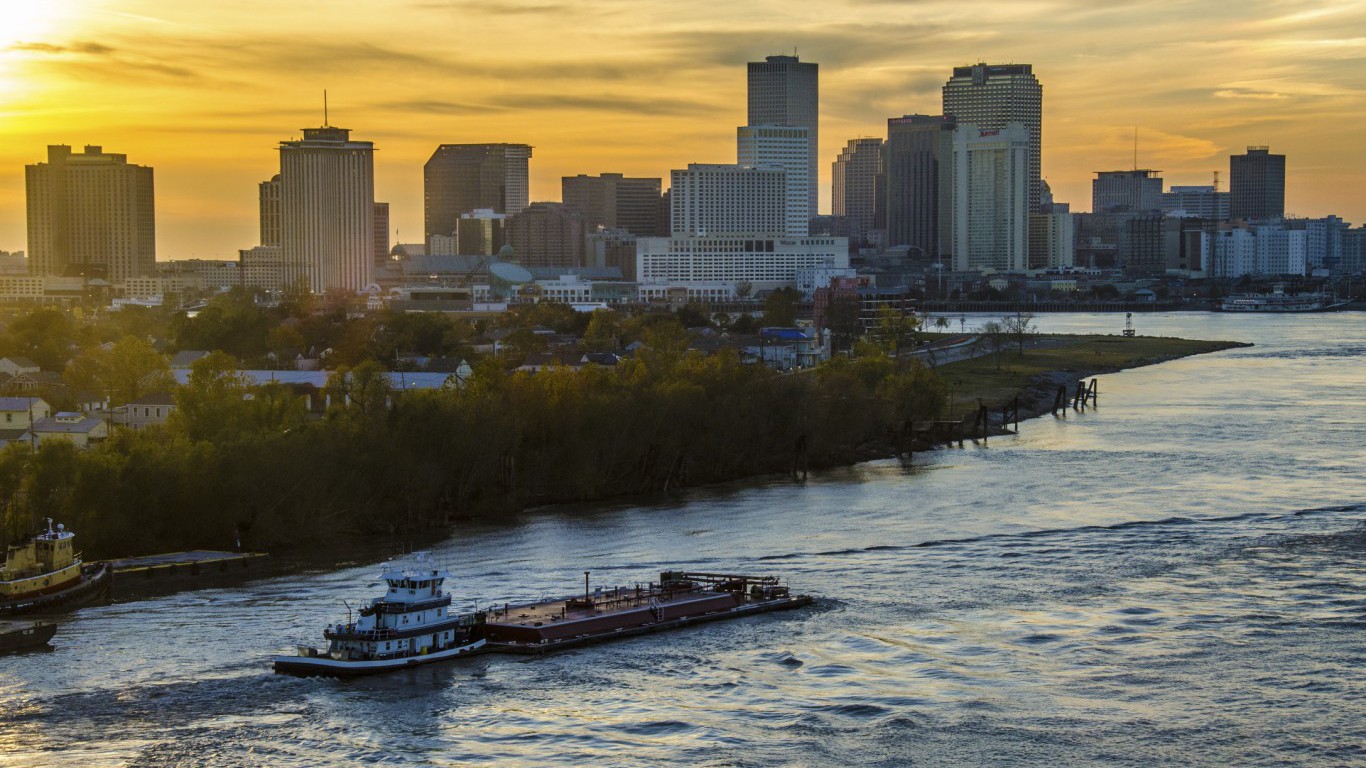
18. Louisiana
> Most unique ancestry: Cajun
> Location quotient: 33.7
> Pct. of residents identifying as Cajun: 1.20% (LA), 0.04% (U.S.)
> Share of U.S. Cajun population living in state: 49.08%
The roots of most Cajun people in Louisiana trace back nearly half a millenium to the Acadians — people of French heritage who settled along Canada’s eastern coast. Historically neutral in French and English conflicts in the New World, the Acadians were driven from their home when the British demanded their loyalty in 1754. Acadians who refused to pledge loyalty to the Crown were killed or arrested, but many escaped. By 1784, thousands of Acadians were estimated to have settled in Louisiana, then a Spanish colony. About half of all Americans who claim Cajun heritage live in Louisiana.
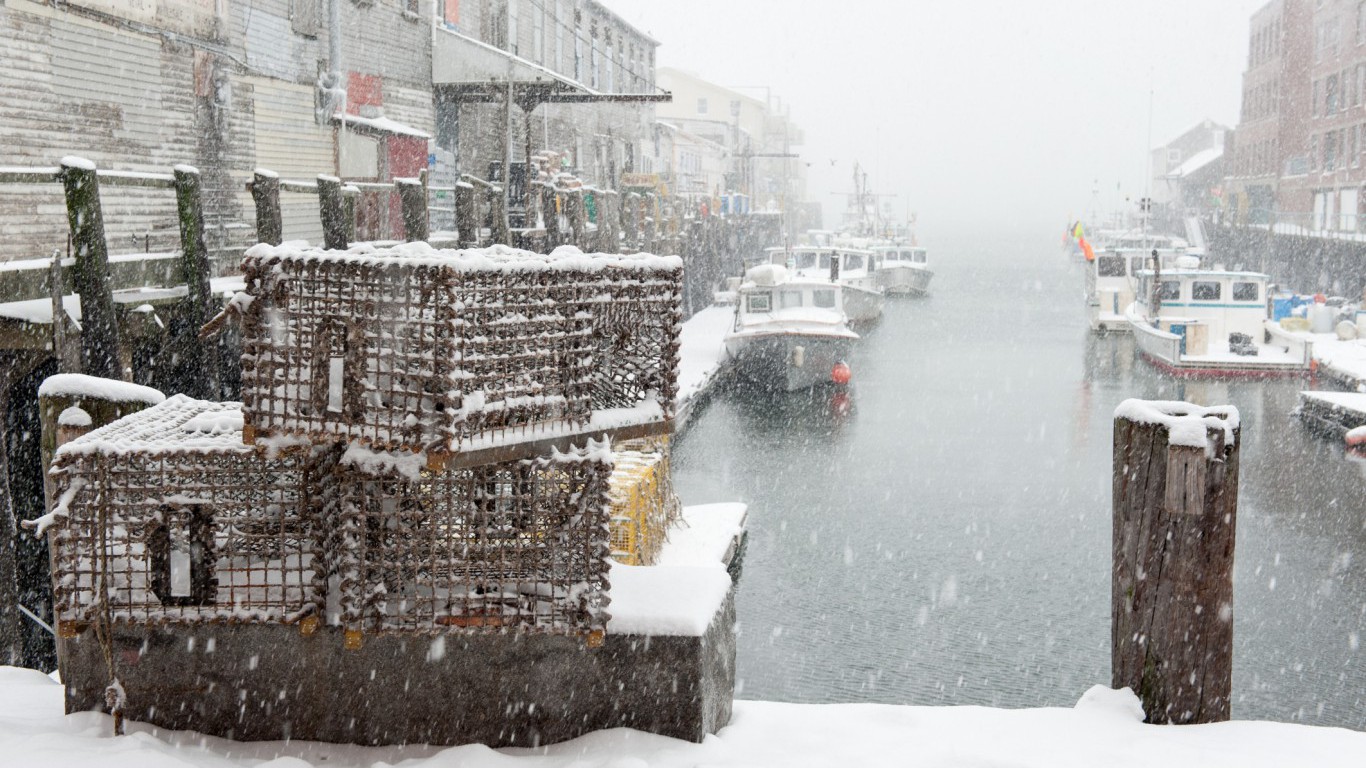
19. Maine
> Most unique ancestry: French Canadian
> Location quotient: 12.0
> Pct. of residents identifying as French Canadian: 7.77% (ME), 0.65% (U.S.)
> Share of U.S. French Canadian population living in state: 5.02%
French Canadians are an ethnic group who descend from French colonists who settled in eastern Canada around the 17th century. French Canadians began to immigrate to New England in large numbers for textile and logging jobs in the 19th century, and today the largest shares of U.S. residents claiming the ancestry are in New Hampshire, Vermont, and Maine.
Some 7.8% of Maine residents identify as French Canadian, 12 times the 0.7% share Americans nationwide who claim the ancestry. Due to their proximity to their ancestral homeland — Maine and Quebec share a border — French Canadian Americans may have been able to preserve francophone culture in America to a greater degree than other ethnicities. Some 3.1% of Maine residents today speak French, the most of any language other than English and the largest share of French speakers in the country.
[in-text-ad-2]
20. Maryland
> Most unique ancestry: Cameroonian
> Location quotient: 13.0
> Pct. of residents identifying as Cameroonian: 0.13% (MD), 0.01% (U.S.)
> Share of U.S. Cameroonian population living in state: 24.28%
While the first large number of Cameroonian immigrants came to America seeking educational opportunities in the 1960s, the largest wave of Cameroonian immigration was during the 1990s, as much of sub-Saharan Africa became steeped in political turmoil. In 2015, 134 Cameroonian refugees settled in Maryland, more than all other states combined. Some 7,457 ACS respondents in Maryland claim Cameroonian ancestry, the most of any state and 24.3% of the U.S. Cameroonian population.
Some Americans claiming Cameroonian ancestry may have recently discovered their ethnic origins. Recent DNA analysis by various genealogy companies has revealed that many African Americans are descended from slaves from Cameroon. Some 29.3% of Maryland residents are African American, the fifth largest share of any state.
21. Massachusetts
> Most unique ancestry: Cabo Verdean
> Location quotient: 28.6
> Pct. of residents identifying as Cabo Verdean: 0.95% (MA), 0.03% (U.S.)
> Share of U.S. Cabo Verdean population living in state: 60.52%
Some 64,000 people in Massachusetts are from — or are descendants of people from — the African island nation of Cape Verde. Settled by the Portuguese in the late 15th century, many Cabo Verde residents are of mixed European and West African heritage. Droughts and famines on the island drove Cabo Verdeans to the Americas by the hundreds in the late 19th and early 20th centuries.
Cabo Verdean people first arrived to the state by finding employment on Massachusetts whaling ships that stopped at the island. Leading up to WWI, Cabo Verdeans continued to settle in Massachusetts, many finding work in cranberry bogs in Cape Cod. Though many people of Cabo Verdean descent moved to the Midwest during the Industrial Revolution, more than half the total number of Americans who claim Cabo Verdean heritage live in Massachusetts.
[in-text-ad]

22. Michigan
> Most unique ancestry: Assyrian/Chaldean/Syriac
> Location quotient: 12.6
> Pct. of residents identifying as Assyrian/Chaldean/Syriac: 0.43% (MI), 0.03% (U.S.)
> Share of U.S. Assyrian/Chaldean/Syriac population living in state: 39.26%
The first large wave of Assyrian immigration to Michigan in the early 20th century, as Assyrians left the Middle East and found employment in Detroit’s growing automobile industry. More Assyrians followed their friends and family to Michigan in the 1970s as political turmoil in the Middle East forced large swaths of the population out of the region. The 1970s also created numerous economic opportunities for immigrants in Michigan, as wealthy white residents left downtown Detroit in the aftermath of the automobile industry’s decline and the 1967 riots. Residents of Assyrian descent took over the area’s grocery industry, and today they own an estimated 90% of the region’s food stores. Roughly 2 in 5 Assyrian, Chaldean, and Syriac Americans live in Michigan today.

23. Minnesota
> Most unique ancestry: Somali
> Location quotient: 18.7
> Pct. of residents identifying as Somali: 0.76% (MN), 0.04% (U.S.)
> Share of U.S. Somali population living in state: 32.00%
A devastating famine swept Somalia between 2010 and 2012. Over 250,000 lives were lost as a result, and thousands more were displaced. Many Somali refugees found new homes in Minnesota — adding to the population that had come throughout the 20th century as sailors, students, and war refugees. About 1,000 Somali refugees settled in Minnesota in 2015, and nearly a third of the 129,000 Somali Americans in the United States live in Minnesota.
Minnesota is an attractive part of the country for many people of Somali descent because of the availability of jobs and the presence of NGOs and nonprofits related to resettling refugees.
24. Mississippi
> Most unique ancestry: Cajun
> Location quotient: 2.2
> Pct. of residents identifying as Cajun: 0.08% (MS), 0.04% (U.S.)
> Share of U.S. Cajun population living in state: 2.10%
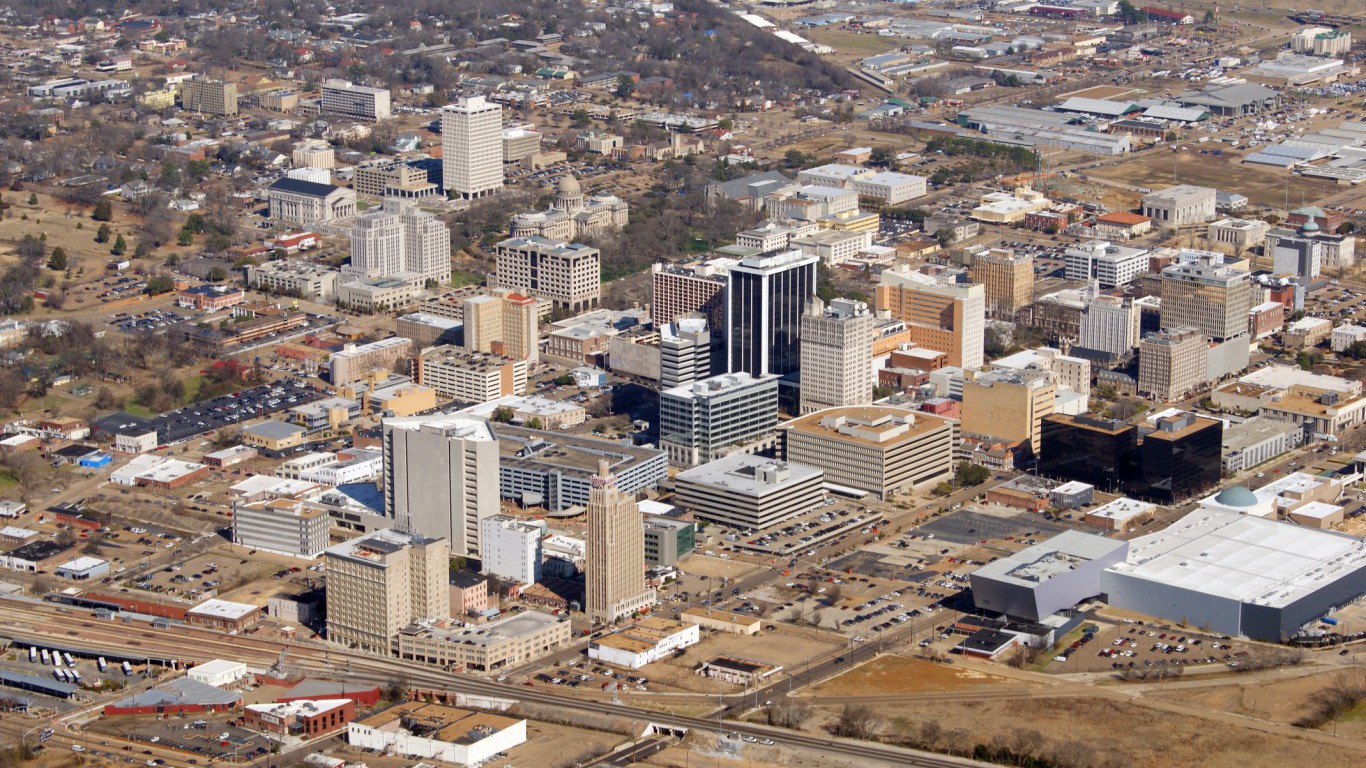
Cajuns are largely the descendants of the Acadian people, French colonists from the Acadia colony in Eastern Canada who were exiled from the region and forced to move to rural communities throughout the East Coast. Many migrated to port cities in the South and established small French-speaking communities. While roughly half of all Cajun Americans live in Louisiana today, there are significant populations in southern states such as Florida, Arkansas, and Mississippi. Some 0.08% of Mississippi residents identify as Cajun, twice the 0.04% national figure and the most of any ancestry relative to the corresponding national share. Cities with the largest shares of residents who claim Cajun descent in the state include Biloxi, Clarksdale, Pascagoula, and Gulfport.
[in-text-ad-2]
25. Missouri
> Most unique ancestry: Yugoslavian
> Location quotient: 2.6
> Pct. of residents identifying as Yugoslavian: 0.23% (MO), 0.09% (U.S.)
> Share of U.S. Yugoslavian population living in state: 4.87%
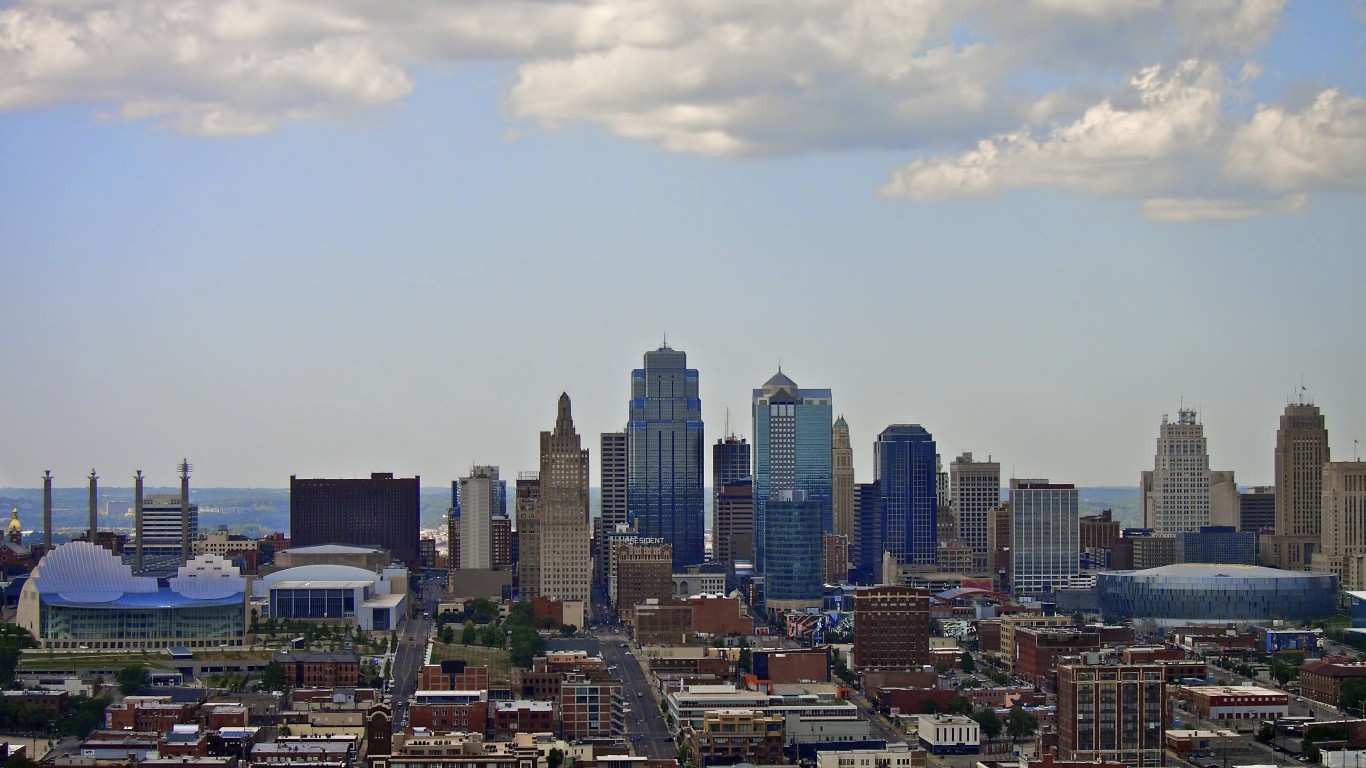
Some 14,000 Missouri residents are of Yugoslavian descent. Many of them were displaced in the 1990s during the conflict between Serbian nationalists and residents of former Yugoslavia. Many of the refugees who immigrated to Missouri and claim Yugoslavian heritage came from the region that is today Bosnia and Herzegovina. The conflict in the Balkans was one of the worst acts of genocide since Hitler’s regime during WWII.
As a direct result of mass displacement, St. Louis is home to the largest Bosnian community outside of the Balkans, according to some estimates. About 5% of the Yugoslavian population in the United States lives in Missouri.
26. Montana
> Most unique ancestry: Norwegian
> Location quotient: 6.5
> Pct. of residents identifying as Norwegian: 9.14% (MT), 1.40% (U.S.)
> Share of U.S. Norwegian population living in state: 2.10%
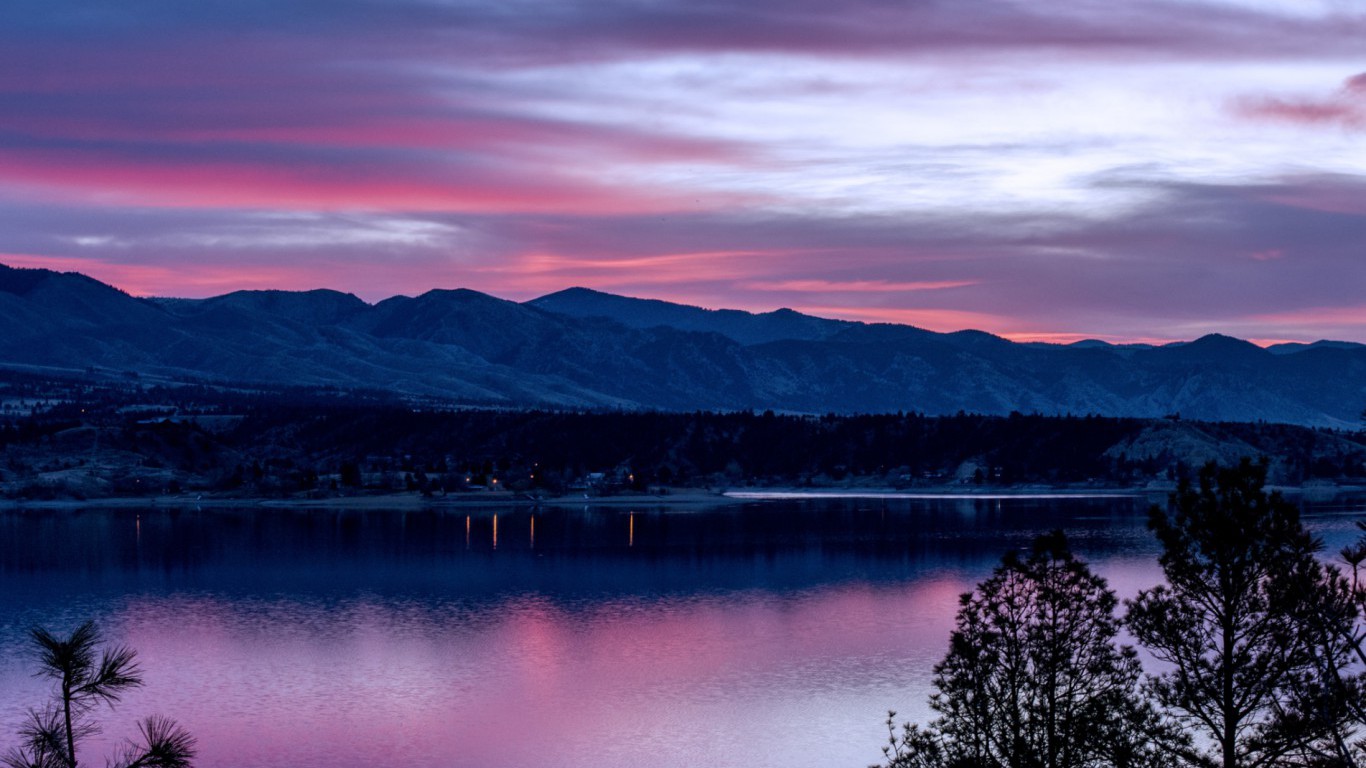
The first major wave of Norwegian immigration to the United States took place in the late 19th and early 20th centuries, largely for economic reasons as immigrants from the Nordic countries seeking homesteads and farmland settled throughout the Upper Midwest. Today, about 40% of all Americans claiming Norwegian ancestry live in North and South Dakota, Minnesota, Wisconsin, and Montana. Some 9.1% of Montana residents identify as Norwegian, more than six times the 1.4% national figure and the largest share of any ancestry relative to the respective national share in the state. Towns with the largest Norwegian populations in Montana include Scobey, Plentywood, and Glasgow.
[in-text-ad]
27. Nebraska
> Most unique ancestry: Sudanese
> Location quotient: 11.3
> Pct. of residents identifying as Sudanese: 0.17% (NE), 0.01% (U.S.)
> Share of U.S. Sudanese population living in state: 6.70%
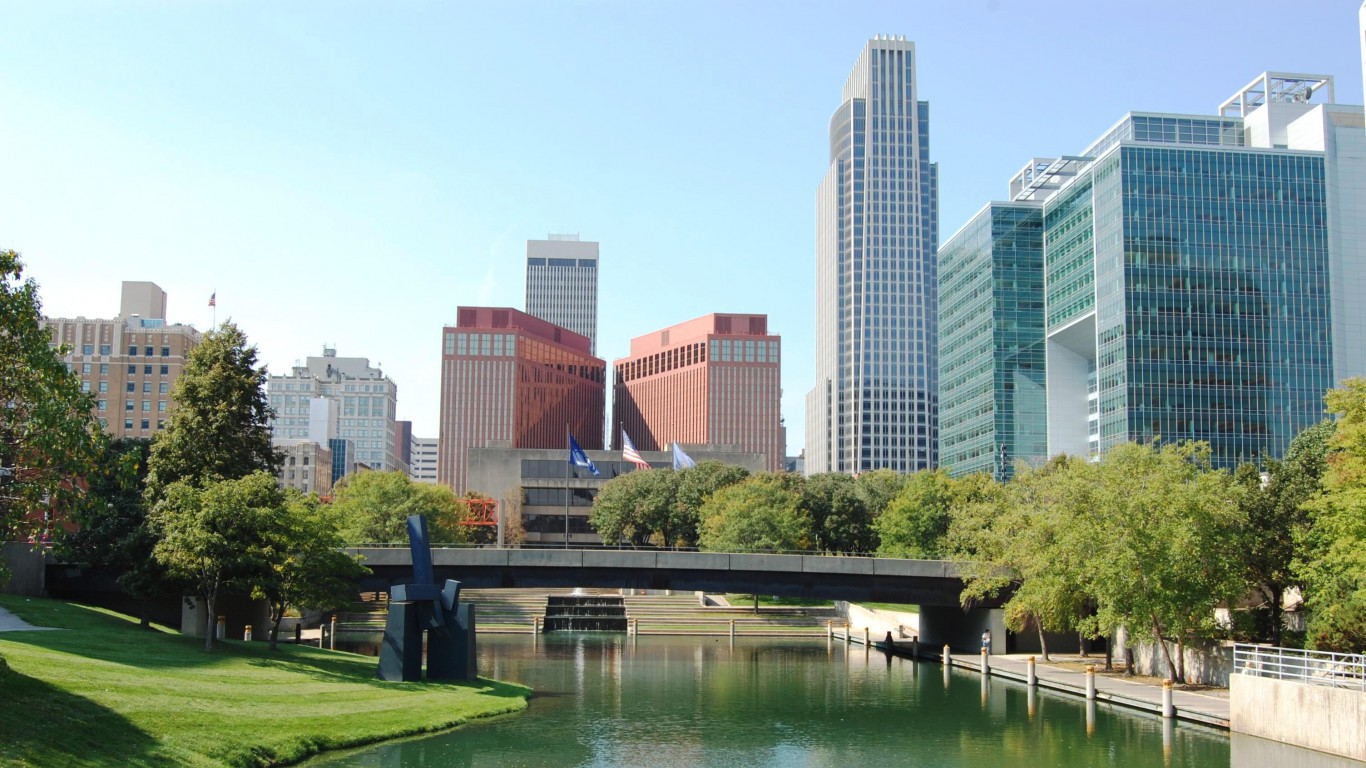
Many Americans claiming Sudanese ancestry are either refugees or descendants of refugees. For decades, Sudan has been plagued by political instability and conflict. As recently as 2004, then Secretary of State Colin Powell denounced militia-killings of civilians in western Sudan as genocide. Currently, the Sudanese comprise one of the largest new refugee populations in the United States.
Many Sudanese Americans are drawn to Omaha by low cost housing and factory jobs. Nearly 7% of the 46,500 Americans claiming Sudanese heritage live in Nebraska.

28. Nevada
> Most unique ancestry: Basque
> Location quotient: 9.8
> Pct. of residents identifying as Basque: 0.18% (NV), 0.02% (U.S.)
> Share of U.S. Basque population living in state: 8.78%
Basque Americans hail from Basque Country — a region that covers parts of northern Spain and southwestern France where the Basque language is primarily spoken. The first major wave of Basque immigrants to the United States came during the California gold rush in 1848. Many Basques found employment as sheepherders in northern Nevada, and today the state is home to one of the largest Basque American populations in the country. Some 0.18% of Nevada ACS respondents identify as Basque, nearly 10 times the 0.02% national share — the highest location quotient of any ancestry in the state.
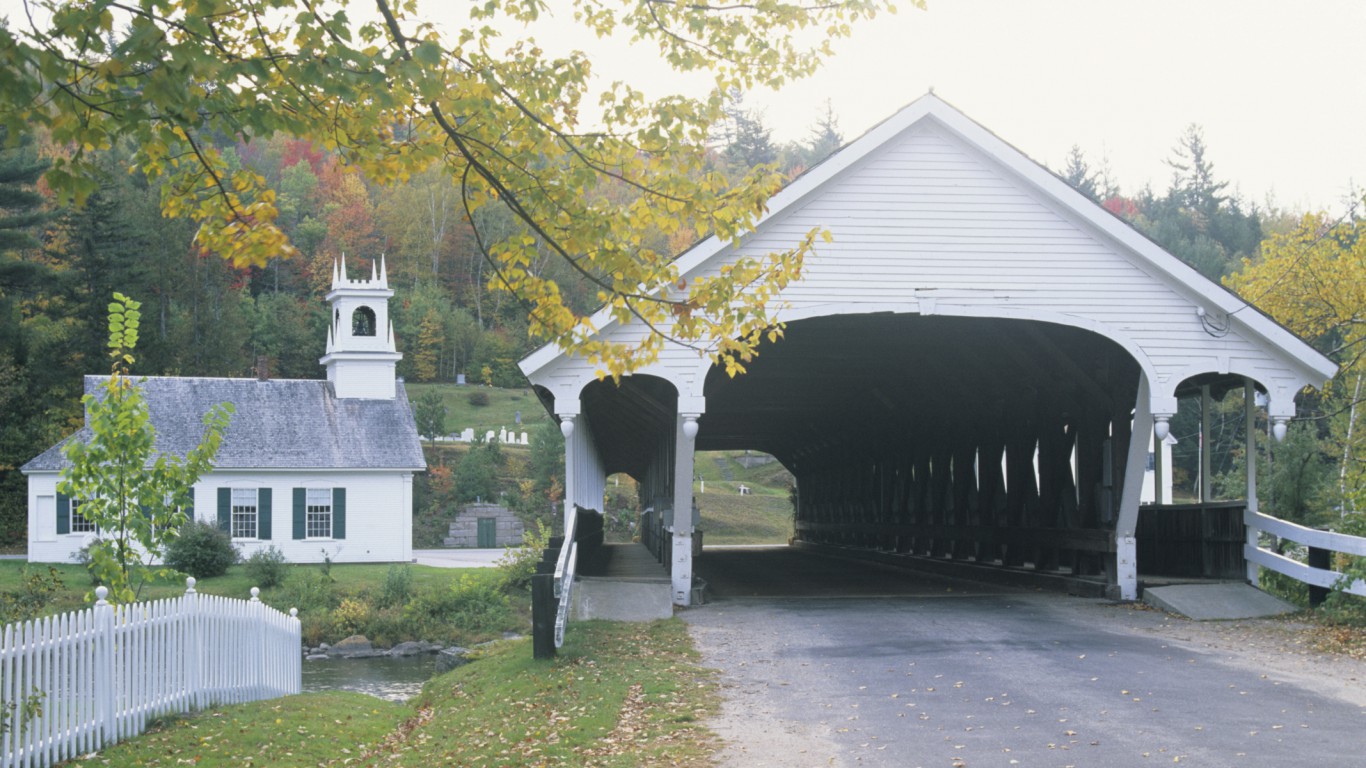
29. New Hampshire
> Most unique ancestry: French Canadian
> Location quotient: 13.4
> Pct. of residents identifying as French Canadian: 8.67% (NH), 0.65% (U.S.)
> Share of U.S. French Canadian population living in state: 5.59%
French Canadians are an ethnic group who descend from the French colonists who settled in Eastern Canada around the 17th century. Large-scale immigration to the United States began in the 19th century, as groups of French Canadians found employment in textile mills and logging operations throughout New England. Today, some 8.67% of of New Hampshire residents identify as French Canadian, the largest share of any state and more than 13 times the 0.65% national share.
Due to their proximity to their ancestral homeland — New Hampshire and Quebec share a border — as well as their emphasis on preserving francophone culture, French Canadian Americans may have been able to retain their cultural heritage in America more than other ethnicities. Some 1.7% of New Hampshire residents today speak French, the largest share of any state other than Maine and Louisiana.
[in-text-ad-2]

30. New Jersey
> Most unique ancestry: Egyptian
> Location quotient: 6.0
> Pct. of residents identifying as Egyptian: 0.44% (NJ), 0.07% (U.S.)
> Share of U.S. Egyptian population living in state: 16.81%
A majority of Egyptian Americans emigrated to the United States in the last 60 years as bills such as the Immigration and Nationality Act of 1965 and the Immigration Act of 1990 eased immigration quotas and requirements for underrepresented populations. Still, the Egyptian diaspora in America is one of the smallest national origin groups. Approximately 233,600 Americans identify as Egyptian, just 0.07% of the U.S. population. Some 16.8% of Egyptian Americans live in New Jersey, more than in any state other than California. Egyptians comprise 0.44% of New Jersey’s population, six times the national figure and the largest share of any ancestry in the state relative to the respective national share.
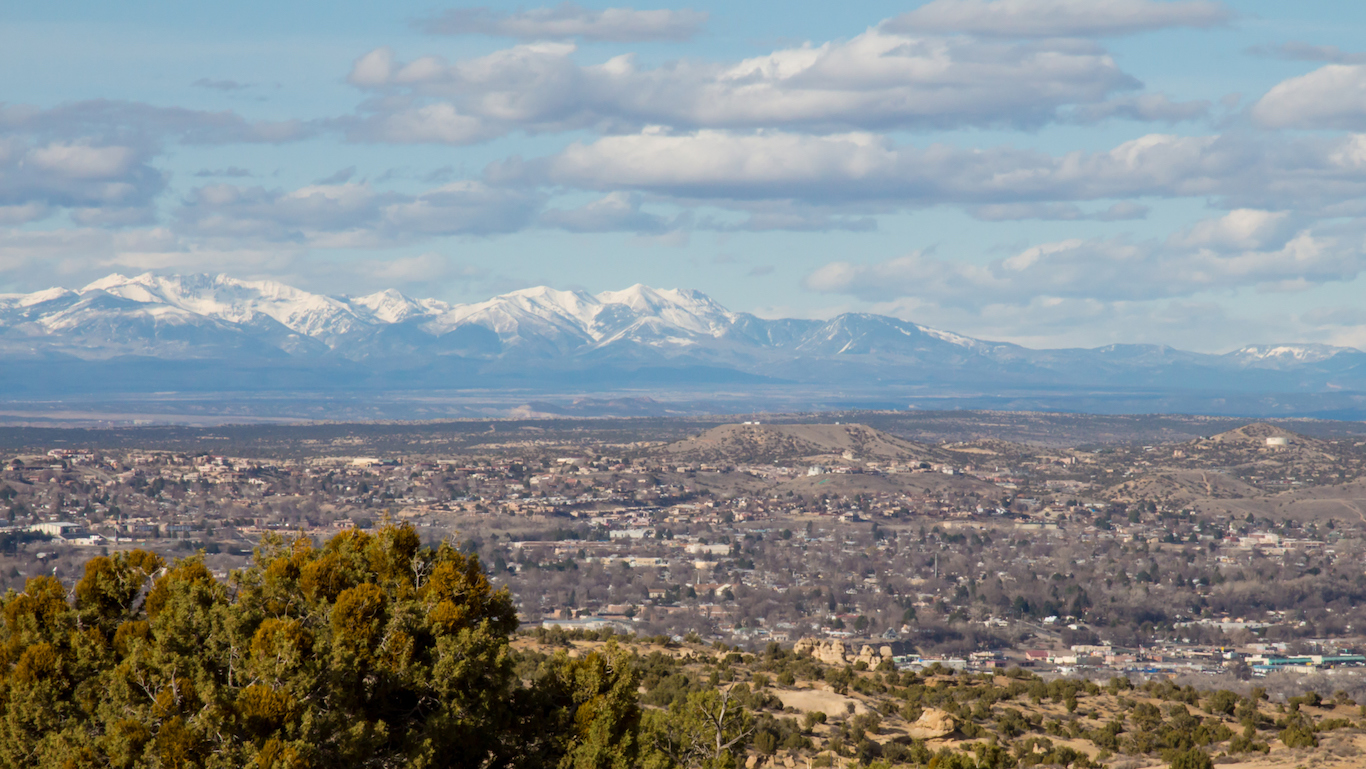
31. New Mexico
> Most unique ancestry: European
> Location quotient: 1.1
> Pct. of residents identifying as European: 1.33% (NM), 1.18% (U.S.)
> Share of U.S. European population living in state: 0.74%
When asked to identify their heritage, 3.8 million Americans primarily identify as European. Some 27,743 of them live in New Mexico. Most Americans of European descent are white — and unlike in most states, white Americans are a minority in New Mexico. Some 48.5% of New Mexico residents are Hispanic or Latino, the largest share of any state. Meanwhile, 37.8% of New Mexico residents are white, the third smallest such share among states.
While European is a more general classification than most ethnicities on this list, other distinct European subsects — including Scandinavian, Scottish, and Welsh — are also heavily concentrated in New Mexico relative to the U.S. as a whole.
[in-text-ad]

32. New York
> Most unique ancestry: St. Vincent and Grenadine Islander
> Location quotient: 11.3
> Pct. of residents identifying as St. Vincent and Grenadine Islander: 0.06% (NY), 0.01% (U.S.)
> Share of U.S. St. Vincent and Grenadine Islander population living in state: 69.94%
Only 16,480 Americans identify as hailing from St. Vincent and the Grenadines. The country has the smallest representation in the U.S. population of any Caribbean nation. The vast majority of people from — or who are descendants of people from — St. Vincent live in New York state.
Immigration from Caribbean nations did not begin until the 20th century, following an increased American presence in the region. Immigrants were drawn to the United States for greater economic opportunity. Americans of Caribbean descent are concentrated in New York City and southern Florida.
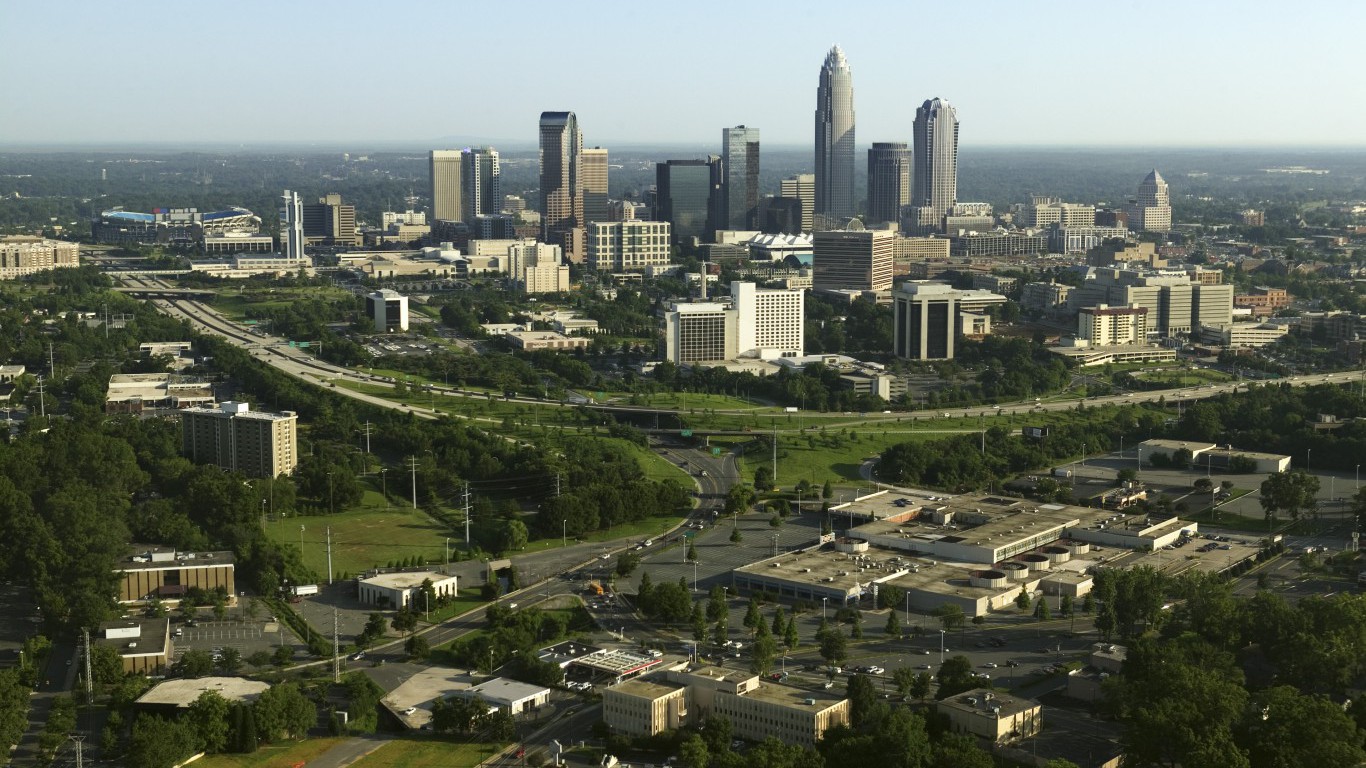
33. North Carolina
> Most unique ancestry: Congolese
> Location quotient: 3.4
> Pct. of residents identifying as Congolese: 0.02% (NC), 0.01% (U.S.)
> Share of U.S. Congolese population living in state: 10.52%
The majority of Congolese Americans came to the United States in the last two decades. Only 3,886 Americans claimed Congolese ancestry in 2000 — just 0.001% of the U.S. population at the time. The Congolese American population grew as more individuals seeking educational opportunities or fleeing violent conflict came to the United States, and today some 21,286 Americans identify as Congolese.
Approximately 11% of the Congolese American population lives in North Carolina, the largest share of any state other than Texas. Congolese Americans comprise 0.02% of the North Carolina population, more than three times the national share — the highest location quotient of any ancestry in the state.
34. North Dakota
> Most unique ancestry: Icelander
> Location quotient: 25.8
> Pct. of residents identifying as Icelander: 0.41% (ND), 0.02% (U.S.)
> Share of U.S. Icelander population living in state: 5.96%
Due to hardship related to climate and natural disasters, an estimated 15,000 to 20,000 people left Iceland in the 1800s — and many of them were bound for North America. About 6% of the 50,305 Americans primarily identifying as Icelanders live in North Dakota. Some 0.41% of North Dakota’s population are of Icelandic descent compared to only 0.02% of the U.S. population.
Icelanders in the state trace their roots to migration in the 1870s, when Icelandic people settled in the adjacent counties of Pembina, Cavalier, and Walsh in the northeast corner of the state. Today, the area enjoys strong Icelandic cultural influence and pride.
[in-text-ad-2]
35. Ohio
> Most unique ancestry: Slovene
> Location quotient: 8.3
> Pct. of residents identifying as Slovene: 0.44% (OH), 0.05% (U.S.)
> Share of U.S. Slovene population living in state: 30.12%
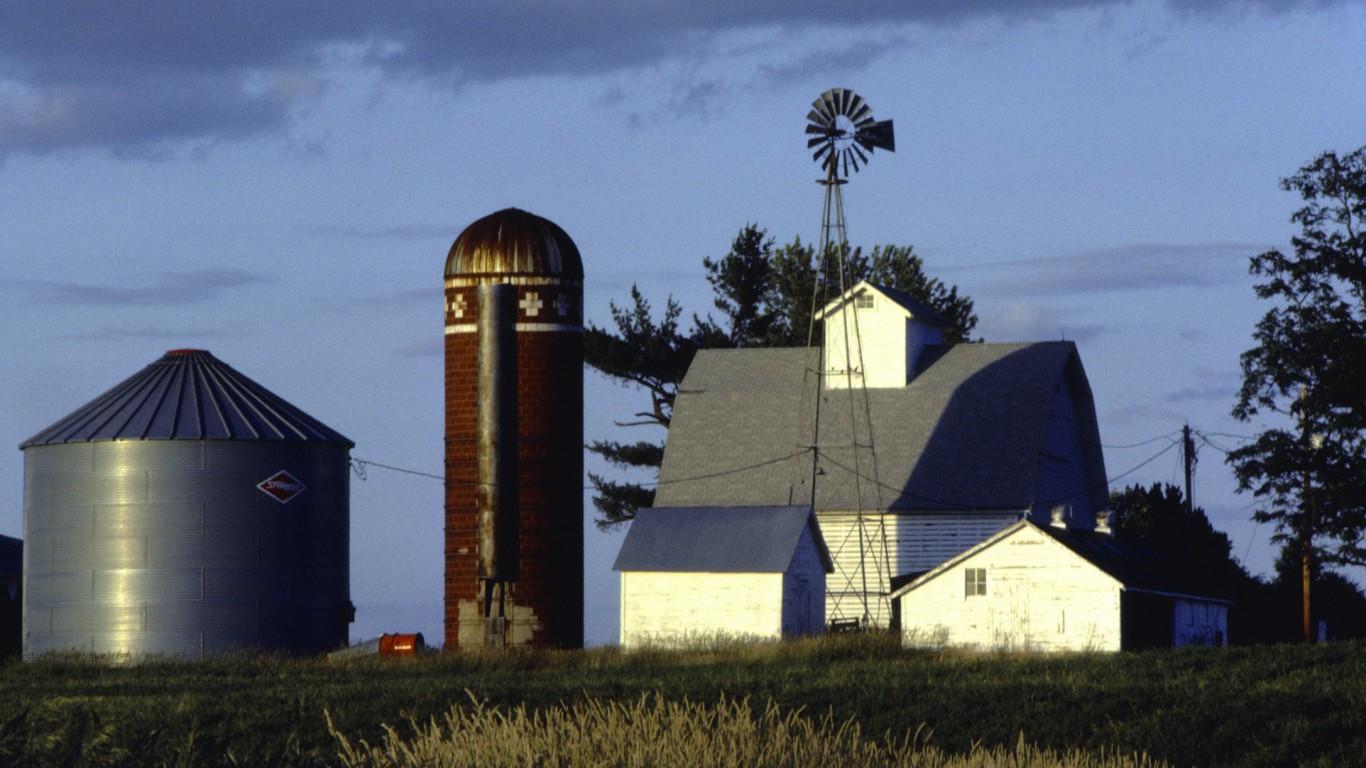
Following the Civil War, there was a shift in the broader immigration patterns to the United States. If immigrants until then mostly came from England, Germany, and Ireland, after the war they came from Eastern European countries, including Slovenia. In 1900, fewer than 10,000 American Slovenes lived in Ohio. By 1910, over 14,000 American Slovenes lived in Cleveland alone. Slovenes were attracted to Cleveland by factory jobs and due to previous Slovene migration, which meant they could live around people with shared culture and beliefs.
Currently, close to one-third of the roughly 170,000 American Slovenes live in Ohio.

36. Oklahoma
> Most unique ancestry: Dutch West Indian
> Location quotient: 28.5
> Pct. of residents identifying as Dutch West Indian: 0.45% (OK), 0.02% (U.S.)
> Share of U.S. Dutch West Indian population living in state: 34.65%
Dutch West Indian Americans are descendants of the Netherlands Antilles, a former country that consisted of a series of islands in the Caribbean under Dutch rule for approximately four centuries. The islands were conquered by settlers of the Dutch West India Company in the 17th century and were under Dutch rule until October 2010, when the five islands that comprised the Netherlands Antilles — Curacao, Sint Maarten, Bonaire, Saba, and Sint Eustatius — became fully autonomous territories. Immigrants from the Dutch West Indies came to the United States in small waves throughout the 20th century and largely settled in Oklahoma and Texas, which today are home to 60% of the Dutch West Indian American population. Dutch West Indians comprise 0.45% of the Oklahoma population, nearly 29 times the 0.02% of Americans who claim Dutch West Indian ancestry.
[in-text-ad]
37. Oregon
> Most unique ancestry: Basque
> Location quotient: 4.4
> Pct. of residents identifying as Basque: 0.08% (OR), 0.02% (U.S.)
> Share of U.S. Basque population living in state: 5.49%
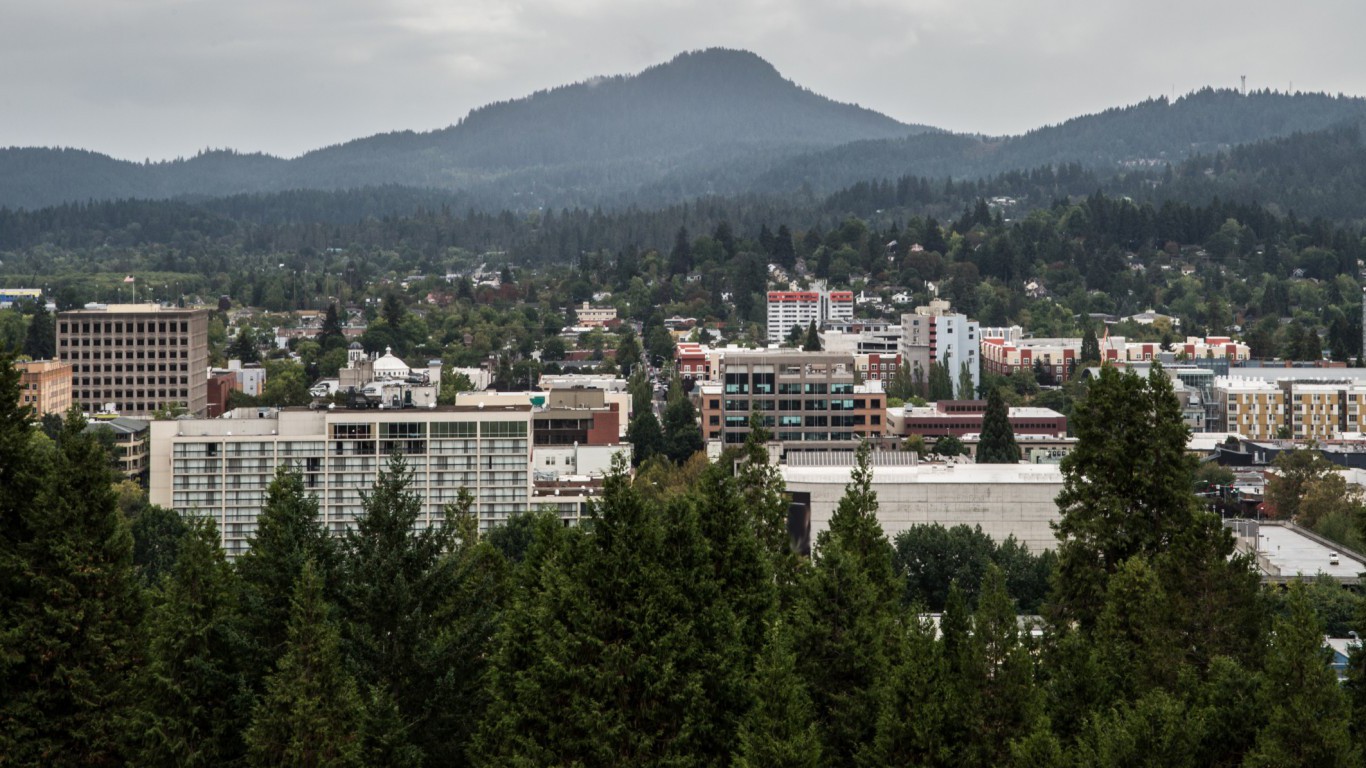
Basque Americans trace their roots to a region that covers parts of northern Spain and southwestern France where the Basque language is primarily spoken. Basque people first arrived in Oregon en masse in the late 1880s, many leaving California after the gold rush. Upon settling in Oregon, the Basque people spread out across the state, and many became sheepherders. In addition to California, much of Oregon’s Basque population moved to the state from Nevada, which still has a relatively heavy concentration of Basque Americans. Today, 5.5% of the 57,607 Americans who identify as Basque live in Oregon.
38. Pennsylvania
> Most unique ancestry: Pennsylvania German
> Location quotient: 12.2
> Pct. of residents identifying as Pennsylvania German: 1.16% (PA), 0.10% (U.S.)
> Share of U.S. Pennsylvania German population living in state: 49.00%
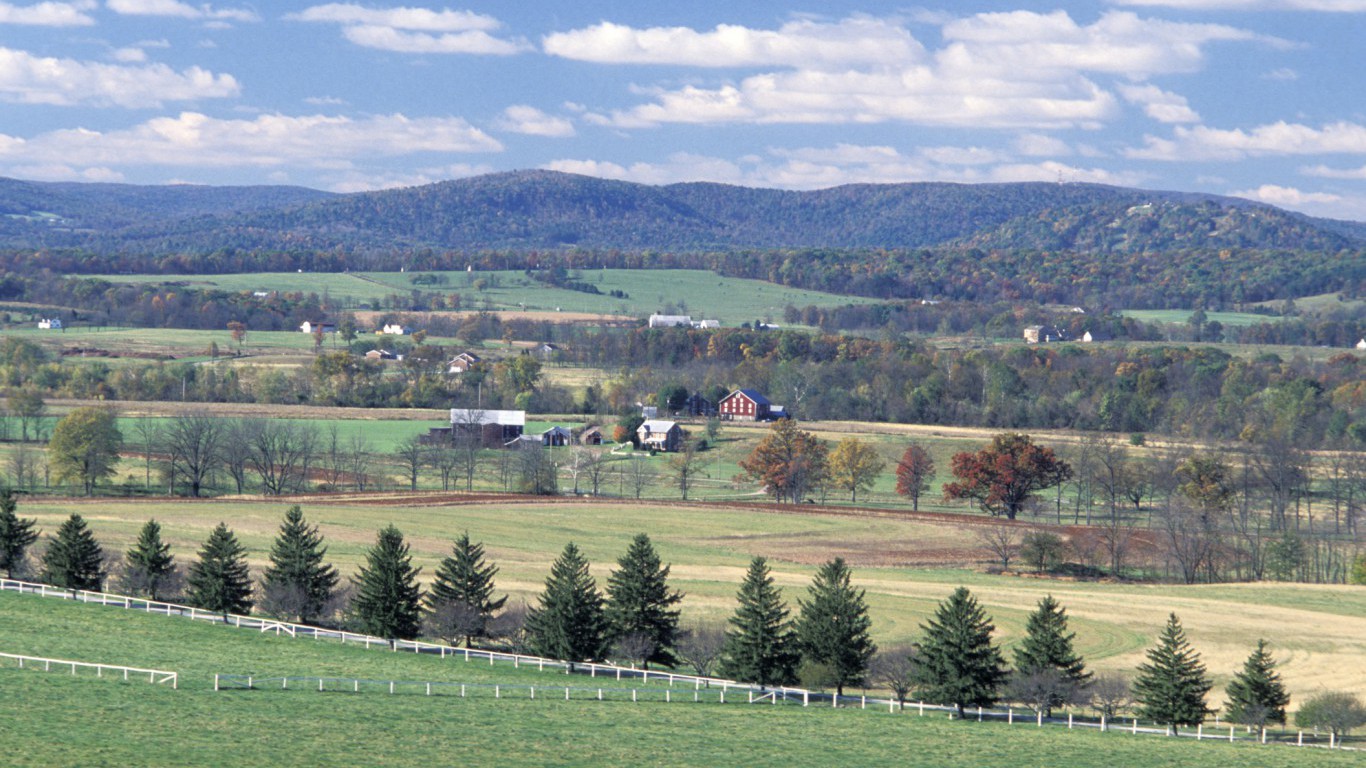
Pennsylvania Germans are the descendants of a group of southern German immigrants who settled in Pennsylvania in the 17th and 18th centuries. The immigrants established a unique dialect of German known as Pennsylvania Dutch that was spoken by more than a third of the state’s population by the time of the American Revolution.
Today, some 304,000 Americans identify as Pennsylvania German, roughly half of whom live in Pennsylvania. The ethnic group comprises 1.2% of the Pennsylvania population, more than 12 times the 0.1% U.S. share. An estimated 0.6% of Pennsylvania residents speak Pennsylvania Dutch or another West Germanic language, the largest share of any state other than New York.
39. Rhode Island
> Most unique ancestry: Cabo Verdean
> Location quotient: 59.9
> Pct. of residents identifying as Cabo Verdean: 1.99% (RI), 0.03% (U.S.)
> Share of U.S. Cabo Verdean population living in state: 19.83%
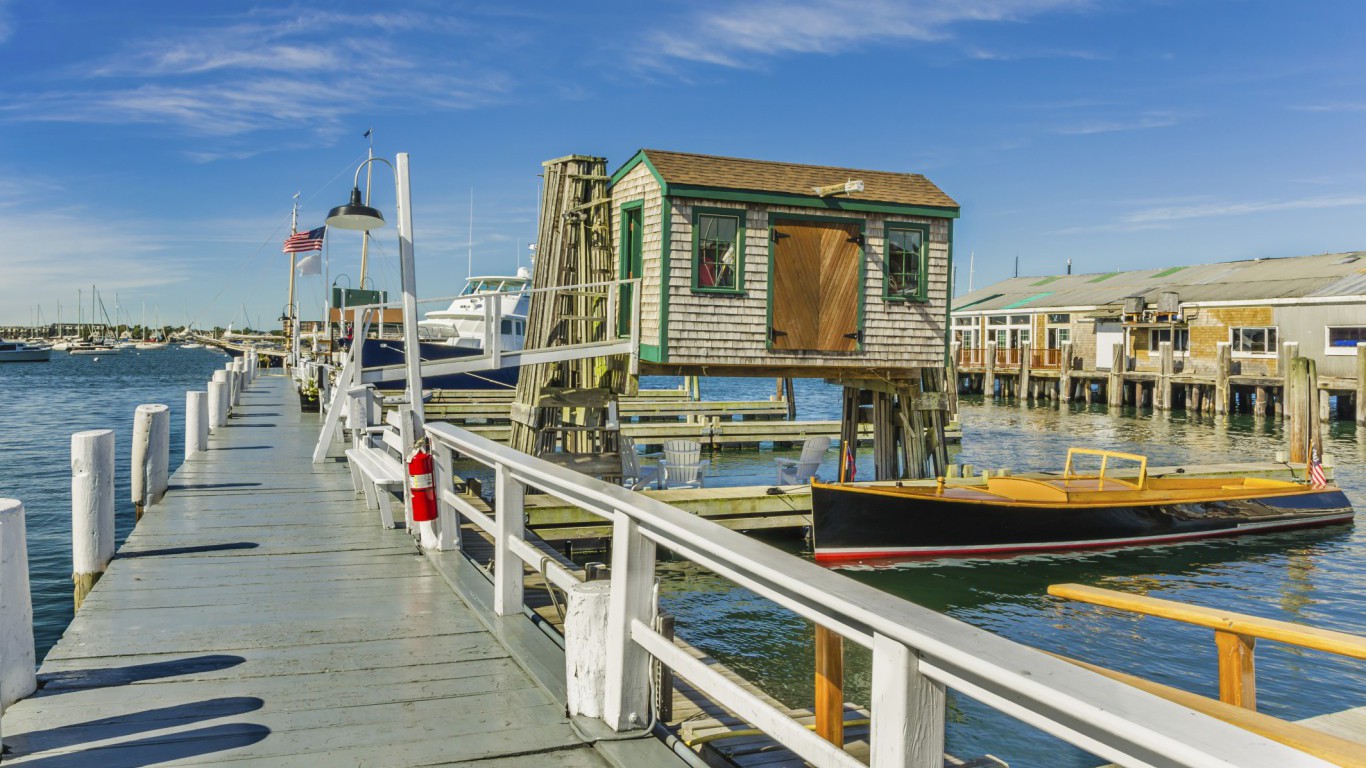
Cape Verde is an island nation off the western coast of Africa. About 1 in every 5 Americans who identify Cabo Verdean as their primary ethnicity live in Rhode Island. Americans identifying as Cabo Verdean often also have Portuguese ancestry as Portugal colonized the African island nation in the 1400s. The Cabo Verdean people first arrived in New England after being employed on whaling ships — which often stopped at Cape Verde — from the northeastern United States. Other states with high concentrations of Americans with Cabo Verdean ancestry include Connecticut and Massachusetts.
[in-text-ad-2]
40. South Carolina
> Most unique ancestry: Scotch-Irish
> Location quotient: 2.4
> Pct. of residents identifying as Scotch-Irish: 2.34% (SC), 0.96% (U.S.)
> Share of U.S. Scotch-Irish population living in state: 3.71%
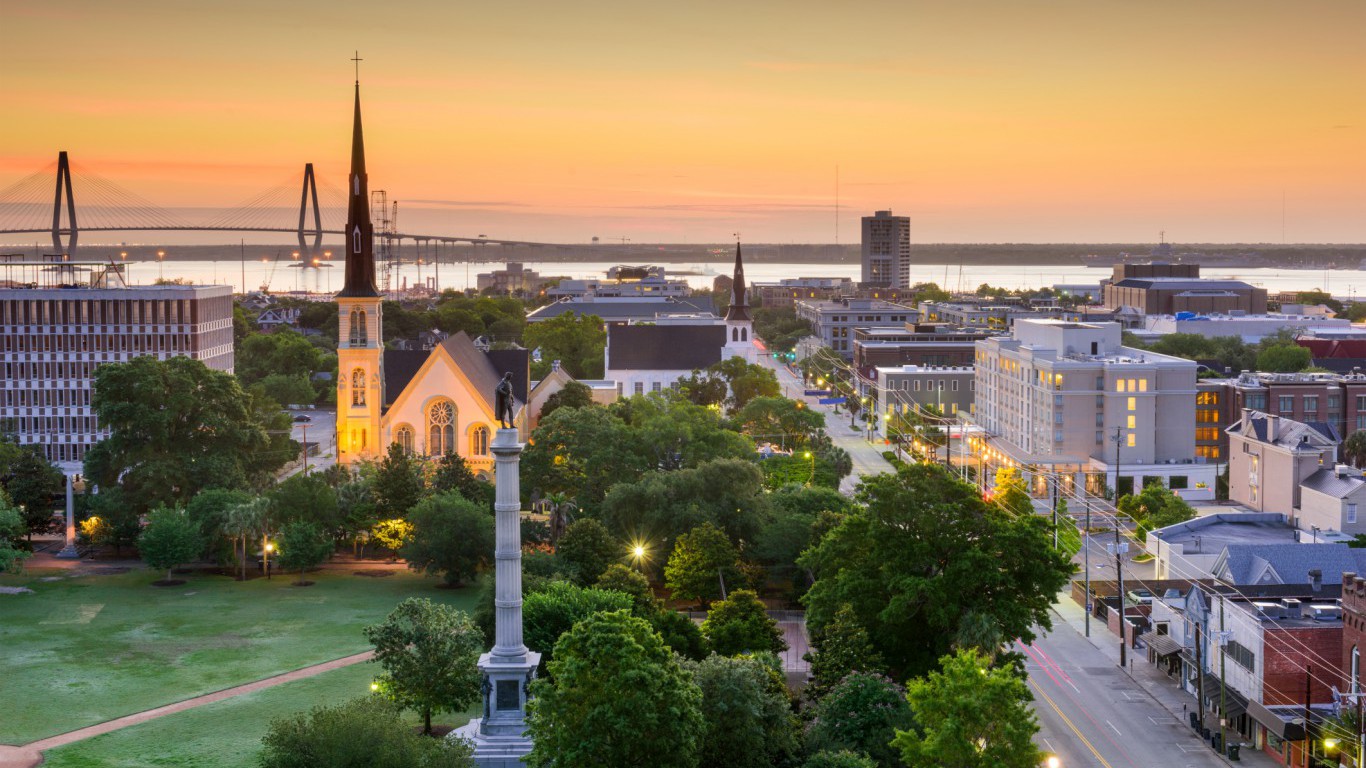
The Scotch-Irish Americans are descendants of immigrants who came to America primarily from the Ulster province of Ireland in the 18th century seeking religious freedom and economic opportunities. They are one of the largest ethnic groups in the United States today. Approximately 3 million Americans identify as Scotch-Irish, or 1% of the population. States with the largest shares of Scotch-Irish American residents include southeastern states such as Tennessee, West Virginia, and North and South Carolina. The Scotch-Irish comprise 2.3% of the South Carolina population, more than twice the national share — and the highest location quotient of any ancestry in the state. Other highly concentrated ancestries in the state include American, African, and Scottish.
41. South Dakota
> Most unique ancestry: Norwegian
> Location quotient: 9.7
> Pct. of residents identifying as Norwegian: 13.57% (SD), 1.40% (U.S.)
> Share of U.S. Norwegian population living in state: 2.60%
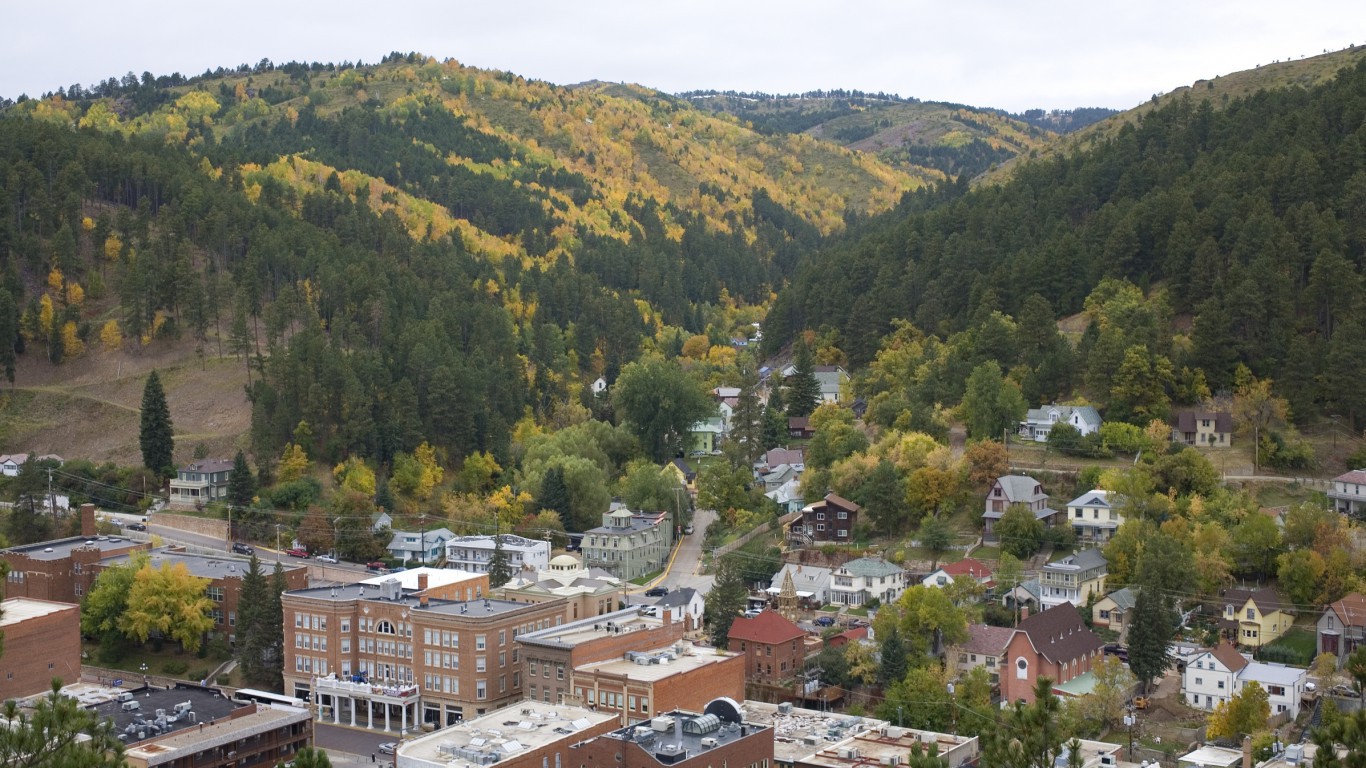
Some 13.6% of South Dakota’s population identifies as Norwegian compared to only 1.4% of the U.S. population. South Dakota is not the only state in the Upper Midwest with a high concentration of Norwegians. North Dakota, Minnesota, and Wisconsin have relatively large Norwegian populations as well. Norwegians first settled in South Dakota in the mid-1800s. Their numbers increased rapidly in the region throughout the remainder of the 19th century. Today, roughly 115,500 people living in South Dakota identify primarily as Norwegian.
[in-text-ad]

42. Tennessee
> Most unique ancestry: Kurdish
> Location quotient: 9.2
> Pct. of residents identifying as Kurdish: 0.06% (TN), 0.01% (U.S.)
> Share of U.S. Kurdish population living in state: 18.81%
Kurdish people hail from Kurdistan, a region in northern Iraq. Many moved to Tennessee during one of three major waves of Kurdish immigration to the United States. The first was in the 1970s, when many Kurds fled during the Kurdish-Iraqi wars. More came in the 1990s to avoid looming genocide under Saddam Hussein. The final wave happened within the last decade as Kurds have been pushed out under the threat of violence carried out by ISIS.
Nearly 1 in every 5 Americans identifying as Kurdish today live in Tennessee. Nashville, the state capital, has the largest Kurdish population of any U.S. city.

43. Texas
> Most unique ancestry: Dutch West Indian
> Location quotient: 3.1
> Pct. of residents identifying as Dutch West Indian: 0.05% (TX), 0.02% (U.S.)
> Share of U.S. Dutch West Indian population living in state: 25.92%
Dutch West Indian Americans are descendants of the Netherlands Antilles, a former country that consisted of a series of islands in the Caribbean under Dutch rule for approximately four centuries. The islands were conquered by settlers of the Dutch West India Company in the 17th century and remained under Dutch rule until October 2010, when the five islands that comprised the Netherlands Antilles — Curacao, Sint Maarten, Bonaire, Saba, and Sint Eustatius — became fully autonomous territories.
Immigrants from the Dutch West Indies came to the United States in small waves throughout the 20th century and largely settled in Oklahoma and Texas, which today are home to 60% of the Dutch West Indian American population. Dutch West Indian Americans comprise 0.05% of the Texas population, more than three times the comparable national share — the highest location quotient of any ancestry in the state. Cities with the largest Dutch West Indian populations in the state include Amarillo, Lubbock, and McAllen.
44. Utah
> Most unique ancestry: Danish
> Location quotient: 11.9
> Pct. of residents identifying as Danish: 4.88% (UT), 0.41% (U.S.)
> Share of U.S. Danish population living in state: 11.00%
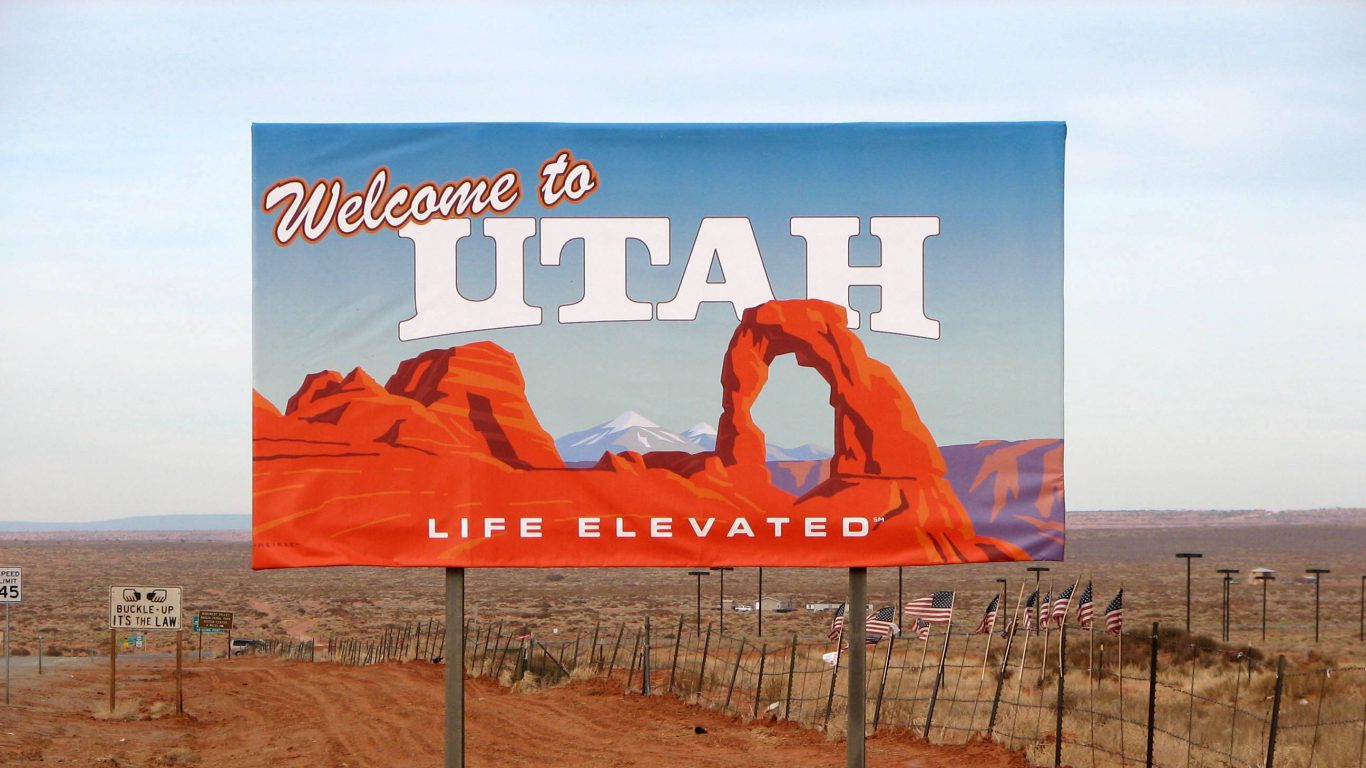
The first major wave of immigration from Denmark to the United States was in the late 19th century, when converts to the Church of Jesus Christ of Latter Day Saints moved throughout the Midwest and to Utah. Mormon missionaries had arrived in Denmark in 1850, just months after the 1849 Constitutional Act of Denmark granted the Danish people freedom of religion. Immigration continued into the 1900s, as economic opportunities in Denmark became limited and the United States offered settlers cheap farmland through generous land policies such as the Homestead Act.
Today, 143,800 Utah residents identify as Danish, more than in any state other than California. Danish Americans comprise 4.9% of the Utah population, nearly 12 times the comparable 0.4% U.S. share.
[in-text-ad-2]

45. Vermont
> Most unique ancestry: French Canadian
> Location quotient: 12.7
> Pct. of residents identifying as French Canadian: 8.21% (VT), 0.65% (U.S.)
> Share of U.S. French Canadian population living in state: 2.50%
French Canadians began to immigrate to New England in large numbers from Quebec, New Brunswick, and Ontario for textile and logging jobs in the 19th century. Today, the largest shares of U.S. residents claiming the ancestry live in New Hampshire, Maine, and Vermont. Some 8.21% of Vermont residents claim French Canadian ancestry, nearly 13 times the 0.65% national share — the highest location quotient of any ancestry in the state.
Due to their proximity to Quebec, French Canadian Americans may have been able to preserve francophone culture in the United States more than the descendants of other ancestries. Some 1.4% of Vermont residents today speak French, the most of any language other than English and the fourth largest share of French speakers of any state.
46. Virginia
> Most unique ancestry: Sierra Leonean
> Location quotient: 7.3
> Pct. of residents identifying as Sierra Leonean: 0.04% (VA), 0.01% (U.S.)
> Share of U.S. Sierra Leonean population living in state: 19.17%
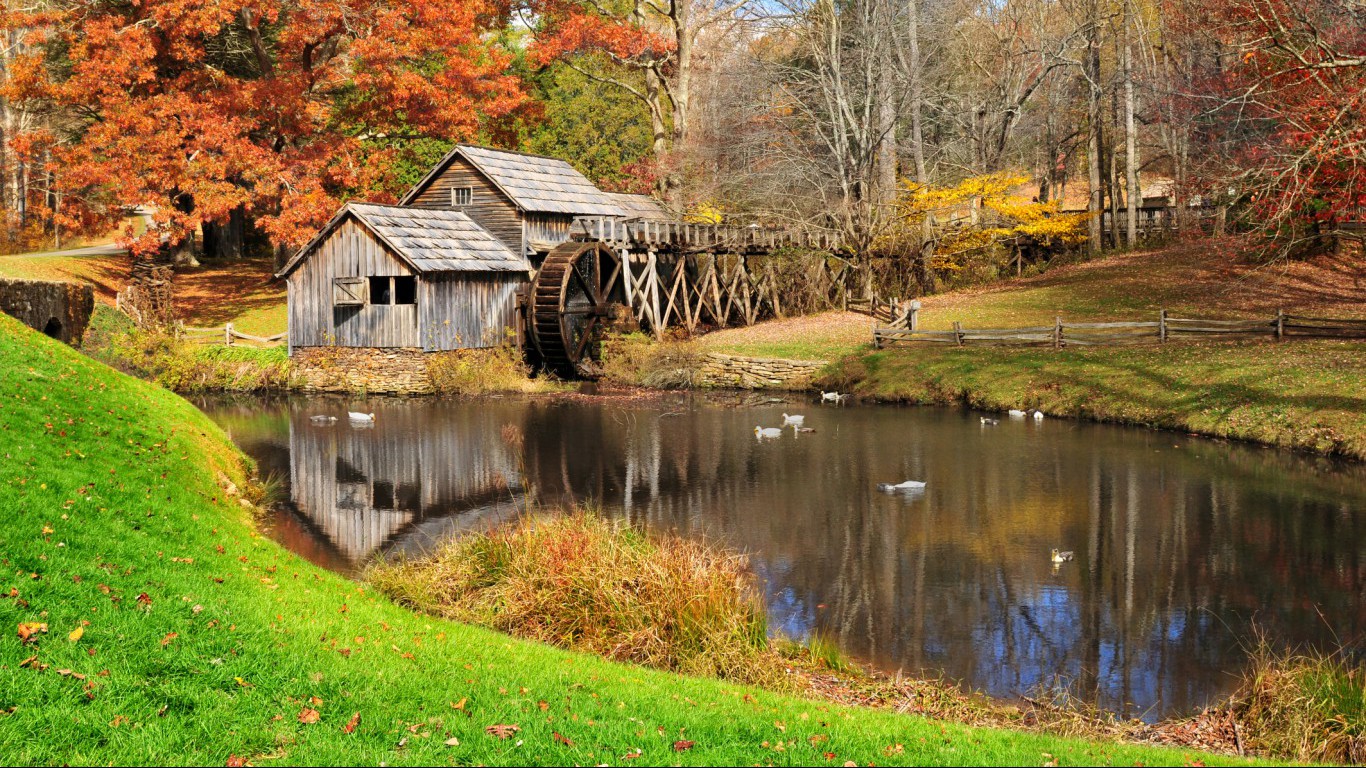
Between 1550 and 1850, over 10 million people from the African continent were brought to North America and Brazil as slaves. Many of those slaves were from Sierra Leone. While some freed Sierra Leonean slaves returned to Africa in 1700s after gaining freedom, a majority stayed in the United States. More recently, large waves of Sierra Leonean immigrants have come to America seeking educational and economic opportunities, as well as to escape political turmoil in their own country. Today, 18,748 Americans identify as Sierra Leonean, a majority of whom live in states along the East Coast. About 1 in 5 of all Americans identifying as Sierra Leonean live in Virginia.
[in-text-ad]

47. Washington
> Most unique ancestry: Icelander
> Location quotient: 5.9
> Pct. of residents identifying as Icelander: 0.09% (WA), 0.02% (U.S.)
> Share of U.S. Icelander population living in state: 13.08%
Large groups of settlers from Iceland first immigrated to the United States in the late 1800s. Estimates of the number of people who left Iceland for the United States during that period ranges from 10,000 to 15,000 — close to one-fifth of the population of Iceland at the time. They initially settled in Midwestern states like Minnesota and Wisconsin, while others were drawn to Utah by the Mormon faith. Eventually, Icelandic Americans moved west to states like California, Oregon, and Washington. Immigration decreased considerably in the early 1900s and did not pick up again until after WWII, when brides of American troops stationed in Iceland relocated to the United States. Today, some 6,582 people in Washington identify as Icelander — more than in any other state.
48. West Virginia
> Most unique ancestry: Scotch-Irish
> Location quotient: 2.1
> Pct. of residents identifying as Scotch-Irish: 2.05% (WV), 0.96% (U.S.)
> Share of U.S. Scotch-Irish population living in state: 1.24%
The Scotch-Irish Americans are descendants of immigrants who came to America primarily from the Ulster province of Ireland in the 18th century. They are one of the largest ethnic groups in the United States today. Approximately 3 million ACS respondents nationwide claim Scotch-Irish ancestry, or 1% of the population. The first major wave of Scotch-Irish settlers immigrated to the United States seeking religious freedom and economic opportunities. Having originally settled in Philadelphia, the Scotch-Irish eventually found a greater degree of religious freedom in the Southern states — where their descendants largely remain today. Some 2.05% of West Virginia residents are Scotch-Irish, more than twice the comparable national share — the highest location quotient of any ancestry in the state.
49. Wisconsin
> Most unique ancestry: Luxemburger
> Location quotient: 9.1
> Pct. of residents identifying as Luxemburger: 0.12% (WI), 0.01% (U.S.)
> Share of U.S. Luxemburger population living in state: 16.36%
The world’s only cultural center celebrating the heritage of Luxembourg opened in 2009 in Belgium, Wisconsin. The location is appropriate as about 6,600 people claiming Luxemburger heritage live in Wisconsin — more than in any other state. Some 16.4% of the 40,500 Luxembourg Americans call Wisconsin home.
The first major wave of immigrants from Luxembourg came in the 1830s and 40s, after many faced difficulty attempting to settle in South America. Drawn by economic opportunity — inexpensive farmland in particular — many Americans from Luxembourg were drawn to the Midwest.
[in-text-ad-2]
50. Wyoming
> Most unique ancestry: Danish
> Location quotient: 3.2
> Pct. of residents identifying as Danish: 1.33% (WY), 0.41% (U.S.)
> Share of U.S. Danish population living in state: 0.59%
Approximately 1.3 million Americans today identify as Danish, about as many Americans as those claiming British, Greek, and Portuguese ancestry. While the first wave of Danish immigrants came to the United States as religious converts to the Church of Jesus Christ of Latter Day Saints and mostly settled in Utah and Wisconsin in the late 19th century, many of those who settled in Wisconsin likely came as homesteaders seeking economic opportunities. Danish Americans comprise 1.3% of the Wyoming population, more than three times the 0.4% U.S. figure and the most of any ancestry in the state relative to the comparable national share.
Detailed Findings & Methodology
People often move for economic reasons and to be close to family. The wave of immigration by Assyrians to Detroit and other cities in Michigan is one example of how a unique ethnic community can form in a given part of the country.
Assyrian immigration to Michigan began in the early 20th century. More Assyrians followed their friends and family to Michigan in the 1970s as political turmoil in the Middle East forced large swaths of the population out of the region. The 1970s also created numerous economic opportunities for immigrants in Michigan, as wealthy white residents left downtown Detroit in the aftermath of the automobile industry’s decline and the 1967 riots. Residents of Assyrian descent took over the area’s grocery industry, and today they own an estimated 90% of the region’s food stores. Metro Detroit is home to one of the largest Assyrian-Chaldean-Syriac diaspora populations in the world.
The roots of many of the largest ethnic groups in the United States originated in the colonial period and during the first 150 years of America’s independence, before the U.S. government imposed quotas limiting the number of immigrants allowed into the country.
The first major wave of immigration to America began in the colonial era, as Europeans hailing mostly from England, Scotland, and Ireland crossed the Atlantic seeking economic opportunity and religious freedom.
The second major wave of immigration to the United States took place throughout the 19th century. Transportation improvements, declining quality of life in Europe, and the growing reputation of the United States as a land of opportunity acted as push-and-pull factors for migrants hailing primarily from Ireland, Germany, Scandinavian countries, and China.
The third major wave of immigration began in the 1890s and peaked around 1920. Immigrants from southern and eastern European countries such as Italy, Russia, and Austria-Hungary flocked to America in droves in search of steel and railroad jobs, farmland, and freedom from religious persecution.
America’s ethnic composition today largely reflects the population changes that occurred during the first three major waves of immigration. Some 14.6% of Americans identify as German, 10.5% as Irish, and 7.8% as English, the most, second most, and third most of any ancestry.
The cultural identity of a region can depend on residents’ family history, education, and a range of environmental factors and may not reflect racial composition. While Arkansas has one of the largest African-American populations of any state, for example, it has one of the smallest shares of residents identifying as sub-Saharan African. Meanwhile, Rhode Island, which has one of the smaller African-American populations in the country, has the second-largest share of residents identifying as sub-Saharan African of any state.
To find the most unusual ancestry in each state, 24/7 Wall St. reviewed the ancestry question in the American Community Survey (ACS) for the five years between 2012 and 2016, which is the most recent available data. The question is based on self-identification and answers represent ancestry groups with which people most closely identify. The 121 ancestry groups represented in the data are based on a combination of the most common responses to the survey as well as classifications by the Census Bureau. The most unusual ancestry in each state was determined by calculating the location quotient for each ancestry and taking the largest ratio relative to the U.S average. For example, if 20% of a state population is Scotch-Irish, and the Scotch-Irish comprise 10% of the U.S. population, then the location quotient would be 2.0. If that location quotient is the highest of any ancestry in the state, then that is the most unusual ancestry in the state. Data on racial composition and language also came from the ACS and is for 2016. Data on refugees settled by state came from the U.S. Office of Refugee Resettlement and is for fiscal year 2015.
Are You Ahead, or Behind on Retirement?
If you’re one of the over 4 Million Americans set to retire this year, you may want to pay attention. Many people have worked their whole lives preparing to retire without ever knowing the answer to the most important question: am I ahead, or behind on my goals?
Don’t make the same mistake. It’s an easy question to answer. A quick conversation with a financial advisor can help you unpack your savings, spending, and goals for your money. With Zoe Financial’s free matching tool, you can connect with trusted financial advisors in minutes.
Why wait? Click here to get started today!
Thank you for reading! Have some feedback for us?
Contact the 24/7 Wall St. editorial team.
 24/7 Wall St.
 24/7 Wall St.
 24/7 Wall St.
 24/7 Wall St.
 24/7 Wall St.


