Special Report
25 Most Dangerous Jobs in America
Published:
Last Updated:

It was not until 1970 that Congress, under President Richard Nixon, passed the Occupational Safety and Health Act. There were 14,000 workplace fatalities that year. As part of the act, the Occupational Safety and Health Administration, or OSHA, was established to set and enforce safety standards in the workplace. Since then, standards have improved and workplace fatalities have declined to less than 5,200 in 2016. Still, some jobs remain far more dangerous than others.
Today, the vast majority of working Americans are relatively safe in their work environment. Across all industries in both the public and private sectors, there were 3.6 deaths for every 100,000 full-time workers. For certain professionals, such as school teachers and administrators or writers and editors, mistakes almost never have physical ramifications, and workplace fatality rates hover just above zero.
In other industries, however, no matter how strict the safety standards put in place, there are always accidents and fatal errors. The majority of jobs on this list require frequent use of heavy equipment, close proximity to hazardous substances, or working in potentially dangerous environments.
24/7 Wall St. reviewed workplace fatality rates by occupation to identify the 25 most dangerous jobs. Those working in the jobs on this list are prone to deadly slips and falls, inadvertent contact with dangerous substances or equipment, and in some cases, violent altercations. Fatality rates for each of these jobs are more than double the rate across all occupations — and in some cases, over 20 times higher.
Click here to see the most dangerous jobs.
Click here to see our detailed findings and methodology.

25. Heating, air conditioning, and refrigeration mechanics and installers
> Fatal injuries in 2016: 8.4 per 100,000 workers
> Total: 37 fatal injuries, 6,830 nonfatal injuries
> Most common accident: Falls, slips, and trips
> Median annual wage: $45,910
Heating, air conditioning, and refrigeration mechanics and installers often work in conditions that may lead to both fatal and nonfatal injuries. Such conditions include extreme temperatures of the heating and cooling systems they need to repair and cramped spaces. Dangerous environments and contact with harmful substances account for 27% of all fatal workplace injuries. However, the most common deadly accidents are falls, slips, and trips, which account for about 30% of all fatal injuries.
[in-text-ad]
24. Painters, construction and maintenance
> Fatal injuries in 2016: 8.6 per 100,000 workers
> Total: 50 fatal injuries, 3,530 nonfatal injuries
> Most common accident: Falls, slips, and trips
> Median annual wage: $37,570
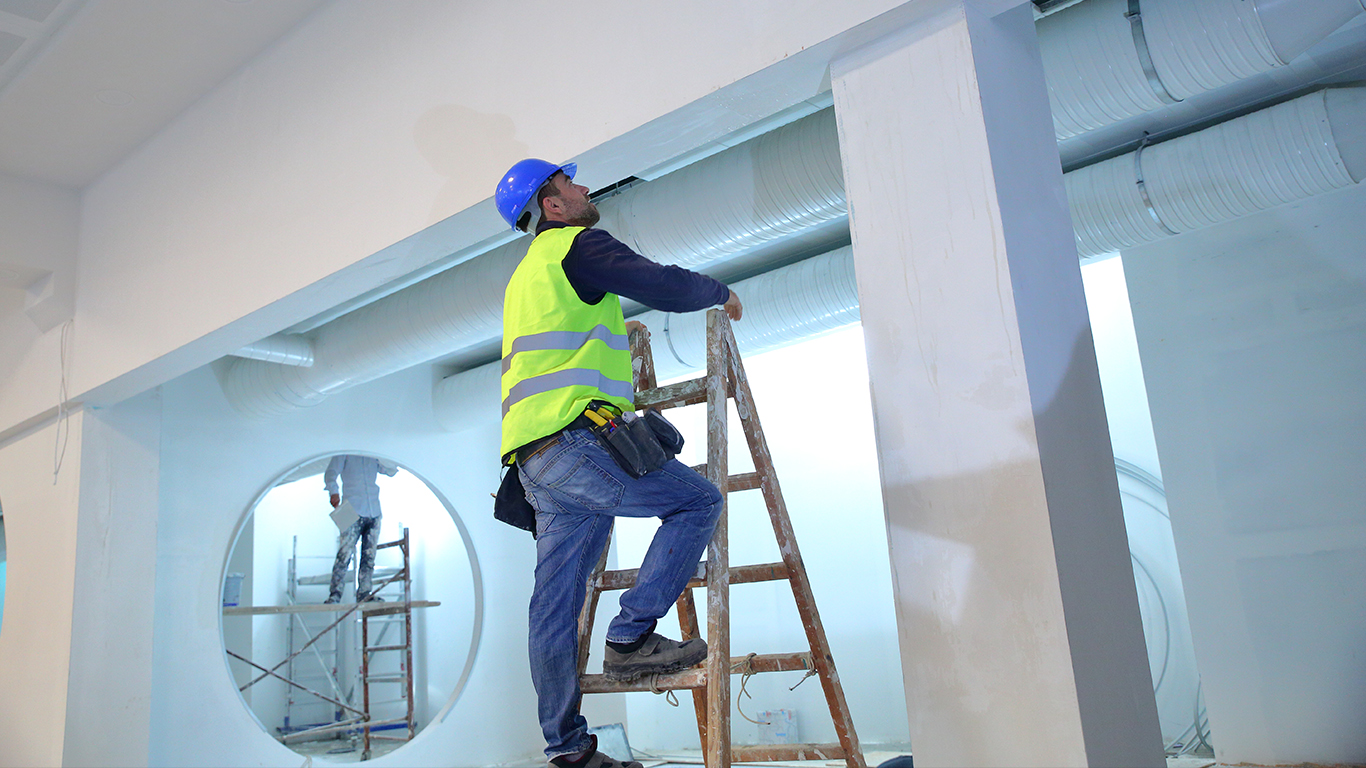
Painters who work in construction and maintenance apply paint, stain, and coating to walls and ceilings, buildings, bridges, and other structures. Painters who work on bridges and buildings may be suspended by ropes or cables, often at extreme heights. In 2016, 50 construction and maintenance painters died from injuries sustained while on the job. Over half of those deaths were the result of falls.
Falls were also the most common cause of nonfatal injury among maintenance and construction painters — accounting for 63.7% of all nonfatal injuries. Many painters also sustained injuries from exposure to irritants such as drywall dust.

23. Industrial machinery installation, repair, and maintenance workers
> Fatal injuries in 2016: 9.3 per 100,000 workers
> Total: 45 fatal injuries, 4,490 nonfatal injuries
> Most common accident: Struck by object
> Median annual wage: $49,080
Industrial machinery installation, repair, and maintenance workers work on factory equipment such as conveying system, production machinery, and packaging equipment. One of the most dangerous jobs, industrial machinery installers and repair workers are often required to follow safety precautions and wear protective equipment such as hardhats, safety glasses, and steel-toed shoes. For every 100,000 full time workers in the field in 2016, approximately nine died from an injury incurred on the job, more than twice the national rate of 3.6 fatalities per 100,000 U.S. workers.

22. Electricians
> Fatal injuries in 2016: 10.0 per 100,000 workers
> Total: 79 fatal injuries, 7,790 nonfatal injuries
> Most common accident: Falls, slips, and trips
> Median annual wage: $52,720
Electricians install, maintain, and repair power, communications, lighting, and control systems in nearly every type of facility. Common accidents for electricians include electrical shocks, falls, and burns. Electricians may also be required to work in cramped spaces, standing or kneeling for long period of times. Some 14.6% of nonfatal occupational injuries in the profession in 2016 resulted in fractures — far higher than the comparable 8.5% national share. About 1.0% of injuries incurred on the job are fatal, twice the 0.5% national average. For every 100,000 electricians in 2016, 10 died from occupational injuries, nearly three times the national rate.
[in-text-ad-2]

21. Operating engineers and other construction equipment operators
> Fatal injuries in 2016: 10.6 per 100,000 workers
> Total: 39 fatal injuries, 4,750 nonfatal injuries
> Most common accident: Overexertion and bodily reaction
> Median annual wage: $45,890
Construction is a relatively dangerous industry, and those who operate construction equipment are not much safer than others on the site. There were nearly 11 deaths for every 100,000 full-time engineers and equipment operators in 2016 — fewer than the 15 deaths per 100,000 among construction laborers the same year but still among the most of any job.
Nonfatal injuries among engineers and equipment operators also tend to be serious. Over half of all nonfatal injuries in the field in 2016 were either sprains or tears, fractures, punctures, or lacerations. Such nonfatal injuries typically resulted in 17 days out of work — far more time than the comparable time for most occupations.
20. Athletes, coaches, umpires, and related workers
> Fatal injuries in 2016: 11.7 per 100,000 workers
> Total: 29 fatal injuries, 4,250 nonfatal injuries
> Most common accident: Overexertion and bodily reaction
> Median annual wage: $31,440
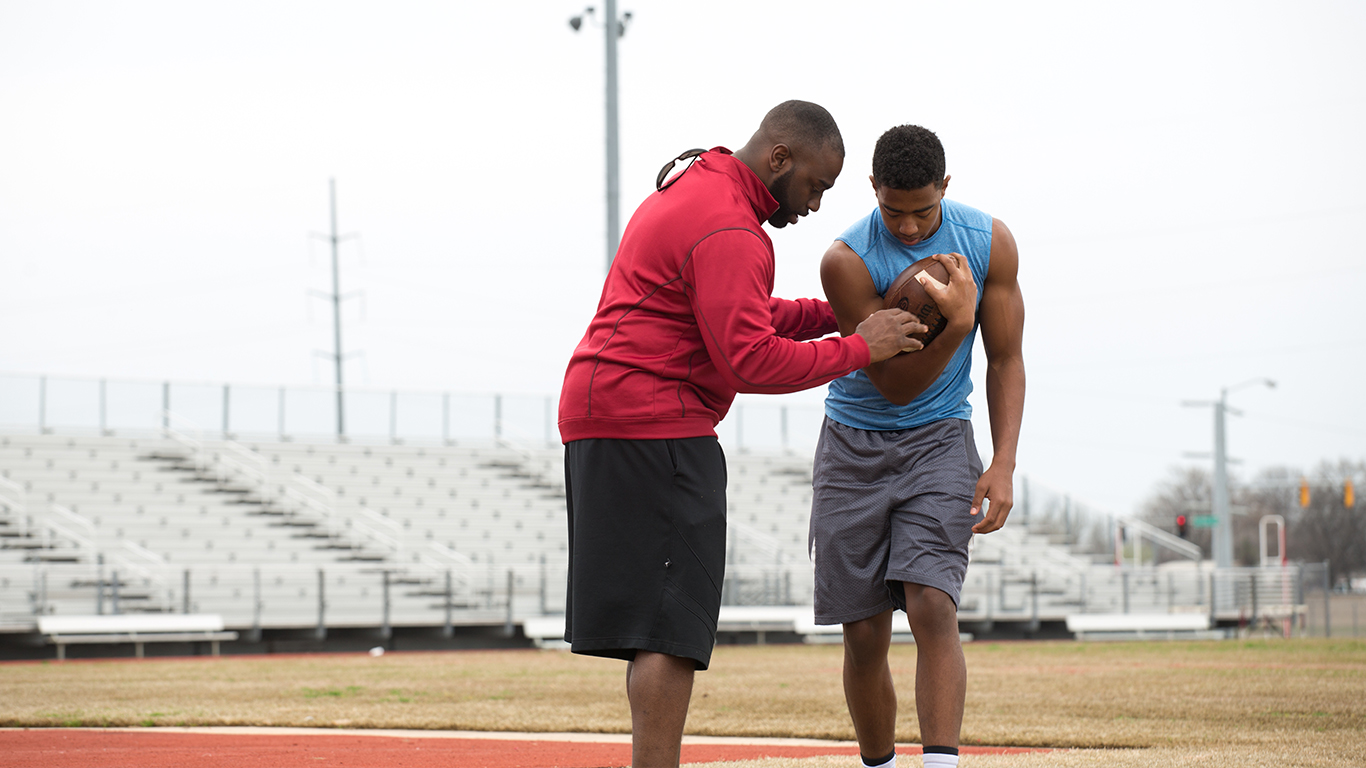
Few would likely find it surprising that injuries are relatively common in the field of professional sports. More surprising is the likelihood of an injury resulting in a fatality. Athletes, coaches, and umpires are at greater risk of a fatal injury than the vast majority of workers in the United States. There were 11.7 deaths in professional sports for every 100,000 full-time athletes and coaches in 2016 — a higher rate than in all but 19 other jobs.
Many fatalities in the industry likely occur during dangerous and extreme sporting events. For example, about 40% of deaths on the job in 2016 involved motorized off-road vehicles.
[in-text-ad]
19. Telecommunications line installers and repairers
> Fatal injuries in 2016: 12.1 per 100,000 workers
> Total: 21 fatal injuries, 2,480 nonfatal injuries
> Most common accident: Overexertion and bodily reaction
> Median annual wage: $52,590
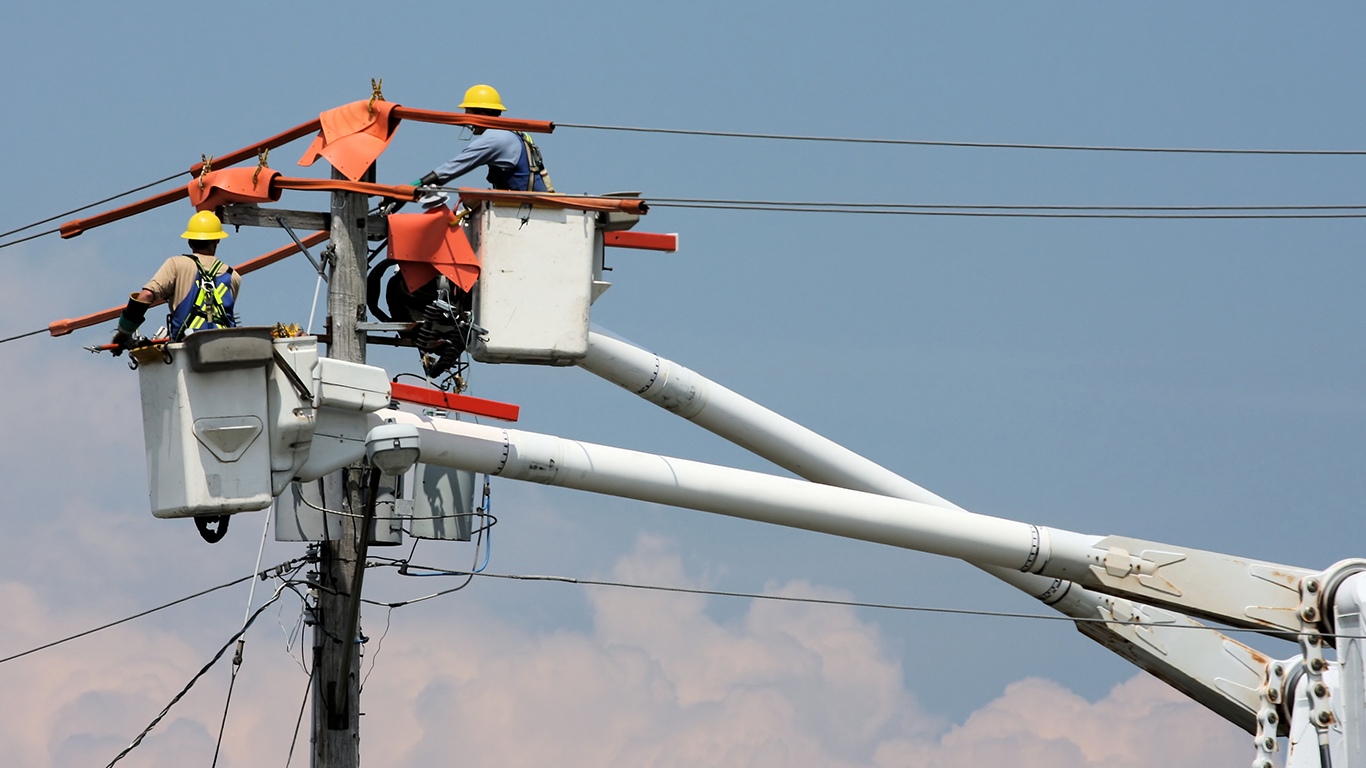
In 2016, 12.1 in every 100,000 full-time telecommunications line installers and repairers died on the job, more than three times the national rate of 3.6 occupational fatalities per every 100,000 U.S. workers. Workers who install and repair telecommunication lines often perform their jobs in dangerous heights. While falls, slips, and trips accounted for 29% of all fatalities for telecommunications line installers and repairers, car accidents accounted for 43% of all fatalities in the profession.
While just 0.8% of on the job injuries resulted in death, telecommunications line installers and repairmen suffer more serious nonfatal injuries than most U.S. workers. The typical injury in 2016 required 36 days off to recover, four times the national median.
18. First-line supervisors of landscaping, lawn service, and groundskeeping workers
> Fatal injuries in 2016: 13.2 per 100,000 workers
> Total: 30 fatal injuries, 1,320 nonfatal injuries
> Most common accident: Overexertion and bodily reaction
> Median annual wage: $45,740
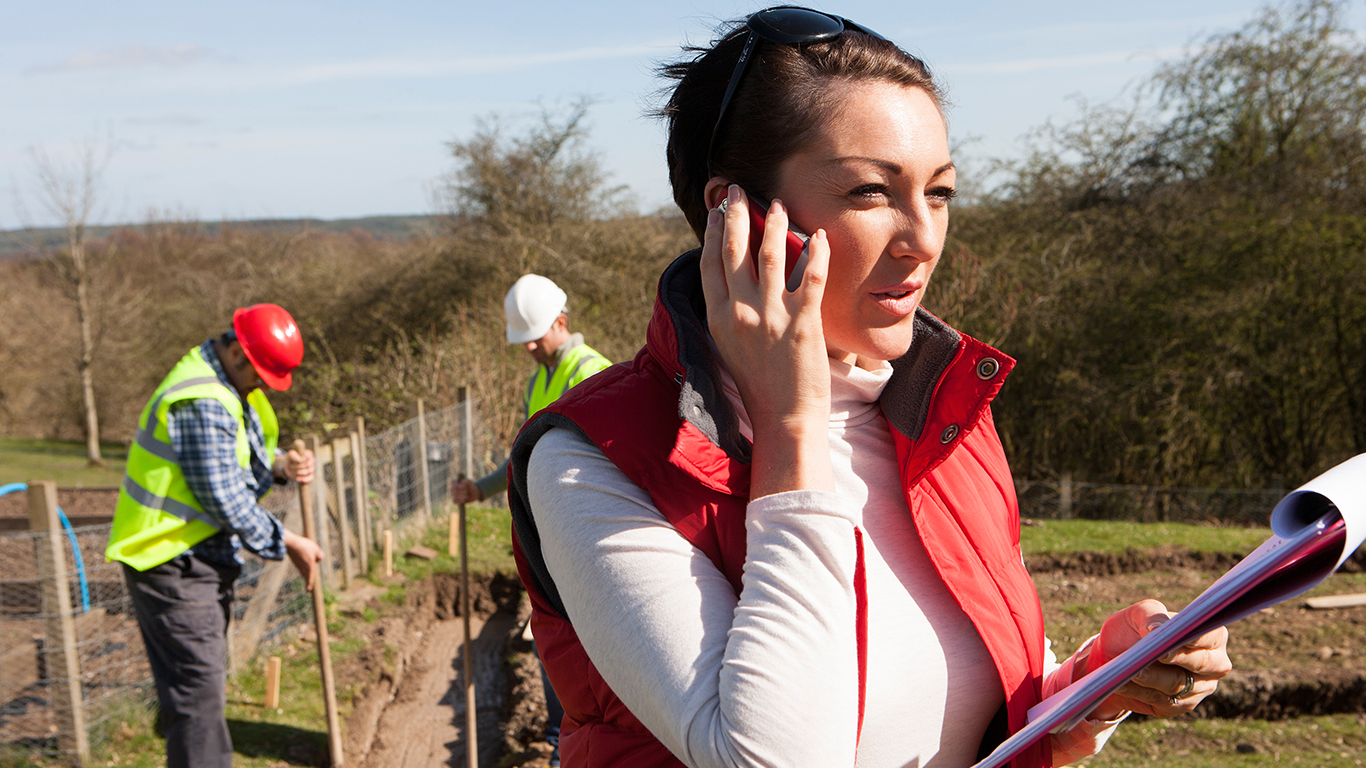
Grounds maintenance work is one of the most dangerous jobs in the United States, and on-site managers are not much safer. There were 13.2 fatalities for every 100,000 full-time supervisors of landscaping and groundskeeping workers in 2016 — while slightly fewer than the 17.4 per 100,000 fatality rate among groundskeepers, still among the most dangerous jobs. Such jobs frequently require the use of powerful — and often sharp — machinery such as chainsaws and tractors. Not surprisingly, one-third of all deaths on the job are the result of unintended contact with objects and equipment.

17. Taxi drivers and chauffeurs
> Fatal injuries in 2016: 13.2 per 100,000 workers
> Total: 60 fatal injuries, 2,730 nonfatal injuries
> Most common accident: Roadway incidents
> Median annual wage: $24,300
Whether people realize it or not, getting into a car is one of the most dangerous things people do every day. Some Americans, namely those working as taxi drivers and chauffeurs, spend half of their waking hours behind the wheel during the work week. There were 13.2 deaths on the job for every 100,000 full-time taxi drivers and chauffeurs in 2017.
In addition to the inherent risks of collisions on the roadway, taxi drivers also need to worry about potential altercations with their clients — who in most cases are complete strangers. Some 43.3% of workplace deaths for full-time taxi drivers and chauffeurs in 2016 were attributable to violence at the hands of another individual. Half of all deaths were roadway collisions.
[in-text-ad-2]
16. Maintenance and repair workers, general
> Fatal injuries in 2016: 13.4 per 100,000 workers
> Total: 75 fatal injuries, 27,900 nonfatal injuries
> Most common accident: Overexertion and bodily reaction
> Median annual wage: $36,940
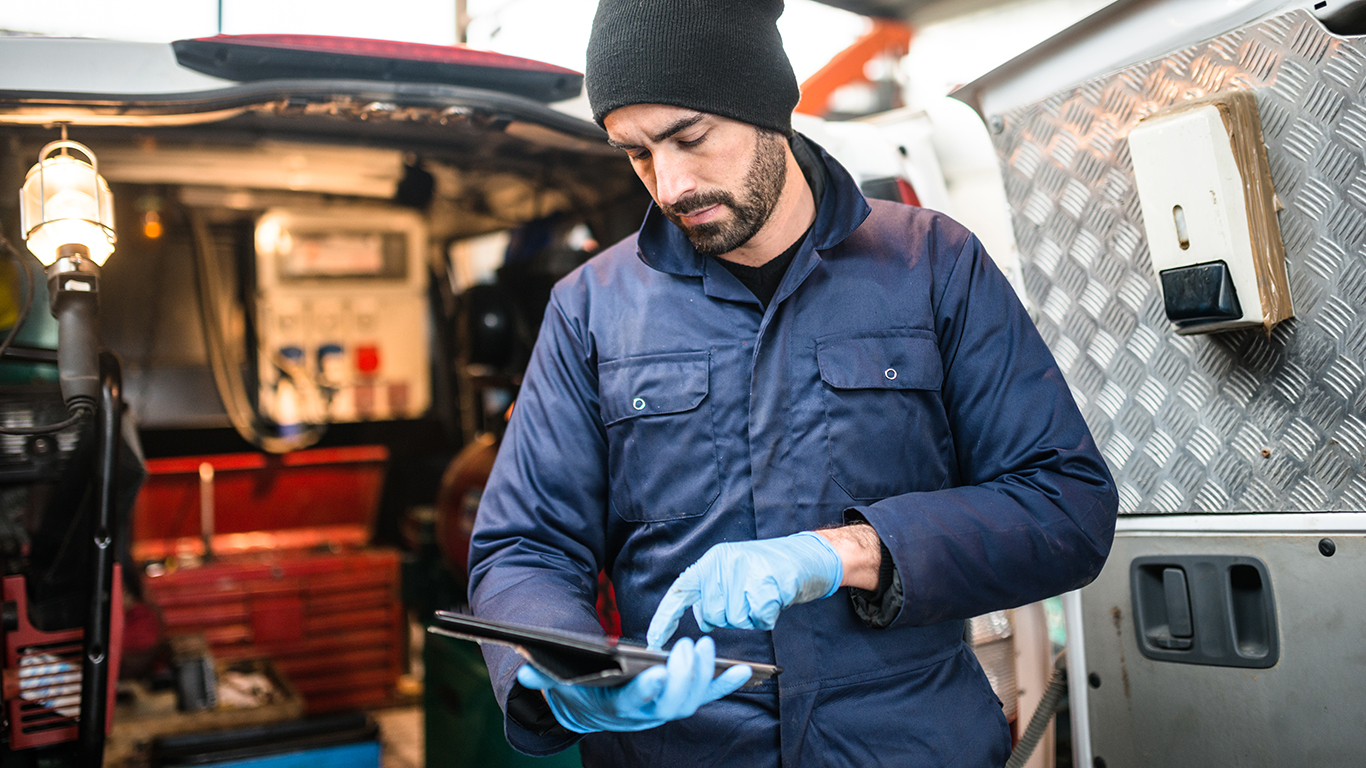
General maintenance and repair workers often work on multiple tasks throughout a single day — which can include fixing mechanical equipment, repairing flooring, and working on plumbing, electrical, and air-conditioning systems. Repairers often work in uncomfortable and cramped positions, and they are at a greater than typical risk of suffering electrical shocks, falls, cuts, and bruises.
Falls, slips, and trips account for 45% of all fatal injuries in the profession, the most of any type of accident. Nonfatal injuries, however, are far more common. General maintenance repair workers suffered 13 fatalities and 5,110 nonfatal injuries per 100,000 workers in 2016, each among the most of any profession per capita.

15. Electrical power-line installers and repairers
> Fatal injuries in 2016: 14.6 per 100,000 workers
> Total: 21 fatal injuries, 1,710 nonfatal injuries
> Most common accident: Overexertion and bodily reaction
> Median annual wage: $68,010
There were nearly 15 work related deaths for every 100,000 full-time electrical power-line installers and repairers in 2016 — more than in all but 14 other occupations. It is likely not surprising that workers dealing with high voltage power lines, often at great heights, are at increased risk of a fatal workplace accident.
Even nonfatal injuries for workers in the field are often serious. nonfatal injuries typically result in 20 days out of work, more than double the amount of time typical across all occupations. There were 1,710 nonfatal injuries on the job in 2016 — 8.8% of which were the result of falls from one-story or higher.
[in-text-ad]

14. Police and sheriff’s patrol officers
> Fatal injuries in 2016: 14.6 per 100,000 workers
> Total: 108 fatal injuries, 28,740 nonfatal injuries
> Most common accident: Intentional injury by other person
> Median annual wage: $59,680
Some 108 police and sheriff’s patrol officers died in action in 2016, the most of any year since 2011 and among the most of any profession when adjusted for the number of people in the profession. The most common cause of death on the job were intentional shootings, which claimed the lives of 46 officers last year. Almost as many officers died in car accidents.
Police officers also suffered 28,740 nonfatal injuries, which required a median of nine days off to recover — on day more than the national median recovery time. Police officers often work around the clock, and 1.6% of nonfatal injuries in 2016 occurred at least 12 hours into an officer’s shift.

13. Construction laborers
> Fatal injuries in 2016: 15.1 per 100,000 workers
> Total: 254 fatal injuries, 24,650 nonfatal injuries
> Most common accident: Struck by object
> Median annual wage: $33,430
There were 254 deaths on the job among construction workers in 2016 — or 15.1 deaths per 100,000 full-time construction workers. Construction workers often work at great heights on scaffolding, and over one-third of those deaths were caused by slips and falls. Many who work in construction also interact with heavy equipment and powerful tools on a daily basis — and over one-quarter of construction worker deaths in 2016 were caused by unintentional contact with equipment.
Nonfatal injuries are also relatively common among construction laborers, totaling 24,650 in 2016 alone. Injuries to the hand were the most common, followed closely by back injuries.
12. First-line supervisors of mechanics, installers, and repairers
> Fatal injuries in 2016: 15.7 per 100,000 workers
> Total: 44 fatal injuries, 4,140 nonfatal injuries
> Most common accident: Struck by object
> Median annual wage: $63,540
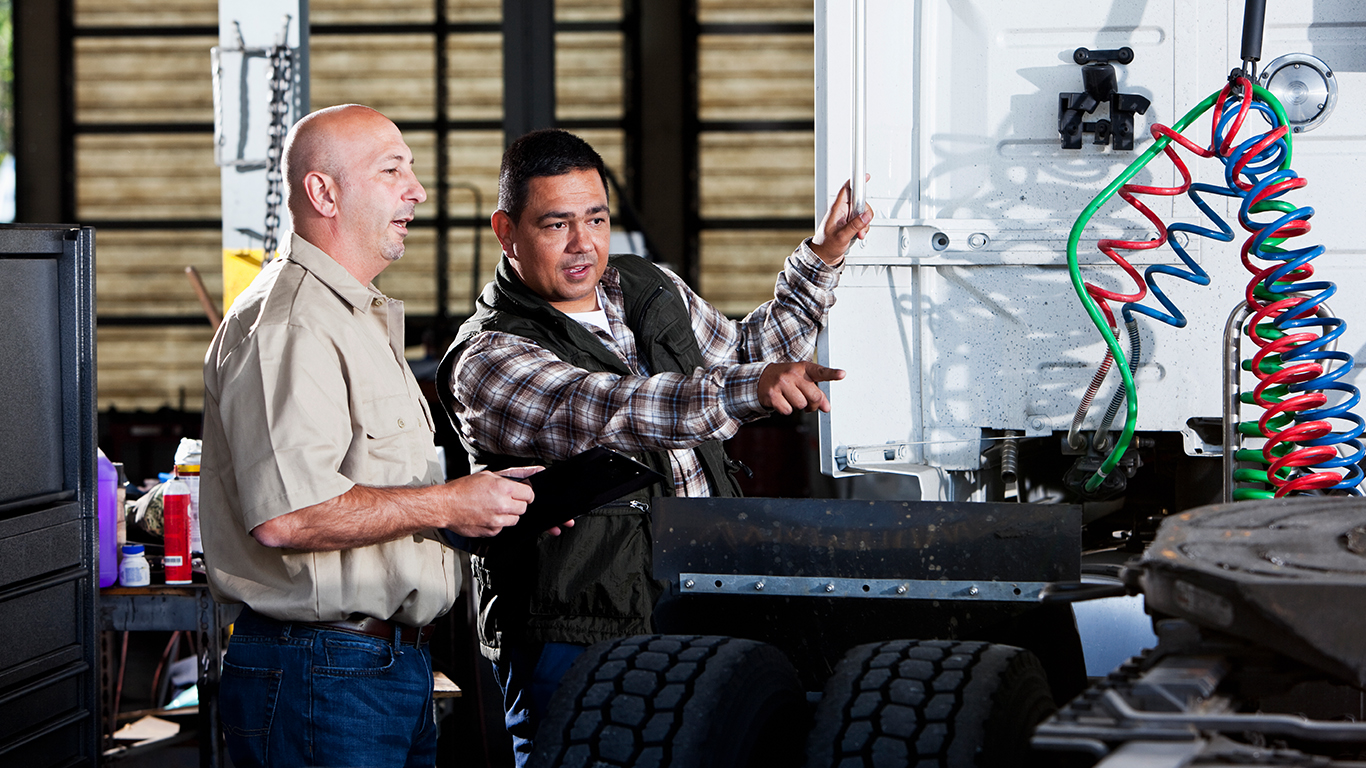
Workers who directly supervise and coordinate activities of mechanics, installers, and repairers have one of the most dangerous jobs in the country. Approximately 16 in every 100,000 full-time first-line supervisors of mechanics, installers, and repairers died on the job in 2016, four times the national rate of 3.6 deaths in every 100,000 American workers. The most common cause of fatal injury was violence from another person or animal, which claimed 16 of the 44 lives lost in the profession in 2016. The leading cause of nonfatal injury, however, was from contact with objects — being struck by or against an object or being caught in machinery.
[in-text-ad-2]
11. Grounds maintenance workers
> Fatal injuries in 2016: 17.4 per 100,000 workers
> Total: 217 fatal injuries, 20,100 nonfatal injuries
> Most common accident: Struck by object
> Median annual wage: $26,830
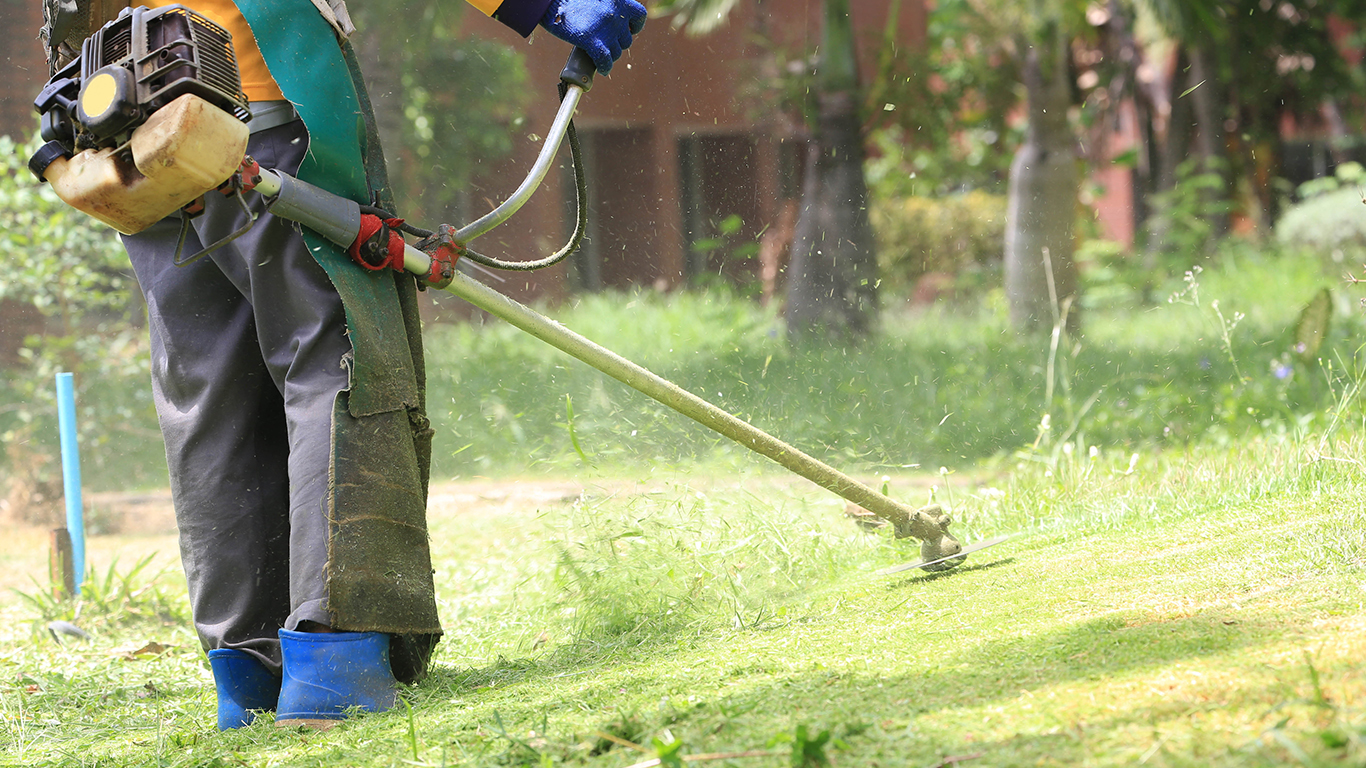
Groundskeeping is typically a physically demanding job, performed outdoors in all weather conditions. Fatalities on the job are caused by a range of accidents — from slips and falls to unintentional contact with equipment. There were 17.4 fatalities for every 100,000 people working as groundskeepers in 2016 — a higher workplace fatality rate than all but 10 other occupations.
Groundskeepers often work with sharp tools such as saws and hedge trimmers. After muscle soreness, cuts and lacerations are the most common nonfatal injury in the field.

10. Miscellaneous agricultural workers
> Fatal injuries in 2016: 17.4 per 100,000 workers
> Total: 156 fatal injuries, 12,710 nonfatal injuries
> Most common accident: Struck by object
> Median annual wage: $22,520
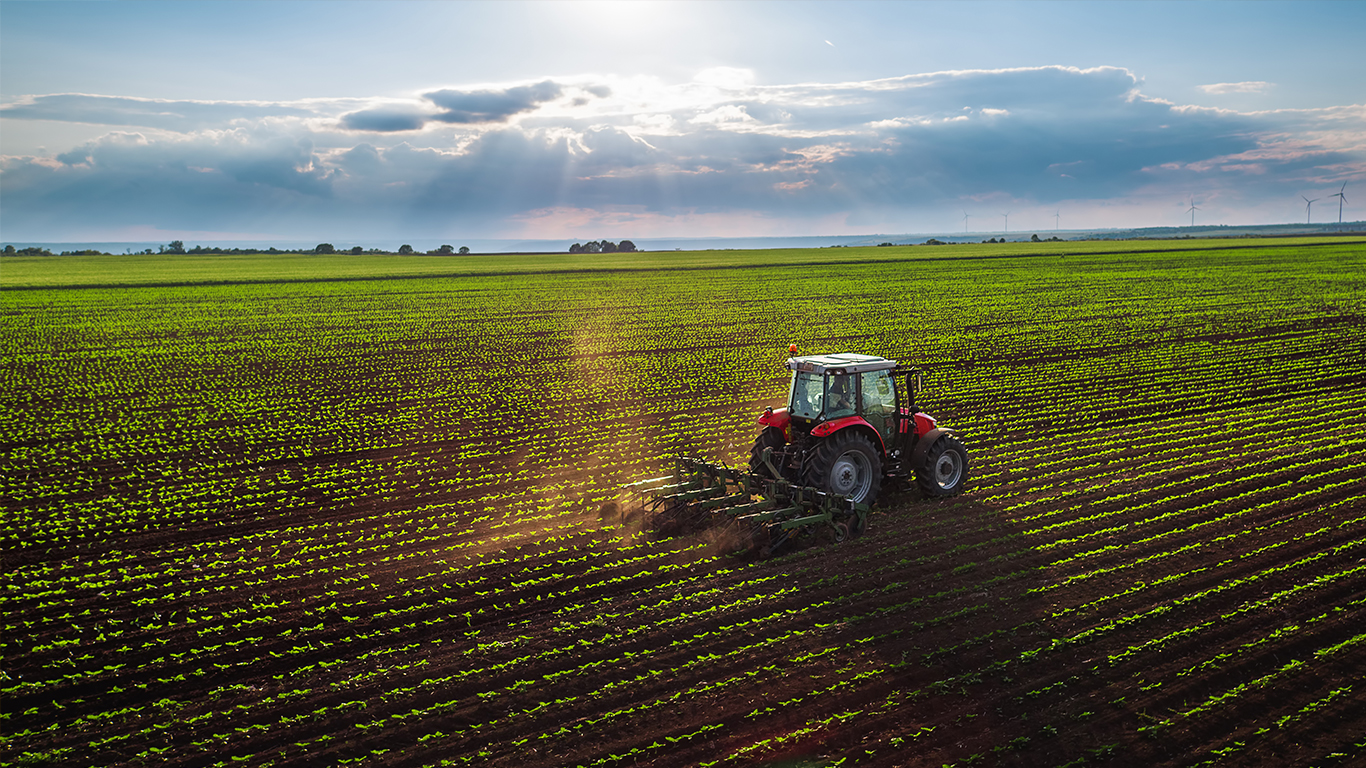
Approximately half of all fatal injuries affecting miscellaneous agricultural workers were caused by transportation incidents — many of which involved motorized off road vehicles such as tractors. The occupation also results in a relatively large amount of nonfatal injuries at 1,526 for every 100,000 workers — nearly double the comparable national rate. In addition to being a dangerous job, miscellaneous agricultural workers are the lowest paid of all the jobs on our list. The median annual earnings for someone in this profession is $22,520.
[in-text-ad]
9. First-line supervisors of construction trades and extraction workers
> Fatal injuries in 2016: 18.0 per 100,000 workers
> Total: 134 fatal injuries, 6,090 nonfatal injuries
> Most common accident: Falls, slips, and trips
> Median annual wage: $62,980
Construction can be a dangerous industry, and job site supervisors appear to be at greater risk of a fatal accident than the typical laborer. There were 18.0 workplace deaths for every 100,000 full-time construction and extraction supervisors in 2016 — compared to 15.1 deaths per 100,000 construction laborers. Construction supervisors often work on roadways, and 12.7% of fatalities in 2016 were the result of being hit by a car.
Nonfatal injuries are also relatively common for construction supervisors. Of the 6,090 nonfatal injuries in the field in 2016, 1 in 5 were the result of being struck by a falling or swinging object, and another fifth were the result of a fall from one story or higher.

8. Farmers, ranchers, and other agricultural managers
> Fatal injuries in 2016: 23.1 per 100,000 workers
> Total: 260 fatal injuries
> Most common accident: Falls, slips, and trips
> Median annual wage: $66,360
As with miscellaneous agricultural workers, a large portion of fatal injuries affecting farmers, ranchers, and other agricultural managers — 44.6% — result from incidents involving motorized vehicles. However, these workers fare better than others with regards to nonfatal injuries. Nearly half of such injuries occur due to falls, slips, and trips and require just two days away from work — the shortest recovery time among all the occupations on this list.

7. Driver/sales workers and truck drivers
> Fatal injuries in 2016: 24.7 per 100,000 workers
> Total: 918 fatal injuries, 80,180 nonfatal injuries
> Most common accident: Overexertion and bodily reaction
> Median annual wage: $36,670
Most of the driver/sales workers and truck drivers are delivery drivers who spend much of their time on the road, driving both light and heavy trucks. Therefore, it is perhaps unsurprising that 80% of fatal injuries in this occupation result from motor vehicle accidents. There were 24.7 fatal injuries per 100,000 workers in 2016 in this relatively large field, which employs nearly 3 million drivers — the most workers of all the most dangerous jobs.
[in-text-ad-2]
6. Structural iron and steel workers
> Fatal injuries in 2016: 25.1 per 100,000 workers
> Total: 16 fatal injuries, 1,440 nonfatal injuries
> Most common accident: Struck by object
> Median annual wage: $51,800
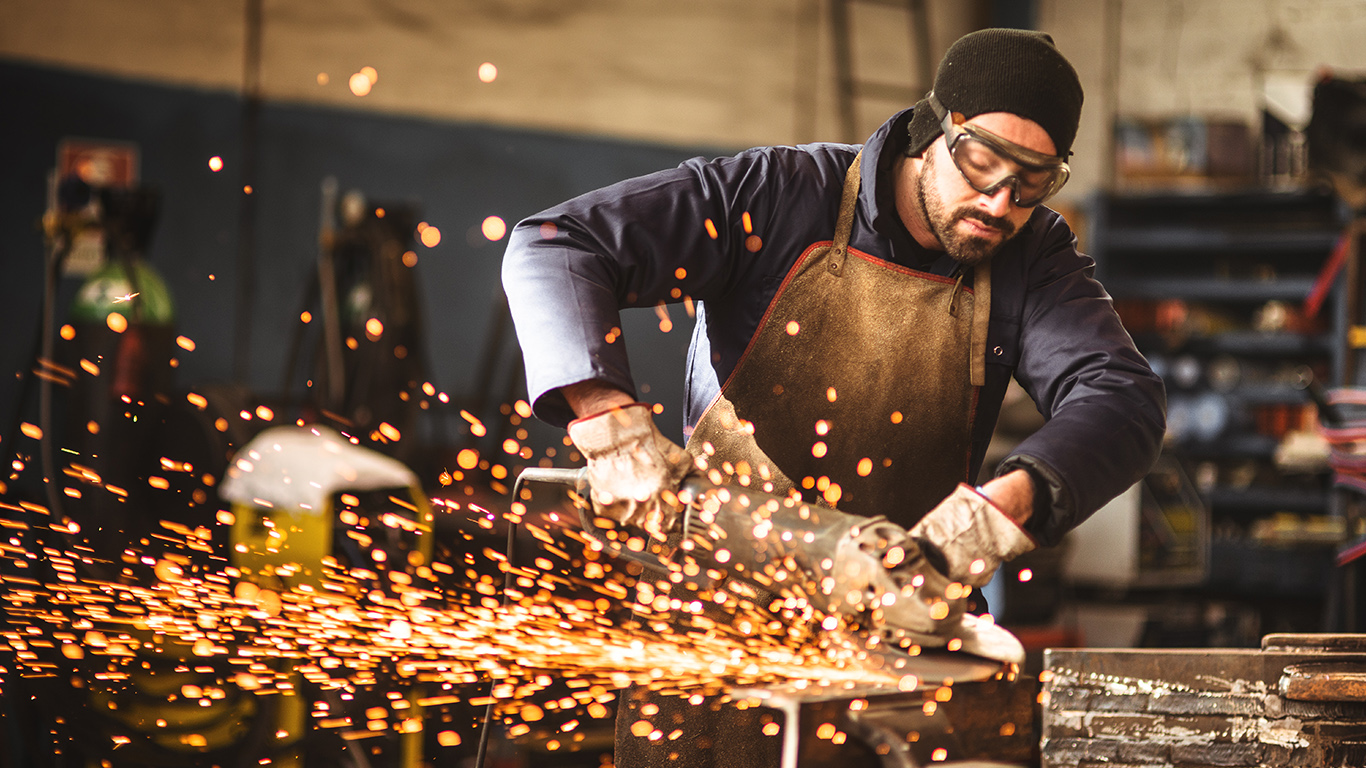
Structural iron and steel workers often work on buildings and bridges, raising, placing, and uniting “iron or steel girders, columns, and other structural members to form completed structures or structural frameworks,” according to the BLS. Because much of the work in the industry is done at extreme heights, a fall, slip, or trip can be deadly, and such accidents account for 56.3% of all fatal injuries. The most common cause of nonfatal injuries is workers being struck by objects.

5. Refuse and recyclable material collectors
> Fatal injuries in 2016: 34.1 per 100,000 workers
> Total: 31 fatal injuries, 6,170 nonfatal injuries
> Most common accident: Falls, slips, and trips
> Median annual wage: $35,270
Slips and falls are a relatively common hazard among refuse and recyclable material collectors — accounting for nearly one-third of the 6,170 non-fatal injuries on the job in 2016.
The most common cause of fatalities, however, is transportation incidents, which account for 67.7% of deaths. While many of these accidents involve the collectors’ trucks, 29% are classified as “pedestrian vehicular incidents,” which includes accidents in which a worker is struck by someone’s car.
[in-text-ad]
4. Roofers
> Fatal injuries in 2016: 48.6 per 100,000 workers
> Total: 101 fatal injuries, 3,150 nonfatal injuries
> Most common accident: Falls, slips, and trips
> Median annual wage: $37,760
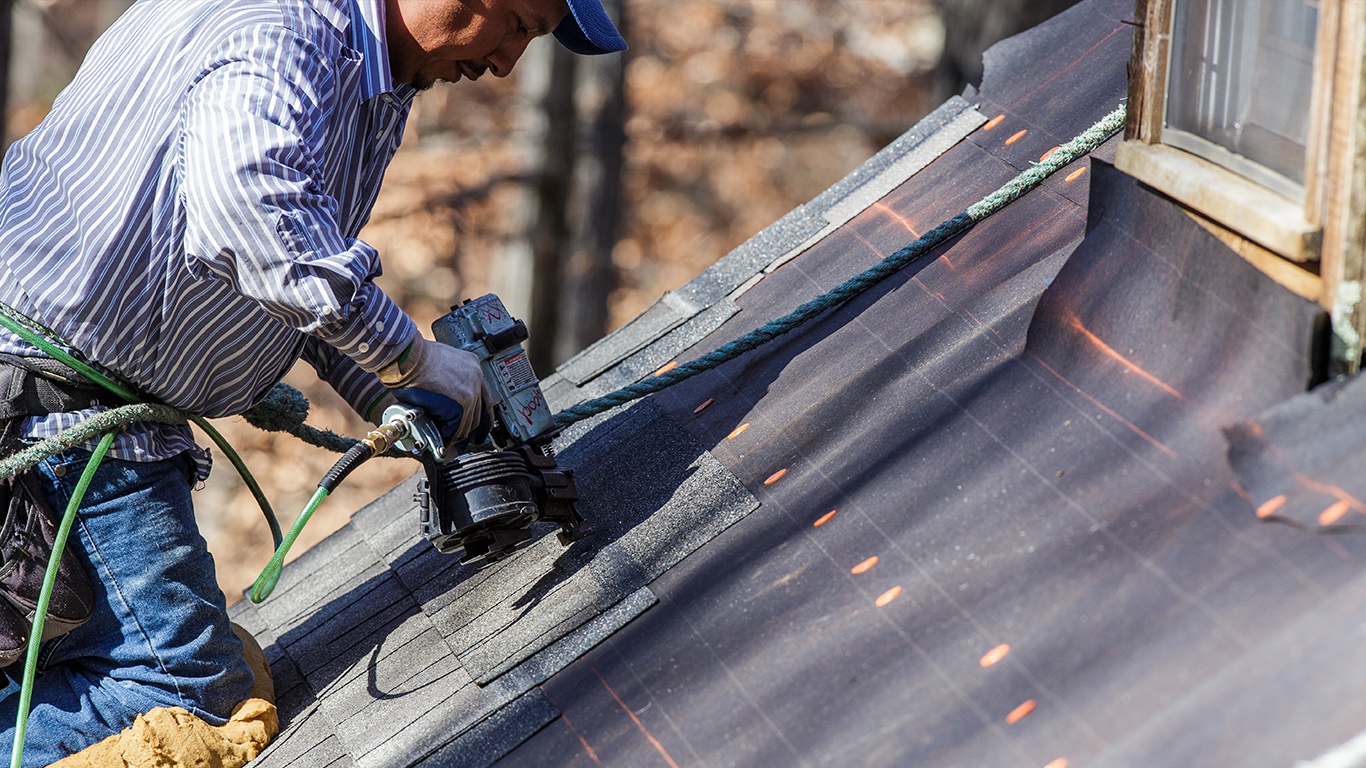
Roofing work “involves heavy lifting, as well as climbing, bending, and kneeling, frequently in very hot weather,” according to the BLS. At least some of the time this work takes place on rooftops, so there are bound to be serious accidents — and 26.7% of non-fatal accidents are falls to a lower level. Injured roofers spend a median of 20 days away from work following an injury, a relatively long recovery compared to most other jobs. A vast majority of fatal accidents that occur on the job — 80.2% — are also categorized as general falls, slips, and trips.

3. Aircraft pilots and flight engineers
> Fatal injuries in 2016: 55.5 per 100,000 workers
> Total: 75 fatal injuries, 470 nonfatal injuries
> Most common accident: Overexertion and bodily reaction
> Median annual wage: $105,720
The most common injury for aircraft pilots and flight engineers is overexertion and bodily reaction. Pilots specifically have inconsistent work schedules that often involve overnight layovers. The job can be demanding, and exhaustion is a risk.
While flying is statistically the safest way to travel, it is not without some risk. Some 75 pilots and flight engineers died in 2016 — each death was due to an accident while in transit.

2. Fishers and related fishing workers
> Fatal injuries in 2016: 86.0 per 100,000 workers
> Total: 24 fatal injuries
> Most common accident: N/A
> Median annual wage: $27,110
Commercial fishing can be a hazardous undertaking, as it is largely physical work. Fishers and related fishing workers can also be exposed to environmental factors such as extreme weather that people in other fields may not be exposed to. In addition, workers may be out on the water or working from a remote area when an accident occurs, and easy access to a hospital or medical professional may not be readily available.There were 86 deaths for every 100,000 full-time workers in the field in 2016, the second most of any job.
[in-text-ad-2]
1. Logging workers
> Fatal injuries in 2016: 135.9 per 100,000 workers
> Total: 91 fatal injuries, 900 nonfatal injuries
> Most common accident: Struck by object
> Median annual wage: $37,590
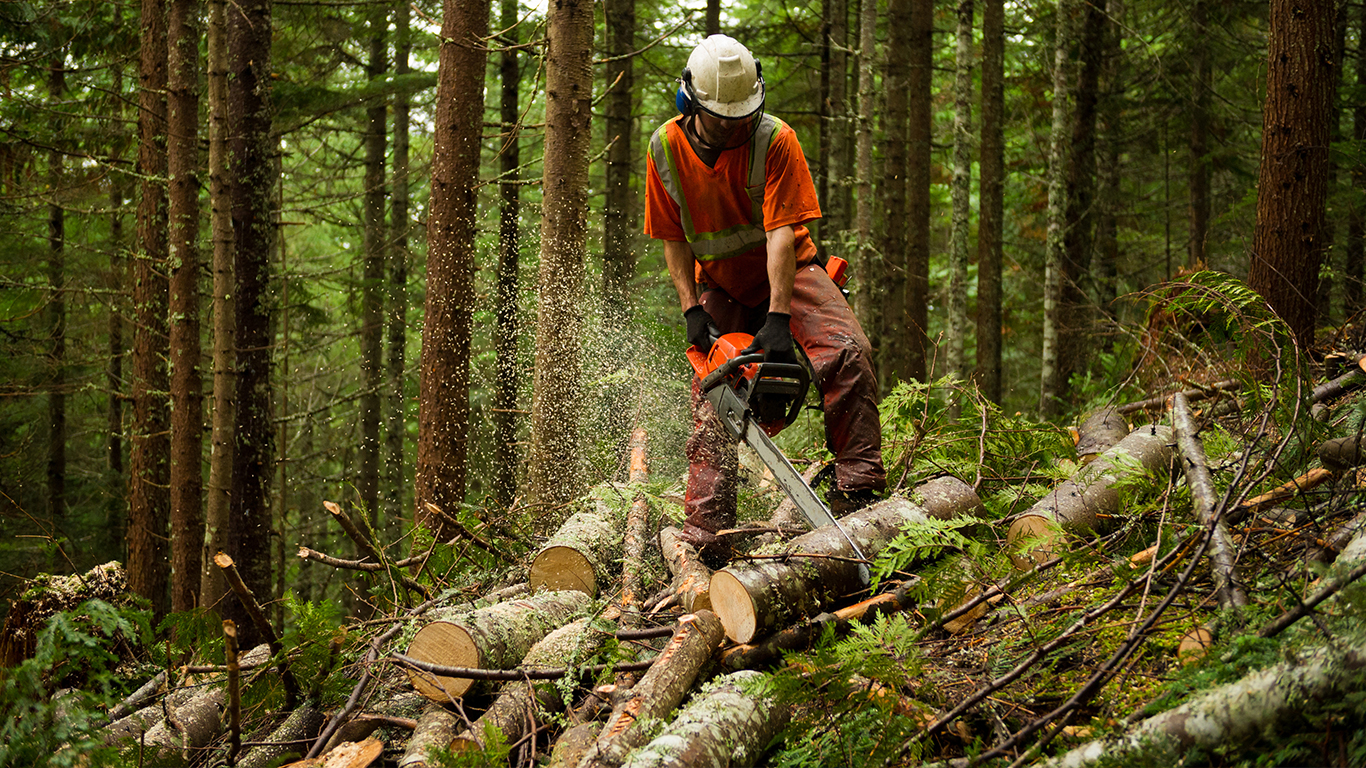
Logging is physically very demanding, and like commercial fishing, the location of the work is primarily outdoors and often in remote areas, far from medical aid. The most common accident is when a worker is struck by an object, such as a log or falling branch. Logging workers also deal with dangerous machinery such as harvesters and chainsaws. There were nearly 50 more fatal injuries per 100,000 logging workers in 2016 than the second most dangerous job. Based on the occupational fatality rate, logging is the most dangerous job in the country and about 38 times more dangerous than the typical job.
Whether Americans realize it or not, getting into a car is perhaps the most dangerous thing most of us do on a daily basis. Nearly 37,500 Americans died in car accidents in 2016. Travel is also the most dangerous aspect of many of the jobs on this list. For taxi drivers, chauffeurs, truck drivers, and garbage collectors, transportation incidents accounted for at least half of all work related fatalities in 2016.
In several other jobs on this list, slips and falls account for a considerable share of deadly accidents. Roofers, structural iron and steelworkers, painters, repair workers, and construction laborers often work at great heights. For each of those jobs, falls accounted for at least one-third of deadly accidents in 2016.
In other occupations, the tools of the trade can be the biggest threat to worker safety. Often using powerful saws and other heavy equipment, logging workers, industrial machine repairers, and supervisors of groundskeeping workers all rank among the most dangerous professions. In each of these jobs, inadvertent contact with equipment accounts for at least one-third of all fatal workplace accidents.
For some occupations on this list, putting oneself in harm’s way is an explicit part of the job description. Police officers have one of the highest workplace mortality rates in the country and over half of all police deaths are the result of a violent incident with another person.
In addition to fatal accidents, those working in the jobs on this list tend to be at an elevated risk of serious nonfatal injuries. With only a few exceptions, the nonfatal injury rates among the jobs on this list are well above the national rate of 783 nonfatal injuries per 100,000 full-time workers.
To determine the 25 most dangerous jobs, 24/7 Wall St. reviewed fatal injury rates for 62 occupations from the Bureau of Labor Statistics’ Census of Fatal Occupational Injuries. Injury rates were calculated as the number of fatal occupational injuries per 100,000 full-time equivalent workers, where a full-time worker is equivalent to 2,000 hours worked by an employee during the calendar year, and are for 2016. Data on median annual wages and total employment came from the Occupational Employment Statistics program of the BLS and are as of May 2016. Data on nonfatal injury came from the Injuries, Illnesses, and Fatalities program of the BLS and are for 2016.
Start by taking a quick retirement quiz from SmartAsset that will match you with up to 3 financial advisors that serve your area and beyond in 5 minutes, or less.
Each advisor has been vetted by SmartAsset and is held to a fiduciary standard to act in your best interests.
Here’s how it works:
1. Answer SmartAsset advisor match quiz
2. Review your pre-screened matches at your leisure. Check out the advisors’ profiles.
3. Speak with advisors at no cost to you. Have an introductory call on the phone or introduction in person and choose whom to work with in the future
Get started right here.
Thank you for reading! Have some feedback for us?
Contact the 24/7 Wall St. editorial team.