Special Report
The Worst States for Hispanics and Latinos

Published:
Last Updated:

The United States is the most popular destination for immigrants in the world. As such, the nation’s demographic composition is anything but static. Comprising over 17% of the total U.S. population, Hispanics and Latinos are one of the largest and fastest growing groups in the United States.
Immigration trends in the United States, which have often been shaped by federally imposed immigration restrictions and quotas, can be broken down into discrete periods. From about 1815 to 1865, the majority of immigrants to the United States hailed from countries in Northern and Western Europe. Between 1880 and 1920, the majority of new arrivals came from Central, Eastern, and Southern Europe. Today, the majority of immigrants to the United States come from Latin America.
As recently as 1980, the United States was home to some 14.8 million people of Hispanic or Latino descent. Today, more than 55.9 million Americans identify as Hispanic and Latino. Even as the Hispanic and Latino birth rate has slowed in recent years, the demographic accounted for 54% of the total U.S. population growth between 2000 and 2014 — according to the nonpartisan think tank, Pew Research Center.
Every ethnic group faces challenges upon settling in the United States. Cultural differences, language barriers, and xenophobia can all hinder socioeconomic progress for the newest Americans — and Hispanics and Latinos are no exception.
Nationwide, Hispanic and Latinos are more than twice as likely to live below the poverty line than white Americans and are less than half as likely to have a bachelor’s degree. These outcomes are not uniform coast to coast, however, and in some states, inequality between whites and Hispanics is far more pronounced. 24/7 Wall St. reviewed a range of data related to income, homeownership, education, and incarceration to identify the worst states for Hispanics and Latinos.
Click here to see the worst states for Hispanics and Latinos.
Click here to see our detailed findings and methodology.

50. West Virginia
> Pct. residents Hispanic: 1.4% (the lowest)
> Homeownership rate: 44.1% (Hispanic), 74.2% (white)
> Unemployment rate: N/A, 6.0% (white)
> Incarcerated people per 100,000: 4,585 (Hispanic), 622 (white)
The socioeconomic disparities between white and Hispanic Americans are smaller in West Virginia than in any other state. While on a national scale the typical white household earns over $16,000 more than the typical Hispanic household, in West Virginia white households earn $5,487 more than Hispanic households — the smallest income gap of any state. The typical white household in the state earns $43,849 a year compared to $38,362 the typical Hispanic household does. West Virginia also has one of the smaller gaps in education attainment between the two demographics. Nationwide, 35.0% of white adults and 15.3% of Hispanic adults have a bachelor’s degree — a difference of 20 percentage points. In West Virginia, 20.5% of white adults and 17.1% of Hispanic adults have a bachelor’s degree, one of the smallest gaps of any state.
[in-text-ad]

49. New Mexico
> Pct. residents Hispanic: 47.8% (the highest)
> Homeownership rate: 65.5% (Hispanic), 72.0% (white)
> Unemployment rate: 6.5% (Hispanic), 5.4% (white)
> Incarcerated people per 100,000: 980 (Hispanic), 659 (white)
Nearly one-half of New Mexico’s population identifies as Hispanic or Latino, the largest share of any state in the country. Partially as a result, about 1 in every 3 families in the state speaks Spanish at home. Due to the prevalence of Hispanics, the state government has enacted multiple protections for Spanish speakers. For example, all ballots and voting forms in the state are printed in Spanish and English, and the inability to speak English cannot restrict anyone from serving on a jury or holding elected office.
Disparities in multiple socioeconomic outcomes between whites and Hispanics in New Mexico are not as stark as in most states. For example, the 65.5% homeownership rate among Hispanics in the state is the highest in the country, and only 6.5 percentage points below the white homeownership rate. Nationwide, the Hispanic homeownership rate is 45.5%, and it is 25.7 percentage points below the white homeownership rate.

48. Maine
> Pct. residents Hispanic: 1.5% (2nd lowest)
> Homeownership rate: 42.3% (Hispanic), 73.5% (white)
> Unemployment rate: N/A, 3.9% (white)
> Incarcerated people per 100,000: 407 (Hispanic), 259 (white)
While nationwide 92.5% of white adults and 67.1% of Hispanic adults have a high school diploma, in Maine the achievement gap between the two demographics is the smallest of any state. While a comparable 92.6% of white adults in Maine graduated from high school, a much higher 88.9% of Hispanic adults in the state have, only a 3.7 percentage points gap and the second largest Hispanic high school graduation rate of any state. Maine also has the second smallest gap in bachelor’s attainment rate of any state as well as relatively small disparities in poverty, income, and incarceration.
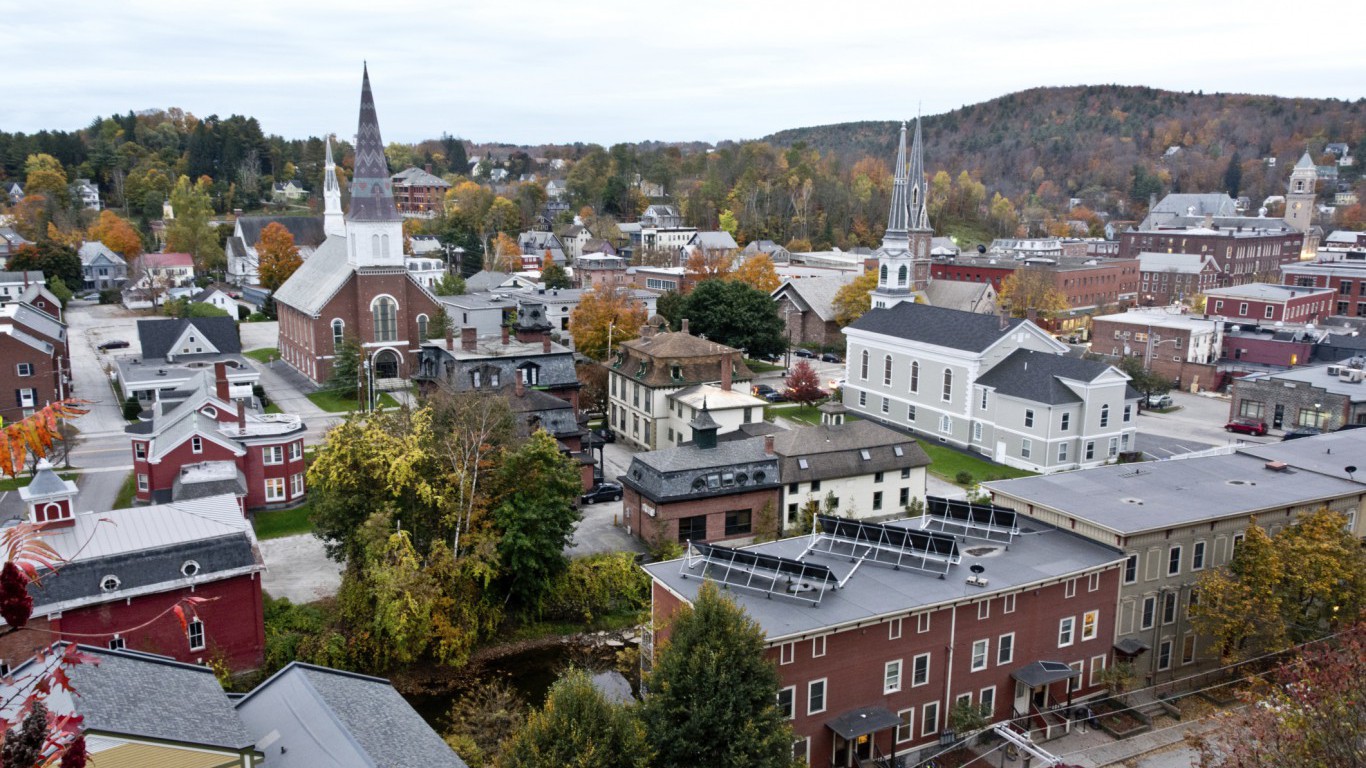
47. Vermont
> Pct. residents Hispanic: 1.7% (3rd lowest)
> Homeownership rate: 39.4% (Hispanic), 71.0% (white)
> Unemployment rate: N/A, 3.2% (white)
> Incarcerated people per 100,000: 891 (Hispanic), 220 (white)
Vermont has the highest Hispanic bachelor’s attainment rate and the smallest gap in college attainment of any state. Some 35.5% of Hispanic adults in Vermont have a bachelor’s degree, just 1 percentage point less than the 36.5% of white adults in the state who do. Nationwide, 35.0% of white Americans and 15.3% of Hispanic Americans have a bachelor’s degree — a 20 percentage point gap. Similarly, Vermont has the second smallest gap in high school attainment between the two demographics.
While Vermont has one of the smallest disparities of any state, it is a relatively unpopular destination for immigrants from Spanish-speaking countries. In 2016, just 60 residents from Mexico, South America, and Cuba obtained green cards in the state, the fourth least of any state when adjusted for population.
[in-text-ad-2]

46. Hawaii
> Pct. residents Hispanic: 10.0% (20th highest)
> Homeownership rate: 41.0% (Hispanic), 56.3% (white)
> Unemployment rate: 4.3% (Hispanic), 3.4% (white)
> Incarcerated people per 100,000: 415 (Hispanic), 412 (white)
While Hispanic and Latino Americans comprise 17% of the U.S. population, they make up 19% of the total prison population. In Hawaii, however, Hispanics represent 10% of the population and just 9% of the prison population. Hawaii also has relatively small gaps in homeownership, high school attainment, and poverty between whites and Hispanics. Some 10.8% of Hispanic residents in Hawaii live in poverty, the smallest share of any state and just 2.2 percentage points higher than the 8.6% white poverty rate. Nationwide, 21.0% of Hispanic Americans and 10.0% of white Americans live in poverty — an 11.0 percentage point gap.

45. Louisiana
> Pct. residents Hispanic: 4.8% (14th lowest)
> Homeownership rate: 42.6% (Hispanic), 74.9% (white)
> Unemployment rate: 3.8% (Hispanic), 4.3% (white)
> Incarcerated people per 100,000: 1,114 (Hispanic), 675 (white)
Louisiana is one of only five states where Hispanics and Latinos are less likely to be jobless than white residents. Only 3.8% of the state’s Hispanic labor force is out of a job compared to 4.3% of the white labor force. Nationwide, unemployment among Hispanics is 5.8% — well above the 4.3% white unemployment rate. Likely due in part to stronger employment, the state’s 22.2% Hispanic poverty rate is only 9.8 percentage points higher than the white poverty rate, lower than the 11.0 percentage point gap nationwide.
[in-text-ad]

44. Alaska
> Pct. residents Hispanic: 6.7% (22nd lowest)
> Homeownership rate: 43.1% (Hispanic), 69.0% (white)
> Unemployment rate: 4.4% (Hispanic), 5.0% (white)
> Incarcerated people per 100,000: 650 (Hispanic), 370 (white)
While nationwide 5.8% of the Hispanic workforce and 4.3% of the white workforce is unemployed, in Alaska the Hispanic unemployment rate of 4.4% is lower than the white jobless rate of 5.0% — one of five states in which Hispanic-white unemployment disparity is reversed. Alaska also has one of the smaller gaps in educational attainment between the groups of any state. High school educational attainment in Alaska is generally high. Some 96.0% of white adults and 82.1% of Hispanic adults have graduated from high school. The 14.0 percentage point gap is small compared to the country as a whole. Nationwide, 92.5% of white Americans and 67.1% of Hispanic Americans have a high school diploma, a 25-point gap.

43. Maryland
> Pct. residents Hispanic: 9.2% (23rd highest)
> Homeownership rate: 47.6% (Hispanic), 76.7% (white)
> Unemployment rate: 5.4% (Hispanic), 3.1% (white)
> Incarcerated people per 100,000: 311 (Hispanic), 310 (white)
Maryland is one of the wealthiest states and has relatively little income inequality between white and Hispanic residents. Some 12.4% of Maryland’s Hispanic population lives in poverty, the second smallest share of any state and just 5.3 percentage points above the 7.1% white poverty rate. By comparison, nationwide 21.0% of Hispanic Americans and 10.0% of white Americans live in poverty — an 11 percentage point difference. Maryland also has the smallest difference in incarceration rates between the two demographics of any state.
Maryland also has one of the most diverse Hispanic populations, and Baltimore is home to a growing Latino community known as Spanish Town. The makeup of state’s Hispanic population is 31.1% Salvadoran, 8.4% Guatemalan, 5.8% Honduran, and 1.8% Bolivian, each some of the largest shares among Hispanics of any state.

42. Virginia
> Pct. residents Hispanic: 8.7% (24th lowest)
> Homeownership rate: 45.2% (Hispanic), 72.6% (white)
> Unemployment rate: 3.2% (Hispanic), 3.1% (white)
> Incarcerated people per 100,000: 482 (Hispanic), 466 (white)
While there are always gaps between Hispanic and white populations of each states, the gaps in Virginia are not as wide as is typical nationwide in several important socioeconomic measures. The Hispanic incarceration rate in Virginia of 482 prisoners per 100,000 Hispanic residents is only slightly higher than the white incarceration rate of 466 prisoners per 100,000 white residents. Nationwide, the Hispanic incarceration rate is nearly double the white incarceration rate. Additionally, unemployment among Hispanics in Virginia is only 3.2%, in line with the unemployment rate among the state’s working white residents of 3.1%.
[in-text-ad-2]

41. Tennessee
> Pct. residents Hispanic: 5.0% (15th lowest)
> Homeownership rate: 37.9% (Hispanic), 71.7% (white)
> Unemployment rate: 3.8% (Hispanic), 3.8% (white)
> Incarcerated people per 100,000: 595 (Hispanic), 503 (white)
While incarceration and unemployment rates for Hispanic Americans nationwide are higher than for whites, the socioeconomic disparities between the two demographics are smaller in Tennessee than in most states. Some 595 in every 100,000 Hispanic or Latino residents in Tennessee are in jail, just slightly higher than the white residents incarceration rate of 831 per 100,000. Nationwide, the gap is much higher, as 831 in every 100,000 Hispanic Americans are in jail compared to just 450 per 100,000 white Americans.
Tennessee is also the only state where the unemployment rate is the same among both whites and Hispanics, at 3.8%.

40. Nevada
> Pct. residents Hispanic: 27.8% (5th highest)
> Homeownership rate: 42.8% (Hispanic), 62.8% (white)
> Unemployment rate: 6.0% (Hispanic), 4.6% (white)
> Incarcerated people per 100,000: 635 (Hispanic), 604 (white)
Nevada is one of only three states in which fewer than 1 in 10 adult Hispanic residents have at least a bachelor’s degree Meanwhile, some 27.7% of the state’s adult white residents have a bachelor’s degree or higher. Still, the 18.1 percentage point difference in college attainment between the state’s white and Hispanic residents is smaller than the comparable 19.6 percentage point difference nationwide.
Income typically goes up with educational attainment, and the smaller gap in college attainment in Nevada may partially explain the smaller income gap between the groups in the state. The typical Hispanic household in the state earns $45,836 a year, about $15,300 less than the median income among white households. The difference in income between white and hispanic households nationwide is about $16,300.
[in-text-ad]

39. Missouri
> Pct. residents Hispanic: 3.9% (11th lowest)
> Homeownership rate: 52.3% (Hispanic), 71.0% (white)
> Unemployment rate: 6.5% (Hispanic), 3.7% (white)
> Incarcerated people per 100,000: 654 (Hispanic), 495 (white)
Missouri has one of the more equitable income distributions between white and Hispanic demographics of any state. Nationwide, the typical white household earns $63,155 a year, over $16,000 more than the median household income for Hispanic American households of $46,882. In Missouri, while the white median household income of $55,092 a year is nearly $12,000 higher than the Hispanic median income of $43,264, it is yet one of the smallest income gaps of any state. Missouri also has some of the smallest disparities in homeownership, high school and college attainment, and incarceration relative to the country as a whole.

38. Wisconsin
> Pct. residents Hispanic: 6.5% (19th lowest)
> Homeownership rate: 38.7% (Hispanic), 71.5% (white)
> Unemployment rate: 3.3% (Hispanic), 3.8% (white)
> Incarcerated people per 100,000: 622 (Hispanic), 416 (white)
Wisconsin is one of only five states in which unemployment is less common among Hispanics than it is among whites. Only 3.3% of the state’s Hispanic workers are out of a job compared to 3.8% of white workers.
Despite the lower unemployment, Hispanics in Wisconsin are far more likely to be poor than white state residents. The typical Hispanic household in the state earns only $42,323 a year, about $17,800 less than the typical white household. This is a larger gap than the comparable difference nationwide. The median income among Hispanic households nationwide of $46,882 a year is about $16,300 less than the median income among white households.

37. Kentucky
> Pct. residents Hispanic: 3.3% (7th lowest)
> Homeownership rate: 39.6% (Hispanic), 71.1% (white)
> Unemployment rate: 7.9% (Hispanic), 4.8% (white)
> Incarcerated people per 100,000: 1,657 (Hispanic), 705 (white)
While Kentucky is one of the poorest states, the income gap between white and Hispanic residents in the state is relatively small. The typical Hispanic household in Kentucky earns about 80% of what the typical white household earns. One factor contributing to the small income gap may be the relative educational equality in the state. Some 20.7% of Hispanic adults in Kentucky have a bachelor’s degree, the eighth largest share nationwide and only 3.2 percentage points less than the white college attainment rate of 23.9%. Nationwide, 15.3% of Hispanic adults and 35.0% of white adults have a bachelor’s degree — a difference of nearly 20 percentage points.
[in-text-ad-2]

36. Arkansas
> Pct. residents Hispanic: 7.0% (23rd lowest)
> Homeownership rate: 48.3% (Hispanic), 70.8% (white)
> Unemployment rate: 3.6% (Hispanic), 3.2% (white)
> Incarcerated people per 100,000: 915 (Hispanic), 593 (white)
Only 56.3% of Hispanic adults in Arkansas have completed high school, the second smallest Hispanic high school attainment rate of any state and well below the white residents high school attainment rate of 88.6%. A basic education can be a critical step in achieving financial stability, and a relatively large share of Hispanics in Arkansas struggle financially. An estimated 26.7% of Hispanics in the state live below the poverty line, nearly double the poverty rate of 13.7% among the state’s white residents.

35. Alabama
> Pct. residents Hispanic: 4.0% (12th lowest)
> Homeownership rate: 47.1% (Hispanic), 76.5% (white)
> Unemployment rate: 5.2% (Hispanic), 4.6% (white)
> Incarcerated people per 100,000: 767 (Hispanic), 535 (white)
Some 30.1% of Hispanics in Alabama live below the poverty line, the largest such share of any state with the exception of Kentucky. Alabama also has the third largest gap in poverty rates between white and Hispanic residents of any state, at 17.9 percentage points. In comparison, the Hispanic poverty rate nationwide is 21.0% — 11 percentage points higher than the white poverty rate.
By other measures, the differences in economic and social outcomes between whites and Hispanics are not as great as they are nationwide. And the differences in unemployment, incarceration, and bachelor’s degree attainment rates between white residents and Hispanics are smaller.
[in-text-ad]

34. Montana
> Pct. residents Hispanic: 3.4% (8th lowest)
> Homeownership rate: 54.5% (Hispanic), 69.6% (white)
> Unemployment rate: 6.2% (Hispanic), 4.0% (white)
> Incarcerated people per 100,000: 994 (Hispanic), 423 (white)
In the United States, some 15.3% of Hispanic adults and 35.0% white adults have a bachelor’s degree — a difference of nearly 20 percentage points. In Montana, 24.1% of Hispanic adults have a bachelor’s degree, the fourth largest share of any state and only 8 percentage points less than the white college attainment rate of 31.9%. The state also has relatively small disparities in high school attainment, homeownership, and poverty rates between the two demographics.
Montana attracts relatively few Hispanic immigrants. In 2016, just 96 residents from Mexico, South America, or Cuba obtained green cards in Montana, the third fewest of any state when adjusted for population.
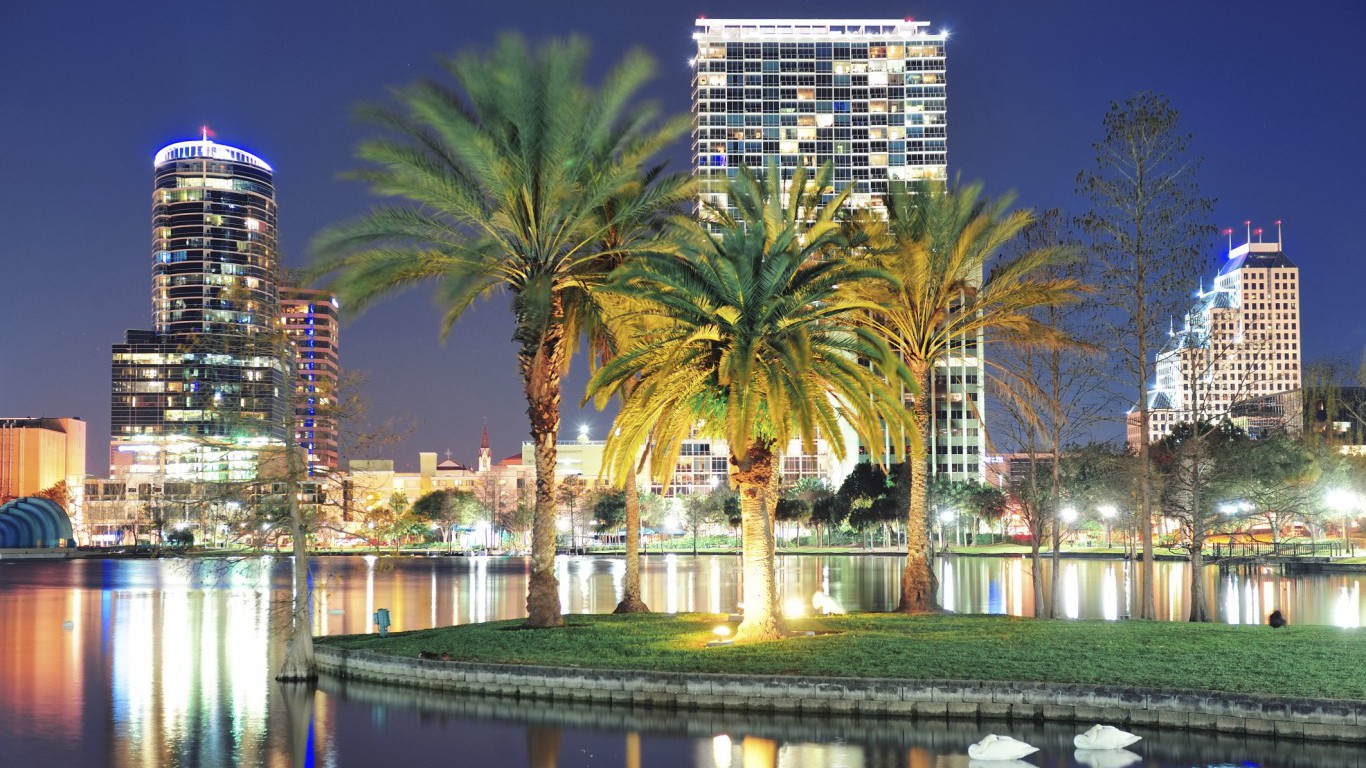
33. Florida
> Pct. residents Hispanic: 24.1% (6th highest)
> Homeownership rate: 49.6% (Hispanic), 73.1% (white)
> Unemployment rate: 4.5% (Hispanic), 4.3% (white)
> Incarcerated people per 100,000: N/A, 626 (white)
With 5.1 million residents identifying as Hispanic or Latino, Florida has the largest population of people of Spanish-speaking or Latin American origins of any state after California and Texas. Disparities in socioeconomic outcomes between Florida’s Hispanic and white populations are not as stark as they are on average nationwide.
For example, the white poverty rate nationwide is 10% and the Hispanic poverty rate is 21.0%. In Florida, the disparity is lower as 10.6% of white Floridians live in poverty, while 18.9% of Hispanics and Latinos in Florida do.

32. Georgia
> Pct. residents Hispanic: 9.2% (24th highest)
> Homeownership rate: 44.7% (Hispanic), 72.5% (white)
> Unemployment rate: 4.0% (Hispanic), 3.9% (white)
> Incarcerated people per 100,000: 1,099 (Hispanic), 640 (white)
Nationwide, Hispanic workers are about 35% more likely to be unemployed than white workers. In Georgia, some 3.9% of the white workforce and 4.0% of the Hispanic workforce are unemployed, each some of the lowest and more equal figures of any state.
In a number of other socioeconomic measures, Georgia is representative of the disparities that exist between white and Hispanic Americans nationwide. In Georgia, the typical Hispanic household earns $46,389 a year, nearly $16,000 less than the typical white household income of $62,023. Nationwide, the median household income is $63,155 for white households and $46,882 for Hispanic households.
[in-text-ad-2]

31. Texas
> Pct. residents Hispanic: 38.6% (2nd highest)
> Homeownership rate: 55.8% (Hispanic), 69.8% (white)
> Unemployment rate: 4.9% (Hispanic), 4.2% (white)
> Incarcerated people per 100,000: 972 (Hispanic), 768 (white)
Hispanic residents comprise 38.6% of the population of Texas, the largest share of any state other than New Mexico. While minorities are less likely to be homeowners than white Americans in every state, the gap in homeownership between white and Hispanic residents in Texas is the second smallest in the country. An estimated 55.8% of Hispanic households own their homes, the third largest share of any state and 14.0 percentage points less than the 69.8% white homeownership rate.

30. Indiana
> Pct. residents Hispanic: 6.5% (20th lowest)
> Homeownership rate: 51.4% (Hispanic), 73.5% (white)
> Unemployment rate: 4.6% (Hispanic), 4.1% (white)
> Incarcerated people per 100,000: 781 (Hispanic), 542 (white)
Hispanics in Indiana are less likely to be hired, less likely to own a home, and more likely to be arrested than the state’s white residents. Still, by these measures, Hispanics in Indiana fare far better than Hispanic Americans overall. The annual unemployment rate among Hispanics in Indiana is 4.6%, well below the 5.8% comparable rate nationwide. Additionally, the homeownership rate among Hispanics in the state of 51.4% is higher than the comparable nationwide rate of 45.5%. Finally, there are 781 Hispanics in jail for every 100,000 Hispanic residents in Indiana compared to 831 per 100,000 Hispanic Americans nationwide.
[in-text-ad]

29. South Carolina
> Pct. residents Hispanic: 5.3% (17th lowest)
> Homeownership rate: 45.9% (Hispanic), 76.3% (white)
> Unemployment rate: 3.6% (Hispanic), 4.0% (white)
> Incarcerated people per 100,000: 1,205 (Hispanic), 433 (white)
Unlike in the vast majority of states, Hispanic residents may have a slightly easier time finding work in South Carolina than the state’s white residents. Unemployment among Hispanics is only 3.6% compared to 4.0% among white residents.
Other disparities in South Carolina, however, expose serious disadvantages for Hispanic residents. For example, there are 1,205 Hispanic or Latino South Carolinians in jail for every 100,000 — nearly triple the incarceration rate among white residents of 433 in jail per 100,000. Nationwide, the Hispanic incarceration rate is less than double the rate for white Americans.

28. Wyoming
> Pct. residents Hispanic: 9.7% (22nd highest)
> Homeownership rate: 55.8% (Hispanic), 70.7% (white)
> Unemployment rate: 6.9% (Hispanic), 5.2% (white)
> Incarcerated people per 100,000: 1,059 (Hispanic), 532 (white)
Wyoming’s Hispanic population has a far more difficult time finding work than the state’s white population. The annual unemployment rate among Hispanic workers in the state is 6.9%, well above the state’s white workers unemployment rate of 5.1% and the Hispanic unemployment rate nationwide of 5.8%.
Despite higher joblessness, Hispanics in Wyoming are far less likely to be struggling financially than Hispanic populations in other states. Some 10.1% of white state residents live in poverty, roughly in line with the white poverty rate nationwide. Meanwhile, 16.7% of Hispanics in the state live in poverty, well below the comparable nationwide poverty rate of 21.0%.
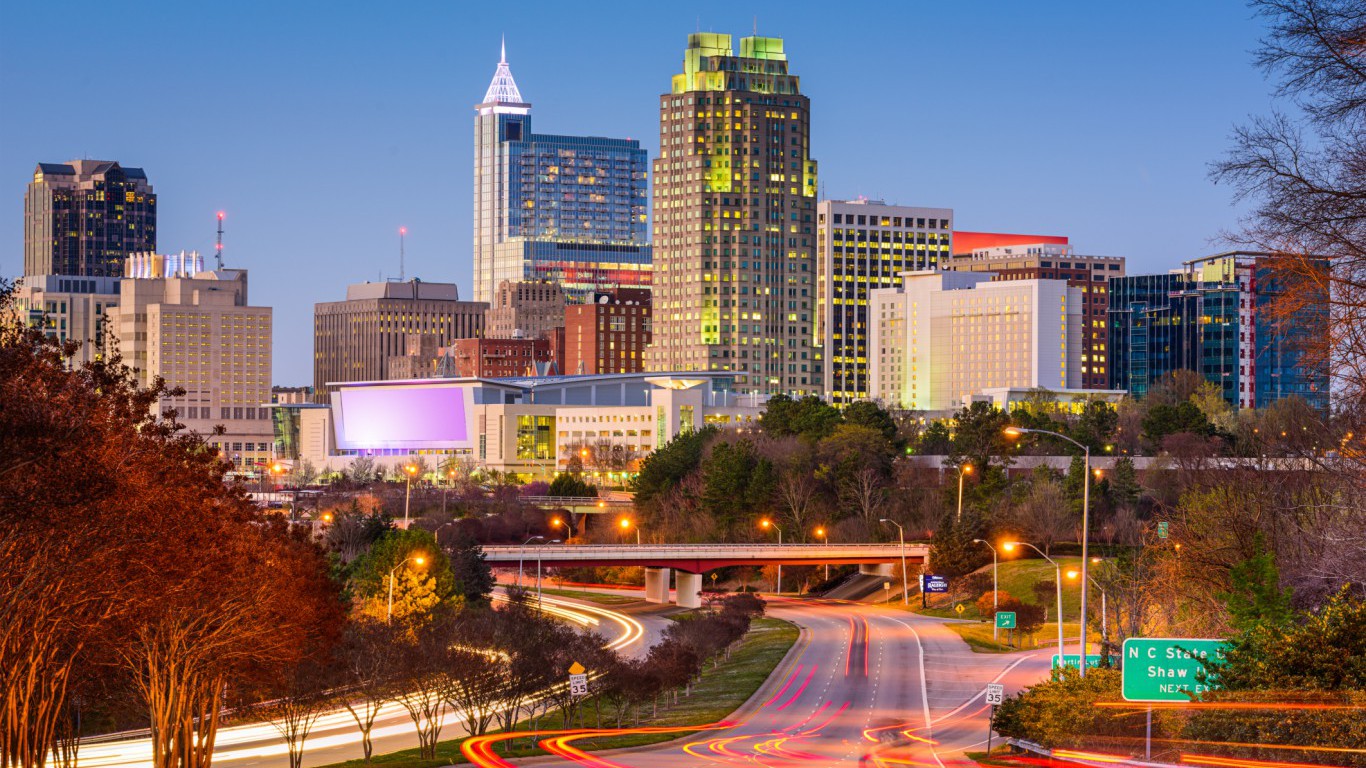
27. North Carolina
> Pct. residents Hispanic: 8.9% (25th highest)
> Homeownership rate: 43.0% (Hispanic), 72.6% (white)
> Unemployment rate: 5.1% (Hispanic), 4.0% (white)
> Incarcerated people per 100,000: 491 (Hispanic), 357 (white)
North Carolina is fairly representative of the social and economic disparities that persist among Hispanics and whites nationwide. The typical Hispanic household earns $17,281 a year less than the typical white household, similar to the $16,273 difference in median household income between the two demographics nationwide. Similarly, 34.1% of white adults and 14.8% of Hispanic adults have a bachelor’s degree. The 19.3 percentage point gap is on par with the 19.6 percentage point gap between the nationwide white and Hispanic college attainment rates of 35.0% and 15.3%, respectively.
In one measure — incarceration rate — the disparity is smaller than in nearly any other state. Adjusted for population, the Hispanic incarceration rate in North Carolina exceeds the white rate by 134 prisoners per 100,000 residents — the eighth smallest gap of any state.
[in-text-ad-2]

26. New Hampshire
> Pct. residents Hispanic: 3.3% (6th lowest)
> Homeownership rate: 39.4% (Hispanic), 72.1% (white)
> Unemployment rate: N/A, 2.8% (white)
> Incarcerated people per 100,000: 954 (Hispanic), 336 (white)
Some 13.8% of Hispanic New Hampshire residents live in poverty, nearly the lowest Hispanic poverty rate of any state. The poverty gap between whites and Hispanics in the state is also relatively small. New Hampshire’s Hispanic poverty rate is only 7.1 percentage points higher than its white poverty rate. In comparison, the 21.0% poverty rate among Hispanics nationwide is 11 percentage points above the white poverty rate.
Despite the low poverty gap, New Hampshire’s white residents are far wealthier than Hispanic residents. The typical white household in the state earns $71,718 a year, about $20,000 more than the median income among Hispanic households. Nationwide, the income gap is just over $16,000.

25. Utah
> Pct. residents Hispanic: 13.5% (13th highest)
> Homeownership rate: 49.9% (Hispanic), 74.0% (white)
> Unemployment rate: 3.3% (Hispanic), 3.6% (white)
> Incarcerated people per 100,000: 832 (Hispanic), 367 (white)
Utah is one of only a handful of states in which the unemployment rate among Hispanic workers is lower than it is among white workers. Only 3.3% of the Hispanic labor force is out of a job compared to 3.6% of the white labor force. Socioeconomic advantages among Hispanics in Utah appear to stop there, however. White Utah residents are more likely to have a college education, less likely to be incarcerated, and more likely to have higher incomes than Hispanics in the state to a far greater degree than is typical nationwide.
[in-text-ad]

24. Oregon
> Pct. residents Hispanic: 12.4% (14th highest)
> Homeownership rate: 41.6% (Hispanic), 65.0% (white)
> Unemployment rate: 5.7% (Hispanic), 4.9% (white)
> Incarcerated people per 100,000: 809 (Hispanic), 506 (white)
Fewer than than 2 out of every 3 Hispanic adults in Oregon have completed high school. In stark contrast, nearly 94% of white adults in the state have at least a high school diploma. The over 30 percentage point difference in high school attainment in Oregon is nearly the largest such gap in the United States.
A high school education is important for financial stability, and the educational attainment gap between whites and Hispanics may partially explain the state’s larger than typical gap in poverty rates in the state. The Hispanic poverty rate of 22.6% is 11.5 percentage points higher than the white poverty rate of 11.1%. Nationwide, the Hispanic poverty rate of 21.0% is 11 percentage points higher than the white poverty rate of 10.0%.

23. Michigan
> Pct. residents Hispanic: 4.8% (13th lowest)
> Homeownership rate: 54.6% (Hispanic), 77.1% (white)
> Unemployment rate: 6.1% (Hispanic), 4.1% (white)
> Incarcerated people per 100,000: 588 (Hispanic), 374 (white)
While a shortage of affordable housing, credit problems, and a lack of savings have historically made it more difficult for minorities to buy homes, the disparity in homeownership between whites and Hispanics is smaller in Michigan than in nearly any other state. Some 54.6% of Hispanic households in Michigan own their homes, the fourth largest share of any state and 22.4 percentage points below the 77.1% white homeownership rate. By comparison, the homeownership rate among American Hispanics of 45.5% is greater than 25 percentage points below the white homeownership rate of 71.2%.
The disparity in unemployment, however, is higher in Michigan than in a majority of states. Michigan’s Hispanic unemployment rate of 6.1% is 2.0 percentage points higher than the state’s white unemployment rate of 4.1%. Nationwide the unemployment rate for Hispanic workers of 5.8% is 1.5 percentage points higher than the jobless rate for white workers of 4.3%.

22. Illinois
> Pct. residents Hispanic: 16.6% (10th highest)
> Homeownership rate: 51.1% (Hispanic), 74.0% (white)
> Unemployment rate: 6.7% (Hispanic), 5.0% (white)
> Incarcerated people per 100,000: 472 (Hispanic), 258 (white)
Joblessness is a much bigger problem for Illinois’ Hispanic population than it is among its white population. Some 6.7% of the state’s Hispanic labor force is out of a job, 1.7 percentage points higher than the 5.0% white unemployment rate.
College graduates have a greater range of employment options than those without a bachelor’s degree have — and a far greater share of white adults in Illinois have a degree than the share of Hispanic adults. Some 37.8% of white adults in the state have a bachelor’s degree, about 23 percentage points higher than the 14.5% of Hispanic adults who have a bachelor’s degree. Nationwide, the bachelor’s attainment rate among whites of 35.0% is 19.6 percentage points higher than the Hispanic college attainment rate of 15.3%.
[in-text-ad-2]

21. Ohio
> Pct. residents Hispanic: 3.5% (10th lowest)
> Homeownership rate: 43.9% (Hispanic), 71.3% (white)
> Unemployment rate: 5.9% (Hispanic), 4.2% (white)
> Incarcerated people per 100,000: 1,072 (Hispanic), 422 (white)
While an estimated 35.0% of white adults and 15.3% of Hispanic adults nationwide have a bachelor’s degree — a 19.6 percentage point difference — Ohio has one of the smaller disparities in higher education of any state. Some 19.7% of Hispanic adults in Ohio have a bachelor’s degree, the ninth largest share in the country and 8.9 percentage points below the 29.4% white college attainment rate.
While lower educational inequality can often reduce disparities in income, Ohio has one of the largest poverty gaps of any state. Ohio’s Hispanic poverty rate of 24.9% is 13.7 percentage points greater than the white poverty rate of 11.2%. Nationwide, the poverty rate for Hispanic Americans of 21.0% is 11.0 percentage points above the white poverty rate of 10.0%.

20. Idaho
> Pct. residents Hispanic: 12.0% (16th highest)
> Homeownership rate: 47.7% (Hispanic), 71.3% (white)
> Unemployment rate: 4.7% (Hispanic), 3.8% (white)
> Incarcerated people per 100,000: 1,026 (Hispanic), 656 (white)
Americans with college education are far more likely to earn higher incomes than those with only a high school diploma. In Idaho, only 9.1% of adults of Hispanic and Latino descent have a bachelor’s degree or higher, the smallest share of any state in the country. Meanwhile, some 29.4% of white adults have earned a four-year college degree.
Despite the educational disparity, the income gap between white and Hispanic households in Idaho is not as dramatic as it is nationwide. The typical Hispanic household in the state earns $40,802 a year — about $13,000 less than the median income among white households. Nationwide, Hispanic households earn $46,882 a year — about $16,000 less than the typical white household.
[in-text-ad]
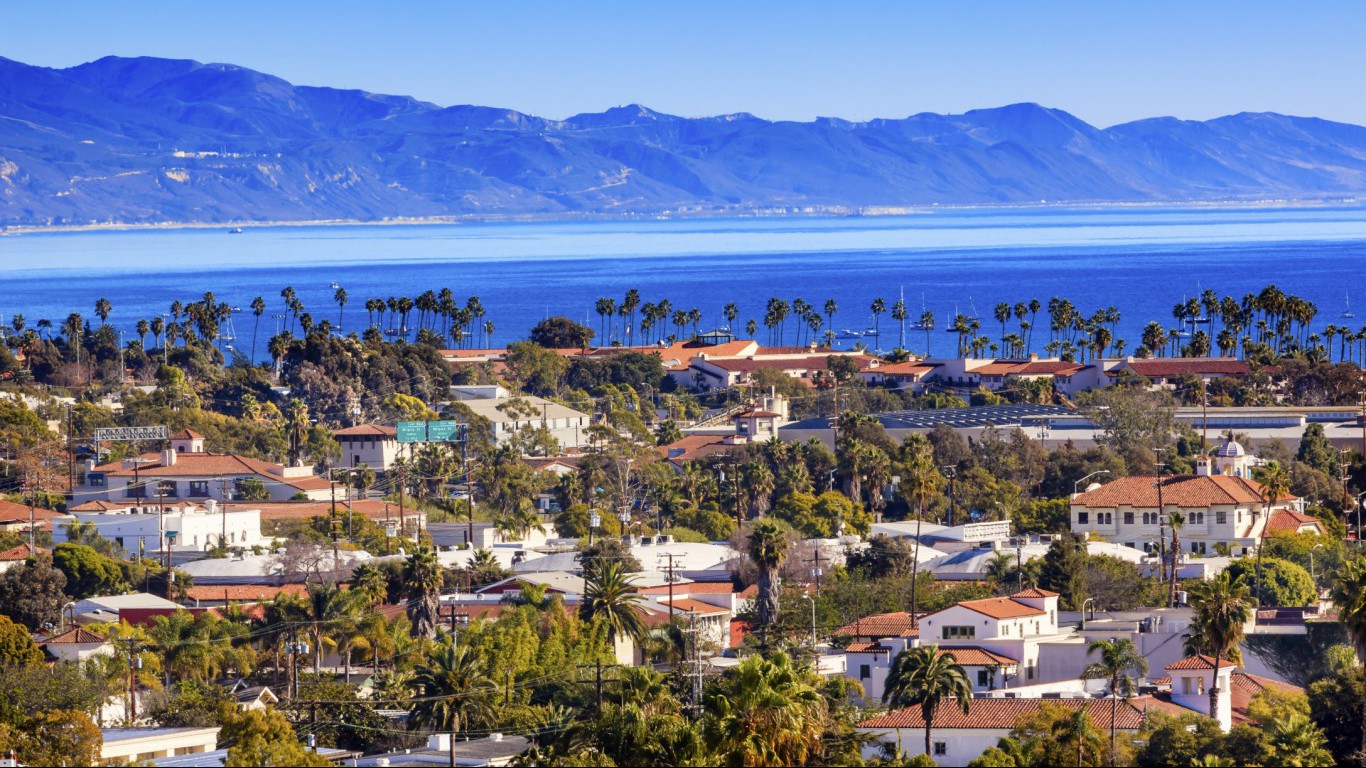
19. California
> Pct. residents Hispanic: 38.6% (3rd highest)
> Homeownership rate: 42.1% (Hispanic), 62.4% (white)
> Unemployment rate: 6.6% (Hispanic), 5.4% (white)
> Incarcerated people per 100,000: 757 (Hispanic), 453 (white)
Hispanic and Latino Americans comprise 38.6% of the population of California, the third largest share of any state after Texas and New Mexico. Hispanics in California still lag behind the white population in a number of important socioeconomic measures. Just 12.1% of Hispanic adults in the state have a bachelor’s degree, 31 percentage points below the 43.1% of white adults who do — the largest college attainment gap of any state. Similarly, the median household income for Hispanics of $52,403 a year is nearly $27,000 lower than the median income for white households of $79,353 — the sixth largest such disparity.
Despite the large disparities in education and income, California has smaller gaps in poverty and homeownership rates between the two demographics than a majority of states.

18. Oklahoma
> Pct. residents Hispanic: 9.8% (21st highest)
> Homeownership rate: 48.8% (Hispanic), 70.2% (white)
> Unemployment rate: 5.1% (Hispanic), 4.2% (white)
> Incarcerated people per 100,000: 1,876 (Hispanic), 767 (white)
About 1 in 4 Oklahoma residents who identify as Hispanic or Latino live below the poverty line, more than double the poverty rate among the state’s white residents of 12.3%.
Not only are Hispanics far more likely to face serious financial hardship in Oklahoma than white residents, but also they are far more likely to be incarcerated. For every 100,000 Hispanics in the state, 1,876 are in jail or prison, a far greater share than the incarceration rate among the white population of 767 per 100,000 white residents.

17. Kansas
> Pct. residents Hispanic: 11.3% (17th highest)
> Homeownership rate: 52.8% (Hispanic), 70.0% (white)
> Unemployment rate: 6.5% (Hispanic), 3.7% (white)
> Incarcerated people per 100,000: 873 (Hispanic), 418 (white)
While the unemployment rate for white workers in Kansas of 3.7% is lower than the national rate of 4.3% for the demographic, Hispanic workers are more likely to be unemployed in Kansas than in nearly any other state. The Hispanic unemployment rate in Kansas of 6.5% is far higher than the 5.8% national figure and 2.7 percentage points above the jobless rate for whites — the seventh largest such gap of any state.
Kansas also has one of the worst gaps in education between the two demographics of any state. Just 63.6% of Hispanic adults in Kansas have graduated from high school, over 30 percentage points less than the comparable attainment rate among white adults of 93.8% — the eighth largest disparity of any state.
[in-text-ad-2]
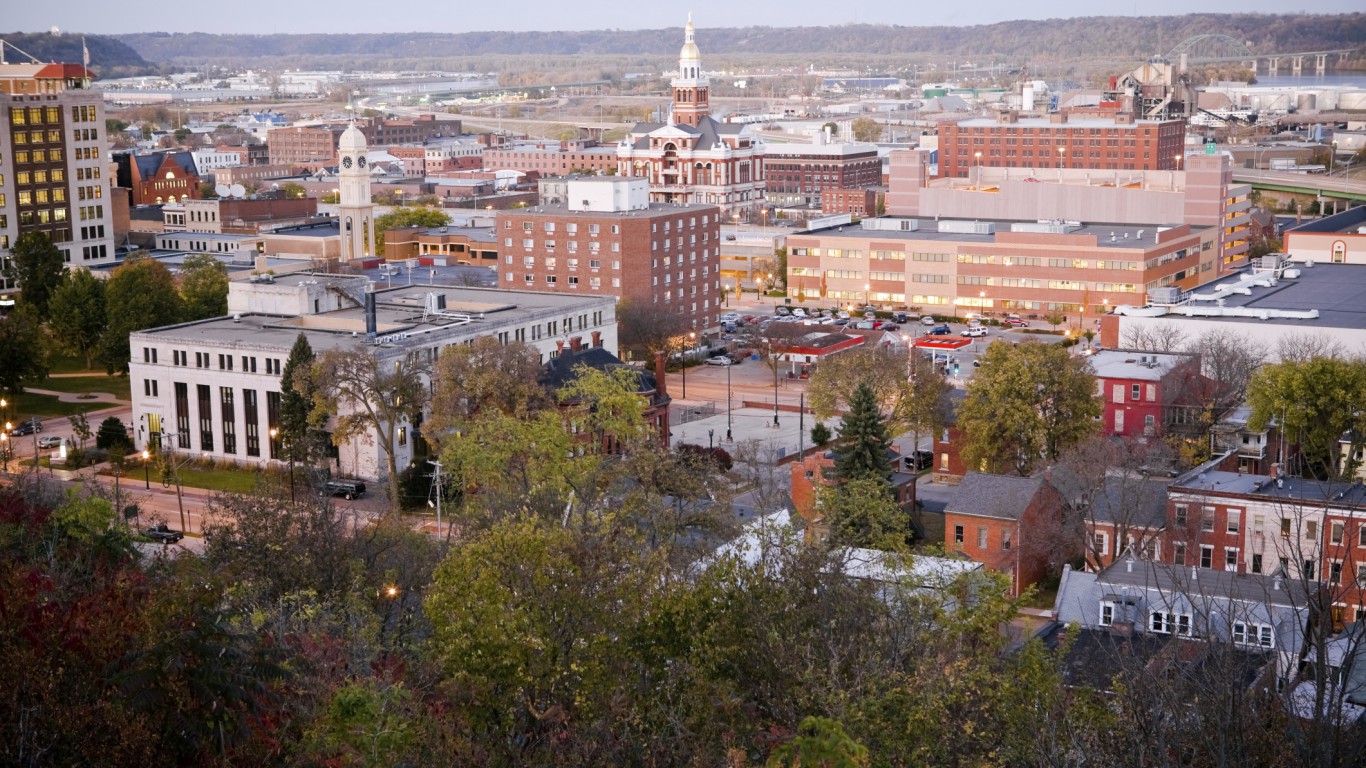
16. Iowa
> Pct. residents Hispanic: 5.6% (18th lowest)
> Homeownership rate: 47.4% (Hispanic), 73.9% (white)
> Unemployment rate: 5.3% (Hispanic), 3.6% (white)
> Incarcerated people per 100,000: 692 (Hispanic), 324 (white)
Iowa has one of the largest gaps in education of any state between Hispanic and white state residents. Just 60.9% of Hispanic adults have graduated from high school, compared to the 93.7% of whites who have — the third largest disparity of any state. In most other major socioeconomic measures, Iowa is fairly typical of the disparities that exist between the two demographics nationwide.
For example, Hispanics are overrepresented in the U.S. prison population. While Hispanic Americans comprise 17.3% of the U.S. population, they account for 19.0% of the nation’s prison population.

15. Washington
> Pct. residents Hispanic: 12.1% (15th highest)
> Homeownership rate: 43.4% (Hispanic), 67.2% (white)
> Unemployment rate: 7.6% (Hispanic), 5.3% (white)
> Incarcerated people per 100,000: 601 (Hispanic), 392 (white)
The income gap between the typical white household and the typical Hispanic household nationwide is about $16,000. In Washington, the gap is far greater. The typical white household in the state earns about $70,500 a year, nearly $20,000 more than the typical Hispanic household.
Incomes tend to increase alongside educational attainment, and in Washington, white adults are far more likely to have at least a bachelor’s degree than Hispanic adults. Some 36.7% of white adults have a bachelor’s degree, 21.4 percentage points above the bachelor’s degree attainment rate among Hispanic adults.
[in-text-ad]
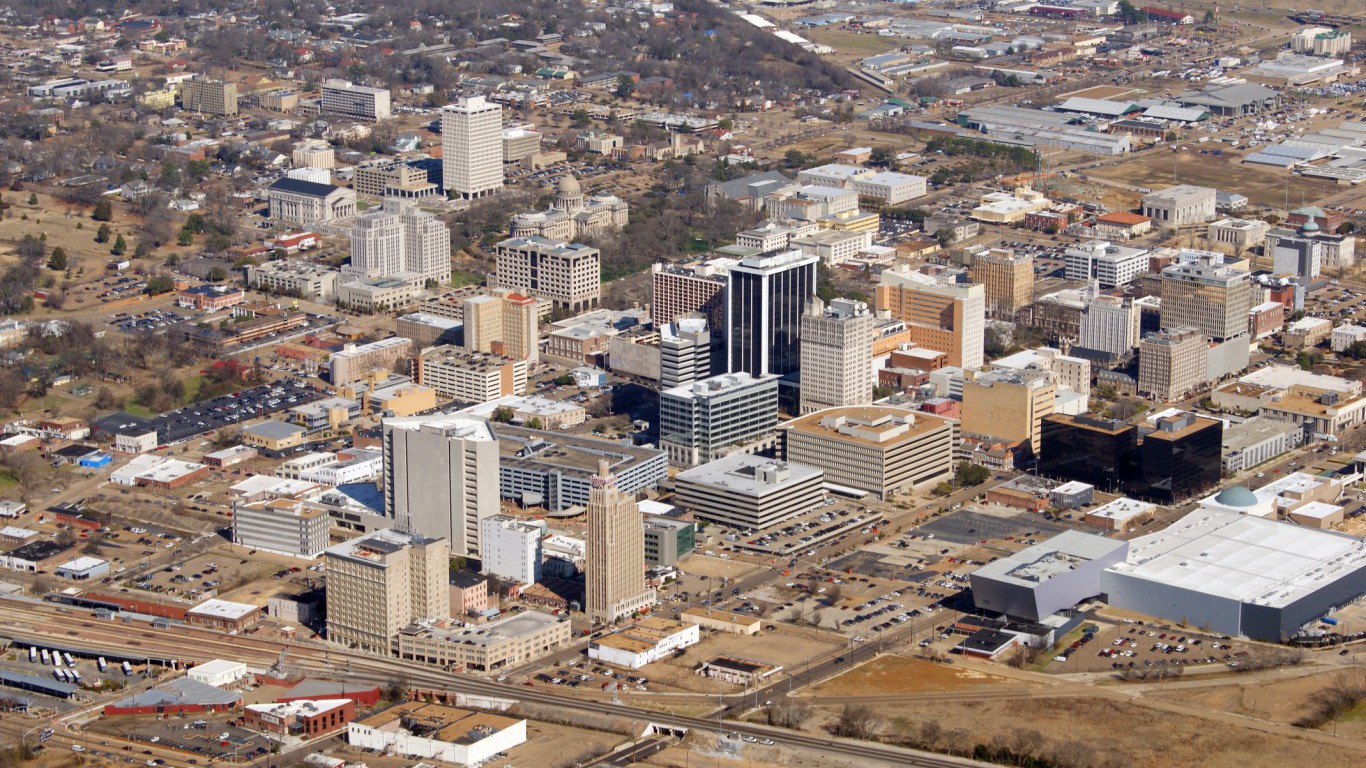
14. Mississippi
> Pct. residents Hispanic: 2.9% (4th lowest)
> Homeownership rate: 48.1% (Hispanic), 76.7% (white)
> Unemployment rate: 7.8% (Hispanic), 4.5% (white)
> Incarcerated people per 100,000: 4,869 (Hispanic), 600 (white)
Mississippi is one of the worst states in the country for Hispanics and Latinos. The state has the highest Hispanic incarceration rate in the country with 4,869 Hispanics in jail for every 100,000 residents — more than eight times the state’s white incarceration rate and well above the U.S. Hispanic incarceration rate of 831 per 100,000.
Hispanics in Mississippi are also far more likely than the state’s white residents to struggle to secure a job. The 7.8% unemployment rate among Hispanics is 3.3 percentage points higher than the 4.5% white unemployment rate — a difference more than double the 1.5 percentage point disparity nationwide.

13. Arizona
> Pct. residents Hispanic: 30.5% (4th highest)
> Homeownership rate: 52.1% (Hispanic), 70.0% (white)
> Unemployment rate: 7.1% (Hispanic), 5.1% (white)
> Incarcerated people per 100,000: 1,453 (Hispanic), 633 (white)
An estimated 30.5% of Arizona residents are Hispanic, the fourth largest share after California, Texas, and New Mexico. Arizona lawmakers have garnered criticism for the passing of Arizona SB 1070, a law requiring aliens over the age of 18 to carry identification, which according to some critics encourages racial profiling. Arizona has one of the largest disparities in incarceration between whites and Hispanics of any state. Nationwide, Hispanic Americans comprise 17.3% of the population and 19.0% of the prison population. In Arizona, Hispanics comprise 30.5% of the state population and 41.0% of the prison population. The state also has larger disparities between the demographics in college attainment and unemployment than a majority of states.

12. Nebraska
> Pct. residents Hispanic: 10.2% (19th highest)
> Homeownership rate: 45.1% (Hispanic), 69.6% (white)
> Unemployment rate: 4.7% (Hispanic), 2.7% (white)
> Incarcerated people per 100,000: 867 (Hispanic), 282 (white)
Only 55.6% of Hispanic adults in Nebraska have a high school diploma, the lowest high school attainment rate among Hispanics and Latinos of any state. Meanwhile, nearly 95% of white adults in the state have a high school diploma, nearly the largest share among states.
A high school education is utmost important for financial stability, and the difference in educational attainment rates appears to have a meaningful impact on poverty rates between whites and Hispanics in the state. Some 22.7% of Hispanics in Nebraska live below the poverty line compared to 8.5% of white residents.
[in-text-ad-2]
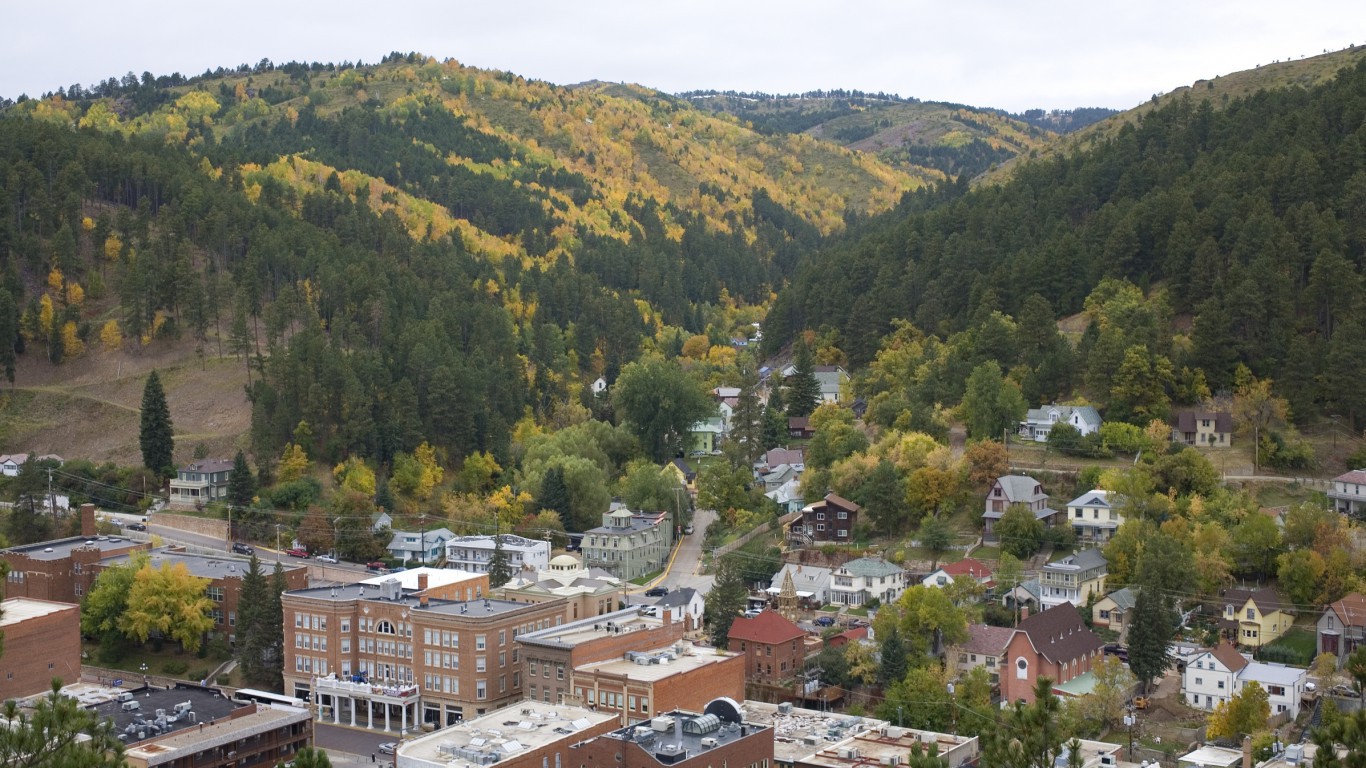
11. South Dakota
> Pct. residents Hispanic: 3.4% (9th lowest)
> Homeownership rate: 36.2% (Hispanic), 71.4% (white)
> Unemployment rate: N/A, 1.5% (white)
> Incarcerated people per 100,000: 1,727 (Hispanic), 508 (white)
Some 25.2% of the South Dakota Hispanic population lives in poverty, the 10th largest share of any state and far higher than the 8.4% white poverty rate. The gap of 16.8 percentage point in poverty rates between the two demographics is the fifth largest of any state and much larger than the 11.0 percentage point gap nationwide between the white and Hispanic poverty rates of 21.0% and 10.0%, respectively.
South Dakota also has one of the largest disparities in incarceration rates in the country. Hispanic residents in South Dakota are incarcerated at more than three times the rate of white residents — while 508 in every 100,000 white residents in the state are in prison, over 1,700 in every 100,000 Hispanic residents are incarcerated. Only three states have larger disparities.

10. Rhode Island
> Pct. residents Hispanic: 14.1% (12th highest)
> Homeownership rate: 25.9% (Hispanic), 65.4% (white)
> Unemployment rate: 8.7% (Hispanic), 5.1% (white)
> Incarcerated people per 100,000: 697 (Hispanic), 210 (white)
While Rhode Island has one of the larger and more active Hispanic communities — the state has a long history of Latino social activists, and Providence elected its first Hispanic mayor in 2010 — it is still one of the worst states for Hispanics by a number of measures. Some 8.7% of Hispanic workers in Rhode Island are unemployed, the second largest share of any state and much higher than the 5.1% white unemployment rate. Only Pennsylvania has a larger disparity in unemployment between the two demographics.
Income inequality between white and Hispanic earners is worse in Rhode Island than in nearly any other state. The median household income for Hispanics in Rhode Island of $36,877 a year is $28,608 less than the median income for white households of $65,485 — the fifth largest gap of any state.
[in-text-ad]

9. New Jersey
> Pct. residents Hispanic: 19.3% (8th highest)
> Homeownership rate: 34.6% (Hispanic), 76.2% (white)
> Unemployment rate: 5.5% (Hispanic), 4.4% (white)
> Incarcerated people per 100,000: 609 (Hispanic), 218 (white)
While New Jersey has one of the larger and more engaged Hispanic communities — the Hispanic population accounts for 19% of the population and 9% of the state legislature, some of the largest shares shares nationwide — it has larger disparities in income, college attainment, and homeownership than nearly any other state.
While the median household income for Hispanics in New Jersey of $52,599 a year is higher than the comparable $46,882 national figure, it is nearly $34,000 below the median among white households of $86,361 — a greater disparity than any state other than Connecticut and Massachusetts.

8. Colorado
> Pct. residents Hispanic: 21.1% (7th highest)
> Homeownership rate: 48.3% (Hispanic), 70.0% (white)
> Unemployment rate: 4.7% (Hispanic), 3.2% (white)
> Incarcerated people per 100,000: 1,280 (Hispanic), 509 (white)
In Colorado,15.7% of Hispanic adults have a bachelor’s degree, compared to the 46.0% of white adults in the state who do — the largest disparity in college attainment of any state other than California.
Income inequality in Colorado among the worst in the country. While the median household income for Hispanics of $49,201 a year is higher than the comparable $46,882 national figure, it is more than $22,000 below the median among white households in the state of $71,406 — a greater disparity than the comparable national gap of $16,273.
7. North Dakota
> Pct. residents Hispanic: 3.1% (5th lowest)
> Homeownership rate: 41.1% (Hispanic), 66.9% (white)
> Unemployment rate: N/A, 2.6% (white)
> Incarcerated people per 100,000: 1,032 (Hispanic), 245 (white)
Hispanics are vastly overrepresented in the North Dakota prison population. Adjusted for population, Hispanics in North Dakota are incarcerated at a rate of 787 more prisoners per 100,000 residents than whites in the state, more than twice the national disparity.
North Dakota has a greater degree of income inequality between whites and Hispanics than nearly any other state. The typical Hispanic household in North Dakota earns just $37,239 a year, the fourth least of any state and nearly $27,000 less than the median household income among whites in the state of $64,084. By comparison, the typical Hispanic household nationwide earns about $16,000 less than the typical white households.
[in-text-ad-2]

6. New York
> Pct. residents Hispanic: 18.6% (9th highest)
> Homeownership rate: 23.9% (Hispanic), 66.5% (white)
> Unemployment rate: 6.5% (Hispanic), 4.2% (white)
> Incarcerated people per 100,000: 607 (Hispanic), 219 (white)
Roughly 66% of Hispanics in New York state live in New York City. Many of the factors depressing homeownership rates for minorities nationwide — discriminatory lending practices, income inequality, and rising home prices — are amplified in New York City. New York is the only state in which fewer than 1 in 4 Hispanic heads of household own their homes. The Hispanic homeownership is just 23.9%, far less than the 66.5% white homeownership rate. The 42.6 percentage point gap in homeownership is the largest of any state other than Massachusetts.

5. Minnesota
> Pct. residents Hispanic: 5.1% (16th lowest)
> Homeownership rate: 45.0% (Hispanic), 76.1% (white)
> Unemployment rate: 5.3% (Hispanic), 3.0% (white)
> Incarcerated people per 100,000: 959 (Hispanic), 216 (white)
Minnesota has one of the worst disparities in high school attainment between whites and Hispanics of any state. While the high school diploma attainment rate for white adults in Minnesota of 95.7% of is the fourth highest high school attainment rate of any state, the comparable attainment rate for Hispanics of 62.6% is the ninth lowest. The 33.1 percentage point gap is the largest of any state after only Nebraska.
[in-text-ad]
4. Delaware
> Pct. residents Hispanic: 8.8% (25th lowest)
> Homeownership rate: 38.4% (Hispanic), 79.6% (white)
> Unemployment rate: 4.9% (Hispanic), 3.7% (white)
> Incarcerated people per 100,000: N/A, 414 (white)
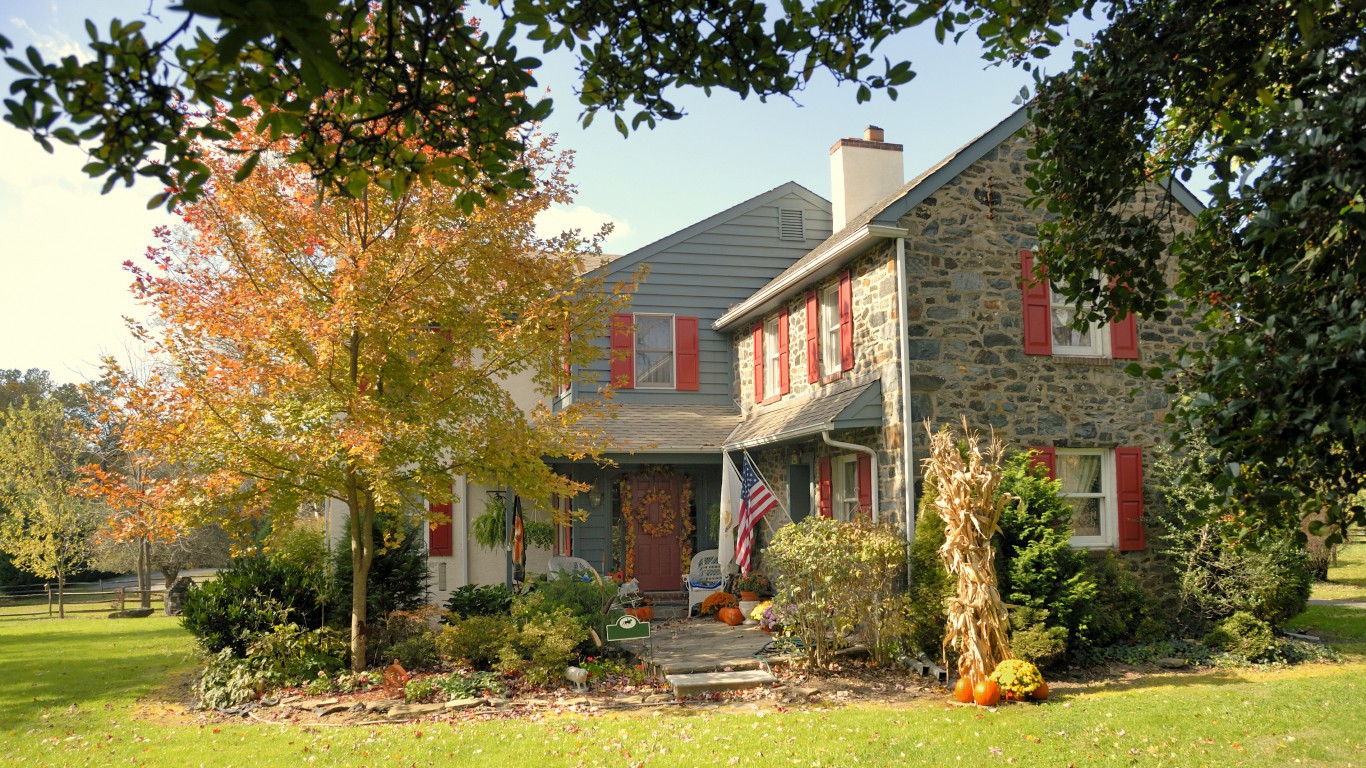
Few states have a larger poverty gap between Hispanics and whites than Delaware. Some 24.5% of the Hispanic population in the state lives in poverty, 16.9 percentage points above the 7.6% white poverty rate — the fourth largest disparity of any state.
Income inequality, as well factors such as discriminatory lending practices and rising rents, can make it difficult for minorities to own homes. While 79.6% of white heads of household in Delaware own their homes — the largest share of any state — just 38.4% of Hispanic heads of household do — the eighth lowest Hispanic homeownership rate nationwide. The 41.2 percentage-point gap in homeownership is the fifth largest disparity of any state.

3. Connecticut
> Pct. residents Hispanic: 15.0% (11th highest)
> Homeownership rate: 32.6% (Hispanic), 74.8% (white)
> Unemployment rate: 7.6% (Hispanic), 4.7% (white)
> Incarcerated people per 100,000: 1,195 (Hispanic), 241 (white)
While Connecticut is one of the most wealthy states, it has some of the worst income inequality in the country. The median income for white households of $84,030 a year is more than $37,000 greater than the median income for Hispanic households of $46,808 — the largest gap of any state other than neighboring Massachusetts.
Income inequality, as well as discriminatory lending practices and rising rents, can make it difficult for minorities to own homes. Just 32.6% of Hispanic heads of household in Connecticut own their homes, the fourth smallest share of any state and 42.3 percentage points below the white homeownership rate of 74.8%. The disparity in homeownership between whites and Hispanics is larger in Connecticut than in all but two states.

2. Pennsylvania
> Pct. residents Hispanic: 6.6% (21st lowest)
> Homeownership rate: 40.3% (Hispanic), 74.0% (white)
> Unemployment rate: 11.9% (Hispanic), 4.9% (white)
> Incarcerated people per 100,000: 2,001 (Hispanic), 375 (white)
Pennsylvania has one of the largest disparities in incarceration between white and Hispanic residents of any state. In 2011, the city of Philadelphia — where approximately one quarter of the state’s Hispanic population lives — agreed as part of settlement of a class action lawsuit to reform its police department to reduce racial profiling. As of 2014, blacks and Hispanics were the subject of 80% of all police stops and 89% of all frisks in Philadelphia, despite accounting for just 51% of the city population. Across the state, Hispanics are incarcerated at more than five times the rate of whites — a larger disparity than any state other than Mississippi and West Virginia.
Pennsylvania also has some of the worst income inequality in the nation. Some 30.0% of the Hispanic population lives in poverty, the third largest share of any state and far more than the white poverty rate of 9.2%. The 20.8 percentage point gap in poverty is the largest of any state.
[in-text-ad-2]

1. Massachusetts
> Pct. residents Hispanic: 10.9% (18th highest)
> Homeownership rate: 26.0% (Hispanic), 69.3% (white)
> Unemployment rate: 6.5% (Hispanic), 3.5% (white)
> Incarcerated people per 100,000: 928 (Hispanic), 241 (white)
By a number of socioeconomic measures — poverty, income, educational attainment, unemployment, and incarceration — Massachusetts has the worst inequality between its white and Hispanic residents of any state. While the typical white household in Massachusetts earns $82,029 a year — the fifth most of any state — the median income for Hispanic households is just $39,742. The gap of more than $42,000 is the largest of any state and nearly three times the national gap.
Income inequality, as well as factors such as discriminatory lending and rising rents, can reduce the difficulty of owning home for minorities. Just 26.0% of Hispanic heads of household own their homes, far less than the 69.3% white homeownership. The 43.3 percentage-point gap in homeownership is the largest of any state.
Hispanic and Latino is a blanket designation that covers a wide range of Spanish-speaking and Latin American countries, including Argentina, Bolivia, Chile, Costa Rica, Guatemala, Mexico, and Spain, to name a few.
In an interview with 24/7 Wall St., Valerie Wilson, director of the Director, Program on Race, Ethnicity, and the Economy for the non-partisan think tank Economic Policy Institute, explained that the composition of the Hispanic and Latino population in a given state varies widely based on the region of the country. “[In] the West, Southwest we’re talking largely about Mexican Americans. If we’re looking in Florida we’re largely going to be looking at Cuban Americans. If we’re in the Northeast, we’re looking at a larger percentage of Puerto Ricans, Dominicans, other possible variations.”
In every state in the country, white residents are better off overall than Hispanic and Latino residents. In some states, however, the gaps in income, educational attainment, and incarceration are relatively small. This is often due in part to public policy designed to help integrate Spanish-speaking citizens.
In New Mexico, for example, 47.8% of the population identifies as Hispanic or Latino, the largest share of any state. Due to the prevalence of Hispanics, the state government has enacted multiple protections for Spanish speakers. For one, all ballots and voting forms in the state are printed in Spanish and English, and the inability to speak English cannot restrict anyone from serving on a jury or holding elected office. Perhaps not surprisingly, New Mexico ranks better on this list than all but one other state. To be sure, four of the six states with the highest concentration of Hispanics and Latinos rank in the top half of this list.
While some states with large Hispanic populations, such as New Mexico, exhibit less social and economic inequality, a small hispanic population by no means will have greater inequality. In fact, three of the states with the smallest hispanic populations, Vermont, West Virginia, and Maine, rank among the least unequal in the country.
In many of the states with smaller gaps between white and Hispanic residents, socioeconomic outcomes for white residents are not especially good. In West Virginia, for example, 17.4% of white residents live in poverty, the highest white poverty rate in the country. Due in part to a high white poverty rate, the poverty gap between the state’s white and Hispanic residents is only 5.4 percentage points, nearly the smallest in the country. West Virginia is one of several states that ranks as better for Hispanics in which socioeconomic outcomes are poor across the board.
Methodology:
To determine the worst states for Hispanic and Latino Americans, 24/7 Wall St. created an index of nine measures to assess gaps between the two demographic groups in each state. Creating the index in this way highlights disparities between racial groups rather than what may be a particularly poor socioeconomic climate in a state for both whites and Hispanics. For each measure, we constructed and normalized an index from the disparities between white and Hispanic Americans.
To construct the index, we used 2016 data from the U.S. Census Bureau’s American Community Survey (ACS) on median household income, poverty rates, high school and college educational attainment rates, and homeownership rates — each broken down by ethnicity. Unemployment rates for 2016 came from the Bureau of Labor Statistics (BLS). Incarceration rates came from the Prison Policy Initiative, a Massachusetts-based think tank, and are as of 2012, the most recent year for which data is available. From the Centers for Disease Control and Prevention, we considered 2009-2013 rate estimates for age-adjusted mortality and infant mortality.
In addition to data incorporated into the index, we also considered the share of students with limited English proficiency from the U.S. Department of Education, as well as estimates of the unauthorized immigrant population in each state, from the Migration Policy Institute, a think tank based in Washington D.C. Data on age, citizenship status, and country of origin came from the 2016 ACS.
Retirement planning doesn’t have to feel overwhelming. The key is finding professional guidance—and we’ve made it easier than ever for you to connect with the right financial advisor for your unique needs.
Here’s how it works:
1️ Answer a Few Simple Questions
Tell us a bit about your goals and preferences—it only takes a few minutes!
2️ Get Your Top Advisor Matches
This tool matches you with qualified advisors who specialize in helping people like you achieve financial success.
3️ Choose Your Best Fit
Review their profiles, schedule an introductory meeting, and select the advisor who feels right for you.
Why wait? Start building the retirement you’ve always dreamed of. Click here to get started today!
Thank you for reading! Have some feedback for us?
Contact the 24/7 Wall St. editorial team.