
Losing out on sleep does not just make people cranky or increase the size of their drink order at Starbucks. Not getting enough sleep can increase a person’s risk of developing a myriad of chronic health problems such as “obesity, diabetes, high blood pressure, heart disease, stroke, and frequent mental distress,” according to the CDC.
In many cases, sleep deprived adults can be a danger to others, as well as themselves. The AAA Foundation for Traffic Safety found that people who sleep only four to five hours before getting behind the wheel are about as likely to get into a car accident as people who drive with “a blood alcohol concentration equal to or slightly above the legal limit for alcohol in the U.S.”
In certain cities, a much larger share of the population does not get enough sleep. Reviewing data from the CDC, 24/7 Wall St. identified the 50 cities in which the smallest share of adults get at least seven hours of sleep nightly.
In Gary, Indiana, more than half of adults are not getting the recommended seven hours of sleep per night. And despite the CDC findings that the Southeast struggles the most with sleep, many of the cities where the population sleeps the least are in the Northeast. Eight New Jersey cities and six Massachusetts cities are among the 50 cities that get the least sleep. Connecticut, Rhode Island, and New York also had multiple cities in the top 50 as well.
Click here to see the 50 cities getting the least sleep.
Click here to see our detailed findings and methodology.

50. Lynn, Massachusetts
> Adults w/ <7 hrs. sleep: 41.7%
> Population: 90,329
> Adult obesity rate: 29.8%
> Pct. people below poverty line: 20.0%
[in-text-ad]

49. Newport News, Virginia
> Adults w/ <7 hrs. sleep: 41.7%
> Population: 180,719
> Adult obesity rate: 34.1%
> Pct. people below poverty line: 16.1%

48. Waterbury, Connecticut
> Adults w/ <7 hrs. sleep: 41.9%
> Population: 110,366
> Adult obesity rate: 35.0% (top 25%)
> Pct. people below poverty line: 25.4% (top 25%)

47. Hartford, Connecticut
> Adults w/ <7 hrs. sleep: 42.0%
> Population: 124,775
> Adult obesity rate: 38.2% (top 10%)
> Pct. people below poverty line: 31.9% (top 10%)
[in-text-ad-2]

46. Mobile, Alabama
> Adults w/ <7 hrs. sleep: 42.2%
> Population: 195,111
> Adult obesity rate: 35.3%
> Pct. people below poverty line: 23.1%

45. Pawtucket, Rhode Island
> Adults w/ <7 hrs. sleep: 42.2%
> Population: 71,148
> Adult obesity rate: 30.4% (top 25%)
> Pct. people below poverty line: 19.9%
[in-text-ad]

44. Allentown, Pennsylvania
> Adults w/ <7 hrs. sleep: 42.3%
> Population: 118,032
> Adult obesity rate: 38.6% (top 10%)
> Pct. people below poverty line: 26.7% (top 25%)

43. Inglewood, California
> Adults w/ <7 hrs. sleep: 42.4%
> Population: 109,673
> Adult obesity rate: 31.7%
> Pct. people below poverty line: 20.7% (top 10%)
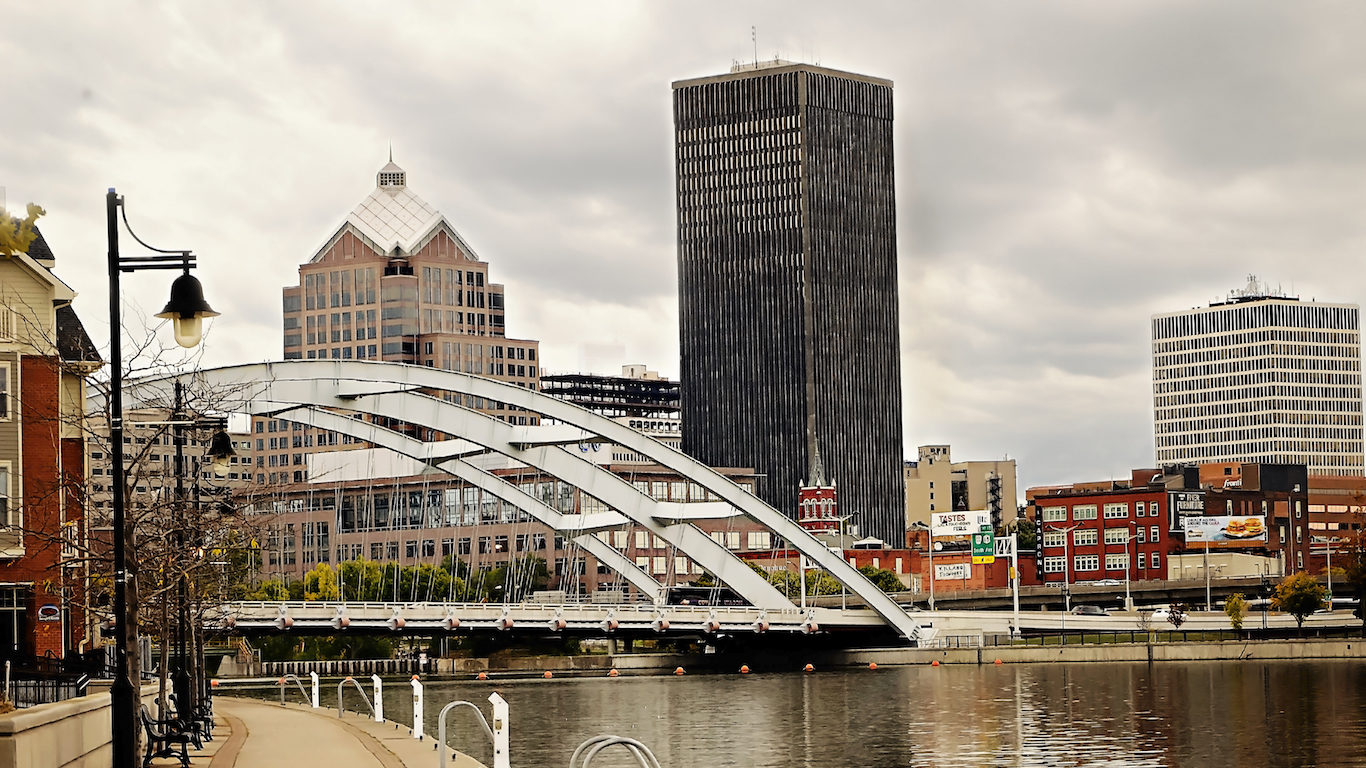
42. Rochester, New York
> Adults w/ <7 hrs. sleep: 42.4%
> Population: 210,565
> Adult obesity rate: 35.9% (top 25%)
> Pct. people below poverty line: 32.8% (top 10%)
[in-text-ad-2]

41. Providence, Rhode Island
> Adults w/ <7 hrs. sleep: 42.4%
> Population: 178,042
> Adult obesity rate: 31.9%
> Pct. people below poverty line: 28.2%
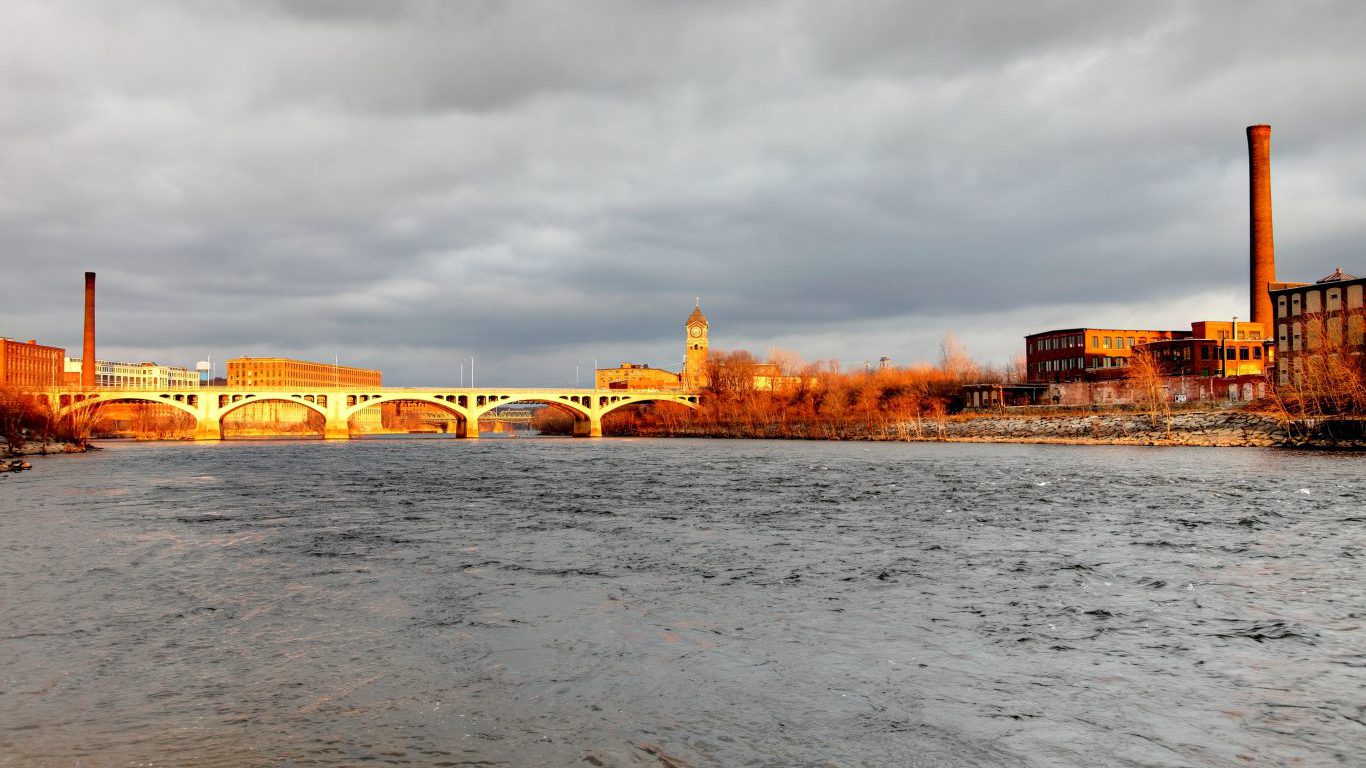
40. Lawrence, Massachusetts
> Adults w/ <7 hrs. sleep: 42.5%
> Population: 76,377
> Adult obesity rate: 34.2%
> Pct. people below poverty line: 26.4% (top 25%)
[in-text-ad]
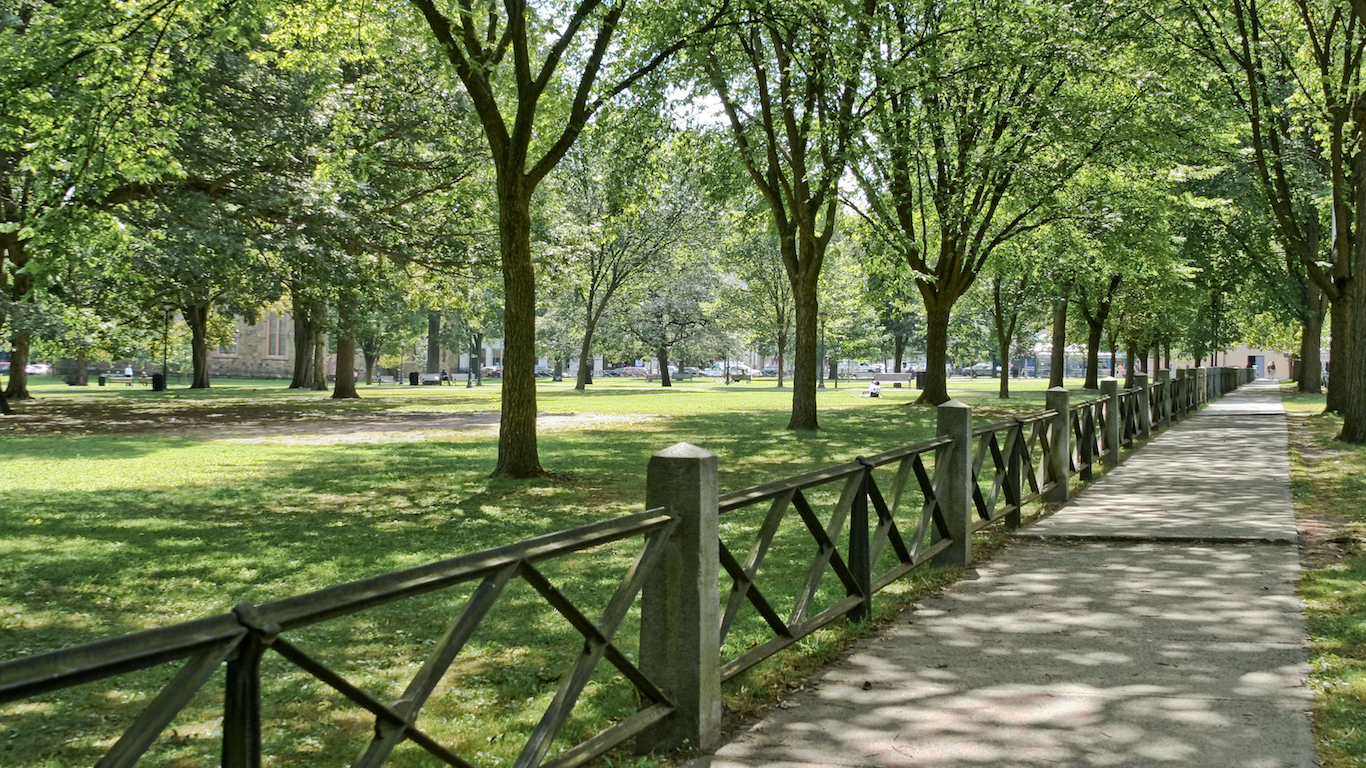
39. New Haven, Connecticut
> Adults w/ <7 hrs. sleep: 42.6%
> Population: 129,779
> Adult obesity rate: 35.3% (top 25%)
> Pct. people below poverty line: 26.1% (top 25%)

38. Columbus, Georgia
> Adults w/ <7 hrs. sleep: 42.9%
> Population: 189,885
> Adult obesity rate: 37.3% (top 10%)
> Pct. people below poverty line: 20.9%

37. Compton, California
> Adults w/ <7 hrs. sleep: 43.2%
> Population: 96,455
> Adult obesity rate: 33.4%
> Pct. people below poverty line: 25.5% (top 25%)
[in-text-ad-2]
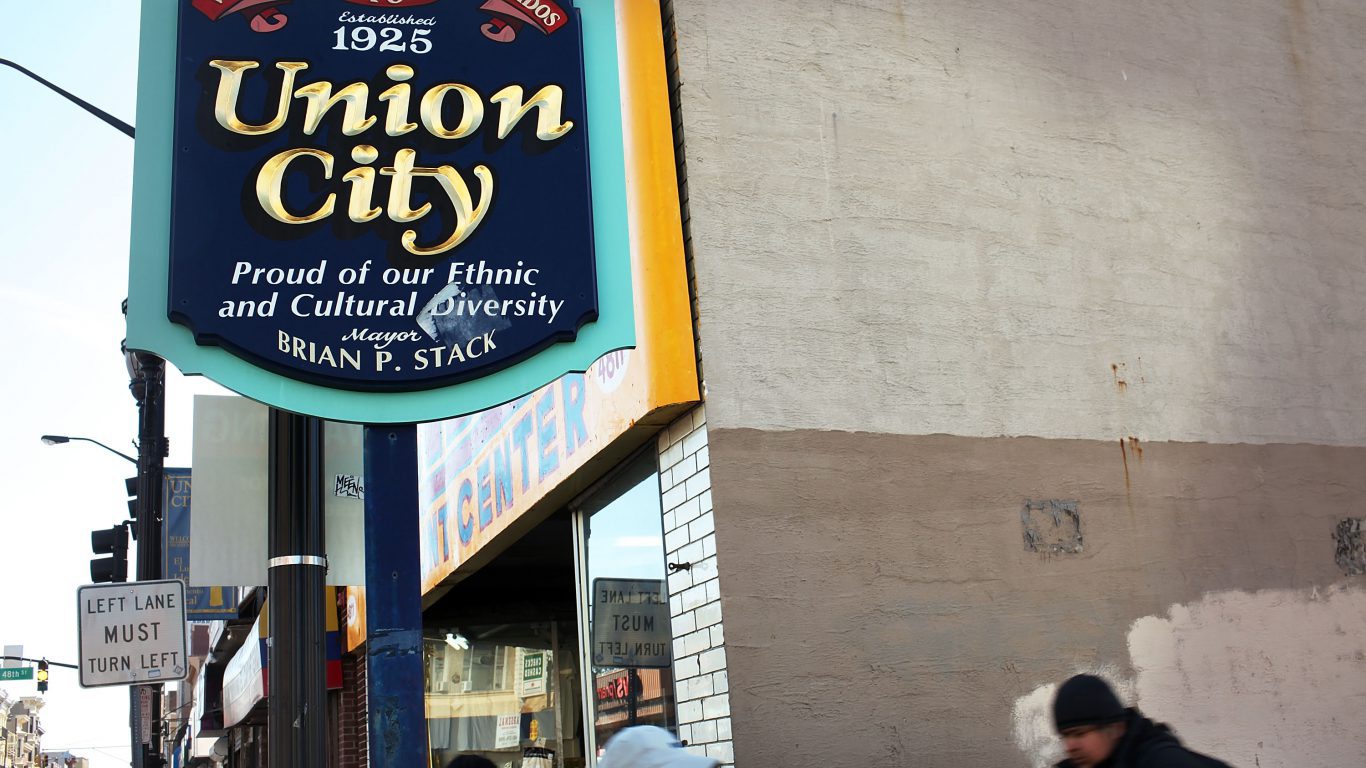
36. Union City, New Jersey
> Adults w/ <7 hrs. sleep: 43.2%
> Population: 66,455
> Adult obesity rate: 30.2%
> Pct. people below poverty line: 24.3% (top 25%)

35. Elizabeth, New Jersey
> Adults w/ <7 hrs. sleep: 43.4%
> Population: 124,969
> Adult obesity rate: 32.9%
> Pct. people below poverty line: 19.0%
[in-text-ad]

34. Springfield, Massachusetts
> Adults w/ <7 hrs. sleep: 43.5%
> Population: 153,060
> Adult obesity rate: 36.6% (top 25%)
> Pct. people below poverty line: 29.7%
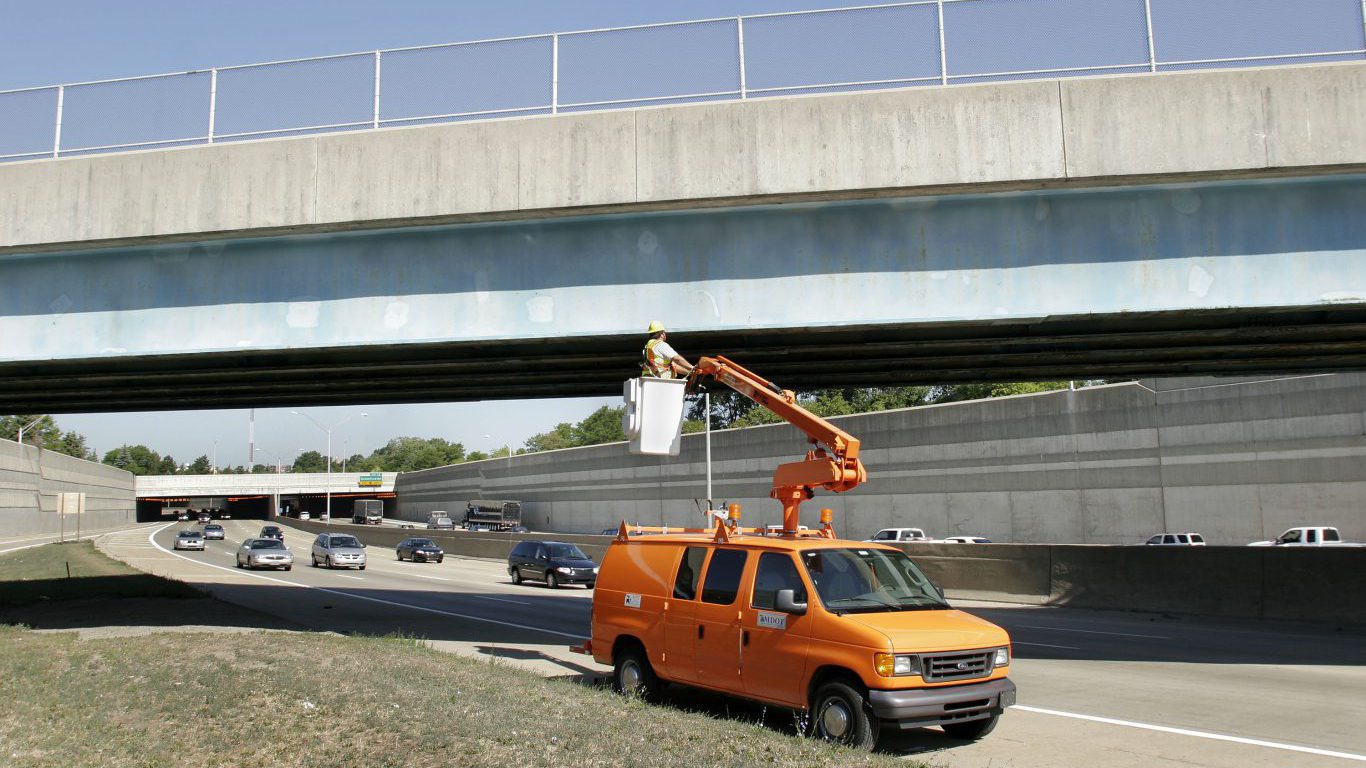
33. Southfield, Michigan
> Adults w/ <7 hrs. sleep: 43.5%
> Population: 71,739
> Adult obesity rate: 35.2% (top 25%)
> Pct. people below poverty line: 14.8% (top 10%)

32. Hammond, Indiana
> Adults w/ <7 hrs. sleep: 43.6%
> Population: 80,830
> Adult obesity rate: 36.9% (top 10%)
> Pct. people below poverty line: 23.4% (top 10%)
[in-text-ad-2]

31. Jackson, Mississippi
> Adults w/ <7 hrs. sleep: 43.6%
> Population: 173,514
> Adult obesity rate: 40.3% (top 25%)
> Pct. people below poverty line: 30.7% (top 10%)
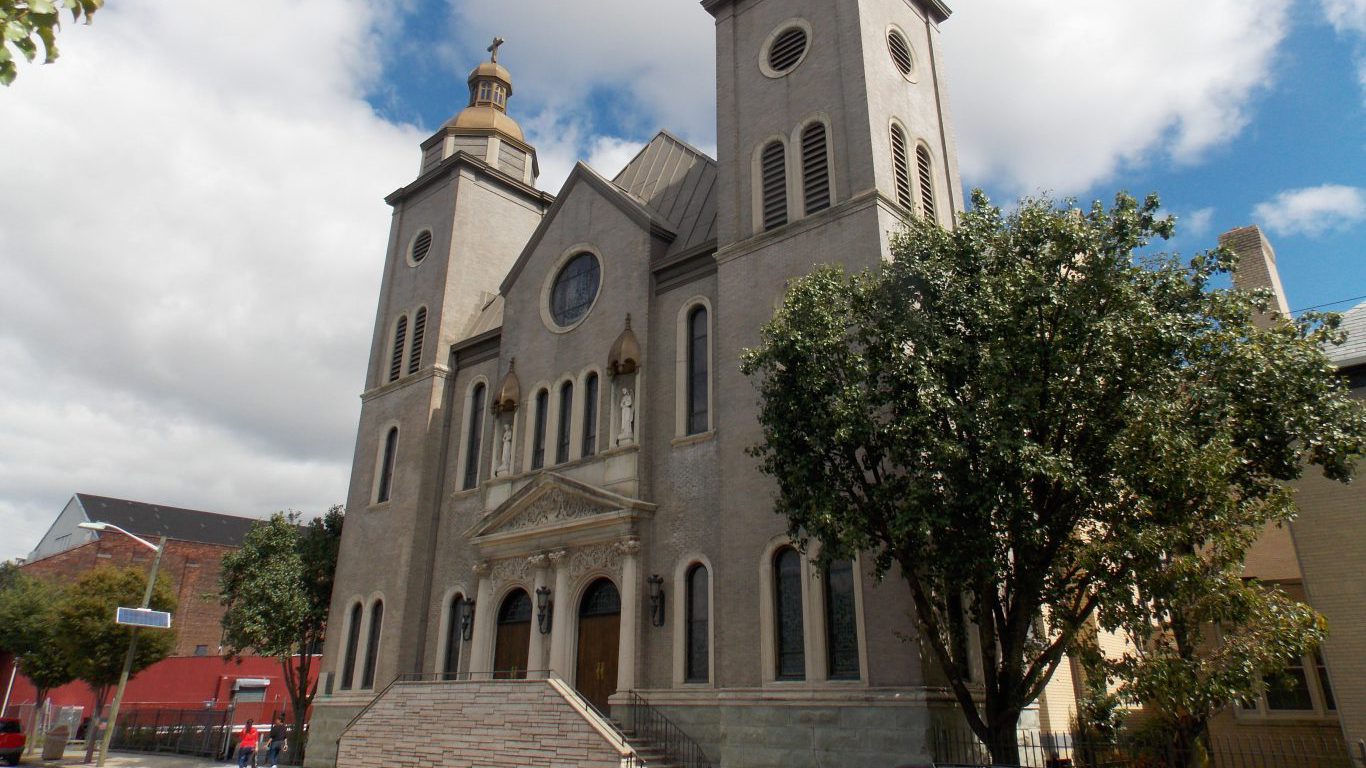
30. Passaic, New Jersey
> Adults w/ <7 hrs. sleep: 43.6%
> Population: 69,781
> Adult obesity rate: 37.0% (top 10%)
> Pct. people below poverty line: 31.9% (top 10%)
[in-text-ad]

29. Buffalo, New York
> Adults w/ <7 hrs. sleep: 43.6%
> Population: 261,310
> Adult obesity rate: 38.4% (top 25%)
> Pct. people below poverty line: 31.2% (top 25%)
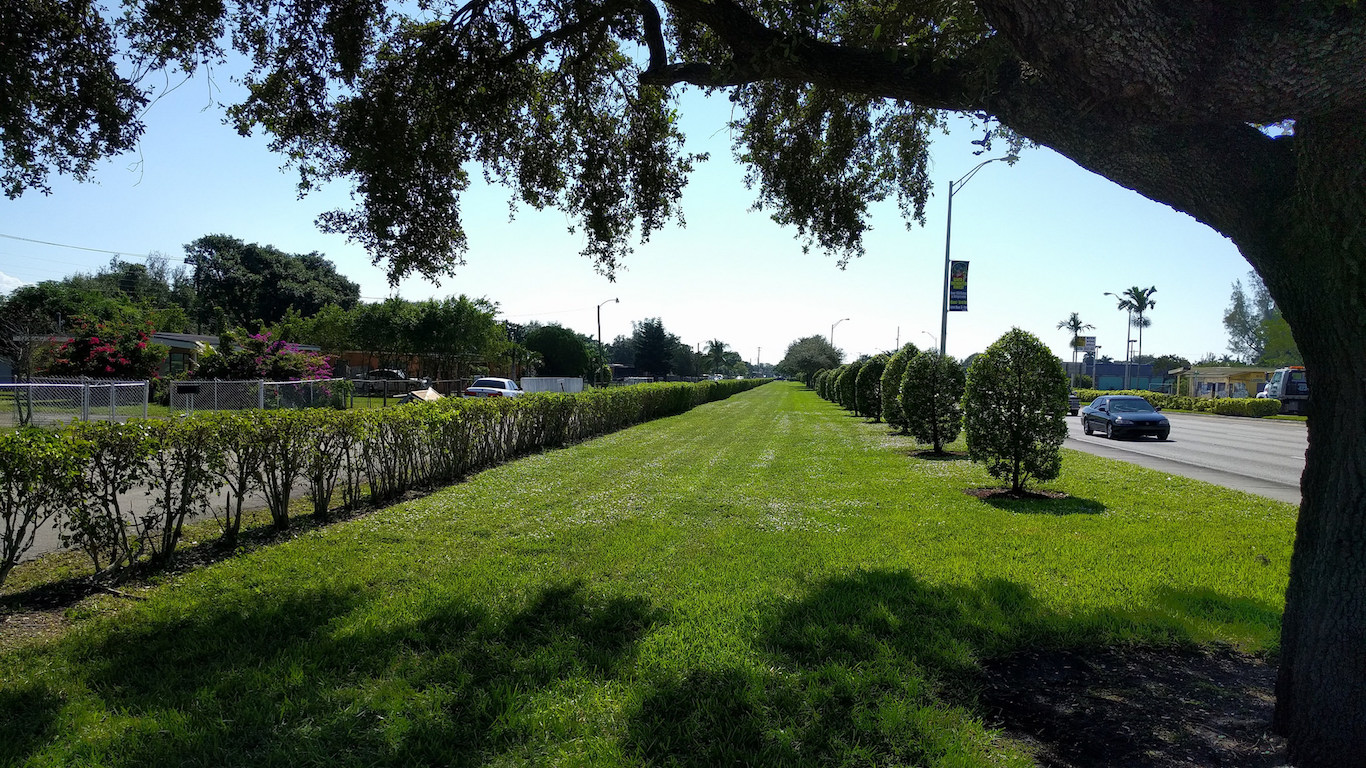
28. Miami Gardens, Florida
> Adults w/ <7 hrs. sleep: 43.7%
> Population: 107,167
> Adult obesity rate: 33.6% (bottom 25%)
> Pct. people below poverty line: 23.4%

27. Jersey City, New Jersey
> Adults w/ <7 hrs. sleep: 43.7%
> Population: 247,597
> Adult obesity rate: 24.2%
> Pct. people below poverty line: 19.4% (top 25%)
[in-text-ad-2]
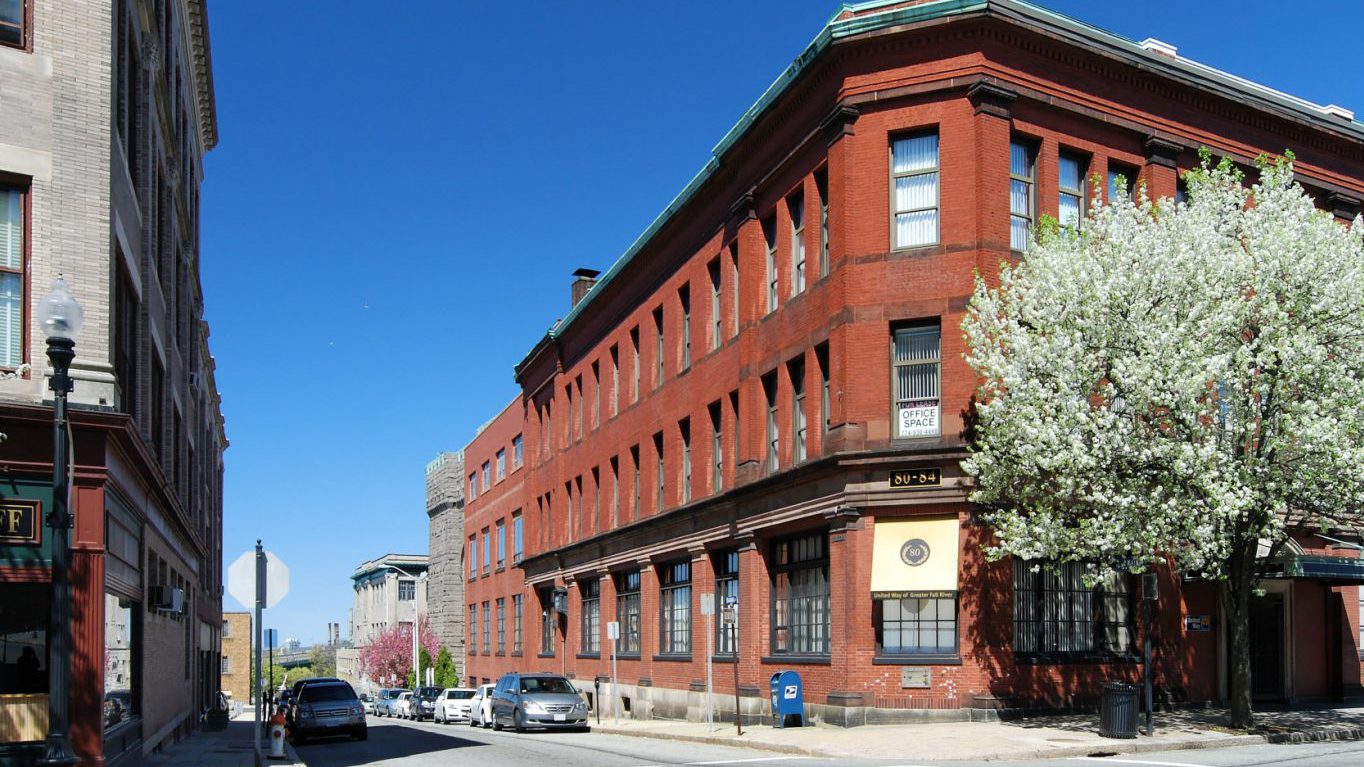
26. Fall River, Massachusetts
> Adults w/ <7 hrs. sleep: 43.9%
> Population: 88,857
> Adult obesity rate: 32.7%
> Pct. people below poverty line: 22.0%
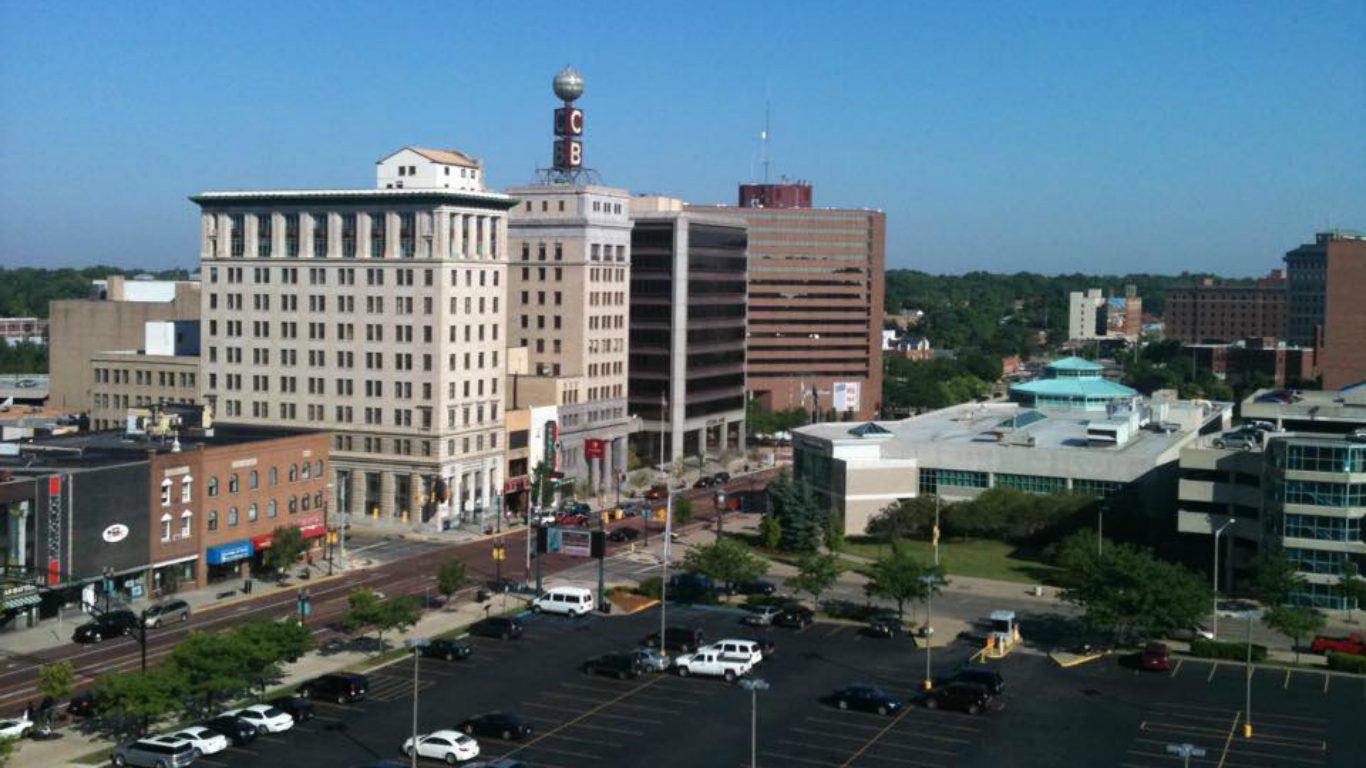
25. Flint, Michigan
> Adults w/ <7 hrs. sleep: 44.0%
> Population: 102,434
> Adult obesity rate: 42.0% (top 10%)
> Pct. people below poverty line: 41.9% (top 10%)
[in-text-ad]

24. Augusta, Georgia
> Adults w/ <7 hrs. sleep: 44.1%
> Population: 195,844
> Adult obesity rate: 36.5% (top 25%)
> Pct. people below poverty line: 25.3% (top 25%)

23. Akron, Ohio
> Adults w/ <7 hrs. sleep: 44.1%
> Population: 199,110
> Adult obesity rate: 34.9% (top 25%)
> Pct. people below poverty line: 25.4% (top 25%)
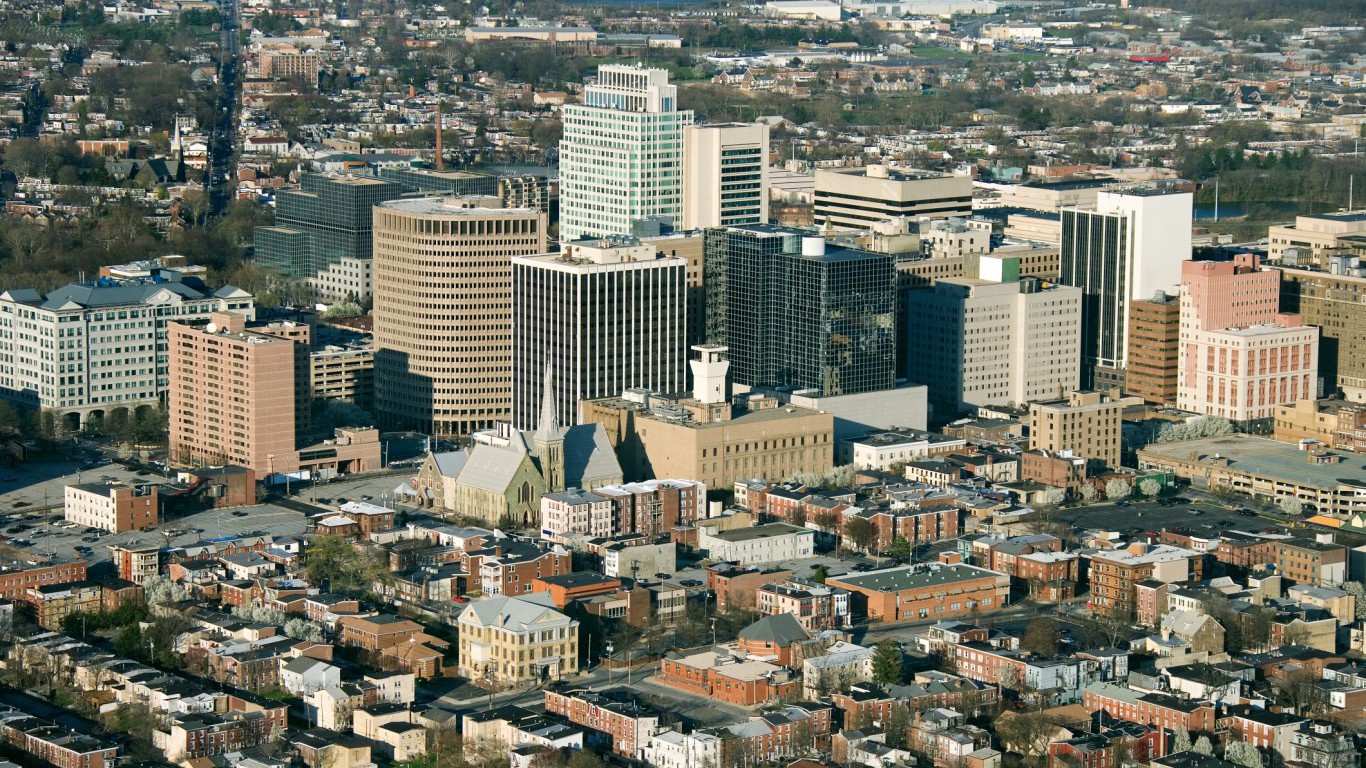
22. Wilmington, Delaware
> Adults w/ <7 hrs. sleep: 44.2%
> Population: 70,851
> Adult obesity rate: 37.0% (top 25%)
> Pct. people below poverty line: 26.1% (top 25%)
[in-text-ad-2]
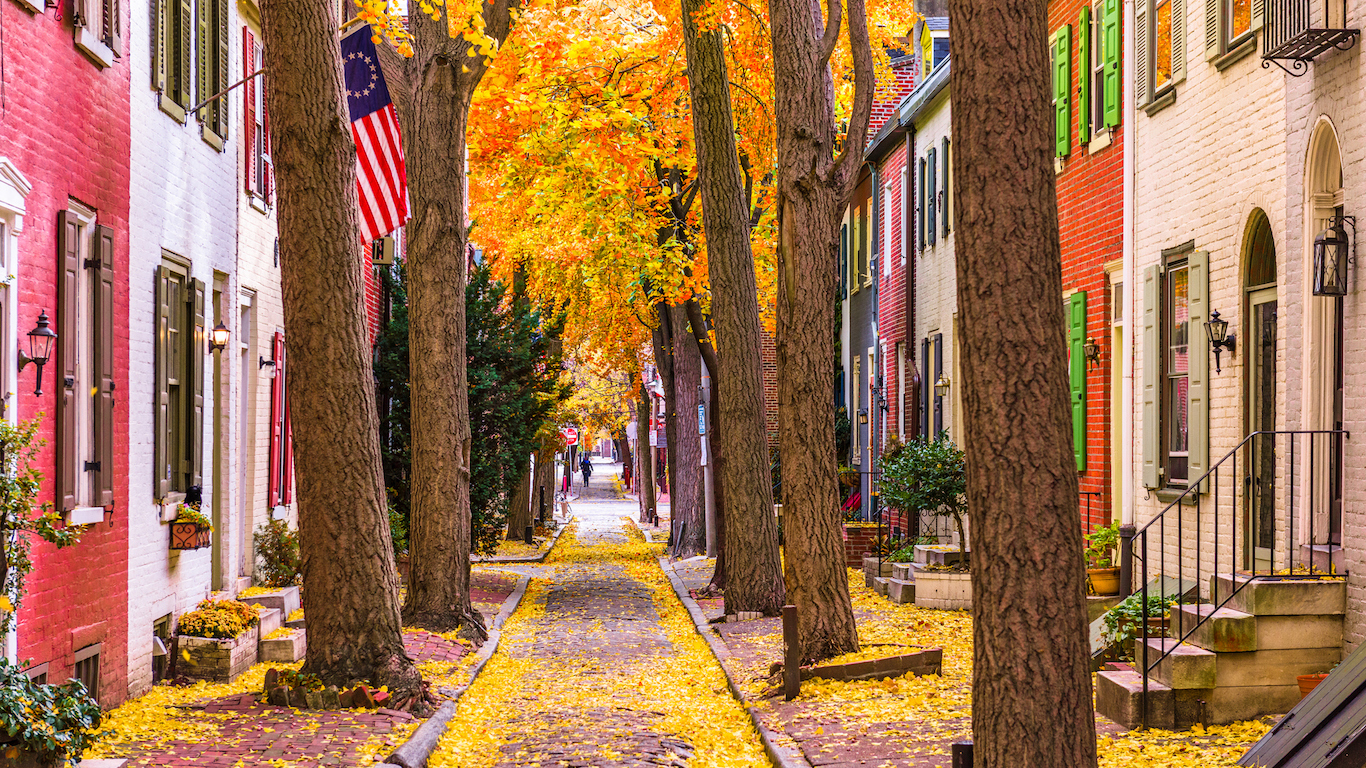
21. Philadelphia, Pennsylvania
> Adults w/ <7 hrs. sleep: 44.3%
> Population: 1,526,006
> Adult obesity rate: 31.6%
> Pct. people below poverty line: 25.9% (top 25%)

20. Baltimore, Maryland
> Adults w/ <7 hrs. sleep: 44.4%
> Population: 620,961
> Adult obesity rate: 34.8% (top 25%)
> Pct. people below poverty line: 23.1%
[in-text-ad]

19. Hampton, Virginia
> Adults w/ <7 hrs. sleep: 44.4%
> Population: 137,436
> Adult obesity rate: 36.4% (top 25%)
> Pct. people below poverty line: 15.6%
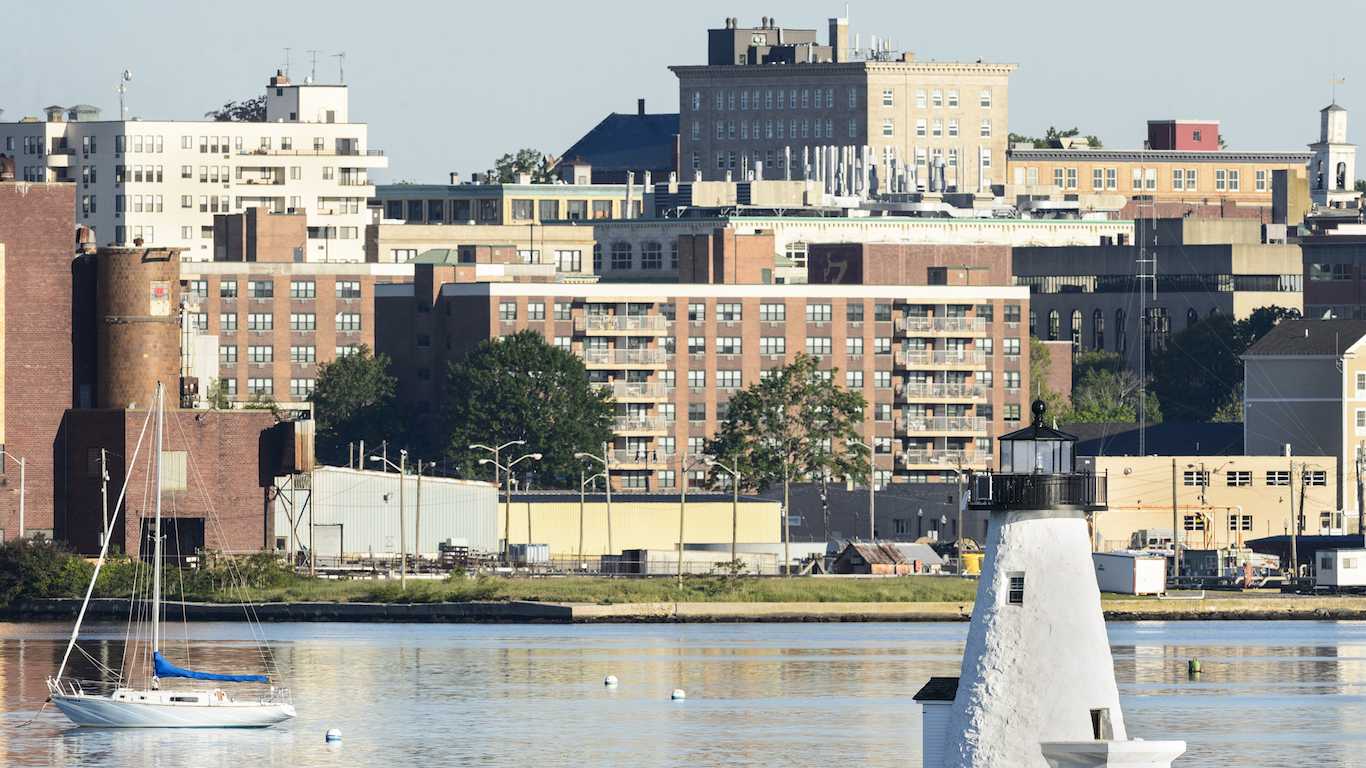
18. New Bedford, Massachusetts
> Adults w/ <7 hrs. sleep: 44.5%
> Population: 95,072
> Adult obesity rate: 33.8%
> Pct. people below poverty line: 23.5% (top 25%)

17. Savannah, Georgia
> Adults w/ <7 hrs. sleep: 44.6%
> Population: 136,286
> Adult obesity rate: 38.6% (top 10%)
> Pct. people below poverty line: 25.4% (top 25%)
[in-text-ad-2]
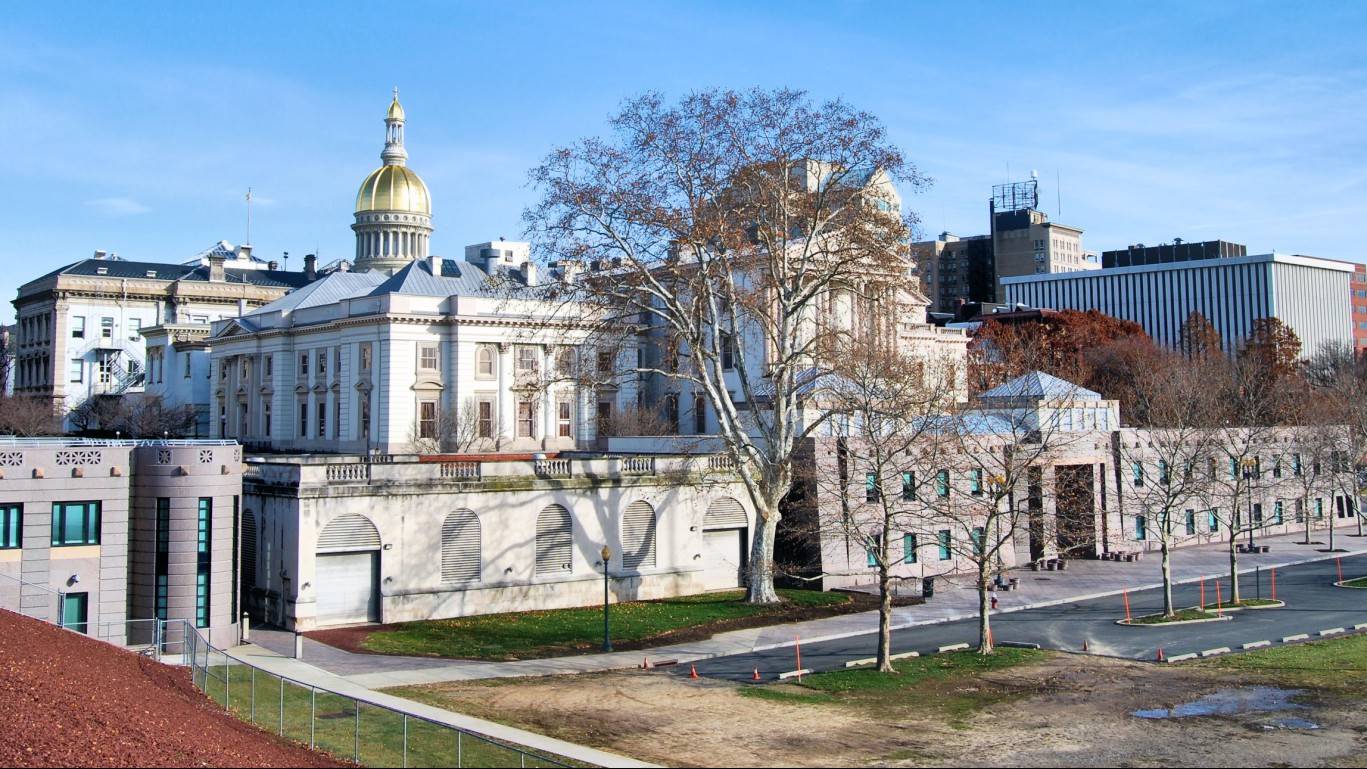
16. Trenton, New Jersey
> Adults w/ <7 hrs. sleep: 45.3%
> Population: 84,913
> Adult obesity rate: 37.2% (top 10%)
> Pct. people below poverty line: 27.6% (top 25%)

15. Cleveland, Ohio
> Adults w/ <7 hrs. sleep: 45.4%
> Population: 396,815
> Adult obesity rate: 40.1% (top 10%)
> Pct. people below poverty line: 36.0% (top 10%)
[in-text-ad]

14. Brockton, Massachusetts
> Adults w/ <7 hrs. sleep: 45.7%
> Population: 93,810
> Adult obesity rate: 34.4% (top 10%)
> Pct. people below poverty line: 18.2% (top 10%)

13. Paterson, New Jersey
> Adults w/ <7 hrs. sleep: 45.7%
> Population: 146,199
> Adult obesity rate: 38.7% (top 10%)
> Pct. people below poverty line: 29.1% (top 10%)
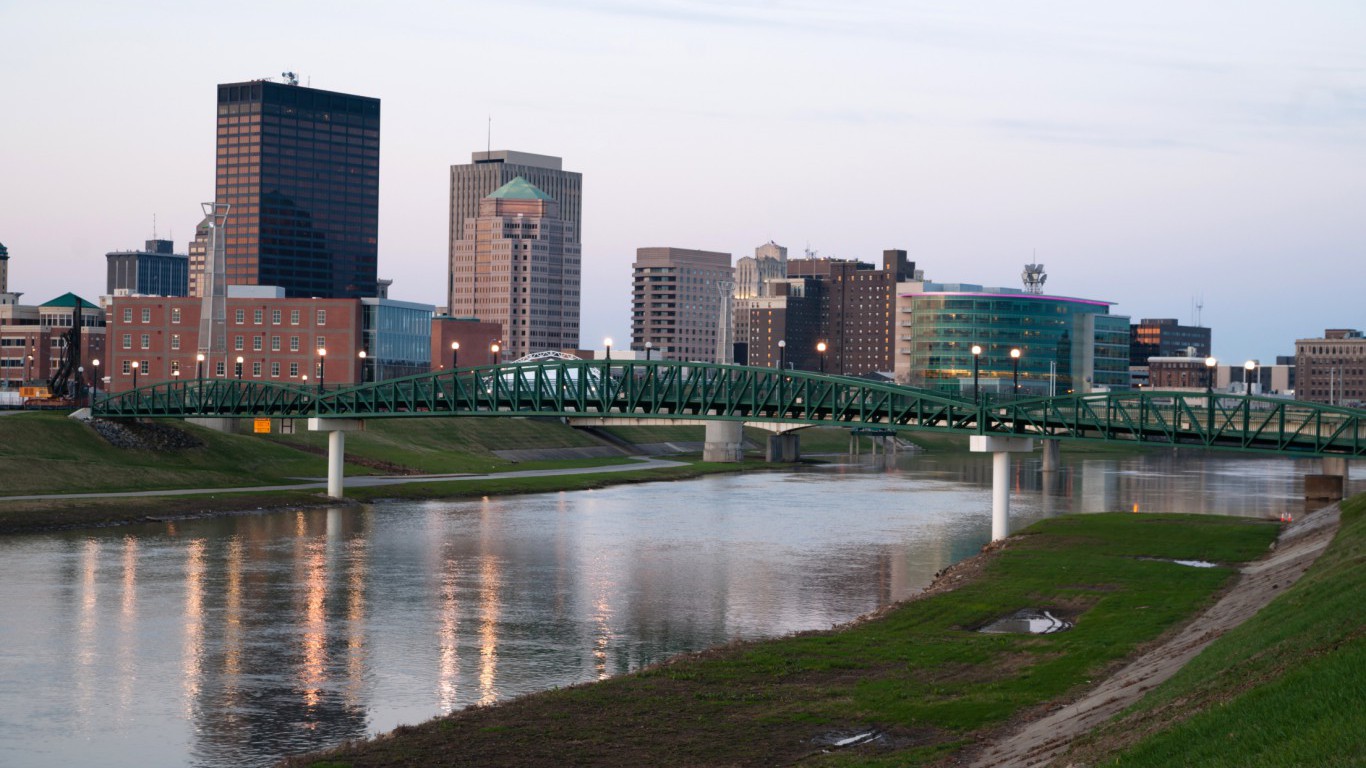
12. Dayton, Ohio
> Adults w/ <7 hrs. sleep: 45.7%
> Population: 141,527
> Adult obesity rate: 39.7%
> Pct. people below poverty line: 34.5%
[in-text-ad-2]
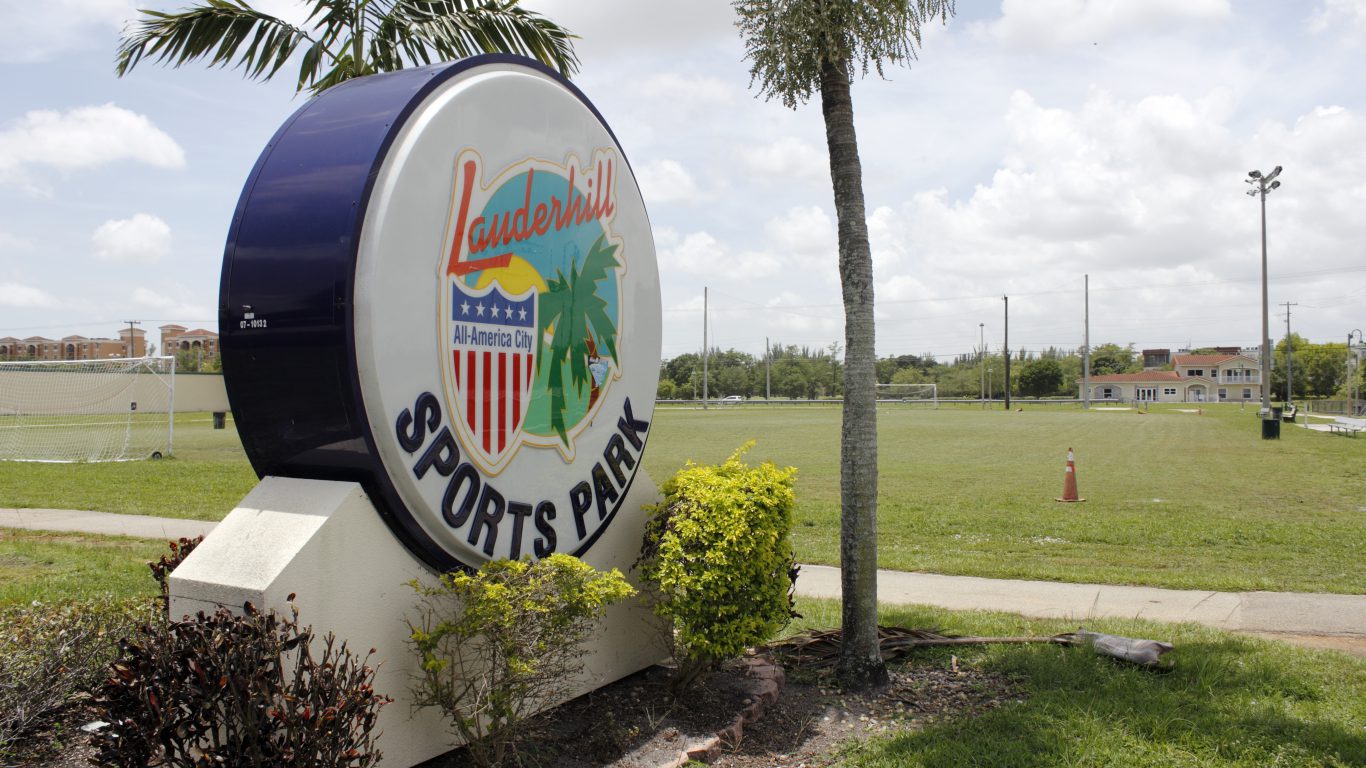
11. Lauderhill, Florida
> Adults w/ <7 hrs. sleep: 45.8%
> Population: 66,887
> Adult obesity rate: 36.1% (top 25%)
> Pct. people below poverty line: 23.7% (top 25%)
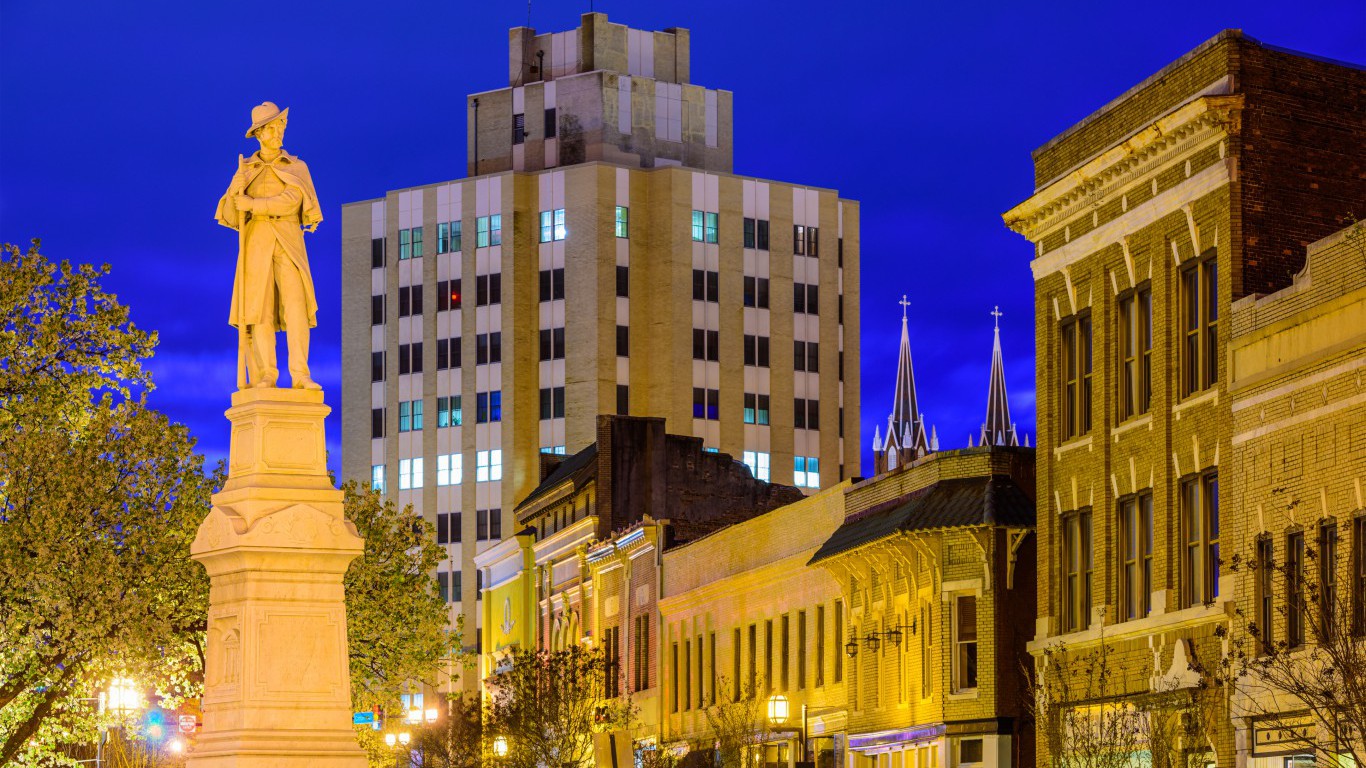
10. Macon, Georgia
> Adults w/ <7 hrs. sleep: 46.0%
> Population: 91,351
> Adult obesity rate: 41.2% (top 10%)
> Pct. people below poverty line: 27.8% (top 10%)
[in-text-ad]

9. Youngstown, Ohio
> Adults w/ <7 hrs. sleep: 46.0%
> Population: 66,982
> Adult obesity rate: 40.6% (top 10%)
> Pct. people below poverty line: 38.0% (top 10%)
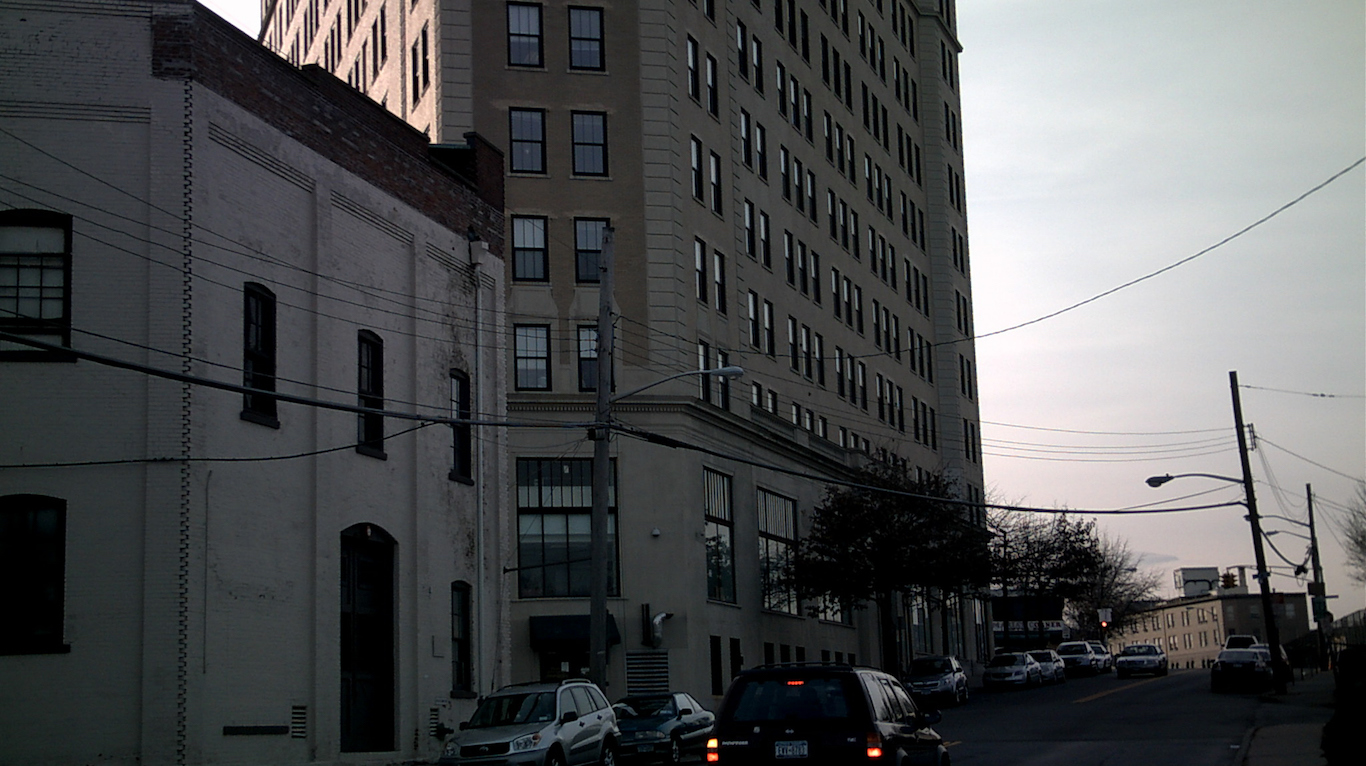
8. Mount Vernon, New York
> Adults w/ <7 hrs. sleep: 46.7%
> Population: 67,292
> Adult obesity rate: 30.9%
> Pct. people below poverty line: 16.0%

7. Birmingham, Alabama
> Adults w/ <7 hrs. sleep: 46.9%
> Population: 212,237
> Adult obesity rate: 42.7% (top 10%)
> Pct. people below poverty line: 29.4% (top 10%)
[in-text-ad-2]

6. Albany, Georgia
> Adults w/ <7 hrs. sleep: 46.9%
> Population: 77,434
> Adult obesity rate: 41.4% (top 10%)
> Pct. people below poverty line: 33.2% (top 10%)

5. Honolulu, Hawaii
> Adults w/ <7 hrs. sleep: 48.0%
> Population: 953,207
> Adult obesity rate: 22.1% (top 10%)
> Pct. people below poverty line: 12.1% (top 10%)
[in-text-ad]
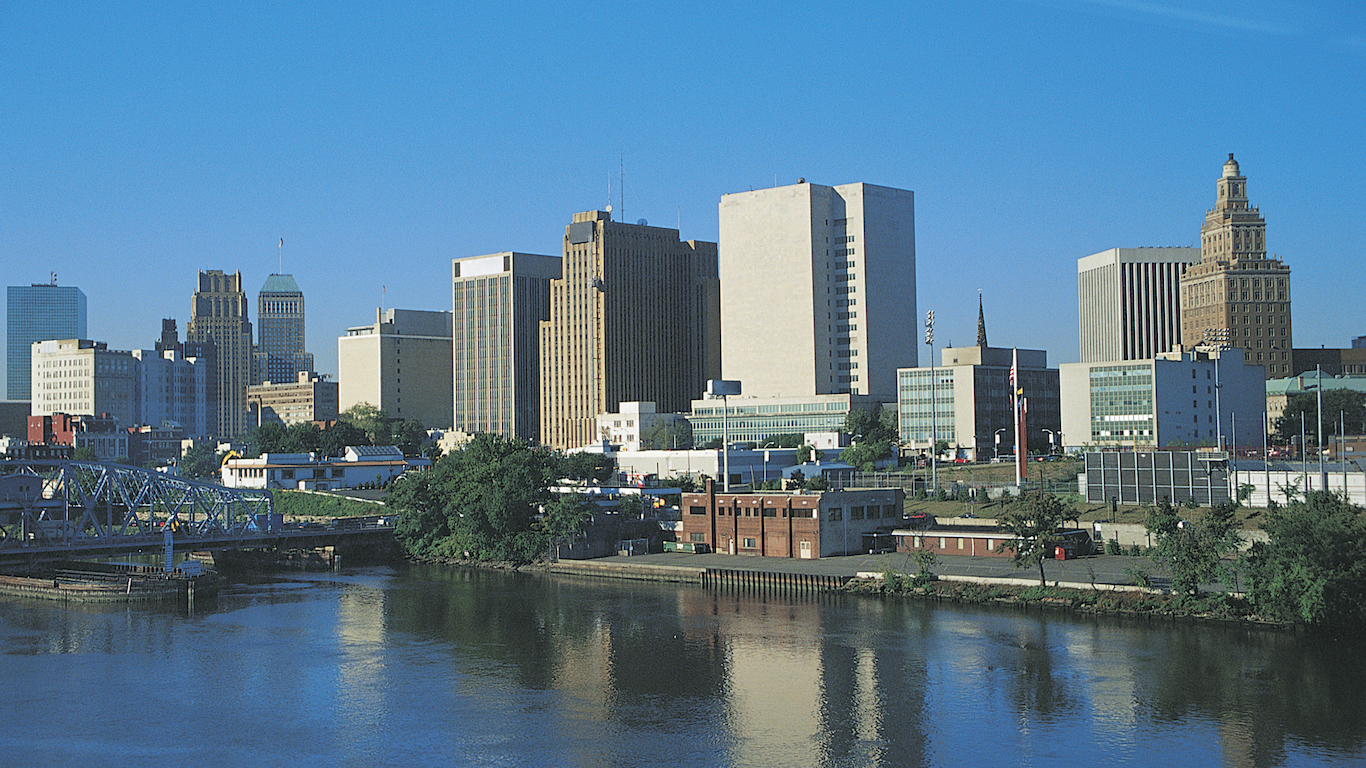
4. Newark, New Jersey
> Adults w/ <7 hrs. sleep: 48.0%
> Population: 277,140
> Adult obesity rate: 38.1% (bottom 10%)
> Pct. people below poverty line: 29.1% (bottom 25%)

3. Detroit, Michigan
> Adults w/ <7 hrs. sleep: 50.8%
> Population: 713,777
> Adult obesity rate: 45.1% (top 10%)
> Pct. people below poverty line: 39.4% (top 10%)
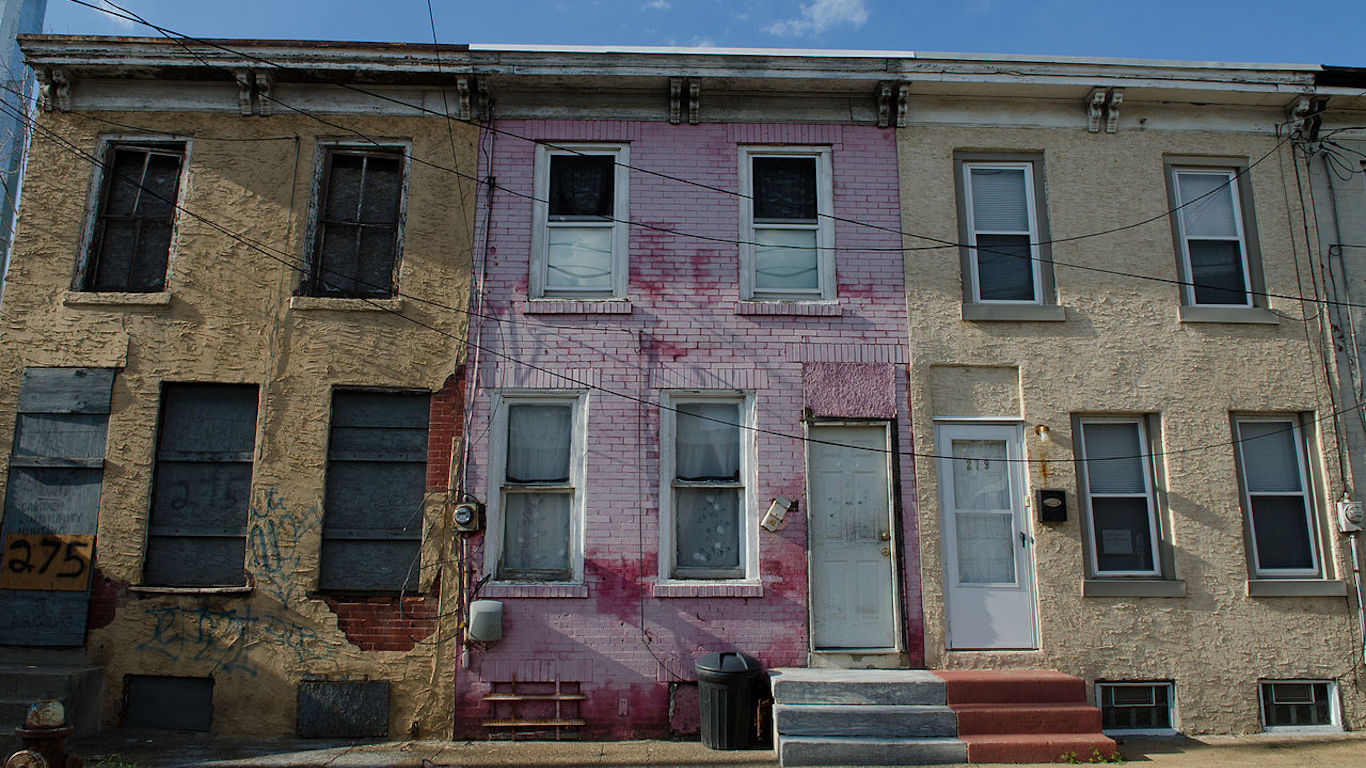
2. Camden, New Jersey
> Adults w/ <7 hrs. sleep: 50.8%
> Population: 77,344
> Adult obesity rate: 40.9% (top 10%)
> Pct. people below poverty line: 38.4% (top 10%)
[in-text-ad-2]

1. Gary, Indiana
> Adults w/ <7 hrs. sleep: 52.0%
> Population: 80,294
> Adult obesity rate: 45.2% (top 10%)
> Pct. people below poverty line: 35.9% (top 10%)
Detailed Findings & Methodology
A number of factors can contribute to sleep deprivation. People can have a hard time falling asleep if they exercise too close to bedtime, don’t get enough physical activity, drink too much coffee or alcohol, use their phone too late, or are just too stressed.
Anyone can have trouble sleeping, but it is more prevalent among some types of people than others. The CDC found that just 54% of Native Hawaiians/Pacific Islanders, non-Hispanic blacks, and multiracial non-Hispanics get enough sleep.
The CDC also learned that sleep loss was more prevalent among Americans who live in the Southeast and Appalachian Mountains. This may be partially explained by the high incidence of other chronic conditions like obesity and high blood pressure in these places.
Indeed, whether someone sleeps enough is often tied in with a number of other behavioral factors and health outcomes. Obesity is one of the most telling indicators of whether an adult is sleep deprived.
The National Sleep Foundation says being overweight can cause breathing-related sleep disorders, including sleep apnea. This can cause that person to be tired and less likely to exercise the next day leading to a vicious cycle of exhaustion.
Five of the ten most sleep deprived U.S. cities also rank in the top ten for obesity. Gary, Indiana and Detroit, Michigan, which report the highest and second highest shares of adults not getting enough sleep, also have the two highest obesity rates.
Tobacco use is also a leading indicator for sleep deprivation, and smoking has been shown to cause both insomnia and sleep apnea. Among the 50 cities not getting enough sleep, 47 have a higher than average rate of adults who smoke.
In order to determine the 50 cities getting the least sleep, 24/7 Wall St. reviewed data from the Centers for Disease Control and Prevention’s 500 Cities Project, which tracked chronic disease risk factors and health outcomes in the largest U.S. cities. The ranking is based on the percentage of adults age 18 and up sleeping fewer than seven hours per night. The rate of adults getting inadequate sleep and the adult obesity rate comes from the 500 Cities Project. Population figures come from the 2010 census and the poverty figures come from the U.S. Census Bureau’s 2016 American Community Survey.
Get Ready To Retire (Sponsored)
Start by taking a quick retirement quiz from SmartAsset that will match you with up to 3 financial advisors that serve your area and beyond in 5 minutes, or less.
Each advisor has been vetted by SmartAsset and is held to a fiduciary standard to act in your best interests.
Here’s how it works:
1. Answer SmartAsset advisor match quiz
2. Review your pre-screened matches at your leisure. Check out the advisors’ profiles.
3. Speak with advisors at no cost to you. Have an introductory call on the phone or introduction in person and choose whom to work with in the future
Thank you for reading! Have some feedback for us?
Contact the 24/7 Wall St. editorial team.
 24/7 Wall St.
 24/7 Wall St.
 24/7 Wall St.
 24/7 Wall St.


