Special Report
Cities Where People Make the Most on Home Sales

Published:
Last Updated:

For Americans fortunate enough to do so, purchasing a home is often the investment of a lifetime. Whether they plan to sell at some point or not, homeowners expect the value of their investment to appreciate over time and home equity to rise.
Of course, home prices depend heavily on location. 24/7 Wall St. reviewed average home price gains in metropolitan statistical areas of 200,000 people or more provided by property data clearing house Attom Data Solutions. Attom compared properties sold in 2017 to the last time those properties were sold, and calculated the percentage gain in home equity.
The gains were 50% or greater in just 19 of the 150 markets considered. Across the list of 50 metro areas where homeowners gained most, home equity gains ranged from 77% to 35%.
Because home values fluctuate over time, capitalizing on a home investment is a question of timing more than anything else. In the vast majority of metro areas, the median home sale price in 2017 was significantly greater than the median sale price the last time those properties were sold. This was not necessarily the case in these areas in previous years. Over the nearly two decades of home sales considered, homes were sold at a loss in at least one year in nearly every metro area in the country.
Click here to see the cities where people make the most on home sales.
Click here to see our detailed findings and methodology.
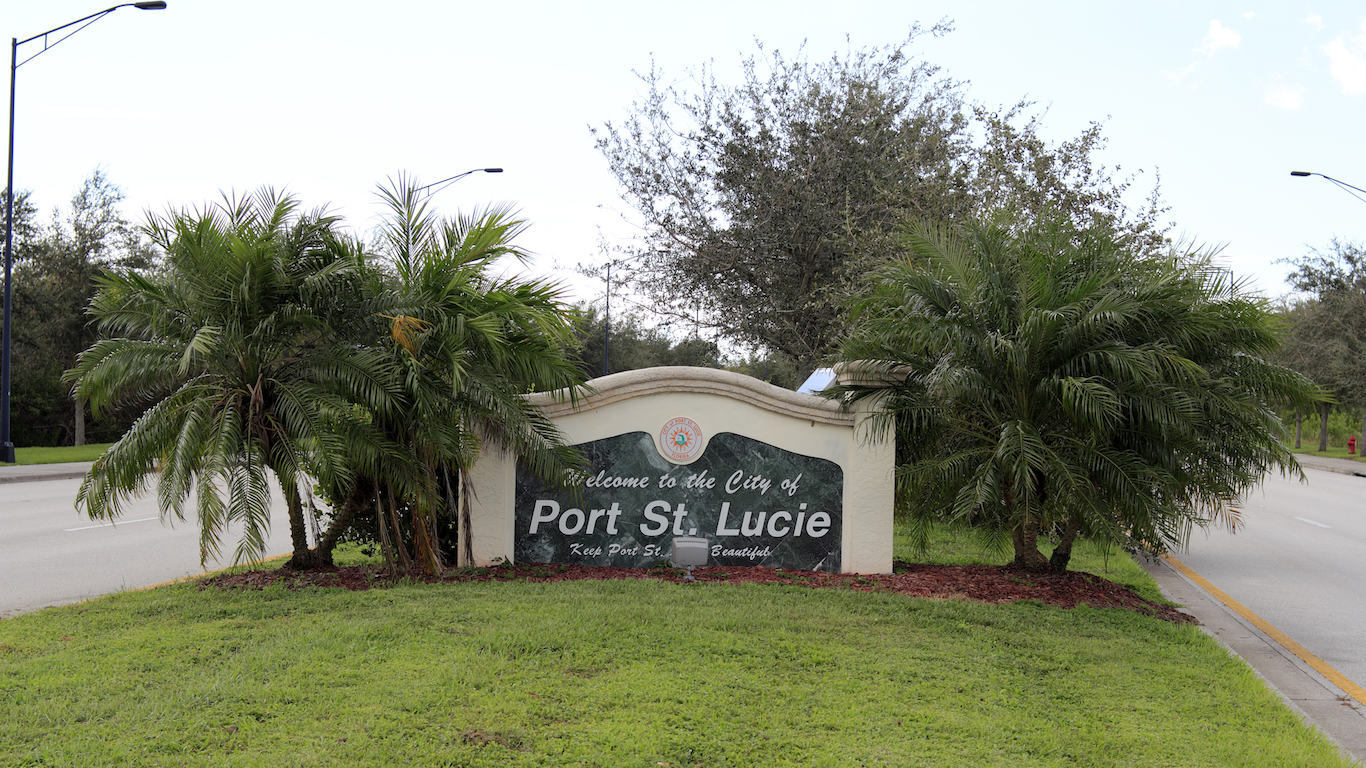
50. Port St. Lucie, FL
> Average home price gain since last purchase: +35.3% (+$51,100)
> Average home sale (2017): $266,546
> Best historical time to sell: 2005 (+162.8% price chg. since last purchase)
> Worst historical time to sell: 2009 (-43.8% price chg. since last purchase)
> Average outstanding home loan: $240,704
> Median household income: $48,746
[in-text-ad]

49. Kennewick-Richland, WA
> Average home price gain since last purchase: +35.8% (+$59,321)
> Average home sale (2017): $239,430
> Best historical time to sell: 2002 (+46.6% price chg. since last purchase)
> Worst historical time to sell: 2009 (10.4% price chg. since last purchase)
> Average outstanding home loan: $219,383
> Median household income: $61,021

48. Knoxville, TN
> Average home price gain since last purchase: +35.8% (+$39,400)
> Average home sale (2017): $200,092
> Best historical time to sell: 2006 (+56.0% price chg. since last purchase)
> Worst historical time to sell: 2012 (5.5% price chg. since last purchase)
> Average outstanding home loan: $215,504
> Median household income: $49,862

47. Houston-The Woodlands-Sugar Land, TX
> Average home price gain since last purchase: +36.6% (+$56,188)
> Average home sale (2017): $278,309
> Best historical time to sell: 2016 (+39.7% price chg. since last purchase)
> Worst historical time to sell: 2012 (-7.8% price chg. since last purchase)
> Average outstanding home loan: $278,546
> Median household income: $61,708
[in-text-ad-2]

46. Chico, CA
> Average home price gain since last purchase: +36.8% (+$70,000)
> Average home sale (2017): $285,770
> Best historical time to sell: 2005 (+123.8% price chg. since last purchase)
> Worst historical time to sell: 2011 (-19.1% price chg. since last purchase)
> Average outstanding home loan: $219,587
> Median household income: $45,177

45. North Port-Sarasota-Bradenton, FL
> Average home price gain since last purchase: +37.1% (+$65,000)
> Average home sale (2017): $341,191
> Best historical time to sell: 2006 (+91.2% price chg. since last purchase)
> Worst historical time to sell: 2010 (-30.9% price chg. since last purchase)
> Average outstanding home loan: $269,114
> Median household income: $53,625
[in-text-ad]

44. Spokane-Spokane Valley, WA
> Average home price gain since last purchase: +37.9% (+$55,000)
> Average home sale (2017): $227,633
> Best historical time to sell: 2006 (+66.1% price chg. since last purchase)
> Worst historical time to sell: 2000 (8.1% price chg. since last purchase)
> Average outstanding home loan: $192,897
> Median household income: $52,955

43. Phoenix-Mesa-Scottsdale, AZ
> Average home price gain since last purchase: +38.3% (+$66,310)
> Average home sale (2017): $306,801
> Best historical time to sell: 2006 (+76.9% price chg. since last purchase)
> Worst historical time to sell: 2011 (-34.8% price chg. since last purchase)
> Average outstanding home loan: $287,157
> Median household income: $58,075

42. Ogden-Clearfield, UT
> Average home price gain since last purchase: +38.9% (+$63,956)
> Average home sale (2017): $255,666
> Best historical time to sell: 2017 (+38.9% price chg. since last purchase)
> Worst historical time to sell: 2012 (7.9% price chg. since last purchase)
> Average outstanding home loan: $268,159
> Median household income: $70,227
[in-text-ad-2]
41. Bremerton-Silverdale, WA
> Average home price gain since last purchase: +39.3% (+$84,000)
> Average home sale (2017): $376,544
> Best historical time to sell: 2006 (+92.2% price chg. since last purchase)
> Worst historical time to sell: 2012 (15.0% price chg. since last purchase)
> Average outstanding home loan: $265,529
> Median household income: $69,171

40. Santa Maria-Santa Barbara, CA
> Average home price gain since last purchase: +39.7% (+$145,000)
> Average home sale (2017): $903,773
> Best historical time to sell: 2005 (+104.8% price chg. since last purchase)
> Worst historical time to sell: 2009 (-28.1% price chg. since last purchase)
> Average outstanding home loan: $485,904
> Median household income: $67,436
[in-text-ad]

39. Provo-Orem, UT
> Average home price gain since last purchase: +40.0% (+$73,961)
> Average home sale (2017): $307,241
> Best historical time to sell: 2007 (+48.3% price chg. since last purchase)
> Worst historical time to sell: 2011 (-2.8% price chg. since last purchase)
> Average outstanding home loan: $289,166
> Median household income: $69,288

38. Yakima, WA
> Average home price gain since last purchase: +40.6% (+$54,000)
> Average home sale (2017): $208,920
> Best historical time to sell: 2007 (+53.2% price chg. since last purchase)
> Worst historical time to sell: 2014 (17.8% price chg. since last purchase)
> Average outstanding home loan: $179,020
> Median household income: $48,965

37. Ann Arbor, MI
> Average home price gain since last purchase: +41.2% (+$70,000)
> Average home sale (2017): $603,302
> Best historical time to sell: 2017 (+41.2% price chg. since last purchase)
> Worst historical time to sell: 2009 (-20.7% price chg. since last purchase)
> Average outstanding home loan: $243,366
> Median household income: $65,601
[in-text-ad-2]

36. Miami-Fort Lauderdale-West Palm Beach, FL
> Average home price gain since last purchase: +41.4% (+$71,100)
> Average home sale (2017): $431,538
> Best historical time to sell: 2005 (+66.7% price chg. since last purchase)
> Worst historical time to sell: 2010 (-47.6% price chg. since last purchase)
> Average outstanding home loan: $342,498
> Median household income: $51,362

35. Oxnard-Thousand Oaks-Ventura, CA
> Average home price gain since last purchase: +41.4% (+$165,500)
> Average home sale (2017): $733,333
> Best historical time to sell: 2005 (+109.7% price chg. since last purchase)
> Worst historical time to sell: 2009 (-18.9% price chg. since last purchase)
> Average outstanding home loan: $443,641
> Median household income: $80,135
[in-text-ad]

34. Las Vegas-Henderson-Paradise, NV
> Average home price gain since last purchase: +41.8% (+$71,100)
> Average home sale (2017): $290,126
> Best historical time to sell: 2005 (+84.2% price chg. since last purchase)
> Worst historical time to sell: 2011 (-45.8% price chg. since last purchase)
> Average outstanding home loan: $275,930
> Median household income: $54,384

33. Salinas, CA
> Average home price gain since last purchase: +42.1% (+$160,000)
> Average home sale (2017): $805,128
> Best historical time to sell: 2005 (+98.5% price chg. since last purchase)
> Worst historical time to sell: 2009 (-53.0% price chg. since last purchase)
> Average outstanding home loan: $427,227
> Median household income: $63,876

32. Urban Honolulu, HI
> Average home price gain since last purchase: +42.7% (+$160,000)
> Average home sale (2017): $999,641
> Best historical time to sell: 2006 (+72.1% price chg. since last purchase)
> Worst historical time to sell: 2002 (16.0% price chg. since last purchase)
> Average outstanding home loan: $566,104
> Median household income: $80,513
[in-text-ad-2]

31. Grand Rapids-Wyoming, MI
> Average home price gain since last purchase: +42.9% (+$48,000)
> Average home sale (2017): $180,941
> Best historical time to sell: 2017 (+42.9% price chg. since last purchase)
> Worst historical time to sell: 2011 (-13.1% price chg. since last purchase)
> Average outstanding home loan: $177,070
> Median household income: $60,212

30. Cape Coral-Fort Myers, FL
> Average home price gain since last purchase: +43.1% (+$64,600)
> Average home sale (2017): $304,009
> Best historical time to sell: 2006 (+170.9% price chg. since last purchase)
> Worst historical time to sell: 2009 (-50.0% price chg. since last purchase)
> Average outstanding home loan: $328,834
> Median household income: $52,909
[in-text-ad]

29. San Luis Obispo-Paso Robles-Arroyo Grande, CA
> Average home price gain since last purchase: +43.4% (+$165,000)
> Average home sale (2017): $647,928
> Best historical time to sell: 2005 (+98.5% price chg. since last purchase)
> Worst historical time to sell: 2011 (-14.2% price chg. since last purchase)
> Average outstanding home loan: $394,503
> Median household income: $70,564

28. Salt Lake City, UT
> Average home price gain since last purchase: +44.5% (+$80,885)
> Average home sale (2017): $314,271
> Best historical time to sell: 2007 (+50.2% price chg. since last purchase)
> Worst historical time to sell: 2004 (9.1% price chg. since last purchase)
> Average outstanding home loan: $431,333
> Median household income: $68,196

27. Sacramento–Roseville–Arden-Arcade, CA
> Average home price gain since last purchase: +45.0% (+$110,330)
> Average home sale (2017): $411,653
> Best historical time to sell: 2005 (+100.0% price chg. since last purchase)
> Worst historical time to sell: 2011 (-33.6% price chg. since last purchase)
> Average outstanding home loan: $310,832
> Median household income: $64,052
[in-text-ad-2]

26. Dallas-Fort Worth-Arlington, TX
> Average home price gain since last purchase: +45.6% (+$73,926)
> Average home sale (2017): $284,769
> Best historical time to sell: 2017 (+45.6% price chg. since last purchase)
> Worst historical time to sell: 2012 (-8.7% price chg. since last purchase)
> Average outstanding home loan: $262,177
> Median household income: $63,812

25. Reno, NV
> Average home price gain since last purchase: +45.7% (+$102,000)
> Average home sale (2017): $411,221
> Best historical time to sell: 2005 (+97.0% price chg. since last purchase)
> Worst historical time to sell: 2011 (-38.4% price chg. since last purchase)
> Average outstanding home loan: $326,977
> Median household income: $58,056
[in-text-ad]

24. San Diego-Carlsbad, CA
> Average home price gain since last purchase: +45.8% (+$165,000)
> Average home sale (2017): $730,032
> Best historical time to sell: 2004 (+109.5% price chg. since last purchase)
> Worst historical time to sell: 2009 (-22.7% price chg. since last purchase)
> Average outstanding home loan: $441,853
> Median household income: $70,824

23. Bellingham, WA
> Average home price gain since last purchase: +46.5% (+$100,000)
> Average home sale (2017): $384,808
> Best historical time to sell: 2005 (+84.6% price chg. since last purchase)
> Worst historical time to sell: 2011 (11.6% price chg. since last purchase)
> Average outstanding home loan: $280,333
> Median household income: $56,411

22. Riverside-San Bernardino-Ontario, CA
> Average home price gain since last purchase: +46.7% (+$103,500)
> Average home sale (2017): $373,531
> Best historical time to sell: 2005 (+123.6% price chg. since last purchase)
> Worst historical time to sell: 2009 (-43.3% price chg. since last purchase)
> Average outstanding home loan: $295,809
> Median household income: $58,236
[in-text-ad-2]

21. Santa Cruz-Watsonville, CA
> Average home price gain since last purchase: +48.9% (+$230,000)
> Average home sale (2017): $871,991
> Best historical time to sell: 2005 (+96.9% price chg. since last purchase)
> Worst historical time to sell: 2011 (-20.6% price chg. since last purchase)
> Average outstanding home loan: $465,756
> Median household income: $77,613

20. Boston-Cambridge-Newton, MA-NH
> Average home price gain since last purchase: +49.1% (+$130,100)
> Average home sale (2017): $543,784
> Best historical time to sell: 2004 (+83.7% price chg. since last purchase)
> Worst historical time to sell: 2013 (7.7% price chg. since last purchase)
> Average outstanding home loan: $368,072
> Median household income: $82,380
[in-text-ad]

19. Prescott, AZ
> Average home price gain since last purchase: +50.0% (+$90,000)
> Average home sale (2017): $339,302
> Best historical time to sell: 2006 (+104.3% price chg. since last purchase)
> Worst historical time to sell: 2011 (6.9% price chg. since last purchase)
> Average outstanding home loan: $235,015
> Median household income: $50,420

18. Vallejo-Fairfield, CA
> Average home price gain since last purchase: +51.0% (+$130,000)
> Average home sale (2017): $415,352
> Best historical time to sell: 2005 (+99.6% price chg. since last purchase)
> Worst historical time to sell: 2009 (-45.8% price chg. since last purchase)
> Average outstanding home loan: $298,348
> Median household income: $73,900

17. Barnstable Town, MA
> Average home price gain since last purchase: +51.7% (+$124,050)
> Average home sale (2017): $516,887
> Best historical time to sell: 2004 (+117.5% price chg. since last purchase)
> Worst historical time to sell: 2010 (24.4% price chg. since last purchase)
> Average outstanding home loan: $335,631
> Median household income: $67,898
[in-text-ad-2]

16. Austin-Round Rock, TX
> Average home price gain since last purchase: +52.1% (+$99,278)
> Average home sale (2017): $357,027
> Best historical time to sell: 2017 (+52.1% price chg. since last purchase)
> Worst historical time to sell: 2012 (-7.4% price chg. since last purchase)
> Average outstanding home loan: $294,764
> Median household income: $71,000

15. Greeley, CO
> Average home price gain since last purchase: +52.6% (+$107,748)
> Average home sale (2017): $327,100
> Best historical time to sell: 2000 (+239.7% price chg. since last purchase)
> Worst historical time to sell: 2011 (-6.0% price chg. since last purchase)
> Average outstanding home loan: $334,061
> Median household income: $63,400
[in-text-ad]

14. Los Angeles-Long Beach-Anaheim, CA
> Average home price gain since last purchase: +53.0% (+$206,000)
> Average home sale (2017): $918,293
> Best historical time to sell: 2005 (+106.1% price chg. since last purchase)
> Worst historical time to sell: 2009 (-15.6% price chg. since last purchase)
> Average outstanding home loan: $482,297
> Median household income: $65,950

13. Salem, OR
> Average home price gain since last purchase: +53.3% (+$82,600)
> Average home sale (2017): $255,427
> Best historical time to sell: 2006 (+58.8% price chg. since last purchase)
> Worst historical time to sell: 2012 (3.7% price chg. since last purchase)
> Average outstanding home loan: $204,635
> Median household income: $55,903

12. Modesto, CA
> Average home price gain since last purchase: +54.1% (+$95,820)
> Average home sale (2017): $290,615
> Best historical time to sell: 2005 (+110.8% price chg. since last purchase)
> Worst historical time to sell: 2009 (-50.0% price chg. since last purchase)
> Average outstanding home loan: $230,273
> Median household income: $54,305
[in-text-ad-2]

11. Fort Collins, CO
> Average home price gain since last purchase: +54.6% (+$121,850)
> Average home sale (2017): $530,051
> Best historical time to sell: 2017 (+54.6% price chg. since last purchase)
> Worst historical time to sell: 2010 (4.9% price chg. since last purchase)
> Average outstanding home loan: $281,579
> Median household income: $66,469

10. Stockton-Lodi, CA
> Average home price gain since last purchase: +54.7% (+$113,144)
> Average home sale (2017): $339,711
> Best historical time to sell: 2005 (+95.7% price chg. since last purchase)
> Worst historical time to sell: 2009 (-50.1% price chg. since last purchase)
> Average outstanding home loan: $261,875
> Median household income: $59,518
[in-text-ad]

9. Nashville-Davidson–Murfreesboro–Franklin, TN
> Average home price gain since last purchase: +55.4% (+$83,100)
> Average home sale (2017): $277,753
> Best historical time to sell: 2017 (+55.4% price chg. since last purchase)
> Worst historical time to sell: 2011 (3.8% price chg. since last purchase)
> Average outstanding home loan: $259,680
> Median household income: $60,030

8. Boulder, CO
> Average home price gain since last purchase: +56.4% (+$176,750)
> Average home sale (2017): $645,424
> Best historical time to sell: 2000 (+72.6% price chg. since last purchase)
> Worst historical time to sell: 2003 (-0.4% price chg. since last purchase)
> Average outstanding home loan: $377,262
> Median household income: $74,615

7. Denver-Aurora-Lakewood, CO
> Average home price gain since last purchase: +56.6% (+$133,700)
> Average home sale (2017): $453,012
> Best historical time to sell: 2017 (+56.6% price chg. since last purchase)
> Worst historical time to sell: 2011 (-3.6% price chg. since last purchase)
> Average outstanding home loan: $316,904
> Median household income: $71,926
[in-text-ad-2]

6. Santa Rosa, CA
> Average home price gain since last purchase: +56.8% (+$210,000)
> Average home sale (2017): $730,313
> Best historical time to sell: 2005 (+99.3% price chg. since last purchase)
> Worst historical time to sell: 2009 (-24.1% price chg. since last purchase)
> Average outstanding home loan: $395,275
> Median household income: $73,929

5. Portland-Vancouver-Hillsboro, OR-WA
> Average home price gain since last purchase: +57.7% (+$127,000)
> Average home sale (2017): $401,206
> Best historical time to sell: 2006 (+61.9% price chg. since last purchase)
> Worst historical time to sell: 2011 (1.0% price chg. since last purchase)
> Average outstanding home loan: $285,833
> Median household income: $68,676
[in-text-ad]

4. Merced, CA
> Average home price gain since last purchase: +60.0% (+$90,000)
> Average home sale (2017): $243,465
> Best historical time to sell: 2005 (+106.3% price chg. since last purchase)
> Worst historical time to sell: 2009 (-57.4% price chg. since last purchase)
> Average outstanding home loan: $205,228
> Median household income: $47,739

3. Seattle-Tacoma-Bellevue, WA
> Average home price gain since last purchase: +66.0% (+$165,000)
> Average home sale (2017): $554,141
> Best historical time to sell: 2006 (+75.7% price chg. since last purchase)
> Worst historical time to sell: 2011 (-5.4% price chg. since last purchase)
> Average outstanding home loan: $370,627
> Median household income: $78,612

2. San Francisco-Oakland-Hayward, CA
> Average home price gain since last purchase: +69.2% (+$315,000)
> Average home sale (2017): $1,046,769
> Best historical time to sell: 2005 (+93.8% price chg. since last purchase)
> Worst historical time to sell: 2009 (-22.8% price chg. since last purchase)
> Average outstanding home loan: $546,631
> Median household income: $96,677
[in-text-ad-2]

1. San Jose-Sunnyvale-Santa Clara, CA
> Average home price gain since last purchase: +77.0% (+$415,500)
> Average home sale (2017): $1,375,132
> Best historical time to sell: 2000 (+91.5% price chg. since last purchase)
> Worst historical time to sell: 2009 (-17.9% price chg. since last purchase)
> Average outstanding home loan: $618,510
> Median household income: $110,040
Detailed Findings & Methodology
In an email to 24/7 Wall St. senior vice president of Attom Data Solutions Daren Blomquist noted that two sets of markets are heavily represented in metro areas with the largest home price gains. Half of the top 20 and all of the top five metro areas with the largest home sales gains are West Coast markets, which as Blomquist noted were the last to get hit by the housing crisis and the first to recover. Areas in California such as San Jose and San Francisco, as well as Washington state markets like Seattle and Portland, remain highly desirable places to live.
“The second set of markets are historically steady-Eddie appreciation markets in middle America that have transformed into boomtowns during this particular up economic cycle.” Metro areas like Denver, Nashville, Austin, “were not speculator central during the last housing boom … and so therefore did not crash as hard during the downturn.”
It is important to note that while home price gains as measured for this analysis closely approximate rising equity, the dollar amount gain does not represent the profit returned to sellers. For instance, the typical sale in five California metro areas brought in at least $200,000 to the seller since the last time those properties were sold — the largest dollar gains in the nation. However, in those same five areas, the average outstanding home debt was close to or greater than $400,000 — also the largest average loan amounts of all metro areas considered. Owners in these states had to pay interest on the substantial loan needed to purchase the home, likely cutting significantly into profits on the home sale.
To identify the cities where people make the most on home sales, 24/7 Wall St. reviewed home price gains in metropolitan statistical areas of 200,000 people or more provided by Attom Data Solutions. The real estate data clearing house considered the 150 large MSAs with at least 18 years of home sales and price data. Attom determined for each year the median sales price of all single family homes and condos that sold that year and subtracted it from the median sales price of those same properties the last time they sold (whenever that was). To calculate the percentage gain, the median dollar gain was calculated as a percent of the previous median purchase price.
The best historical time to sell is the year in which the highest gains were recorded for homes sold that year. The worst time to sell is the year in which the largest depreciation was recorded for homes sold that year. The average outstanding loan amount is for 2017 and was also provided by Attom Data Solutions. The median home value and median household income for each MSA was obtained from the U.S. Census Bureau’s 2016 American Community Survey and are one-year averages. All data are as of the most recent period for which data is available.
Retirement planning doesn’t have to feel overwhelming. The key is finding expert guidance—and SmartAsset’s simple quiz makes it easier than ever for you to connect with a vetted financial advisor.
Here’s how it works:
Why wait? Start building the retirement you’ve always dreamed of. Click here to get started today!
Thank you for reading! Have some feedback for us?
Contact the 24/7 Wall St. editorial team.