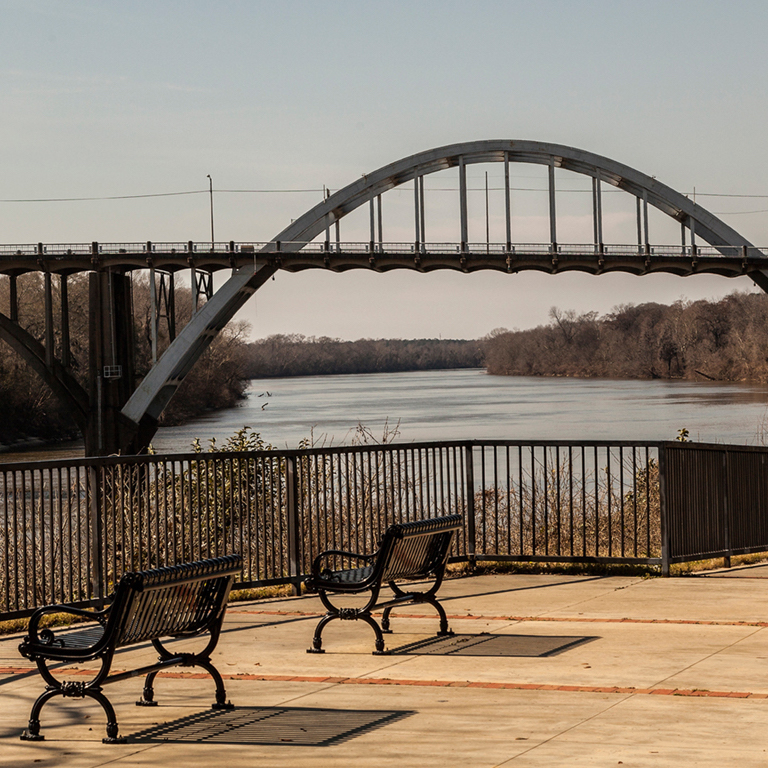
In 2016, the median household income rose from $53,889 to $55,322. While incomes and quality of life have improved for Americans overall in the past year, incomes of the wealthiest citizens rose far faster than that of poor Americans. In many of the poorest parts of the country, the quality of life has only declined over the past several decades.
Many counties have yet to recover from decades of economic and population decline, high unemployment, and public health issues due to the loss of employment opportunities in the U.S. mining and manufacturing industries and other economic trends that have hurt the country’s most vulnerable areas.
To identify the worst counties to live in, 24/7 Wall St. constructed an index composed of three socioeconomic measures — poverty rate, the percentage of adults who have at least a bachelor’s degree, and life expectancy at birth — and ranked counties based on the index. The selection of these three measures was inspired by the United Nations’ Human Development Index. Most of the lowest ranked counties are in the rural South, concentrated within the Eastern Kentucky Coalfield, Mississippi Delta, and Alabama Black Belt regions.
Click here to see the full list of the worst counties to live in.
Click here to see our detailed findings and methodology.
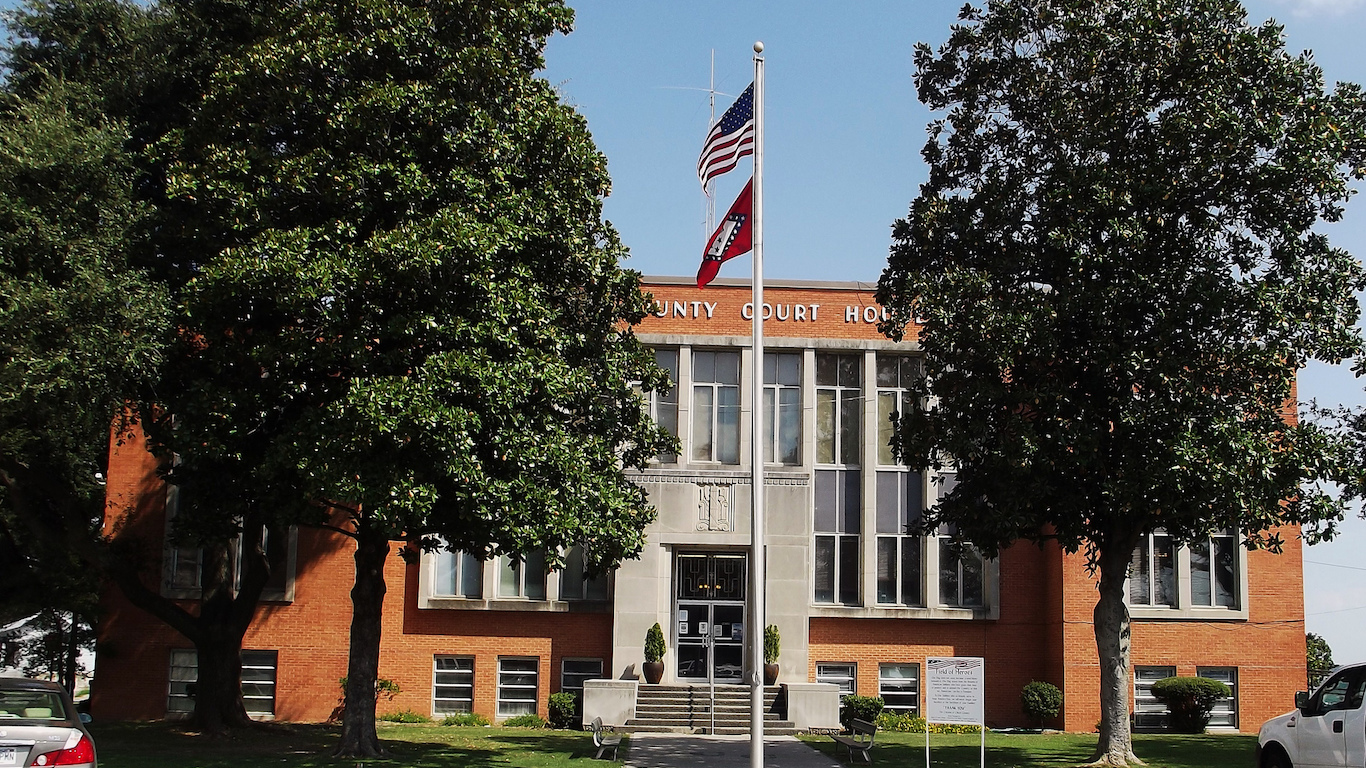
50. Chicot County, Arkansas
> 5-yr. pop. change: -6.3%
> Unemployment: 7.0%
> Poverty rate: 30.9%
> Life expectancy: 73.4 years
Most of the worst counties to live in are in the South — and Chicot County, Arkansas is one of them. As of December 2017, some 7.0% of the county’s labor force was out of work, well above the 4.1% U.S. unemployment rate. The dearth of jobs may partially explain the widespread financial hardship throughout the county. An estimated 30.9% of county residents live below the poverty line, more than double the 15.1% U.S. poverty rate.
Like many other counties with stagnant economies, Chicot County’s population is shrinking. In the last five years, the county’s population contracted by 6.3%, even as the U.S. population expanded by 3.9%.
[in-text-ad]
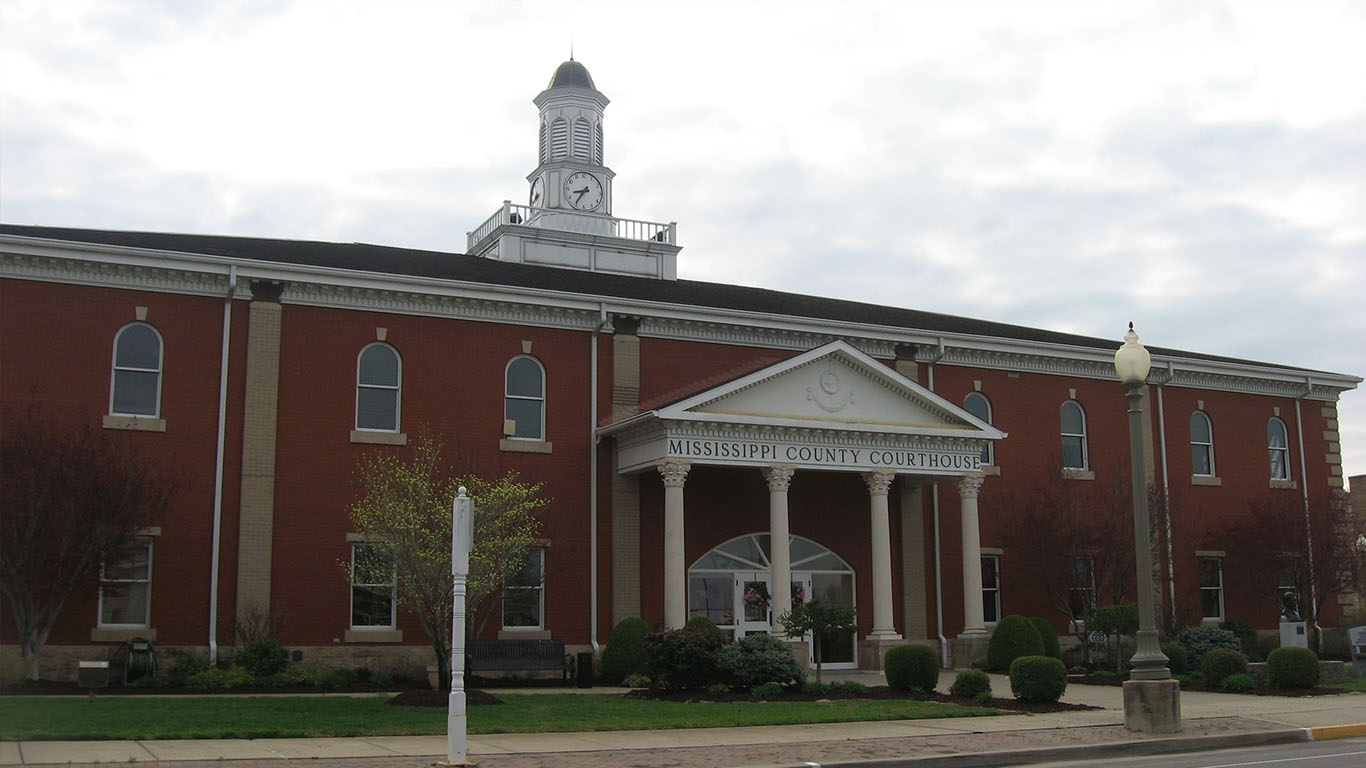
49. Mississippi County, Missouri
> 5-yr. pop. change: -0.6%
> Unemployment: 4.2%
> Poverty rate: 30.5%
> Life expectancy: 73.7 years
A high school education can provide the foundation for a healthy, financially secure life, and in Mississippi County, Missouri, just 72.8% of adults have completed high school. In comparison, 87.0% of American adults nationwide have a high school diploma. Low educational attainment may partially explain why the county is struggling in several key socioeconomic measures.
For example, 30.5% of county residents live in poverty, more than double the 15.1% U.S. poverty rate. Additionally, life expectancy in Mississippi County is only 73.7 years, about five years shy of the national average.

48. Lee County, South Carolina
> 5-yr. pop. change: -6.3%
> Unemployment: 5.7%
> Poverty rate: 28.2%
> Life expectancy: 73.0 years
Lee County is one three counties in South Carolina to rank among the worst places to live. As is the case with most counties on this list, the county’s population is shrinking. Over the last five years, the number of people living in Lee declined by 6.3%, even as the total U.S. population expanded by 3.9% over the same period.
In a further break from broad national trends, health outcomes in Lee County are worsening rather than improving. Life expectancy is only 73.0 years, down slightly from 73.1 years in 2010. Meanwhile, life expectancy nationwide improved from 78.8 years to 79.1 years over the same period.

47. Lowndes County, Alabama
> 5-yr. pop. change: -8.4%
> Unemployment: 6.5%
> Poverty rate: 28.7%
> Life expectancy: 72.6 years
Lowndes County is located in central Alabama, just southwest of the state capital of Montgomery. The county’s population has contracted by 8.4% over the last decade, nearly the largest decline of any county on this list. A lagging economy may be partially to blame. Some 6.5% of county workers are unemployed, well above the 4.1% U.S. unemployment rate. Further, more than two-thirds of workers in the area travel outside of the county for work compared to just 23.9% of Americans nationwide.
For those who are able to find work, compensation is low. The typical household in Lowndes County earns just $27,914 a year — about half the income the typical household earns across the U.S. as a whole.
[in-text-ad-2]

46. Franklin Parish, Louisiana
> 5-yr. pop. change: -1.4%
> Unemployment: 6.5%
> Poverty rate: 31.5%
> Life expectancy: 73.6 years
With about 1 in every 5 residents living in poverty, Louisiana is one of the poorest states in the country. In Franklin Parish, located in northeastern Louisiana, financial hardship is even more common. Of all county residents 31.5% live below the poverty line, nearly the largest share of any parish — or county equivalent — in the state.
Lower-income Americans have less access to healthy options related to diet and lifestyle, which can contribute to worse health outcomes. Life expectancy in Franklin Parish is just 73.6 years, about two years less than the state average life expectancy and 5.5 years less than the national average.
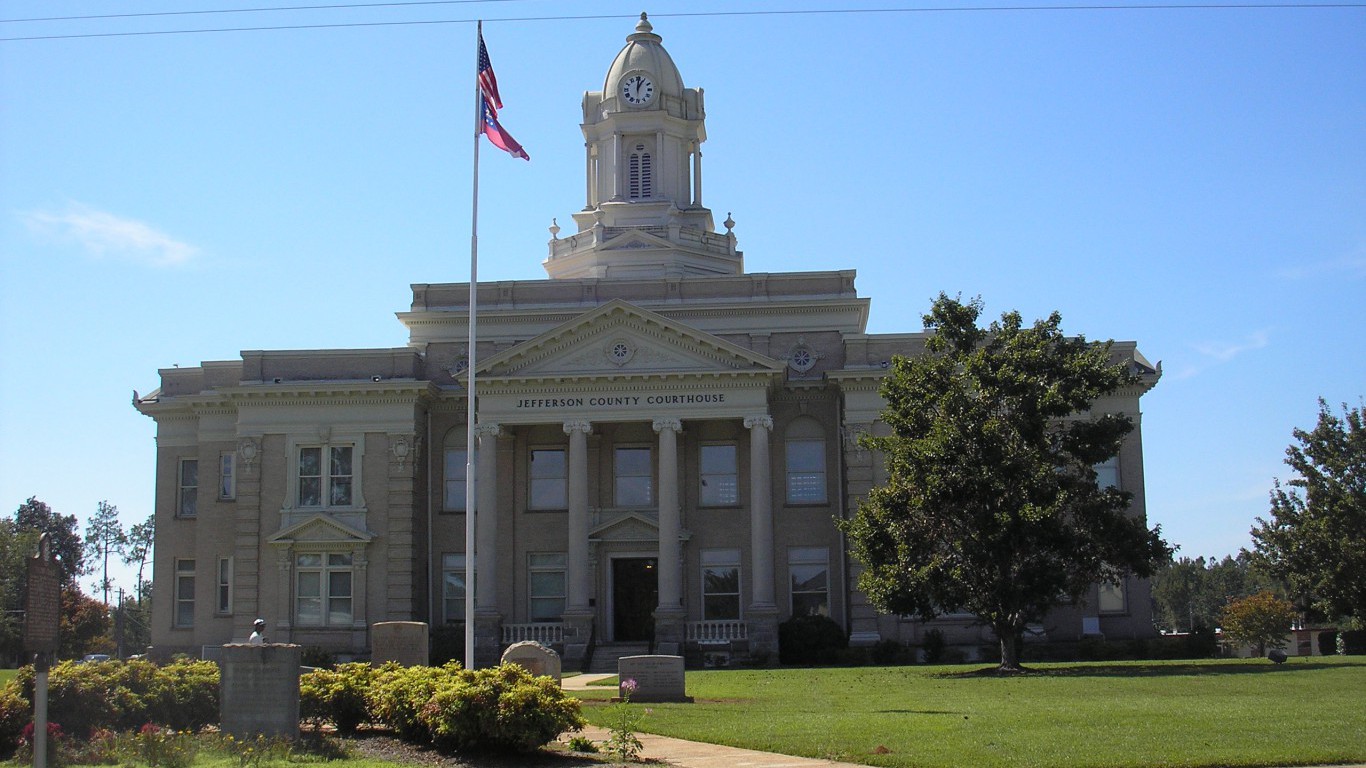
45. Jefferson County, Georgia
> 5-yr. pop. change: -4.0%
> Unemployment: 5.7%
> Poverty rate: 28.9%
> Life expectancy: 73.1 years
A high school education can be critical to a healthy, financially secure life, and in Jefferson County, Georgia, fewer than 3 in 4 adults have a high school diploma. Across broad populations, incomes tend to be lower in areas with low educational attainment, and Jefferson County is no exception. The typical county household earns just $28,417 a year, about half the median income of $55,322 across the U.S. as a whole.
Like many of the worst counties, Jefferson is losing residents. Over the last half decade, the county’s population contracted by 4.0%, even as Georgia’s population grew 5.0%.
[in-text-ad]
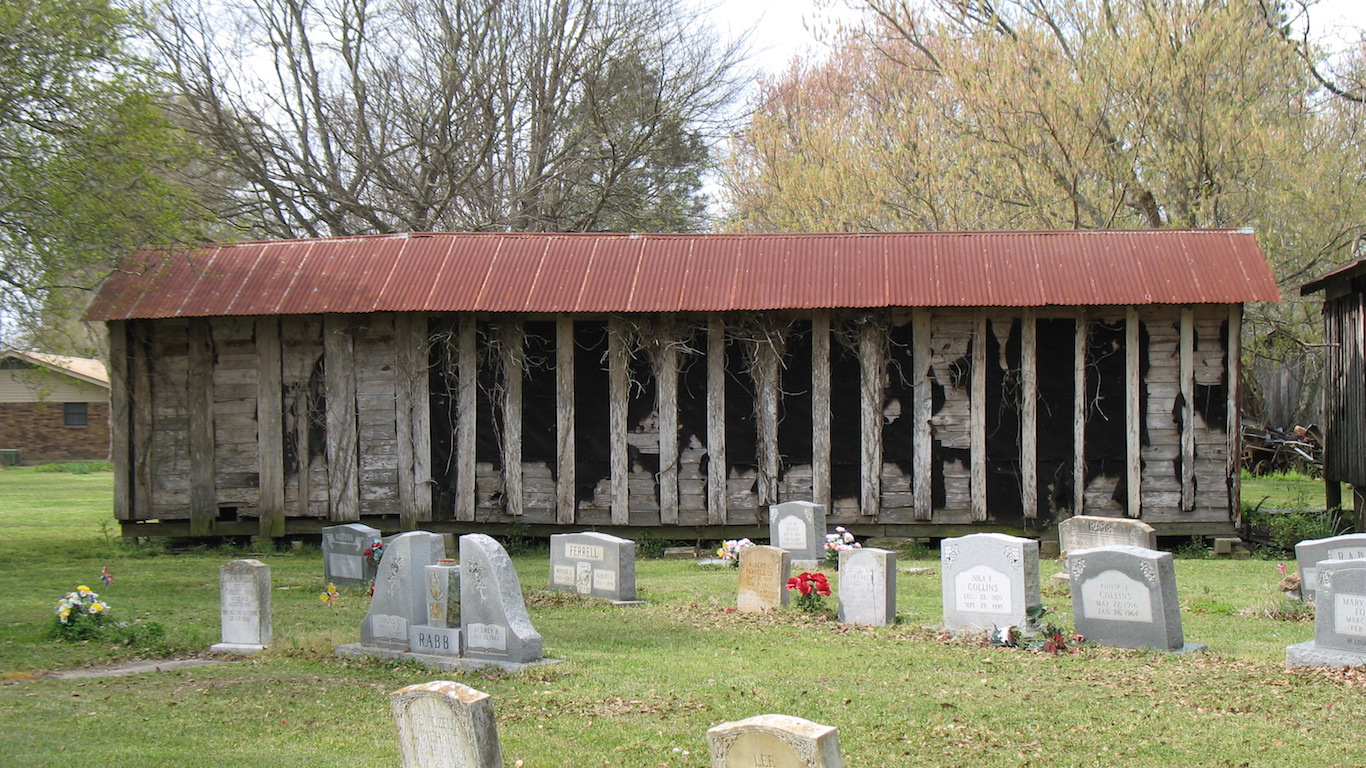
44. Concordia Parish, Louisiana
> 5-yr. pop. change: -1.6%
> Unemployment: 6.5%
> Poverty rate: 31.9%
> Life expectancy: 73.9 years
Concordia Parish, located in eastern Louisiana along the banks of the Mississippi River, is one of the poorest counties or county equivalents in the United States. Nearly 32% of residents live below the poverty line, more than double the 15.1% U.S. poverty rate. Poorer Americans are limited in their ability to afford health care and healthy lifestyles — especially if they are without health insurance. In Concordia Parish, more than one-quarter of the population is uninsured, one of the highest uninsured rates in the country. Financial hardship and lack of access to preventative medical care have likely contributed to the region’s 73.9 year life expectancy — which is about five years shy of the life expectancy for the average American.
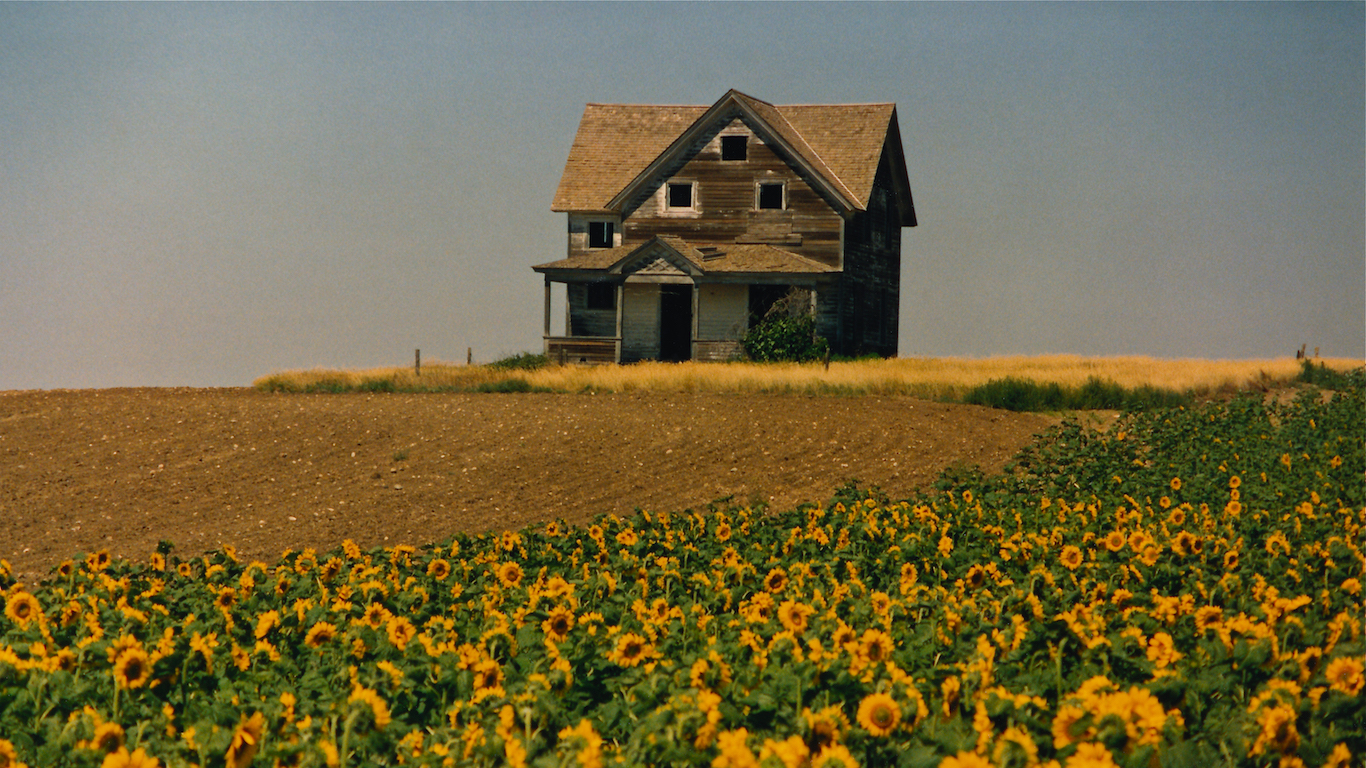
43. Roosevelt County, Montana
> 5-yr. pop. change: 8.8%
> Unemployment: 4.2%
> Poverty rate: 26.9%
> Life expectancy: 71.2 years
Roosevelt County is one of only three counties on this list located in the Western United States and the only one in Montana. For a variety of historic and contemporary reasons, populations living on Indian Reservations tend to report worse economic conditions. Comprising much of the Fort Peck Indian Reservation, Roosevelt County is no different. The county is one of only four in Montana in which more than 1 in 4 residents live in poverty.
Unlike most counties on this list that have been losing residents in recent years, Roosevelt County is growing rapidly. In the last half decade the county’s population expanded by 8.8%, double the corresponding statewide population growth rate.

42. Grundy County, Tennessee
> 5-yr. pop. change: -2.3%
> Unemployment: 4.3%
> Poverty rate: 28.0%
> Life expectancy: 72.5 years
The typical household in Grundy County, Tennessee earns just $28,467 a year, or about $20,000 less than the income of a typical Tennessee household. Lower-income Americans can afford fewer healthier options related to diet and lifestyle, and partially as a result, they often report poorer health outcomes. Grundy County is no exception. Life expectancy in the county is just 72.5 years, compared to the statewide average of 76.3 years and the national average of 79.1 years.
Both health outcomes and income tend to rise with educational attainment across broad populations. In Grundy County, just 11.0% of adults have a bachelor’s degree — less than half the 26.1% state share and 30.3% national share.
[in-text-ad-2]
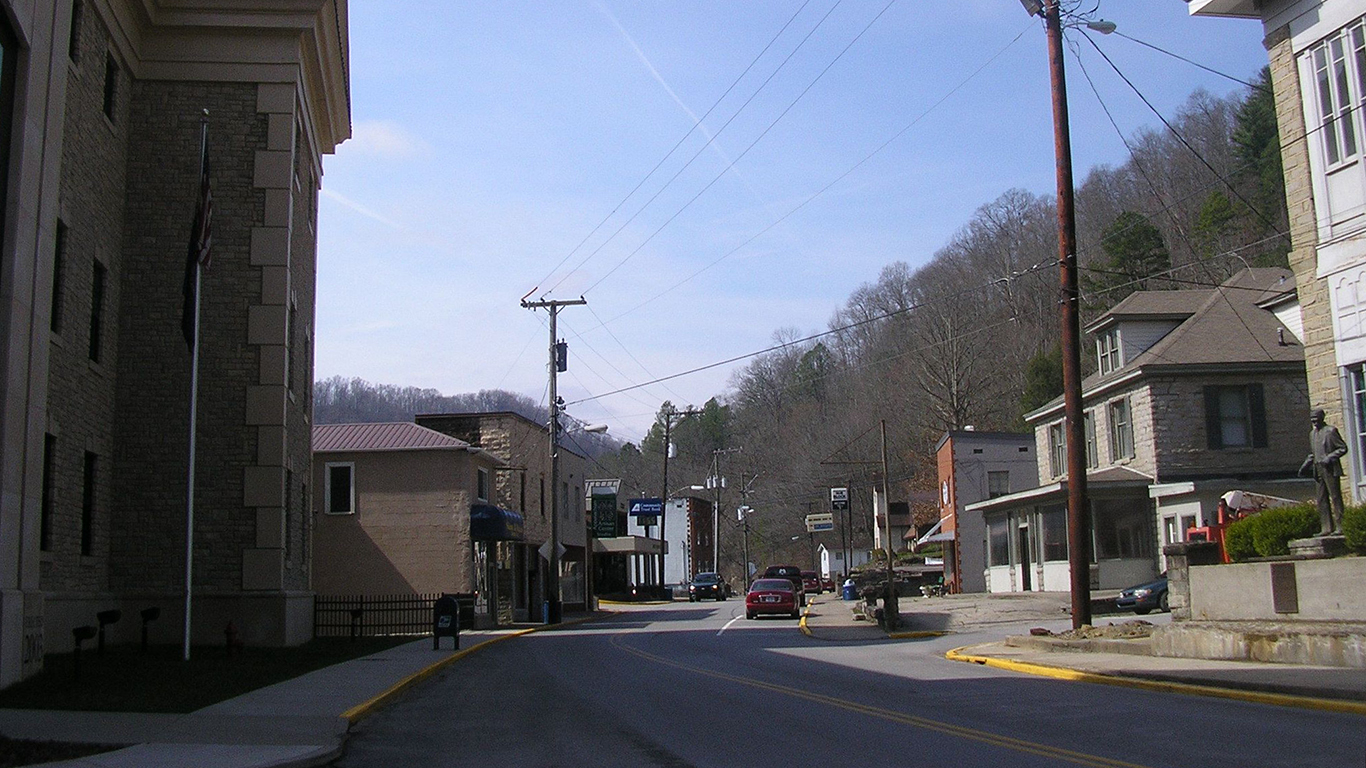
41. Knott County, Kentucky
> 5-yr. pop. change: -3.6%
> Unemployment: 6.0%
> Poverty rate: 31.6%
> Life expectancy: 73.0 years
Knott County is one of 15 counties in Kentucky to rank among the worst places to live. Places with low educational attainment rates are often poor, and Knott County — where just 71.7% of adults have completed high school — is no exception. The typical household in the county earns just $28,165 a year, or $27,200 less than the typical American household.
In addition to low educational attainment, a high jobless rate partially explains the area’s low incomes. As of December 2017, 6.0% of the county’s workforce was unemployed, well above the 4.1% U.S. unemployment rate.
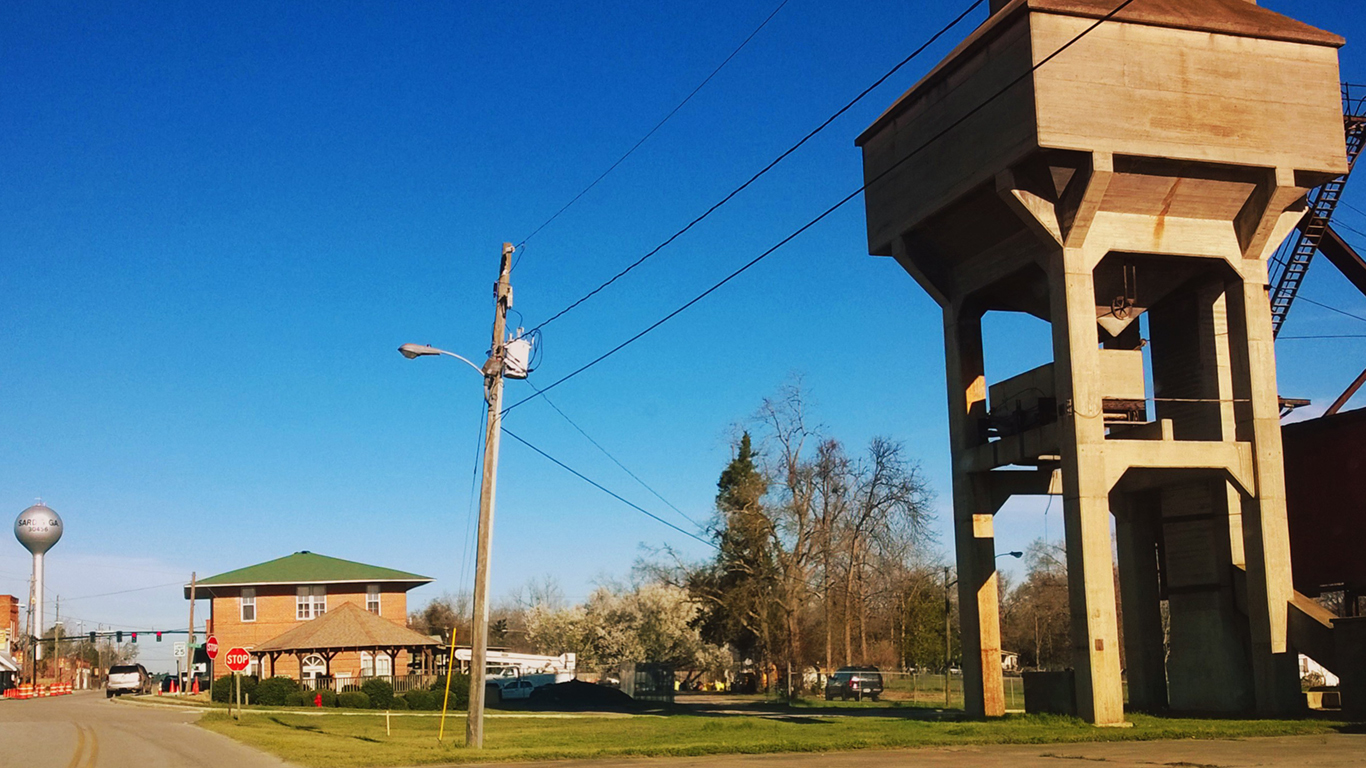
40. Burke County, Georgia
> 5-yr. pop. change: -1.6%
> Unemployment: 6.2%
> Poverty rate: 30.5%
> Life expectancy: 73.3 years
Expanding by 5% in the last half decade, Georgia’s population is growing faster than the vast majority of states. Not all parts of the state are attracting new residents, however. In Burke County, the population has contracted by 1.6% in the last five years. The lagging job market may be partially to blame. As of December 2017, 6.2% of workers in Burke County were out of a job, well above the comparable 4.1% U.S. unemployment rate. The high jobless rate exacerbates financial hardship in the area. Currently, 30.5% of the Burke County population lives below the poverty line, double the 15.1% U.S. poverty rate.
[in-text-ad]
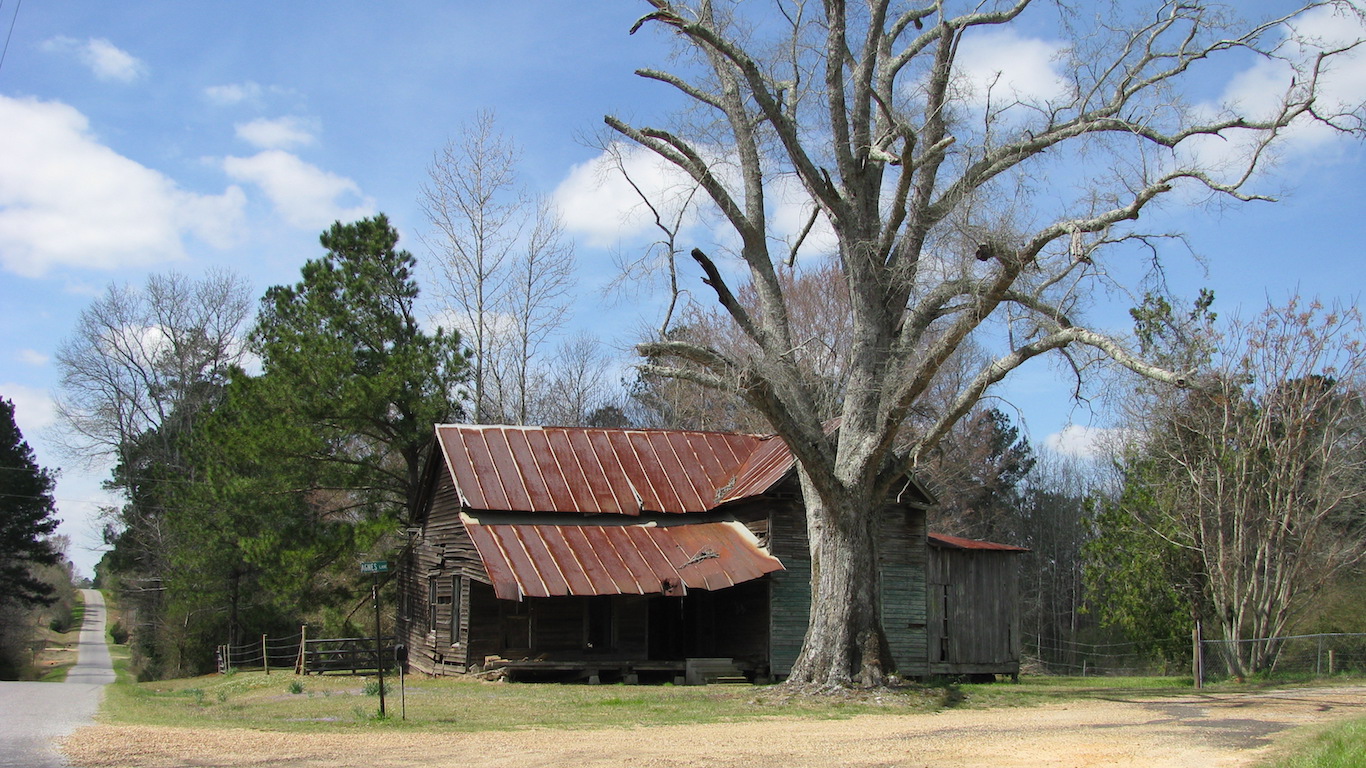
39. Jefferson Davis County, Mississippi
> 5-yr. pop. change: -5.9%
> Unemployment: 5.7%
> Poverty rate: 34.7%
> Life expectancy: 73.6 years
Jefferson Davis County is one of eight counties in Mississippi to rank among the worst places to live. The typical household in Mississippi earns just $40,528 a year, the lowest median income of any state. Far poorer than the state as a whole, the county’s median household income of $26,429 is nearly the lowest of any U.S. county and less than half the income the typical American household earns.
Few U.S. counties are losing residents as rapidly as Jefferson Davis County. The county’s population contracted by 5.9% in the past half decade, even as the U.S. population grew by 3.9% over the same period.
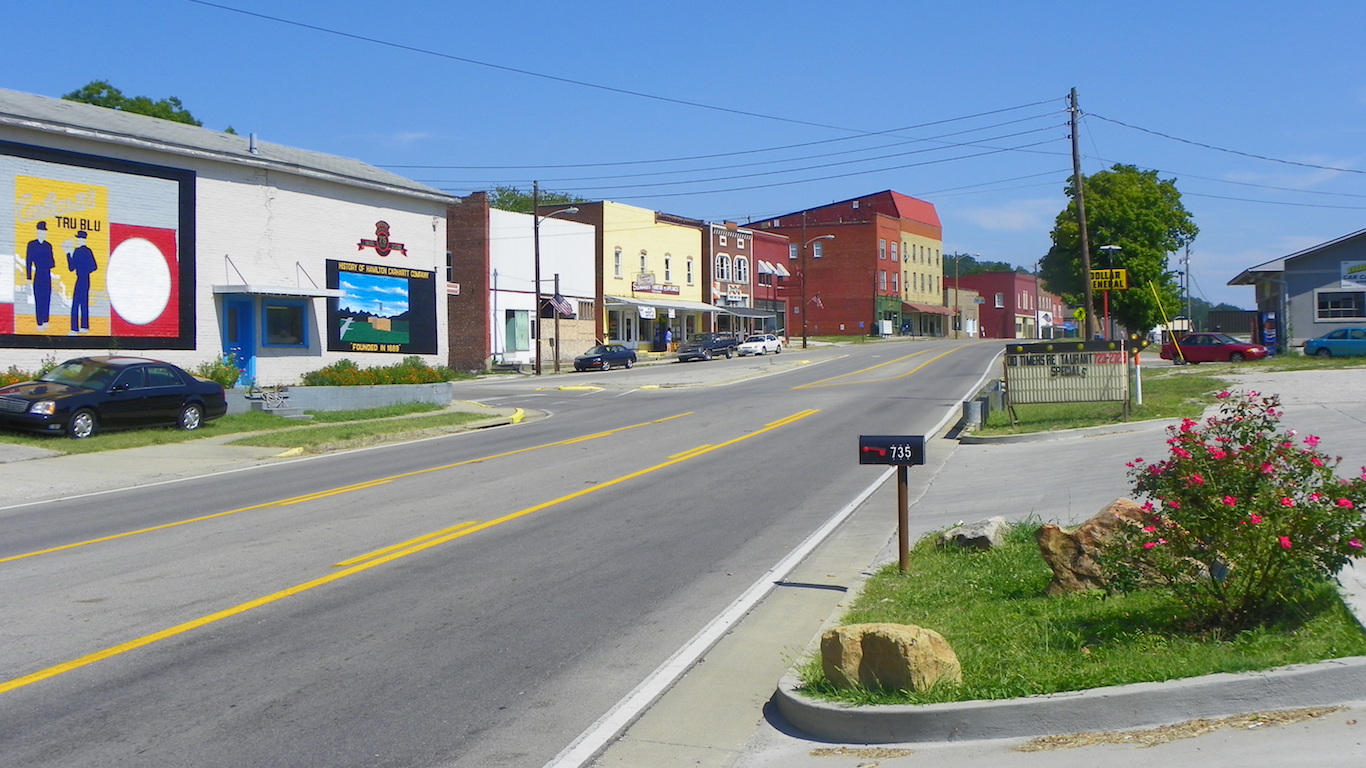
38. Estill County, Kentucky
> 5-yr. pop. change: -2.1%
> Unemployment: 5.2%
> Poverty rate: 30.3%
> Life expectancy: 73.2 years
Once a major coal and iron mining center, today Estill County ranks as one of the worst counties to live in. The county’s population peaked at 18,000 in 1940 and declined over the next several decades. While the population has increased in recent years, today it is home to just 14,711 residents, well below its mid-20th century peak. One of many push factors in the county was likely the high jobless rate. The unemployment rate in Estill County of 5.2% is far higher than the 4.1% national rate.
A weak job market likely makes it difficult for a number of workers in the county to earn a living wage. Estill County’s poverty rate of 30.3% is one of the highest in Kentucky and the nation.
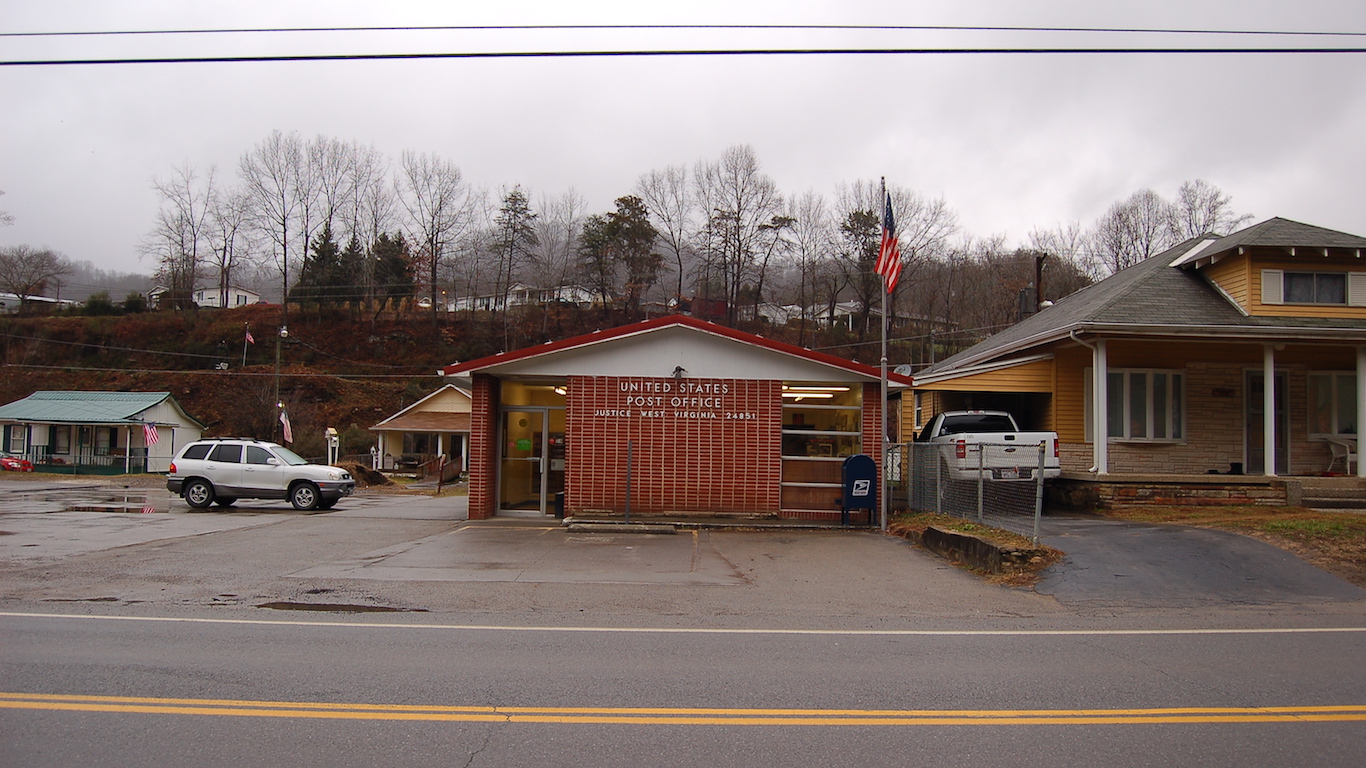
37. Mingo County, West Virginia
> 5-yr. pop. change: -4.9%
> Unemployment: 9.0%
> Poverty rate: 26.0%
> Life expectancy: 71.4 years
Based on a number of socioeconomic measures, Mingo County ranks as the second worst county in West Virginia and one of the worst in the country. Once a major producer of coal, the county has struggled heavily over the past several decades as the industry declined nationwide, suffering population and economic decline. Today, the county is home to 25,549 residents, almost half its peak of 47,409 in 1950. The unemployment rate of 9.0% is more than twice the national rate of 4.1% and among the highest of any county.
The typical household in Mingo County earns $32,441 a year, more than $10,000 less than the state median household of $42,644 and $20,000 less than the national median of $55,322. In addition to high unemployment, one factor that partially explains the county’s low income is the low educational attainment rate. Just 9.9% of adults in the county have a bachelor’s degree, less than one-third of the national college attainment rate of 30.3%.
[in-text-ad-2]
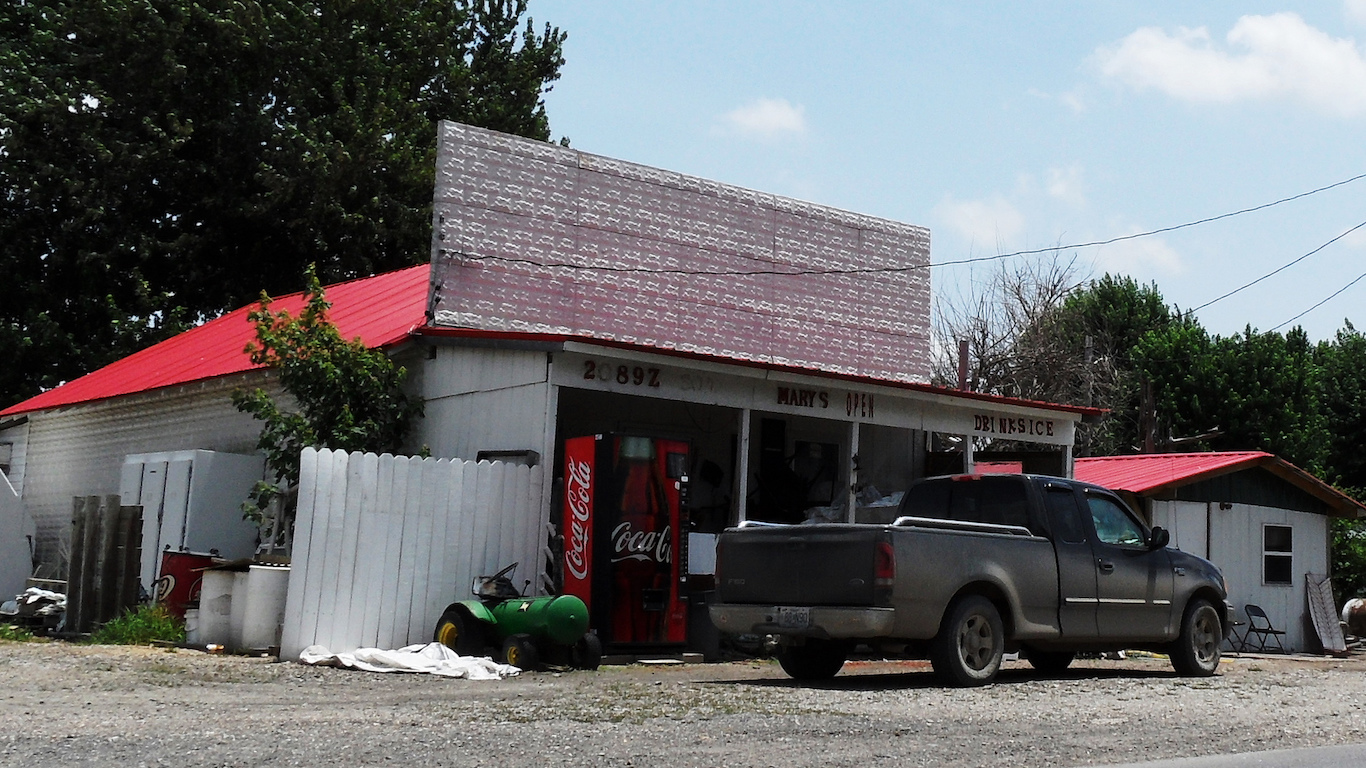
36. Pemiscot County, Missouri
> 5-yr. pop. change: -4.5%
> Unemployment: 6.9%
> Poverty rate: 29.1%
> Life expectancy: 72.0 years
A major agricultural center, Pemiscot County suffered economic and population decline throughout much of the 20th century as farming jobs were lost to mechanization and foreign competition. Today, the county is home to 17,599 residents, less than half its peak of 46,857 in 1940. The unemployment rate of 6.9% is far higher than the 4.1% national unemployment rate and among the highest of any county.
Just 11.7% of Pemiscot County adults have a bachelor’s degree, nearly a third of the national college attainment rate of 30.3%. High unemployment and low educational attainment are two factors contributing to low incomes in the county. The typical county household earns $31,671 a year, the nearly the lowest median income in Missouri and the country as a whole.
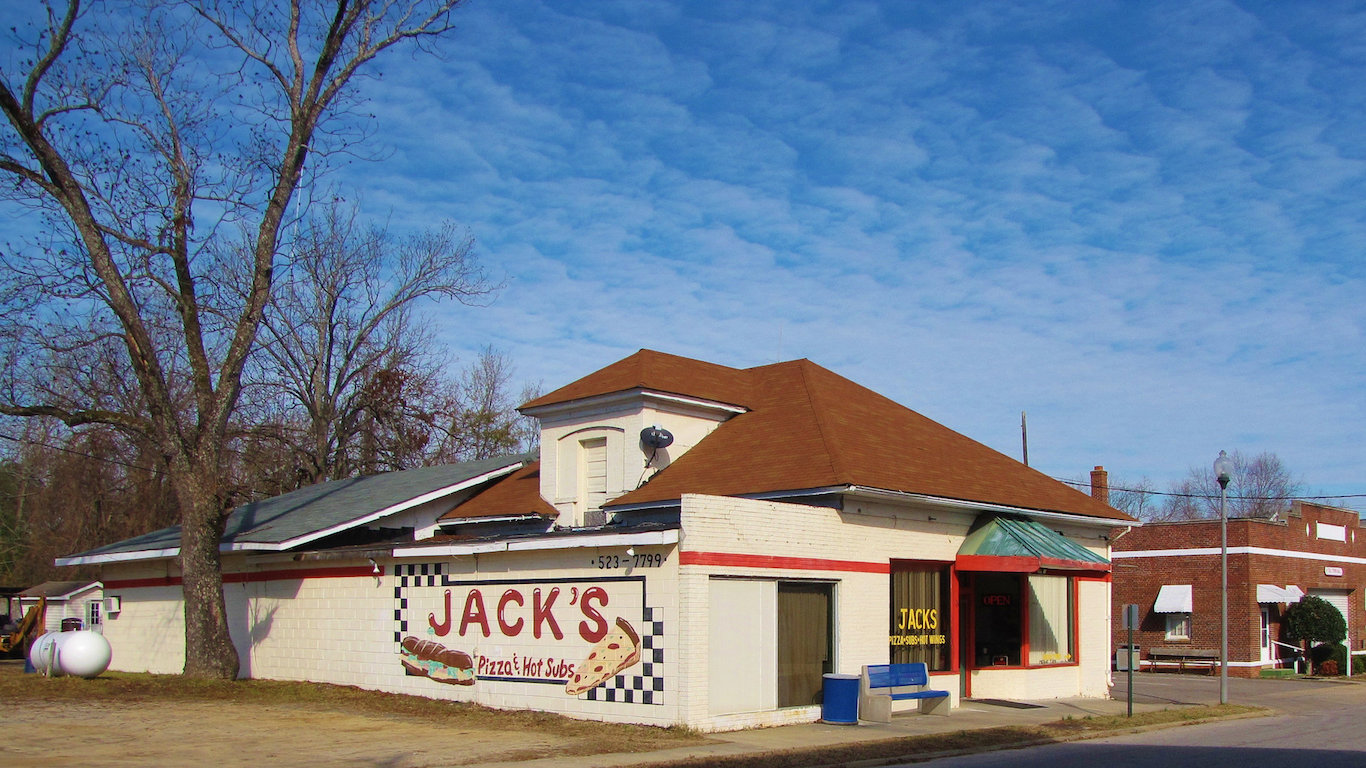
35. Marlboro County, South Carolina
> 5-yr. pop. change: -4.4%
> Unemployment: 6.2%
> Poverty rate: 26.7%
> Life expectancy: 72.0 years
Marlboro County is one of many Southern counties with agriculture-based economies that suffered from population and economic decline due to the mechanization of farming techniques throughout the mid-20th century. The county’s population is currently 27,702, a considerable decline from its peak of 33,281 in 1940.
One factor that may be hindering Marlboro County’s economic recovery is the population’s low educational attainment. Just 8.4% of adults have a bachelor’s degree — less than a third of the 30.3% national rate and one of the lowest college attainment rates in the country. Adults with less education are less likely to be employed in advanced, high-paying jobs. The typical county household earns $32,601 a year, or more than $20,000 less than the national median household income of $55,322.
[in-text-ad]
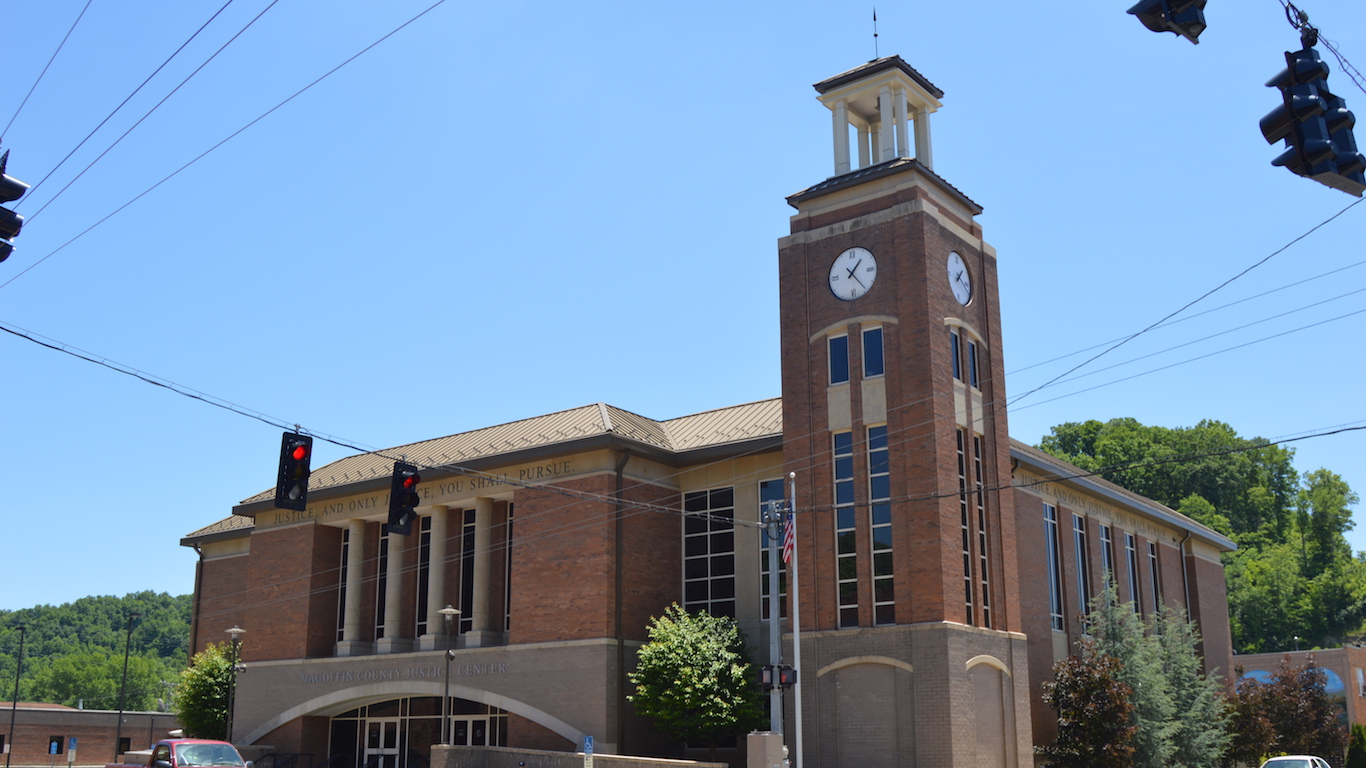
34. Magoffin County, Kentucky
> 5-yr. pop. change: -3.0%
> Unemployment: 12.4%
> Poverty rate: 29.5%
> Life expectancy: 72.6 years
Magoffin County is one of many counties in Eastern Kentucky whose coal-based economy has struggled to recover from the collapse of the industry in the mid-20th century. Today the county is home to 12,887 residents, a 26% decline from its peak population of 17,490 in 1940. The last operating mine in Magoffin County closed in 2015, leaving approximately 150 workers out of a job. Overall, 12.4% of the county’s workforce is unemployed, nearly the highest unemployment rate in the country.
Low educational attainment has likely hindered the county’s economic comeback and contributed to low area incomes. Just 10.1% of adults have a bachelor’s degree — one-third of the the 30.3% national college attainment rate. The typical household earns just $29,463 a year, or more than $25,000 less than the U.S. median of $55,322 and among the least of any county.
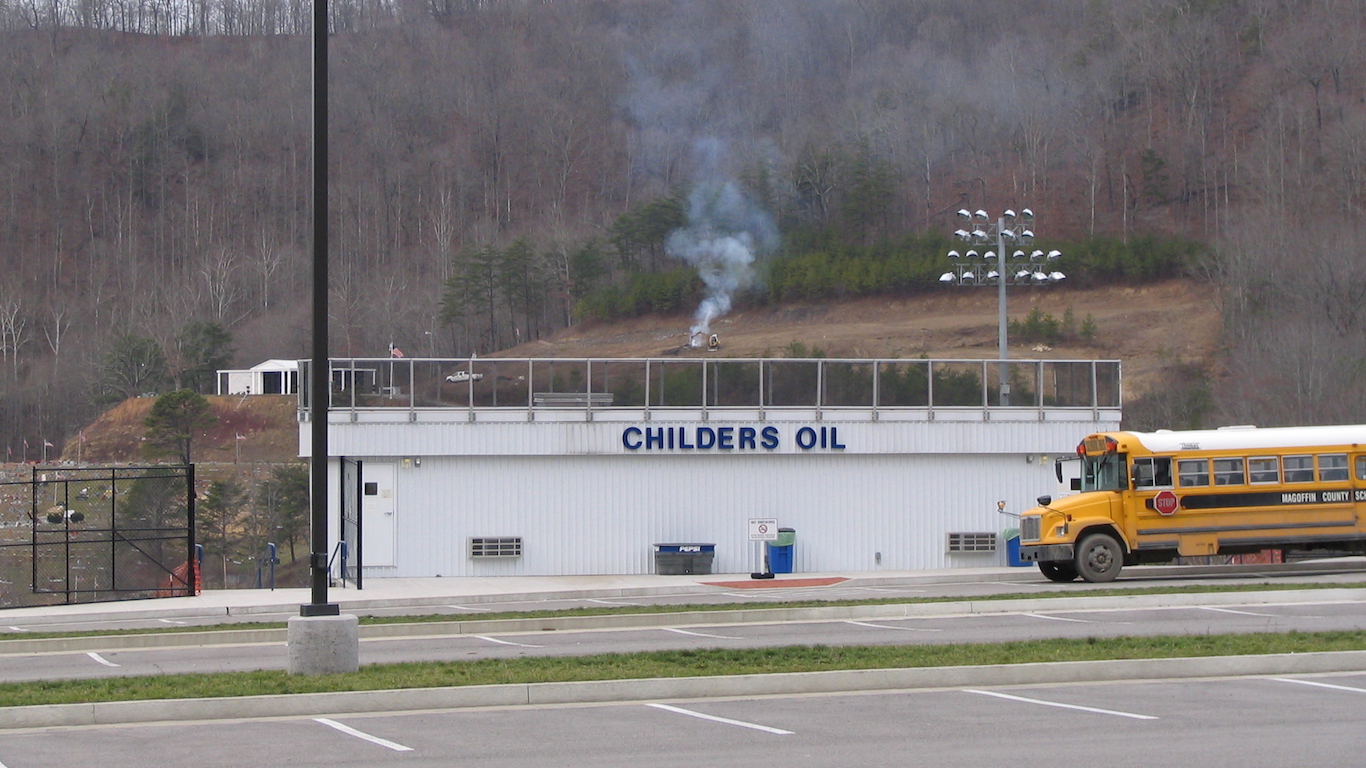
33. Letcher County, Kentucky
> 5-yr. pop. change: -4.4%
> Unemployment: 6.3%
> Poverty rate: 29.8%
> Life expectancy: 72.3 years
Letcher County is one of several counties in the Eastern Coal Field region of Kentucky to rank among the worst counties to live in. The county’s population peaked at 40,592 in 1940 and, aside from a slight increase in the 1970s, has consistently declined alongside the fall of the U.S. coal industry to just 23,382 people today. The loss of a major industry has pushed many coal workers into unemployment in Eastern Kentucky. While the county’s unemployment rate — which was as high as 11.4% in June — has fallen to 6.3% as of December, it remains far above the 4.1% national unemployment rate.
The typical household in Letcher County earns just $29,181 a year, and 29.8% of residents live in poverty — far worse than the national median income of $55,322 and the U.S. poverty rate of 15.1%. Wealth is a primary determinant of health outcomes, and life expectancy in the county is just 72.3 years — among the lowest in the country.

32. Dillon County, South Carolina
> 5-yr. pop. change: -1.5%
> Unemployment: 5.6%
> Poverty rate: 30.6%
> Life expectancy: 73.1 years
By a number of measures related to education, wealth, health, and income, Dillon County is one of the worst places to live in. Nationwide, the typical college graduate makes $22,000 more a year than the typical high school graduate and $30,000 more than a high school dropout. In Dillon County, just 9.6% of adults have a bachelor’s degree, and the typical household earns just $30,995 a year. By comparison, the U.S. college attainment rate is 30.3%, and the median household income is $55,322.
Education and income are two of the most important factors that affect longevity. In Dillon County, the life expectancy at birth is just 73.1 years, far more in line with the life expectancy in the West Bank and Gaza of 73.3 years than with the 79.1-year U.S. life expectancy.
[in-text-ad-2]
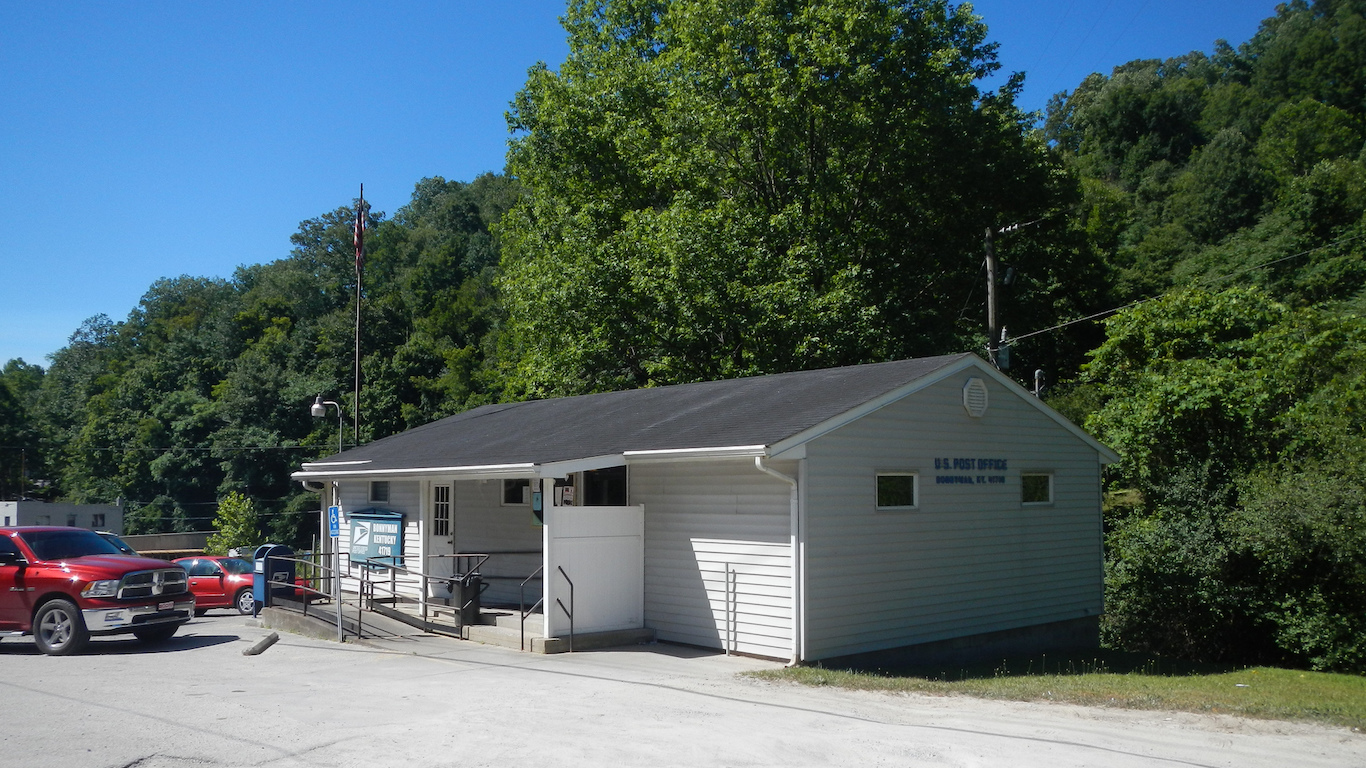
31. Perry County, Kentucky
> 5-yr. pop. change: -3.1%
> Unemployment: 5.9%
> Poverty rate: 27.4%
> Life expectancy: 70.6 years
Perry County is one of the 14 counties in the Eastern Kentucky Coalfield on this list. Like much of Eastern Kentucky, the county suffered heavy population decline as America’s coal industry declined throughout the mid-20th century. Other than a small period of increase in the 1970s, the county’s population has fallen continuously since its peak in 1940, from 47,828 to 27,818 today.
One factor hindering the county’s economic recovery may be the area’s low educational attainment. A large share of college-educated adults can help attract advanced, high-paying industries to an area, and college graduates earn $22,000 more than high school graduates on average. Just 14.0% of Perry County adults have a bachelor’s degree, less than half the 30.3% national share.
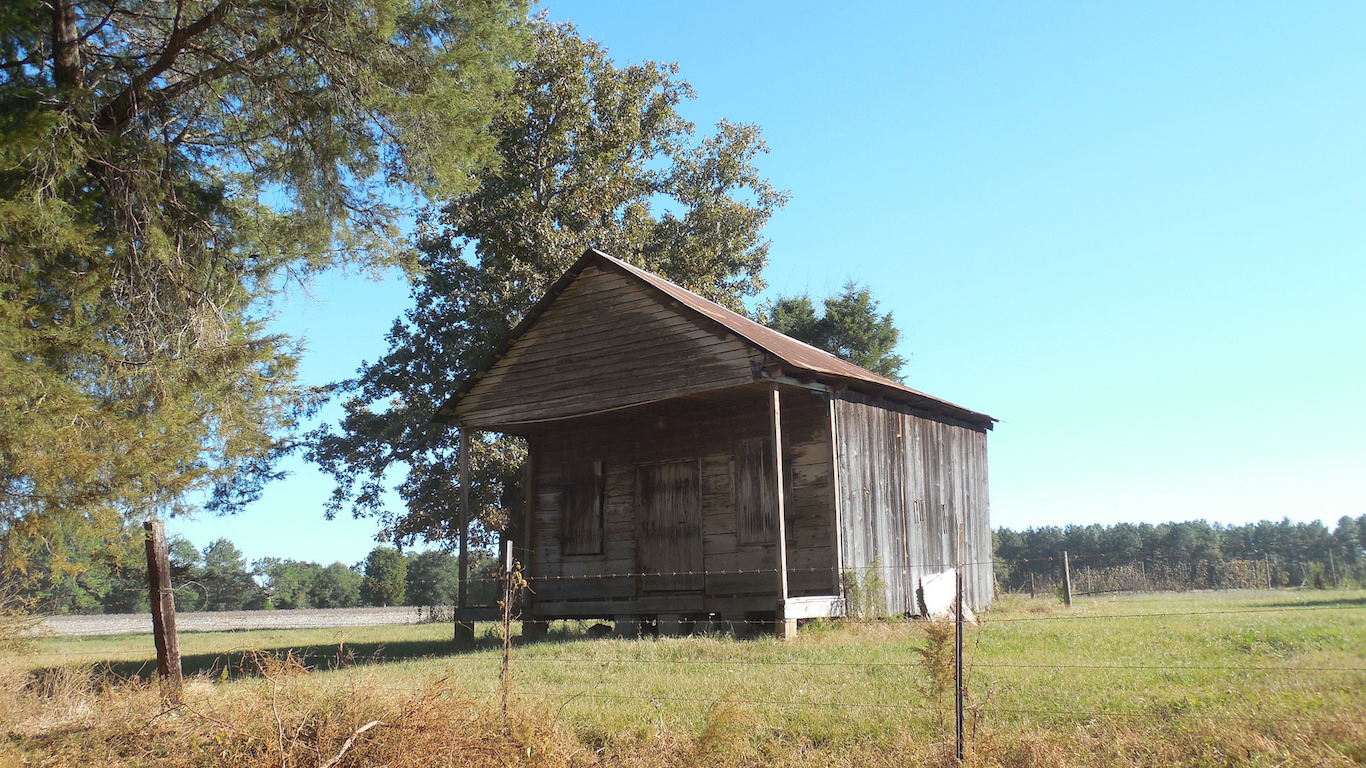
30. Conecuh County, Alabama
> 5-yr. pop. change: -4.4%
> Unemployment: 4.8%
> Poverty rate: 32.5%
> Life expectancy: 74.1 years
Once a major producer of cotton and corn in the antebellum South, Conecuh County is today one of the worst counties to live in. The county’s population declined from a peak of 25,489 in 1940 to just 12,697 today — a 50% decline. In addition to population loss, factors contributing to the low quality of life in the county include low educational attainment, high poverty, and poor health outcomes.
Just 8.7% of county adults have a bachelor’s degree — less than a third of the 30.3% national share and nearly the lowest college attainment rate of any county nationwide. An estimated 32.5% of residents live in poverty, more than twice the 15.1% national poverty rate.
[in-text-ad]

29. Yazoo County, Mississippi
> 5-yr. pop. change: -1.8%
> Unemployment: 5.1%
> Poverty rate: 34.5%
> Life expectancy: 73.5 years
Yazoo County is located in the Mississippi Delta region. Like much of the region, the county’s agriculture-based economy suffered heavily in the first half of the 20th century due to mechanization of farming techniques that led to heavy job losses. Today the county is home to just 27,719 residents, a 41% decline from its peak of 46,672 in 1910.
Many of those who left Yazoo County over the past century were likely the area’s wealthy residents, leaving the county with a high poverty rate and a smaller tax base. The typical county household earns just $27,560 a year, less than half the national median household income of $55,322. An estimated 34.5% of county residents live in poverty, one of the highest poverty rates in the nation.
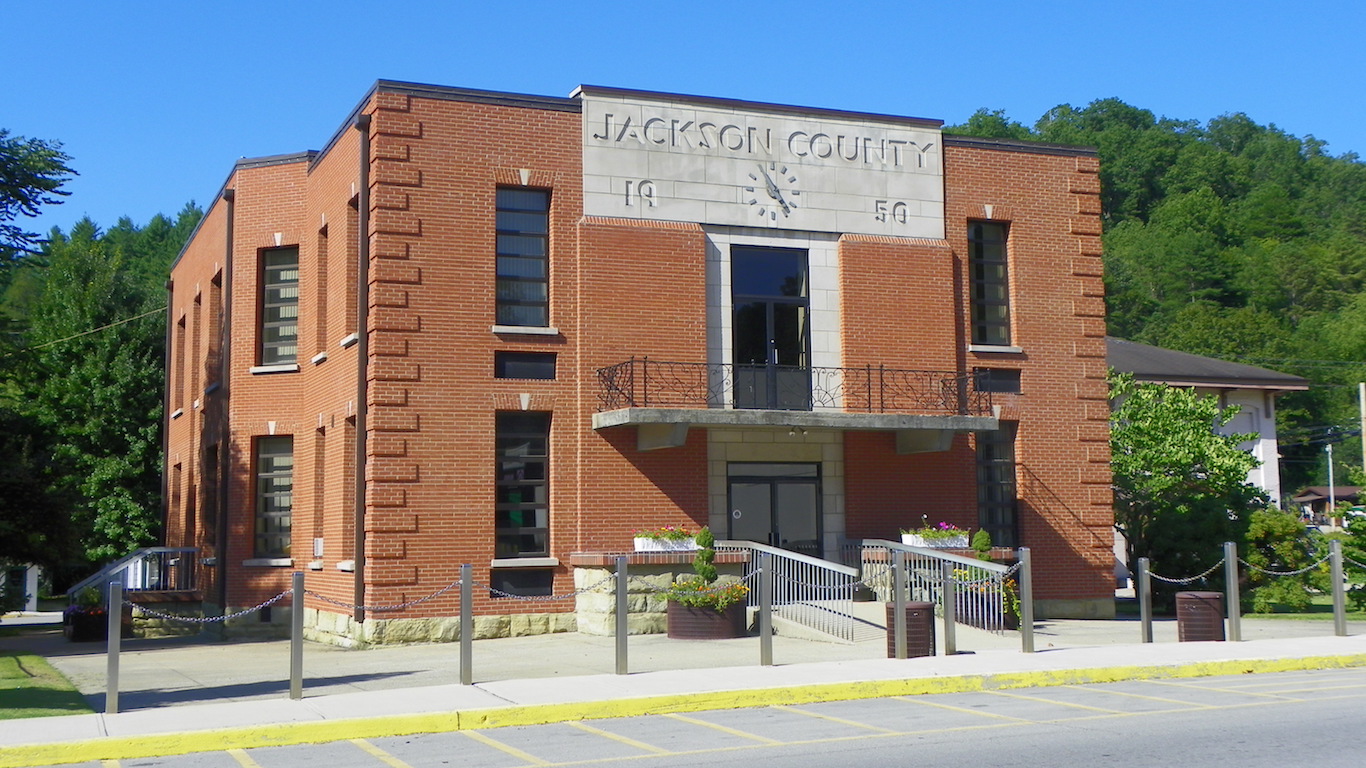
28. Jackson County, Kentucky
> 5-yr. pop. change: -1.3%
> Unemployment: 6.5%
> Poverty rate: 33.1%
> Life expectancy: 73.3 years
Jackson County is one of the 14 counties on this list located in the Eastern Kentucky Coalfield region. Like the region as a whole, the county suffered from significant population and economic decline in the mid-20th century alongside the decline of the U.S. coal industry — and it has yet to recover. Today, the county is home to just 13,357 residents, an 18% decline from its peak of 16,339 in 1940.
One factor impeding Jackson County’s economic recovery is the area’s low educational attainment. A large share of college-educated adults can help attract advanced, high-paying industries to an area, and college graduates earn $22,000 more a year than high school graduates on average. Just 11.2% of county adults have a bachelor’s degree, nearly one-third of the 30.3% national college attainment rate. The typical household earns just $30,884 a year, among the lowest median household income of any county nationwide.

27. Macon County, Georgia
> 5-yr. pop. change: -4.9%
> Unemployment: 6.0%
> Poverty rate: 32.6%
> Life expectancy: 73.8 years
Based on a number of socioeconomic measures assessing education, income, and health, Macon County residents have the lowest quality of life of nearly any county in the United States. Just 8.5% of county adults have a bachelor’s degree, less than one-third the 30.3% national share and among the lowest college attainment rates of any county. Similarly, just 72.2% of adults have a high school diploma, far less than the 87.0% of adults nationwide. On average, Americans without a high school diploma make nearly $30,000 less a year than college graduates. In Macon County, the typical household earns $28,285 a year, nearly the lowest median household income of any county.
[in-text-ad-2]
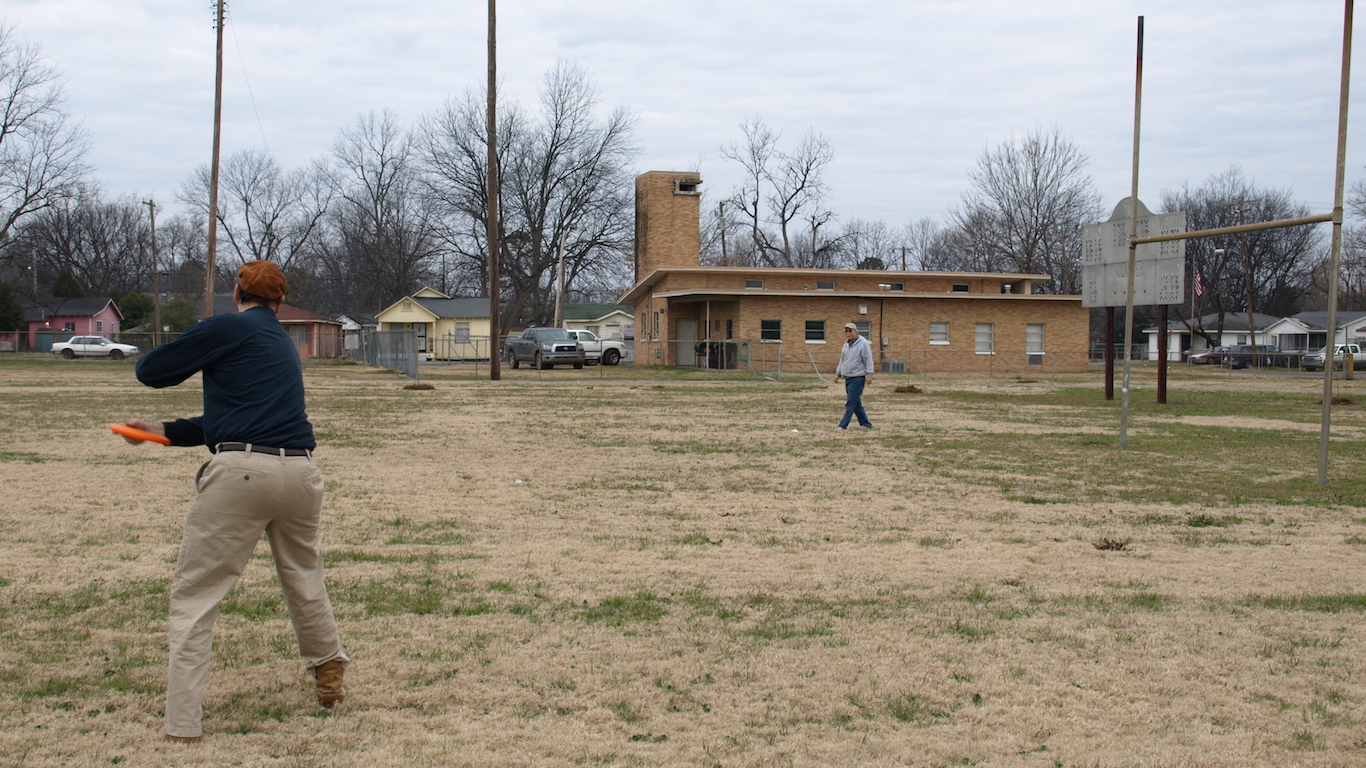
26. Washington County, Mississippi
> 5-yr. pop. change: -5.5%
> Unemployment: 7.1%
> Poverty rate: 34.9%
> Life expectancy: 71.8 years
Washington County is located in the Mississippi Delta. Like much of the region, the county suffered heavy population and economic decline in the mid-20th century due to the mechanization of agriculture and heavy wave of outbound migration of African Americans to cities in the Northeast and Midwest. Today, the county is home to 48,824 residents, a 38% decline from the conty’s peak of 78,638 in 1960. The unemployment rate is 7.1%, among the highest of any county in Mississippi and in the nation.
Low educational attainment in Washington County and the Mississippi Delta overall may also be hurting the region’s recovery. Just 76.9% of adults in the county have a high school diploma, far less than the 87.0% of adults nationwide. Americans who did not graduate high school make $30,000 less than college graduates on average, and in Washington County the typical household earns $28,452 a year — far less than the national median income of $55,322.
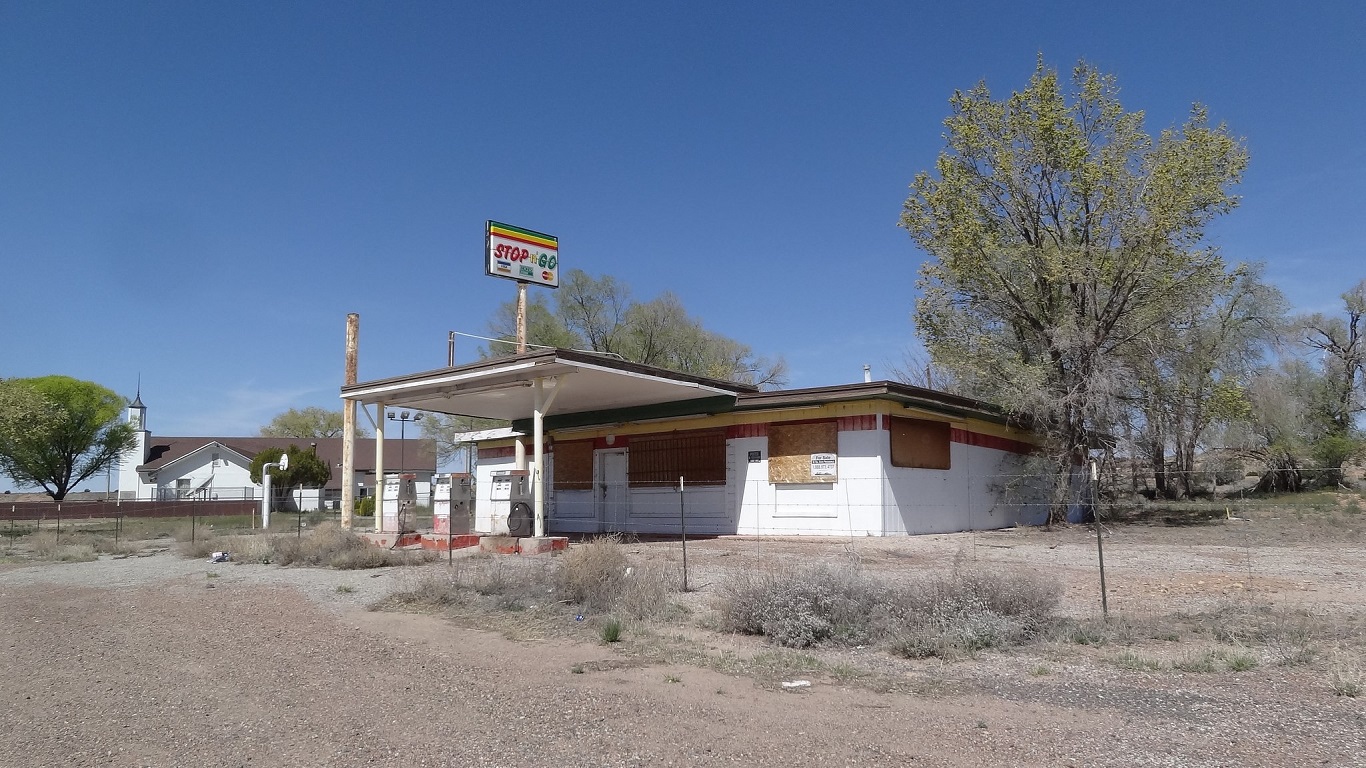
25. Apache County, Arizona
> 5-yr. pop. change: 2.0%
> Unemployment: 10.3%
> Poverty rate: 36.2%
> Life expectancy: 74.3 years
Approximately 66% of Apache County’s land consists of Apache and navajo Indian reservations, nearly the largest share of land designated as Indian reservation of any county. Additionally, 73% of the population identifies as American Indian, a larger share than in all but a dozen other U.S. counties. Poverty tends to be higher in Indian reservations, and residents are at a greater risk of drug and alcohol addiction and premature death than the average American. Indian reservations have some of the lowest quality of life of any community in the United States.
Just 11.1% of Apache County adults have a bachelor’s degree — nearly one-third the 30.3% national college attainment rate. Adults without a college education are far more likely to endure serious financial hardship. An estimated 36.2% of residents live in poverty, the 16th highest poverty rate of any county. Apache is also one of only two counties on this list with a double digit unemployment rate.
[in-text-ad]
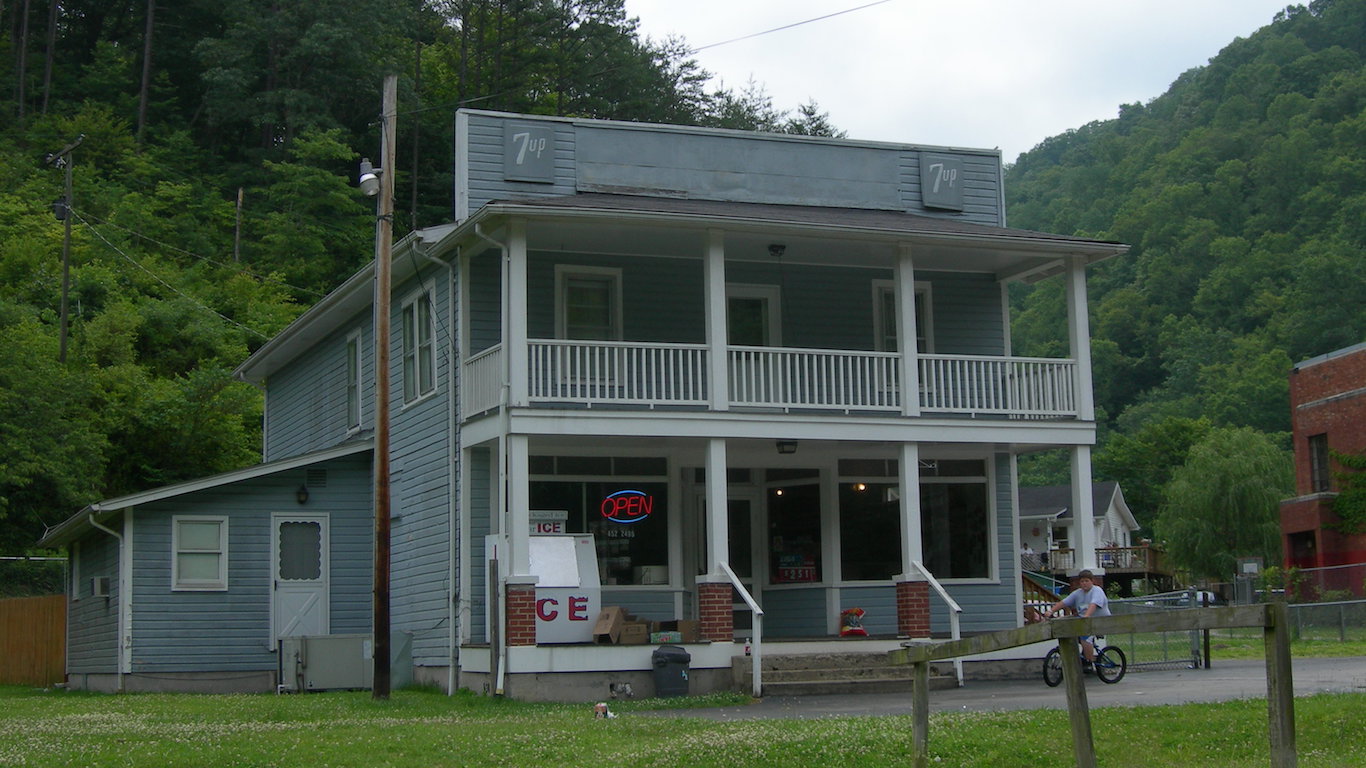
24. Floyd County, Kentucky
> 5-yr. pop. change: -3.9%
> Unemployment: 6.0%
> Poverty rate: 30.7%
> Life expectancy: 72.0 years
Floyd County is one of the 14 counties in the Eastern Kentucky Coalfield to rank among the 50 worst counties to live in. Like much of the region, the county suffered heavy job loss and population decline as the U.S. coal industry contracted throughout the mid-20th century. Floyd is currently home to just 38,144 residents, a decline of 29% from its peak of 53,500 in 1950. The county’s unemployment rate of 6.0% is far higher than the 4.1% national rate.
Low educational attainment is one factor likely hindering the county’s recovery. A large share of college-educated adults can help attract advanced, high-paying industries to an area, and college graduates earn $22,000 more than high school graduates on average. Just 11.8% of Floyd County adults have a bachelor’s degree, less than half the 30.3% national share. An estimated 30.7% of residents live in poverty, more than twice the 15.1% national rate.

23. McKinley County, New Mexico
> 5-yr. pop. change: 4.3%
> Unemployment: 7.9%
> Poverty rate: 38.1%
> Life expectancy: 74.9 years
McKinley County’s population is 76% Native American, with a diverse array of Indian tribes such as the Navajo, and Zuni. Similarly, about 75% of McKinley County land area is controlled by Native American tribes. Residents of Indian reservations face a unique set of economic problems with higher poverty and are often at a greater risk of premature death.
In McKinley County, the typical household earns just $29,272 a year, far less than the national median income of $55,322 and among the least of any county. An estimated 38.1% of residents live in poverty, nearly the largest share of any county nationwide. The average McKinley County resident is expected to live for 74.9 years, more than four years less than the average American.
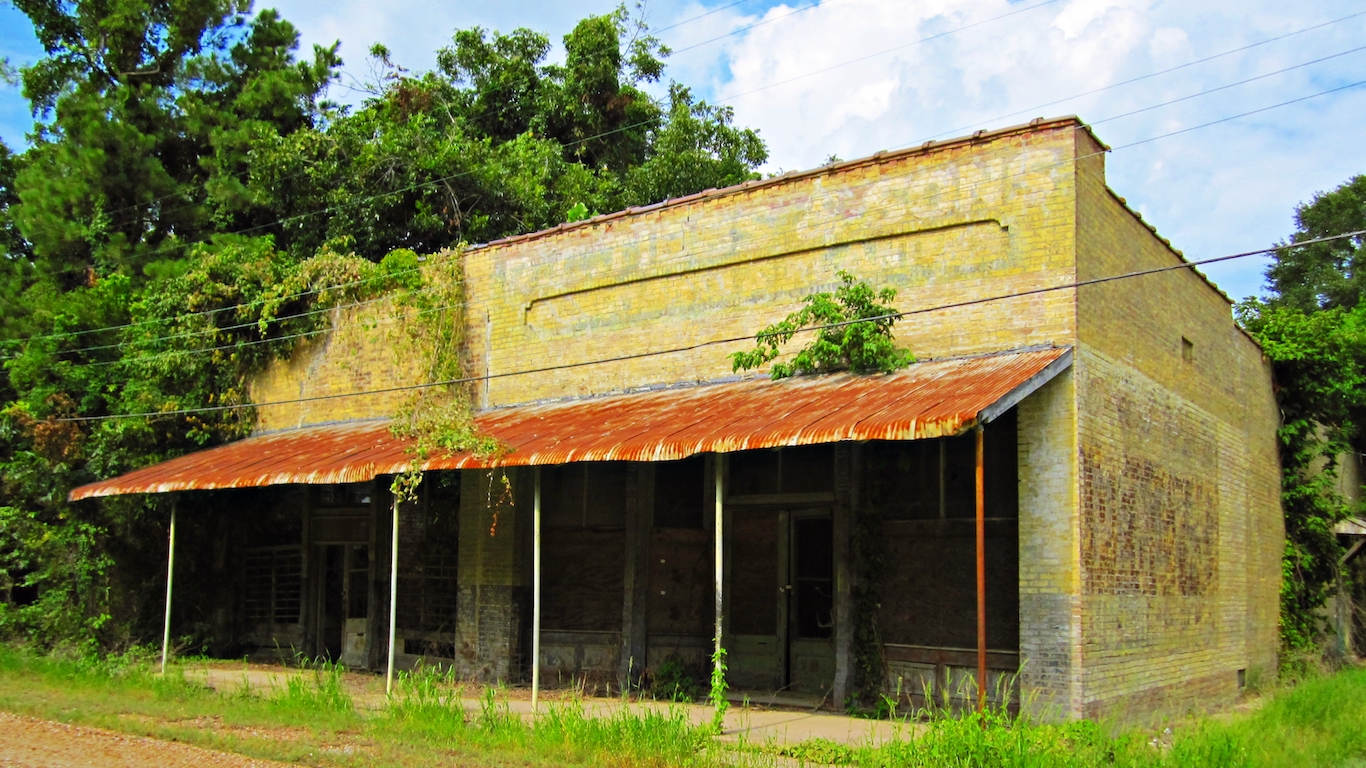
22. Bolivar County, Mississippi
> 5-yr. pop. change: -2.8%
> Unemployment: 5.6%
> Poverty rate: 37.8%
> Life expectancy: 71.7 years
Bolivar County is located in the Mississippi Delta. Like much of the region, the county suffered heavy population and economic decline in the mid-20th century as the mechanization of agriculture drastically reduced the number of jobs in the area. The county’s population fell from a peak of 71,051 in 1930 to just 33,615 today, a 53% decline.
Low educational attainment in the Mississippi Delta may be hurting the region’s recovery. Just 74.8% of county adults have a high school diploma, far less than the 87.0% of adults nationwide and one of the lowest high school attainment rates of any county. Americans who did not graduate from high school make $30,000 less than college graduates on average, and in Bolivar County the typical household earns $27,457 a year — less than half the $55,322 national median.
[in-text-ad-2]
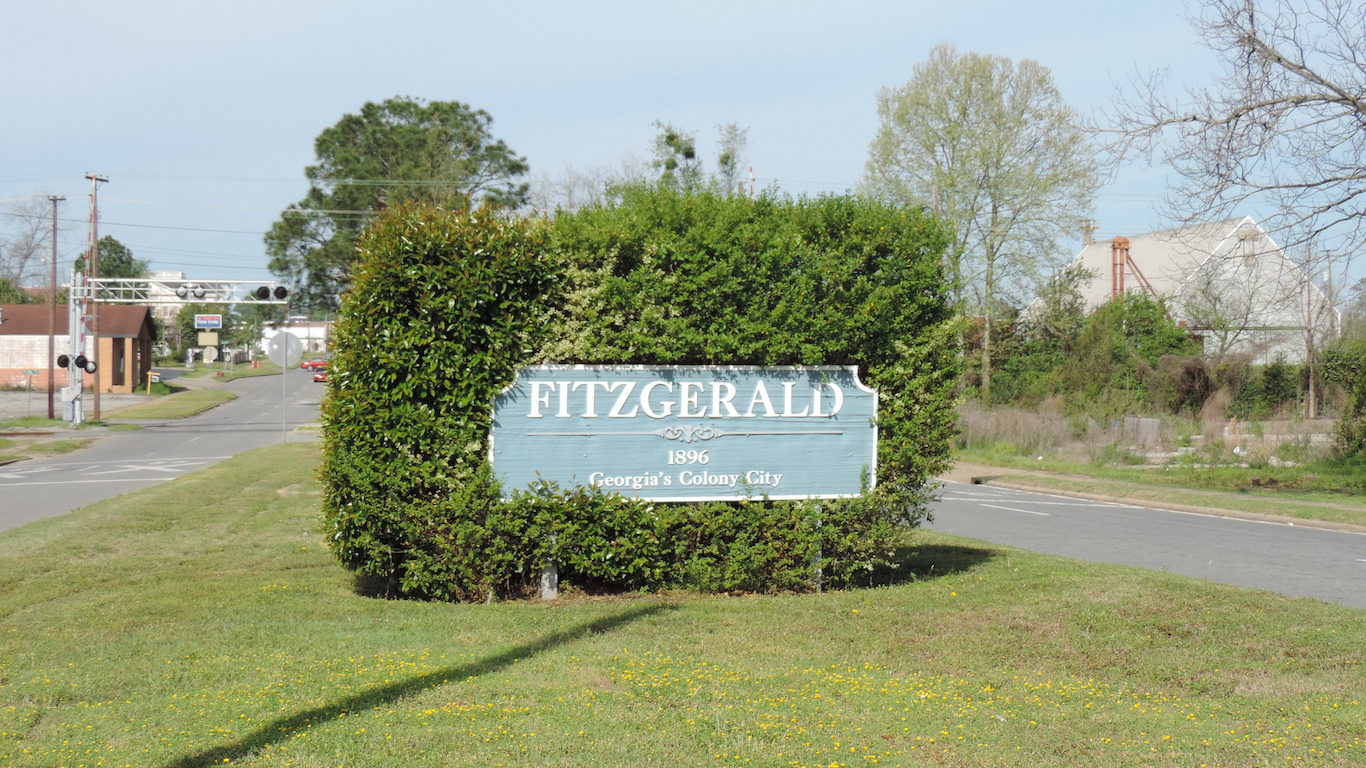
21. Ben Hill County, Georgia
> 5-yr. pop. change: -1.4%
> Unemployment: 6.9%
> Poverty rate: 35.0%
> Life expectancy: 73.6 years
By a number of measures assessing quality of life such as education, income, and health, Ben Hill County is one of the worst places to live in the United States. Just 10.6% of residents have a bachelor’s degree, nearly one-third of the national college attainment rate and one of the smallest shares in the country. High school graduates who did not complete college earn nearly $22,000 less a year on average than those with a bachelor’s degree. In Ben Hill County, the typical household earns just $29,510 a year, far less than the national median of $55,322.
Income and education are two of the primary factors affecting life expectancy and health outcomes. The life expectancy at birth in Ben Hill County is 73.6 years, more than five years less than the 79.1-year national life expectancy.
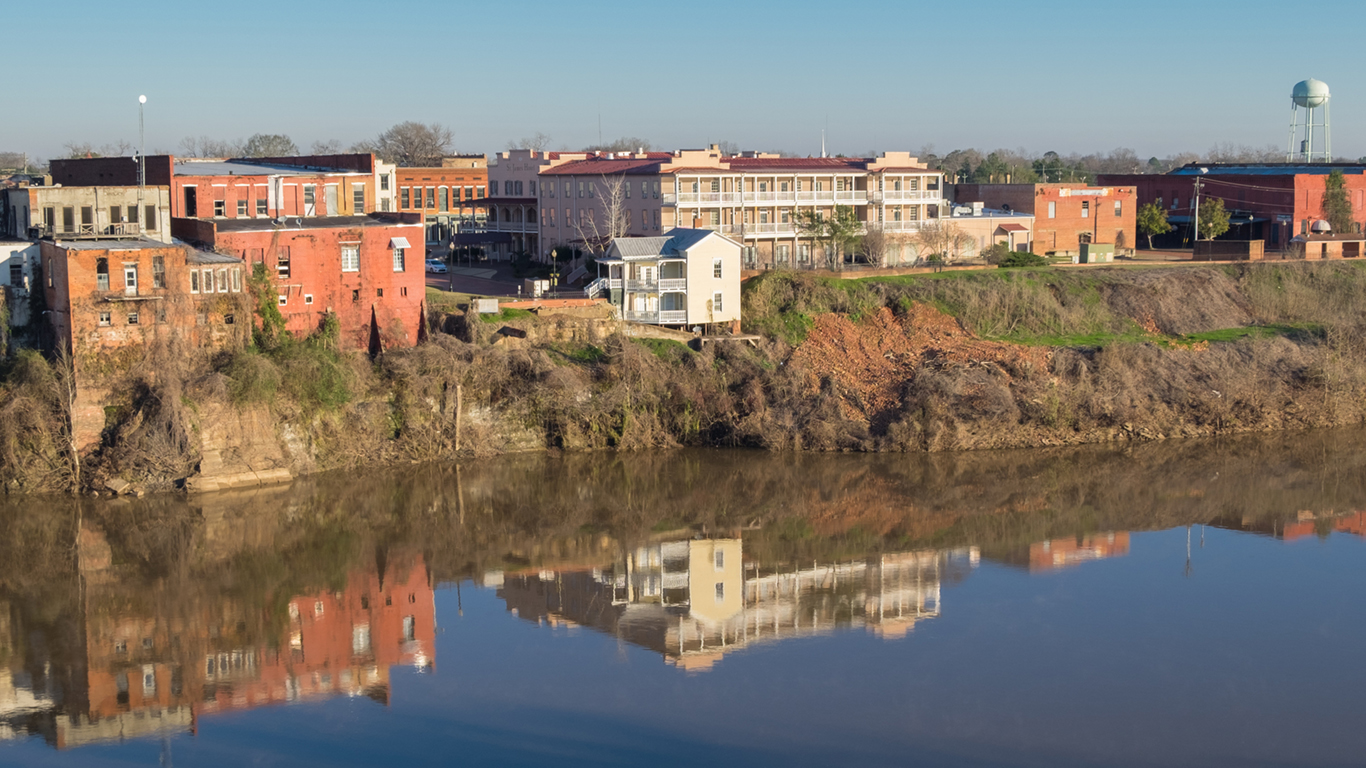
20. Dallas County, Alabama
> 5-yr. pop. change: -5.6%
> Unemployment: 5.6%
> Poverty rate: 34.3%
> Life expectancy: 72.4 years
Dallas County is one of several in the Black Belt region of Alabama to rank among the 50 worst places to live. Originally named for its dark topsoil, the Black Belt region’s moniker took on additional significance in the 20th century as several of its cities — Montgomery and Dallas County seat Selma — became major centers of the civil rights movement. The Dallas County population has steadily declined since then, falling from a peak of 56,667 in 1960 to 41,426 in 2016.
Today, Dallas County is one of the poorest counties in the country. The typical household earns just $28,136 a year, or about half of the national median household income of $55,322. An estimated 34.3% of the population lives in poverty, the fifth highest poverty rate in Alabama and one of the highest in the country.
[in-text-ad]

19. Knox County, Kentucky
> 5-yr. pop. change: -0.3%
> Unemployment: 6.0%
> Poverty rate: 34.4%
> Life expectancy: 73.3 years
Knox County is one of the 14 counties on this list in the Eastern Kentucky Coalfield, a region that has suffered substantial economic and population decline alongside the decline of the U.S. coal industry. While a number of counties in the region have lost more than half of their populations over the past several decades, Knox County’s population has fully recovered to its mid-1940s peak. Despite relatively stable population growth, the county trails most counties in a number of measures assessing quality of life.
A large share of college-educated adults can help attract advanced, high-paying industries to an area, and college graduates earn $22,000 more than high school graduates on average. In Knox County, just 10.9% of adults have a bachelor’s degree, nearly a third of the 30.3% of adults nationwide who do. An estimated 34.4% of county residents live in poverty — more than twice the 15.1% share and one of the highest poverty rates in the country.
18. Leflore County, Mississippi
> 5-yr. pop. change: -6.7%
> Unemployment: 7.3%
> Poverty rate: 40.4%
> Life expectancy: 72.7 years
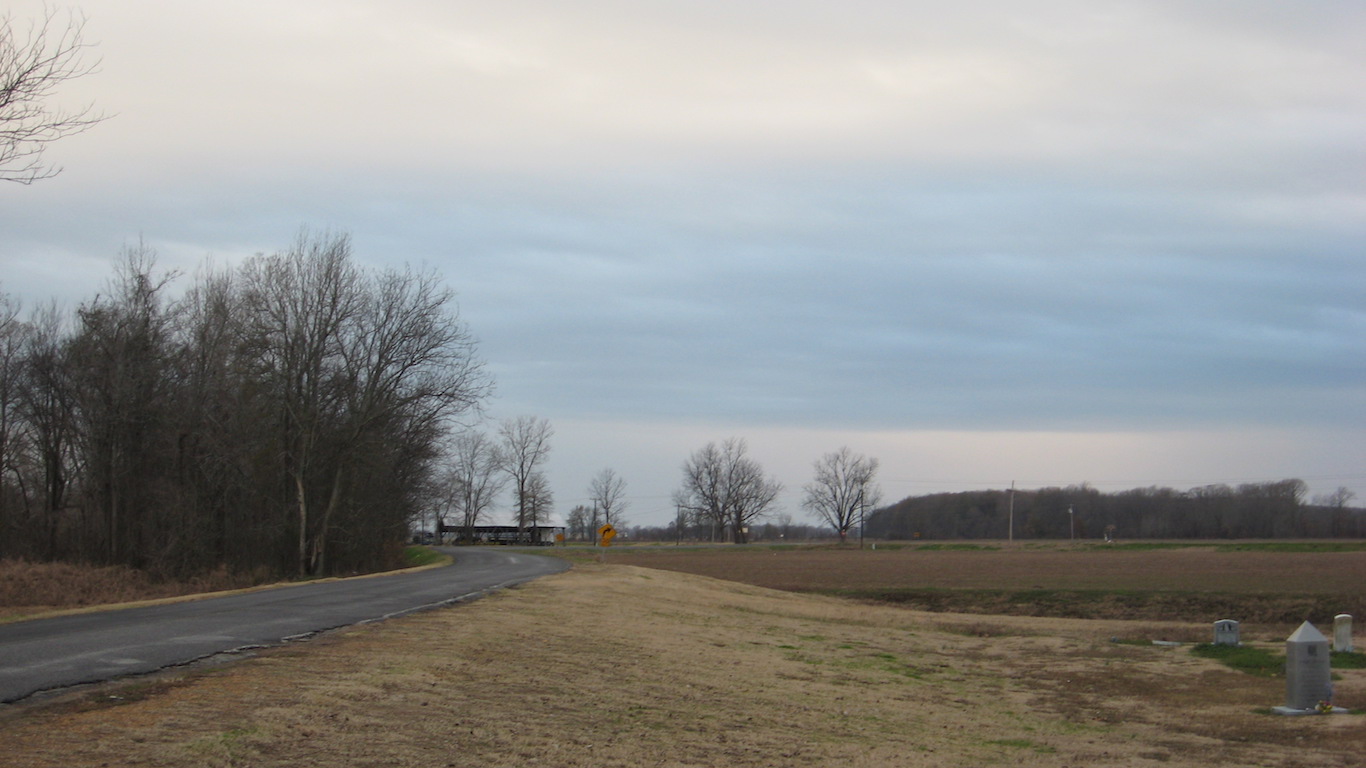
Leflore County is located in the Mississippi Delta. Like much of the region, the county suffered heavy population and economic decline in the mid-20th century as the mechanization of agriculture drastically reduced the number of jobs in the area. Today the county is home to just 30,500 residents, a 43% decline from its peak of 53,506 in 1930. The unemployment rate of 7.3% is the 11th highest in Mississippi and one of the highest nationwide.
Low educational attainment and a lack of advanced skills training in the Mississippi Delta may be hindering the region’s recovery. Just 77.5% of adults in Leflore County have a high school diploma, far less than the 87.0% of adults nationwide. Americans who did not graduate high school make $30,000 less than college graduates on average. In Leflore County, the typical household earns $25,356 a year — among the least of any county.
17. Coahoma County, Mississippi
> 5-yr. pop. change: -6.0%
> Unemployment: 6.7%
> Poverty rate: 35.2%
> Life expectancy: 71.1 years
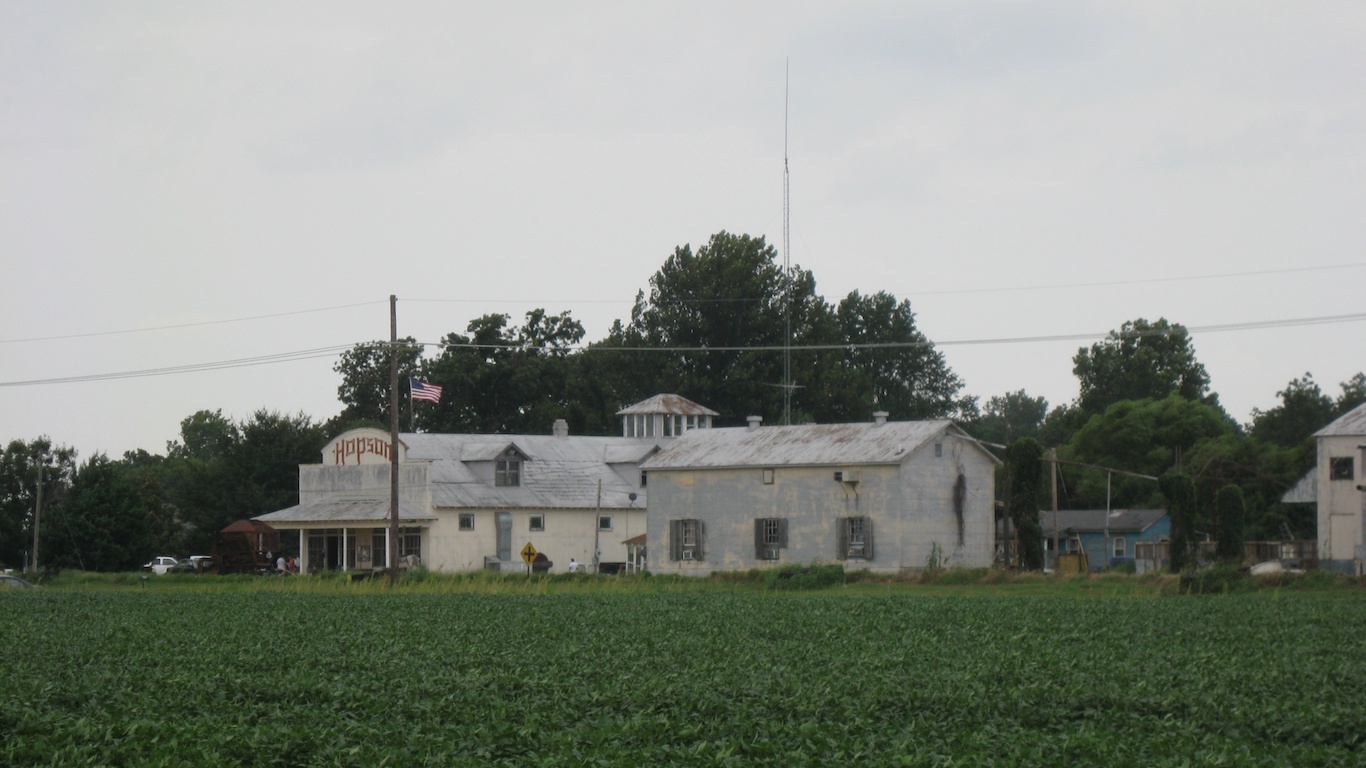
Coahoma County is one of seven on this list located in the Mississippi Delta, a region whose agricultural economy suffered heavy job losses in the mid-20th century as farming techniques became less labor-dependent. The county’s population fell from a peak of 49,361 in 1950 to just 24,804 in 2016, a 50% decline. Today, 6.7% of the county’s workforce is unemployed, and 35.2% of residents live in poverty — each some of the highest such rates of any county.
While the relationship between income and life expectancy is complex, poor Americans are at a greater risk of premature death than wealthier Americans. In Coahoma County, life expectancy is just 71.1 years — shorter than the life expectancy in developing countries such as El Salvador, Tonga, and Libya, and eight years shorter than the U.S. life expectancy.
[in-text-ad-2]

16. Harlan County, Kentucky
> 5-yr. pop. change: -4.9%
> Unemployment: 6.7%
> Poverty rate: 32.4%
> Life expectancy: 71.5 years
Harlan County is one of 14 counties on this list located in the Eastern Kentucky Coalfield, a region that suffered severe population decline in the mid-20th century alongside the decline of the U.S. coal mining industry. Today the county has a population of just 28,031– nearly one-third its peak of 75,275 residents in 1940. It is also one of the poorest and least healthy counties in the nation. The typical household earns just $25,350 a year, less than half the national median income of $55,322. An estimated 32.4% of residents live in poverty, more than twice the 15.1% national poverty rate. Income is one of the largest determinants of health and life expectancy, and the average Harlan County resident is expected to live just 71.5 years — nearly eight years less than the U.S. life expectancy.

15. Sunflower County, Mississippi
> 5-yr. pop. change: -8.8%
> Unemployment: 8.4%
> Poverty rate: 34.6%
> Life expectancy: 71.6 years
Located in the Mississippi Delta region, Sunflower County experienced heavy population and economic decline throughout the mid-20th century as the mechanization of farming techniques drastically reduced the number of jobs in the area’s agriculture-based economy. The county’s population fell from a peak of 66,364 in 1930 to 27,424 today, a 59% decline. The unemployment rate of 8.4% is the second highest in Mississippi and more than twice the 4.1% national unemployment rate.
The typical Sunflower County household earns just $27,126 a year, and 34.6% of residents live in poverty — each some of the worst figures in the country. Income is one of the major determinants of health. Life expectancy in Sunflower County is just 71.6 years, more than seven years less than the U.S. life expectancy.
[in-text-ad]
14. Wilcox County, Alabama
> 5-yr. pop. change: -6.3%
> Unemployment: 9.5%
> Poverty rate: 34.9%
> Life expectancy: 72.2 years
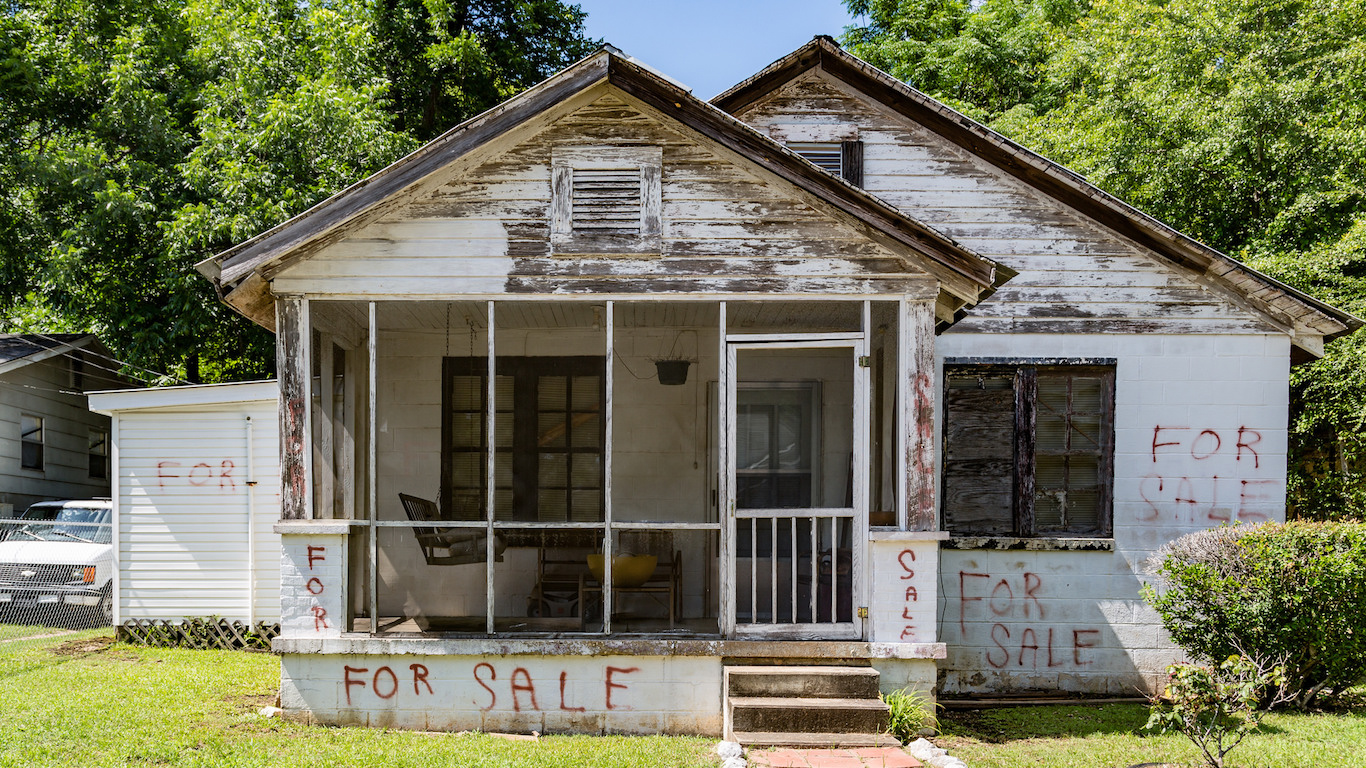
Wilcox County is one of several counties on this list located in Alabama’s Black Belt, a region named for its dark topsoil whose moniker gained additional significance when several of its cities — Montgomery and Selma, for example — became major centers of the civil rights movement. While the region once prospered in the cotton-based economy of the antebellum South, today it is one of the poorest and most sparsely populated areas in the country. The county’s population peaked at 35,631 in 1900, and steadily declined to just 11,119 in 2016. Today, the typical household earns just $24,442 a year, less than half the national median household income of $55,322 and among the least of any county.
While the relationship between income and life expectancy is complex, poor Americans are far more likely to die younger than wealthier individuals. The typical Wilcox County resident is expected to live for 72.2 years, shorter than the life expectancy in developing countries such as Tonga and El Salvador and nearly seven years less than the U.S. life expectancy.
13. Martin County, Kentucky
> 5-yr. pop. change: -4.1%
> Unemployment: 5.6%
> Poverty rate: 32.4%
> Life expectancy: 72.6 years
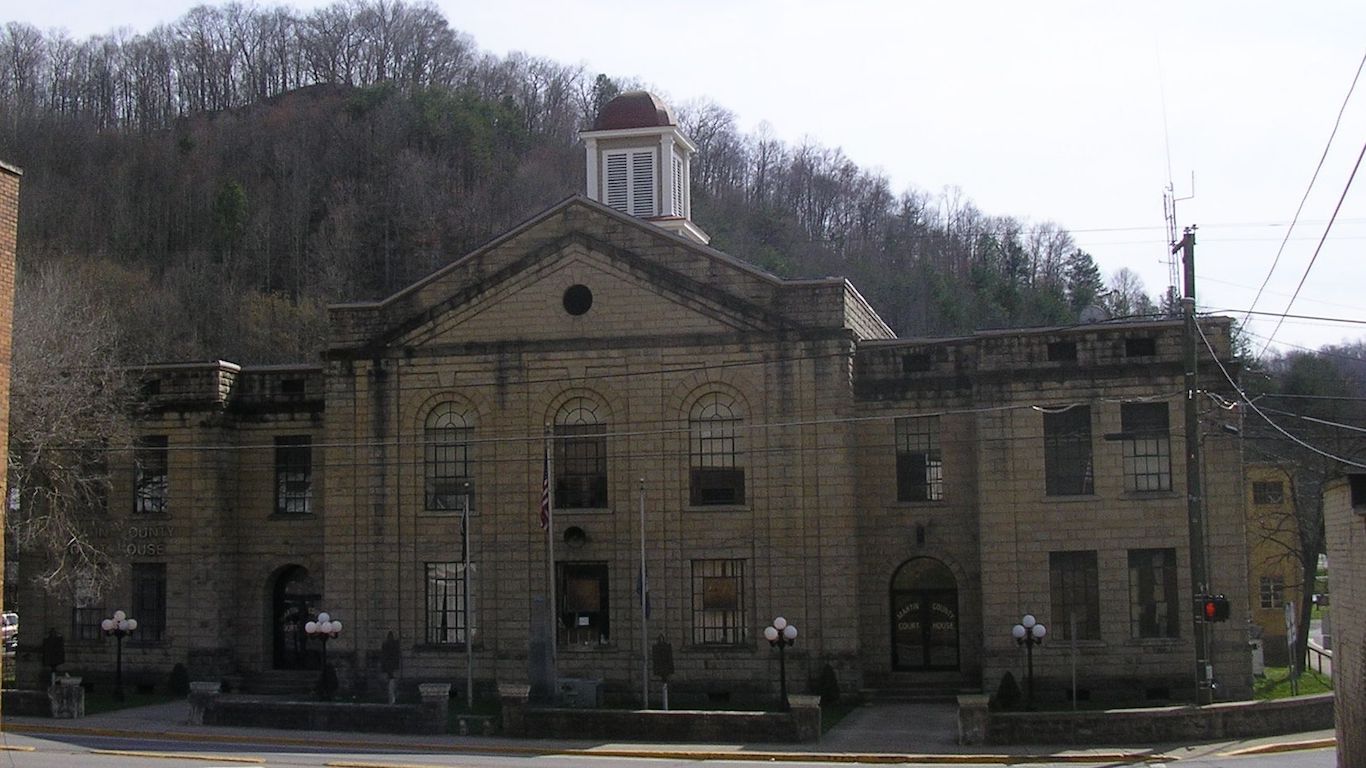
On an individual level, earning potential typically increases with educational attainment. In Martin County, just 6.3% of adults have a bachelor’s degree, the smallest share of any Kentucky county and just a fraction of the 30.3% share of American adults. Indeed, jobs in the area are low paying. The typical area household earns just $29,052 a year, about $15,800 less than the typical Kentucky household and $26,300 less than the national median income.
As is the case with most counties on this list, Martin County is shrinking. In the last five years, the county’s population contracted by 4.1%, even as the state’s population grew by 1.5%.
12. Phillips County, Arkansas
> 5-yr. pop. change: -9.6%
> Unemployment: 6.2%
> Poverty rate: 33.5%
> Life expectancy: 71.3 years
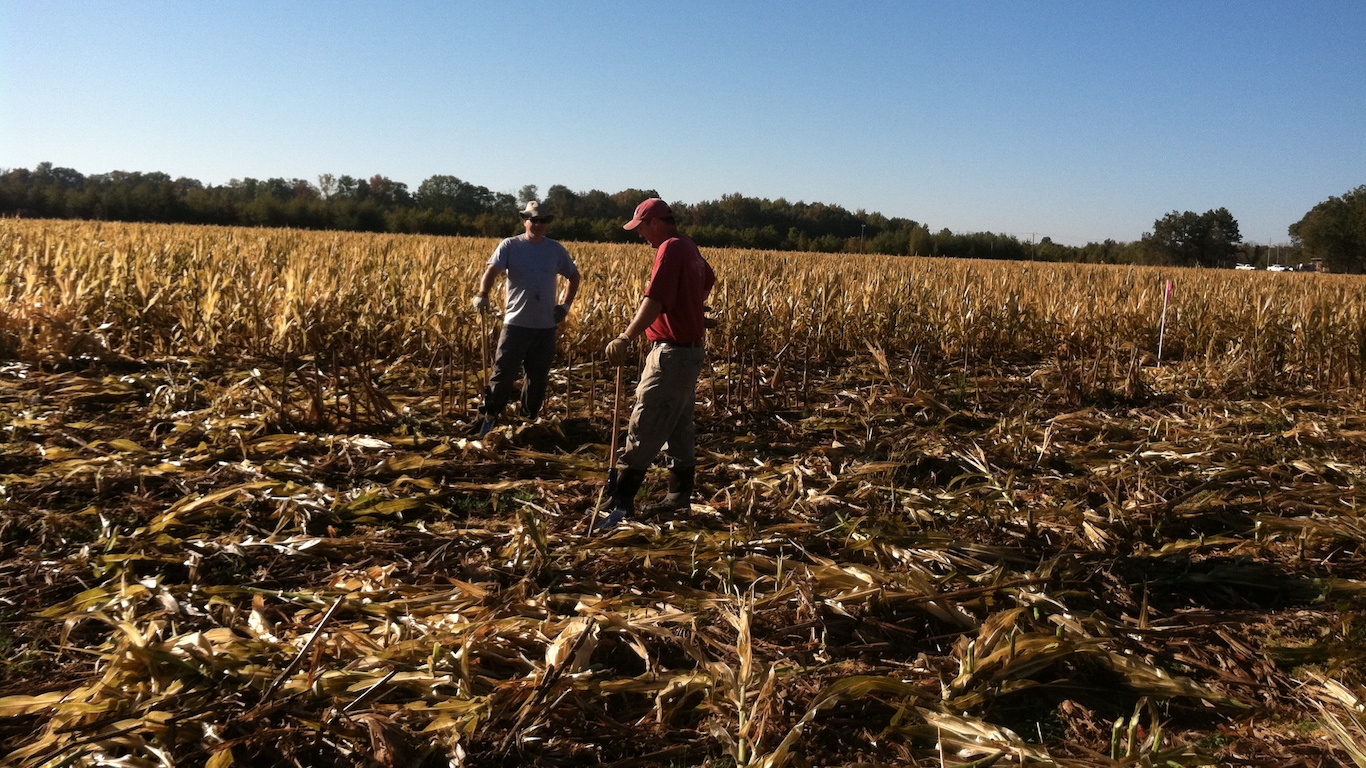
While the populations of most of the worst counties to live in have been shrinking for years, none are shrinking as fast as Phillips County, Arkansas. Over the last half decade, the number of people living in Phillips fell by 9.6%, even as Arkansas’ population expanded by 1.7%.
Many former Phillips residents were likely driven out by poor economic conditions. As of December 2017, the county’s unemployment rate was 6.2%, well above the statewide unemployment rate of 3.7% and the 4.1% national figure. A weak job market likely contributes to low area incomes. More than 1 in 3 county residents live in poverty, well above the 18.8% share of state residents.
[in-text-ad-2]
11. Leslie County, Kentucky
> 5-yr. pop. change: -4.6%
> Unemployment: 6.8%
> Poverty rate: 32.5%
> Life expectancy: 71.2 years
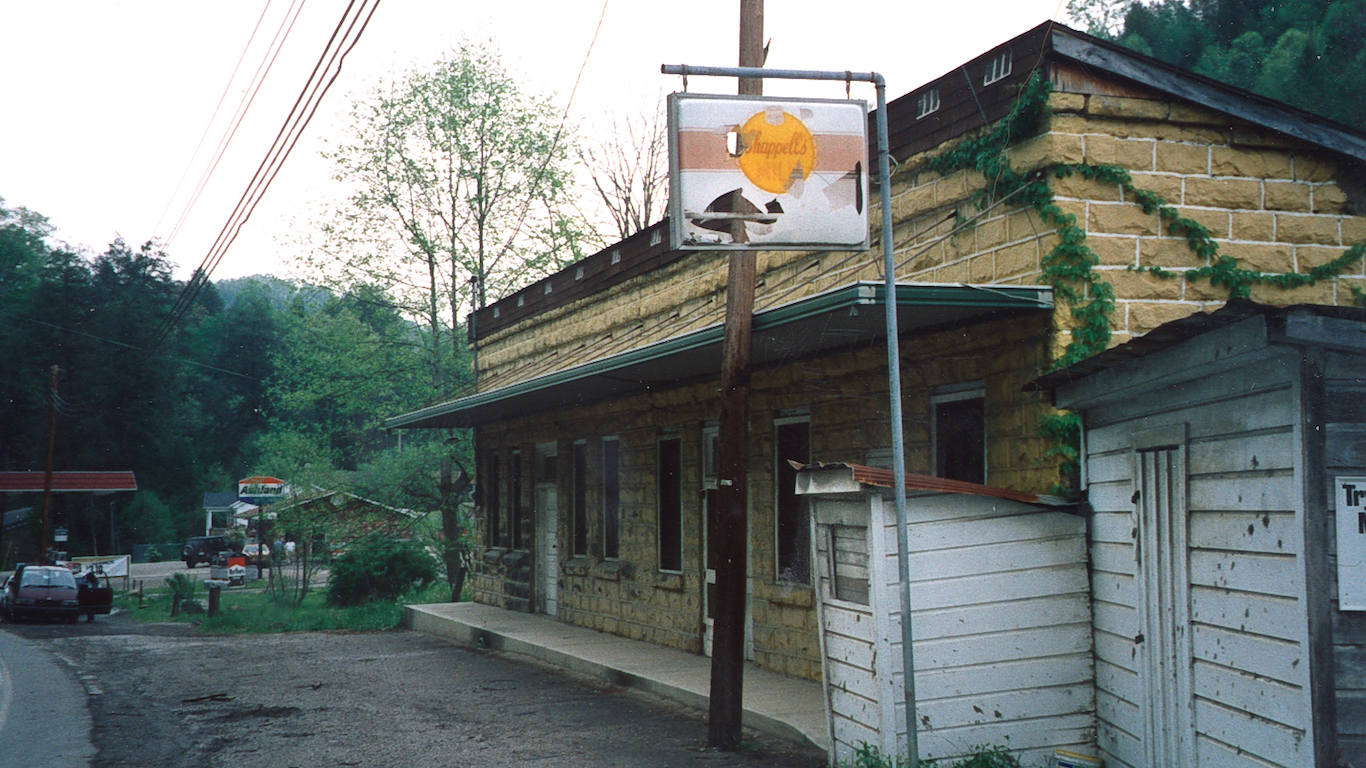
Leslie County is one of several counties on this list from the Eastern Kentucky Coalfield. Many jobs in the area are in resource extraction and mining, and local economic conditions reflect the industry’s decades long decline. Over the last five years alone, the county’s population has shrunk by 4.6% even as the state population as a whole grew by 1.5%. Additionally, some 6.8% of the county’s labor force are unemployed, well above the 4.4% state unemployment rate.
A basic high school education serves as a foundation for a healthy, financially secure life. In Leslie County, just 63.7% of adults have a high school diploma, one of the smallest such shares of any U.S. county. Additionally, at just 71.2 years, life expectancy in the county is well below the 79.1 year U.S. average.
10. Bell County, Kentucky
> 5-yr. pop. change: -3.7%
> Unemployment: 6.1%
> Poverty rate: 36.6%
> Life expectancy: 72.7 years
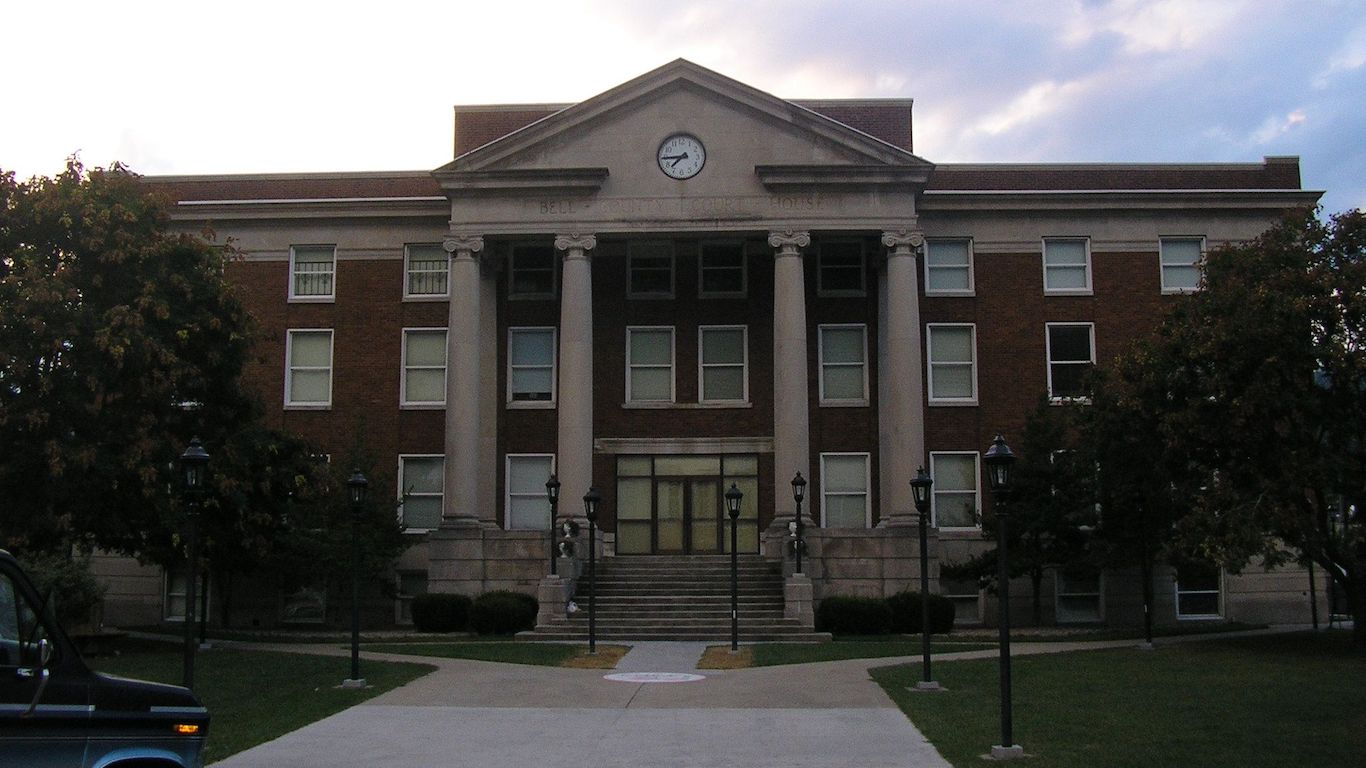
College-educated adults are more likely to lead long, healthy, financially secure lives. In Bell County, Kentucky, fewer than 1-in-10 adults have a bachelor’s degree, a fraction of the comparable 30.3% share of American adults nationwide. Additionally, just 68.1% of adults in Bell County have a high school diploma, well below the 87.0% U.S. share and one of the lowest such shares of any U.S. county.
Low educational attainment rates partially explain the area’s low life expectancy. College graduates live an average of nine years longer than high school dropouts, and life expectancy in Bell County is just 72.7 years, over six years less than the national average.
[in-text-ad]
9. Union County, Florida
> 5-yr. pop. change: -2.1%
> Unemployment: 3.4%
> Poverty rate: 22.4%
> Life expectancy: 67.6 years
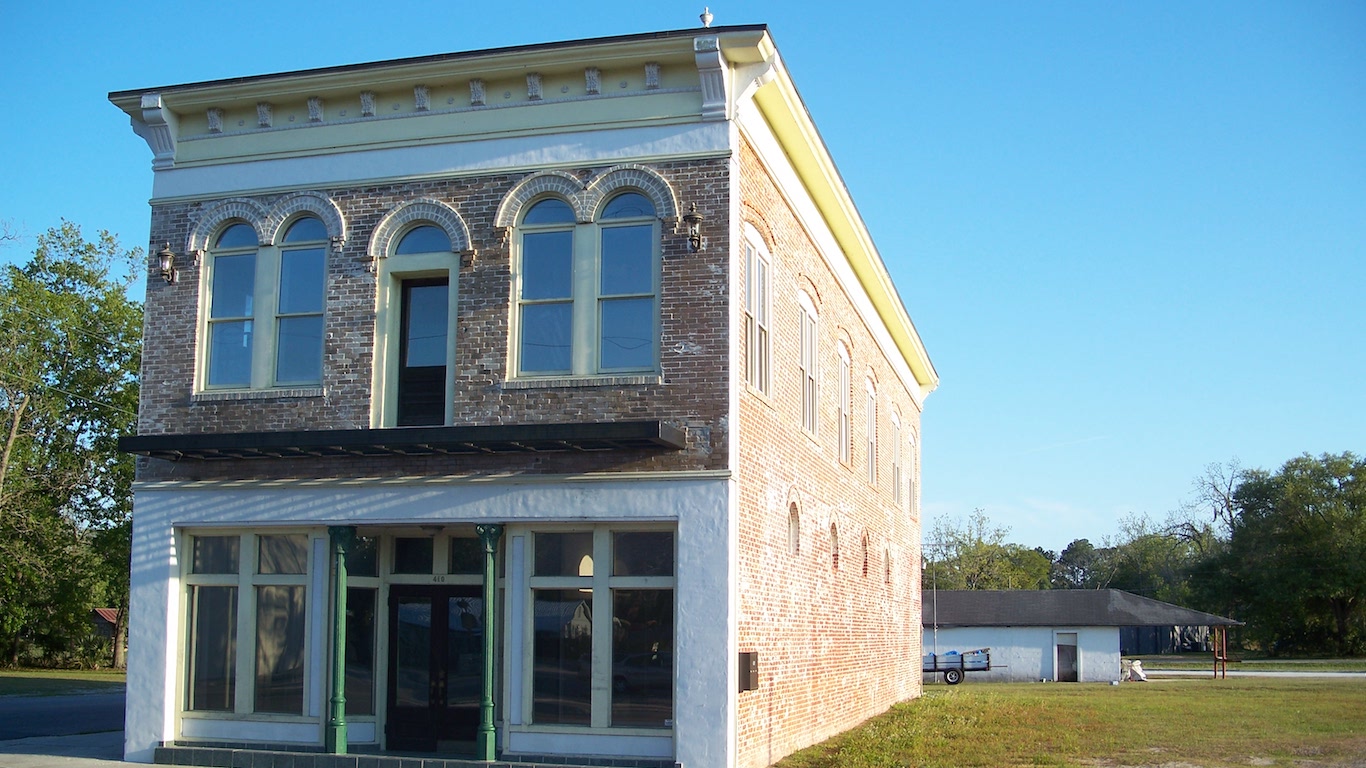
Union County, located about 30 miles north of Gainesville is the only county in Florida to rank among the worst places to live. The average life expectancy at birth in the county is just 67.6 years, the lowest of any county in Florida and about 11.5 years less than the average life expectancy nationwide. Life expectancy at birth is higher in a number of war-torn countries, including Iraq and Kosovo. College graduates live an average of nine years longer than high school dropouts, and in Union County, just 7.6% of adults have a bachelor’s degree, the second smallest share of any county in Florida and about one-fourth the comparable share of American adults with a four-year college degree.
Still, by some measures, Union County is in better shape than other counties on this list. For example, with a 3.4% unemployment rate, Union County is the only county on this list with a lower jobless rate than the U.S. as a whole.
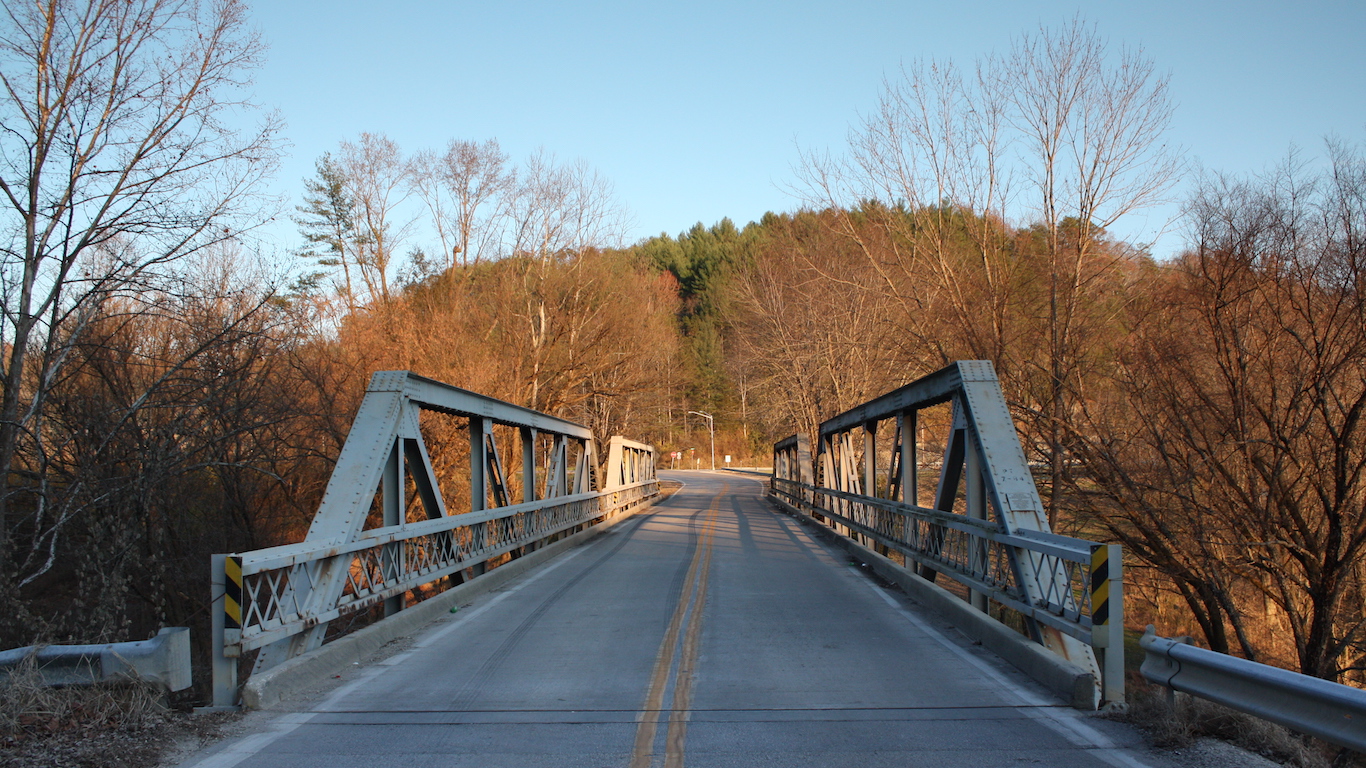
8. Breathitt County, Kentucky
> 5-yr. pop. change: -4.2%
> Unemployment: 6.3%
> Poverty rate: 33.5%
> Life expectancy: 70.2 years
Breathitt County is one of the many counties on this list located in the Eastern Kentucky Coalfield region. As mining jobs in the area disappeared over the last six decades, the county’s population fell from a peak of 23,946 in 1940 to just 13,476 today. The typical household in the county earns just $25,484 a year, less than half the national median household income of $55,322. An estimated 33.5% of residents live in poverty, a higher poverty rate than in nearly any other U.S. county. One factor contributing to the area’s low incomes and lagging economy is low educational attainment. Just 71.4% of adults have a high school diploma, far less than the 87.0% of adults nationwide.
Income and education are two of the main factors that affect health and life expectancy. Life expectancy in Breathitt County is just 70.2 years, nearly nine years less than the average U.S. life expectancy and among the lowest of any U.S. county.

7. Madison Parish, Louisiana
> 5-yr. pop. change: -3.1%
> Unemployment: 6.4%
> Poverty rate: 39.6%
> Life expectancy: 71.6 years
Madison is the worst parish to live in Louisiana and the seventh worst county equivalent in the country. One of the poorest places nationwide, the parish’s median household income of just $25,404 a year is less than half the median household income nationwide of $55,322. The low incomes are highlighted by the area’s high prevalence of poverty. Nearly 40% of county residents live below the poverty line, far higher than the U.S. poverty rate of 15.1% and about double the poverty rate across Louisiana as a whole.
As is the case with many poor counties, life expectancy in Madison Parish is low. At just 71.6 years, the average life expectancy in the eastern Louisiana parish is in line with countries like Libya, Bangladesh, and Kazakhstan and more than seven years below the U.S. average.
[in-text-ad-2]
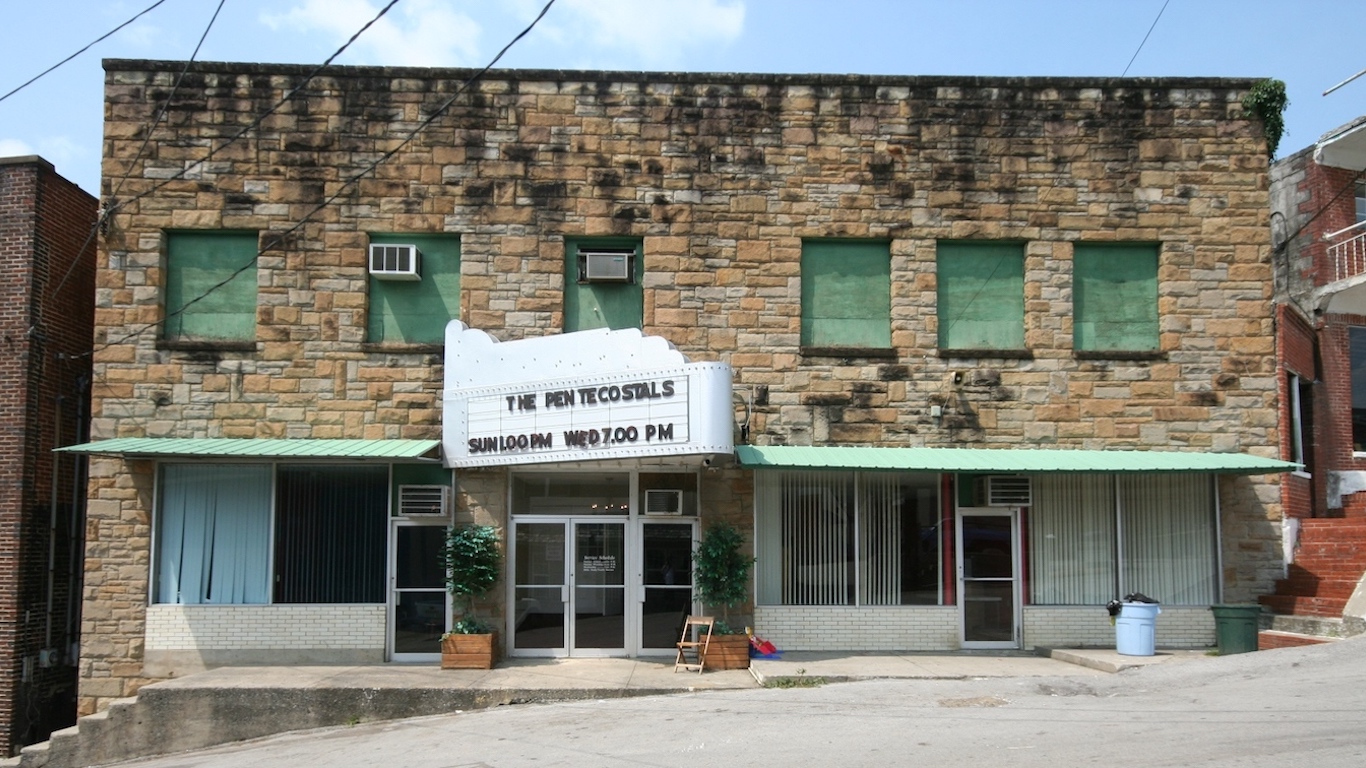
6. Clay County, Kentucky
> 5-yr. pop. change: -3.8%
> Unemployment: 6.1%
> Poverty rate: 41.0%
> Life expectancy: 71.8 years
By a number of measures assessing education, income, and health, Clay County is one of the worst counties to live in. Just 63.7% of county adults have graduated from high school — one of the smallest shares of any U.S. county. Americans without a high school diploma earn nearly $30,000 less a year than college graduates, and the typical county household earns just $22,174 annually, less than half the comparable national income of $55,322 and the 12th least of any county.
While the relationships between education, income, and health are complex, poorer Americans are far more likely to die prematurely than wealthier individuals. Life expectancy in Clay County is just 71.8 years, more than seven years less than the U.S. life expectancy.

5. McCreary County, Kentucky
> 5-yr. pop. change: -1.9%
> Unemployment: 5.5%
> Poverty rate: 42.5%
> Life expectancy: 72.9 years
McCreary County is the worst county to live in in Kentucky and the fifth worst in the United States. Located in the Daniel Boone National Forest in southern Kentucky along the Tennessee border, the county’s economy is heavily dependent on resource extraction — particularly coal.
Coal mining can be dangerous work with little in the way of educational prerequisites. Most industry workers have no more than a high school diploma, and partially as a result of the regional economic conditions, just 7.7% of adults in the county have a bachelor’s degree, well below the 30.3% of American adults. Greater educational attainment typically leads to longer lives and greater financial security, and at 72.9 years, life expectancy is over six years less than it is on average nationwide. Additionally, 42.5% of area residents live in poverty, nearly triple the 15.1% U.S. poverty rate.
[in-text-ad]
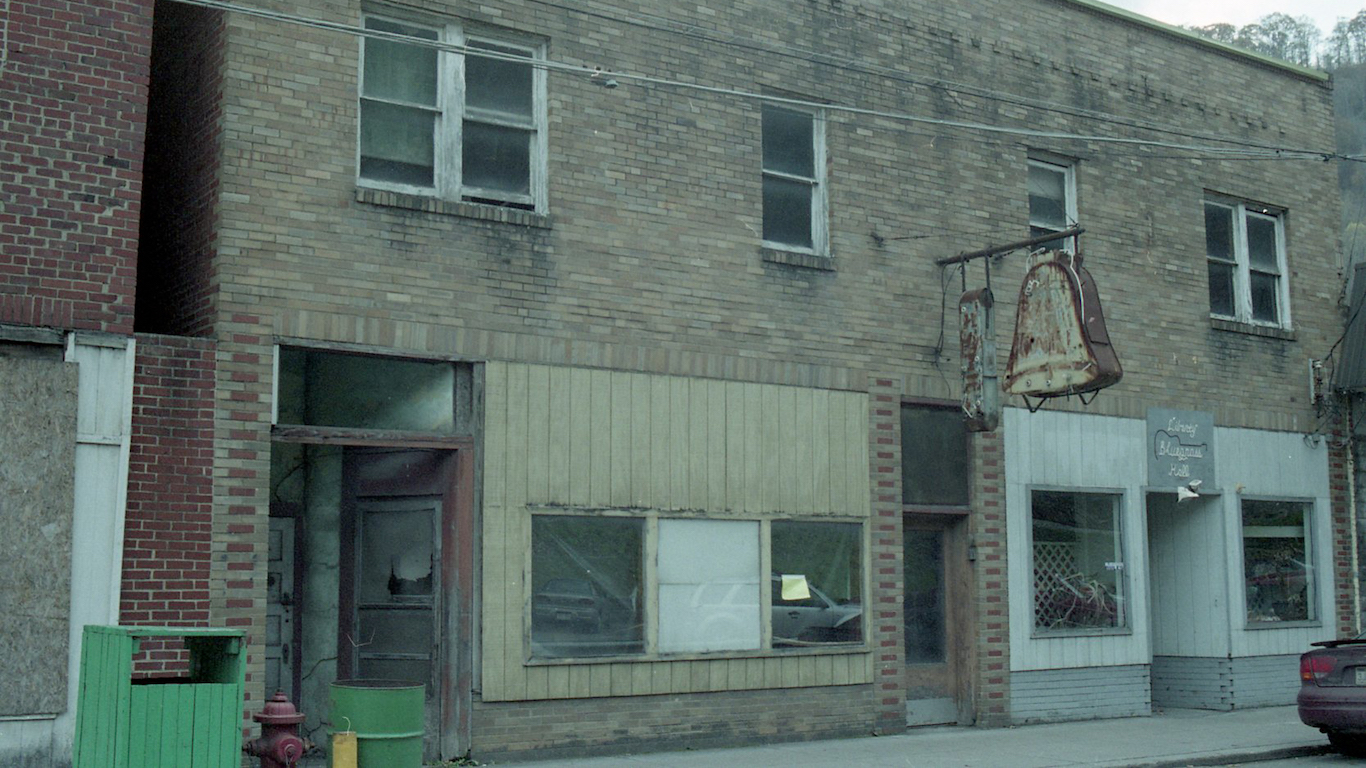
4. McDowell County, West Virginia
> 5-yr. pop. change: -8.9%
> Unemployment: 8.1%
> Poverty rate: 37.6%
> Life expectancy: 70.3 years
McDowell County is one of the poorest counties in the United States. A former coal-producing power house, the county has declined with the industry. Peaking at nearly 100,000 in 1950, the county’s population is now just 20,300. Jobs have also left the area. Currently, the county’s unemployment rate stands at 8.9% — more than double the 4.1% U.S. unemployment rate. A high jobless rate partially explains the area’s low incomes. The typical McDowell household earns just $25,206 a year, less than half the $55,322 median income nationwide.
As is the case in many poor areas, life expectancy in McDowell County is low. At 70.3 years, life expectancy at birth is nearly nine years shorter in McDowell County than the national average.
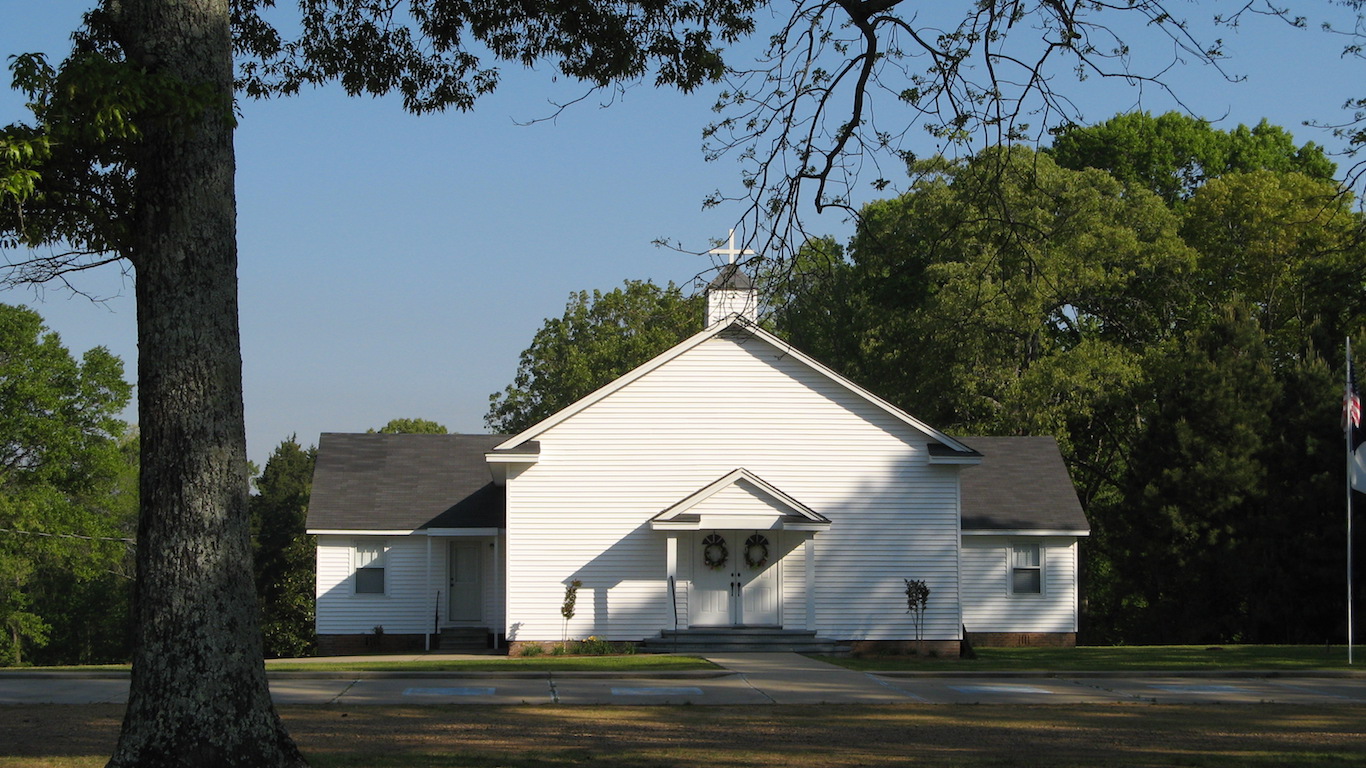
3. Holmes County, Mississippi
> 5-yr. pop. change: -4.3%
> Unemployment: 8.5%
> Poverty rate: 45.0%
> Life expectancy: 71.0 years
The western part of Holmes County is located in the Mississippi Delta. Like much of the region, the county’s agriculture-based economy suffered heavily in the first half of the 20th century due to the mechanization of farming techniques. Today, the county is one of the poorest places in the country. Over the past six decades, the county’s population fell from a peak of 39,710 in 1940 to just 18,547 in 2016. Today, 8.5% of the Holmes County workforce is unemployed, more than twice the 4.1% national rate and one of the highest unemployment rates of any county. The typical household earns just $20,800 a year — the third lowest of any county in the United States — and an estimated 45.0% of residents live in poverty — the sixth highest poverty rate in the country.
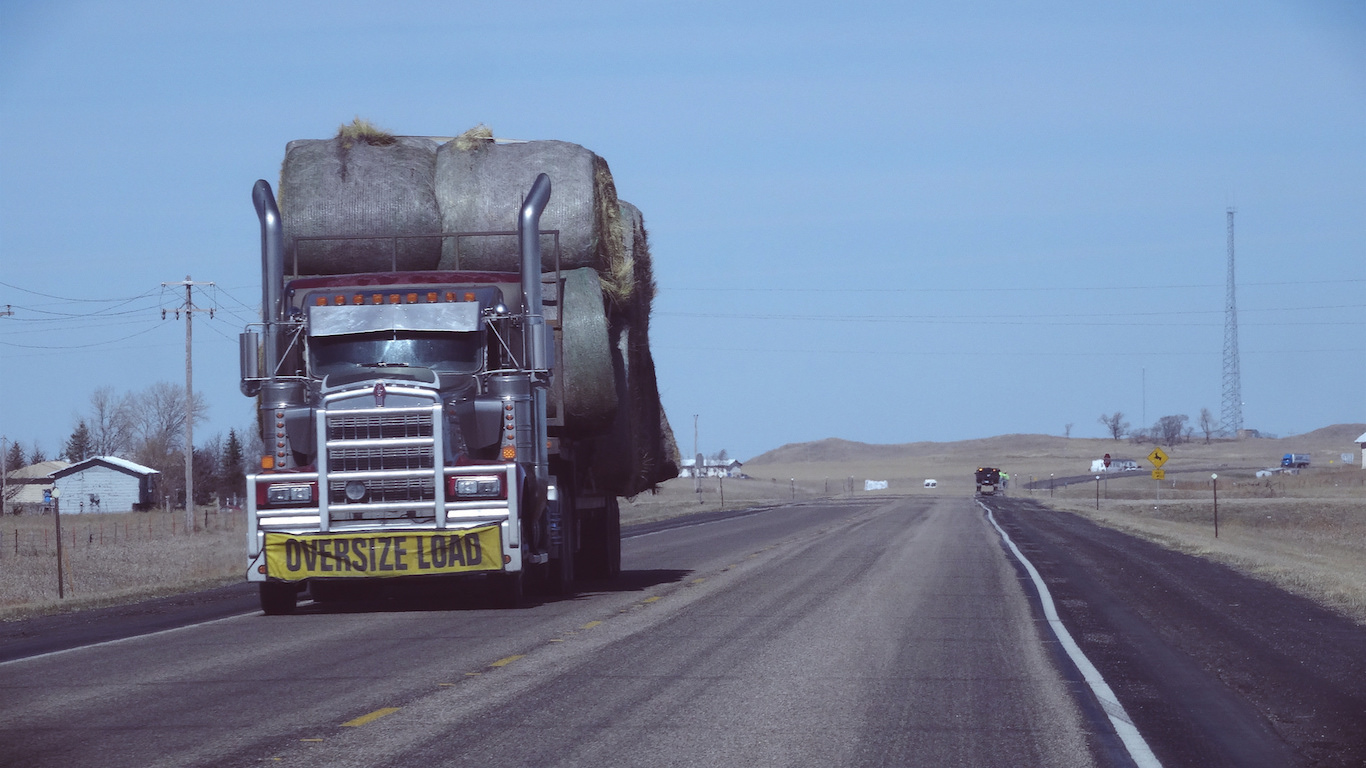
2. Todd County, South Dakota
> 5-yr. pop. change: 3.9%
> Unemployment: 6.9%
> Poverty rate: 47.1%
> Life expectancy: 68.5 years
Todd County is one of only a handful nationwide with a life expectancy at birth below 70 years. Poor health outcomes are partially attributable to inadequate financial resources. Lower-income Americans have less access to health care and to healthy options related to diet and lifestyle, and in Todd County, 47.1% of residents live below the poverty line — more than triple the 15.1% U.S. poverty rate.
Indian reservations face a range of unique economic challenges, and as a result are often poorer and less healthy than much of the rest of the nation. Contained by the Rosebud Indian Reservation, about 77% of the county population identifies as Native American.
[in-text-ad-2]

1. Oglala Lakota County, South Dakota
> 5-yr. pop. change: 0.0%
> Unemployment: 0.0%
> Poverty rate: 53.9%
> Life expectancy: 66.8 years
Oglala Lakota County is entirely within the bounds of the Pine Ridge Indian Reservation. The county’s population almost exclusively identifies as Native American. Residents of Indian reservations in the United States face a unique set of economic challenges, including low incomes, a high risk of premature death, and some of the worst quality of life in the country. An estimated 53.9% of Oglala Lakota residents live in poverty, by far the highest poverty rate of any county and more than three times the national poverty rate.
While the relationship between poverty and health is complex, poor Americans are far more likely to die young than wealthier individuals. The average resident born in Oglala Lakota is expected to live just 66.8 years — equivalent to the U.S. life expectancy in 1942, and more than 12 years less than the current U.S. average life expectancy of 79.1 years. Life expectancy in Oglala Lakota County is the lowest of any U.S. county and is less than in developing countries such as North Korea and Iraq.
Detailed Findings & Methodology
Of the 50 counties with the lowest quality of life, 14 are located in the Eastern Kentucky Coalfield. While the region — which consists of 31 counties in Eastern Kentucky — once prospered thanks to a booming coal mining industry, the decline of the mining sector nationwide has drastically reduced employment opportunities in the area. Many counties in the region have lost more than half of their populations and been plunged into poverty since 1950. Nearly half of the region has a poverty rate above 30.0% and an unemployment rate above 6.0% — well above the 15.1% national poverty rate and 4.1% U.S. unemployment rate.
The Mississippi Delta also contains some of the poorest, least educated, and least healthy counties in the country. The region’s economy has been devastated by the mechanization of farm labor in the agriculture industry and the outbound migration of African Americans throughout the mid-20th century. Seven of the 18 counties that comprise the Mississippi Delta are on this list.
Many of the same economic conditions that afflict the Mississippi Delta have taken root in the Alabama Black Belt region. Originally named for its dark topsoil, the Black Belt’s name gained additional significance in the late 20th century as several of its cities — such as Montgomery and Selma — became major centers of the civil rights movement. Three of the 50 counties on this list are located in the Black Belt region.
While the relationship between income and life expectancy is complicated, poorer Americans are far more likely to die prematurely than wealthier individuals. Of the 75 counties with more than 10,000 residents and a poverty rate of at least 30%, 65 have shorter life expectancies than the average national life expectancy of 79.1 years. In many of the worst counties to live in, life expectancy is shorter than in developing countries such as North Korea, Iraq, and Libya.
To identify the worst counties in which to live, 24/7 Wall St. constructed an index composed of three socioeconomic measures — poverty rate, the percentage of adults who have at least a bachelor’s degree, and life expectancy at birth –and ranked counties based on the index. The selection of these three measures was inspired by the United Nations’ Human Development Index. Only counties with populations of at least 10,000 were considered. Poverty, the uninsured rate, and bachelor attainment rates came from the U.S. Census Bureau’s 2016 American Community Survey. Population data also came from the ACS. Life expectancies at birth are from the Institute for Health Metrics and Evaluation, a health research center affiliated with the University of Washington, and are for 2014. Unemployment rates are from the Bureau of Labor Statistics and are for December 2017. All data are for the most recent period available.
In 20 Years, I Haven’t Seen A Cash Back Card This Good
After two decades of reviewing financial products I haven’t seen anything like this. Credit card companies are at war, handing out free rewards and benefits to win the best customers.
A good cash back card can be worth thousands of dollars a year in free money, not to mention other perks like travel, insurance, and access to fancy lounges.
Our top pick today pays up to 5% cash back, a $200 bonus on top, and $0 annual fee. Click here to apply before they stop offering rewards this generous.
Flywheel Publishing has partnered with CardRatings for our coverage of credit card products. Flywheel Publishing and CardRatings may receive a commission from card issuers.
Thank you for reading! Have some feedback for us?
Contact the 24/7 Wall St. editorial team.
 24/7 Wall St.
 24/7 Wall St.
 24/7 Wall St.
 24/7 Wall St.
 24/7 Wall St.


