Special Report
Counties With the Worst Drug Problem in Every State

Published:
Last Updated:

In October 2017, President Donald Trump declared the opioid crisis a national public health emergency. The declaration followed a dramatic increase in drug overdose deaths involving opioids in the United States — such overdose deaths rose approximately fivefold from 2000 to 2016. Over that period, more than 600,000 Americans died from drug overdoses.
The death toll from drug overdoses in 2016 alone surpassed that of the worst year of AIDS-related deaths in 1995 and the entirety of American lives lost in the Vietnam War. While the opioid epidemic has taken lives and tore through nearly every community in America, some parts of the country have been affected far worse than others. The most vulnerable areas are often those with low incomes and low educational attainment, as well as high poverty and unemployment.
To determine the counties with the worst drug problem in every state, 24/7 Wall St. reviewed the number of drug-induced deaths — which include unintentional overdoses, suicide, homicide, and undetermined causes — per 100,000 residents for the period 2012 to 2016 with data from the Centers for Disease Control and Prevention’s WONDER web application.
Click here to see the full list of list of the counties with the worst drug problem in every state.
Click here to see our detailed findings and methodology.

1. Walker County, Alabama
> Annual drug deaths per 100,000 residents: 47.5 (county) 16.0 (state)
> Drug-related deaths, 2012-16: 160 (county) 3,113 (state)
> Poverty rate: 21.9%
> Population 65,593
[in-text-ad]

2. Anchorage Borough, Alaska
> Annual drug deaths per 100,000 residents: 18.2 (county) 17.0 (state)
> Drug-related deaths, 2012-16: 261 (county) 502 (state)
> Poverty rate: 8.1%
> Population 299,321

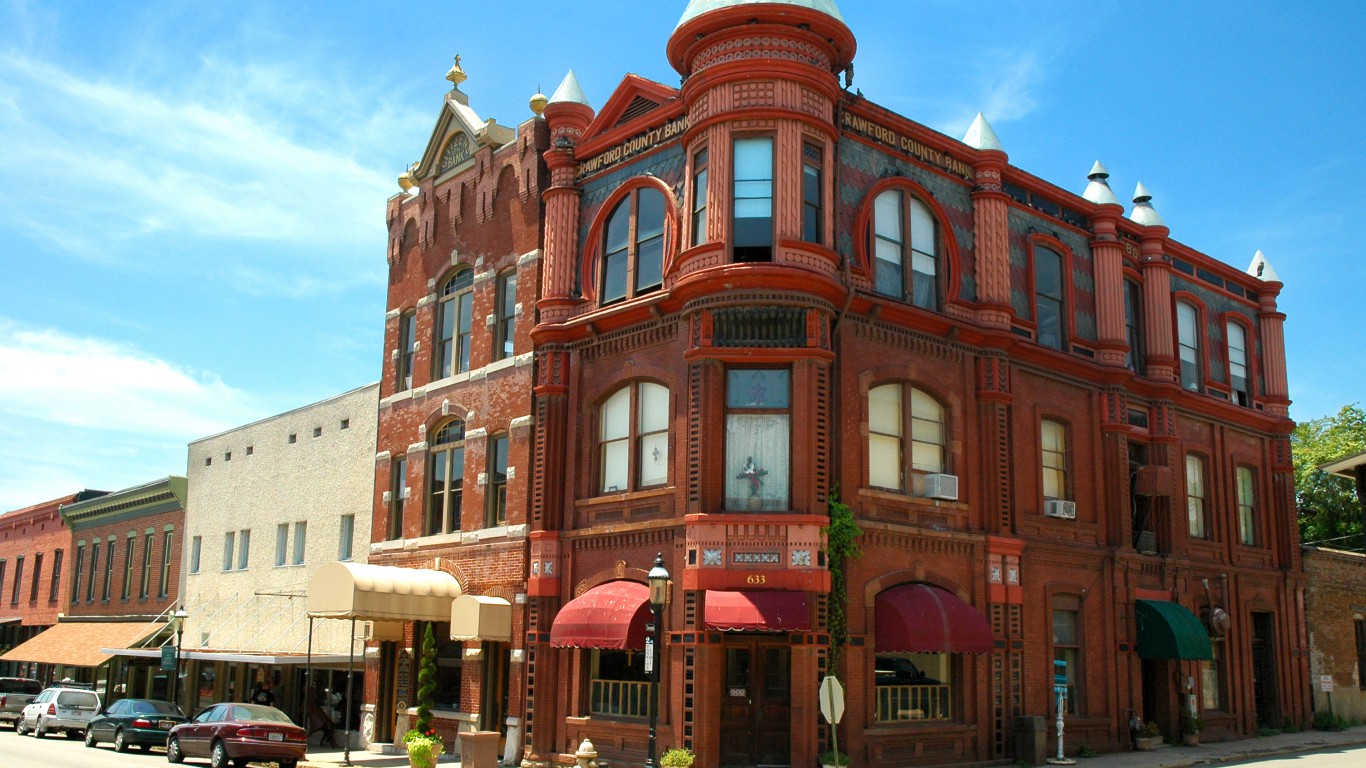
3. Mohave County, Arizona
> Annual drug deaths per 100,000 residents: 24.2 (county) 20.0 (state)
> Drug-related deaths, 2012-16: 243 (county) 5,429 (state)
> Poverty rate: 19.3%
> Population 203,629
[in-text-ad-2]

5. Lake County, California
> Annual drug deaths per 100,000 residents: 43.2 (county) 12.7 (state)
> Drug-related deaths, 2012-16: 139 (county) 19,682 (state)
> Poverty rate: 24.6%
> Population 64,076

6. Denver County, Colorado
> Annual drug deaths per 100,000 residents: 27.0 (county) 16.9 (state)
> Drug-related deaths, 2012-16: 797 (county) 3,647 (state)
> Poverty rate: 16.4%
> Population 663,303
[in-text-ad]

7. New Haven County, Connecticut
> Annual drug deaths per 100,000 residents: 14.4 (county) 21.3 (state)
> Drug-related deaths, 2012-16: 618 (county) 3,063 (state)
> Poverty rate: 12.8%
> Population 860,874

8. Sussex County, Delaware
> Annual drug deaths per 100,000 residents: 16.1 (county) 23.1 (state)
> Drug-related deaths, 2012-16: 156 (county) 870 (state)
> Poverty rate: 12.9%
> Population 211,224

9. Pasco County, Florida
> Annual drug deaths per 100,000 residents: 34.1 (county) 17.1 (state)
> Drug-related deaths, 2012-16: 788 (county) 13,747 (state)
> Poverty rate: 13.6%
> Population 488,310
[in-text-ad-2]

10. Haralson County, Georgia
> Annual drug deaths per 100,000 residents: 34.9 (county) 12.9 (state)
> Drug-related deaths, 2012-16: 50 (county) 5,259 (state)
> Poverty rate: 20.3%
> Population 28,667

11. Hawaii County, Hawaii
> Annual drug deaths per 100,000 residents: 13.0 (county) 12.7 (state)
> Drug-related deaths, 2012-16: 119 (county) 723 (state)
> Poverty rate: 18.7%
> Population 193,680
[in-text-ad]
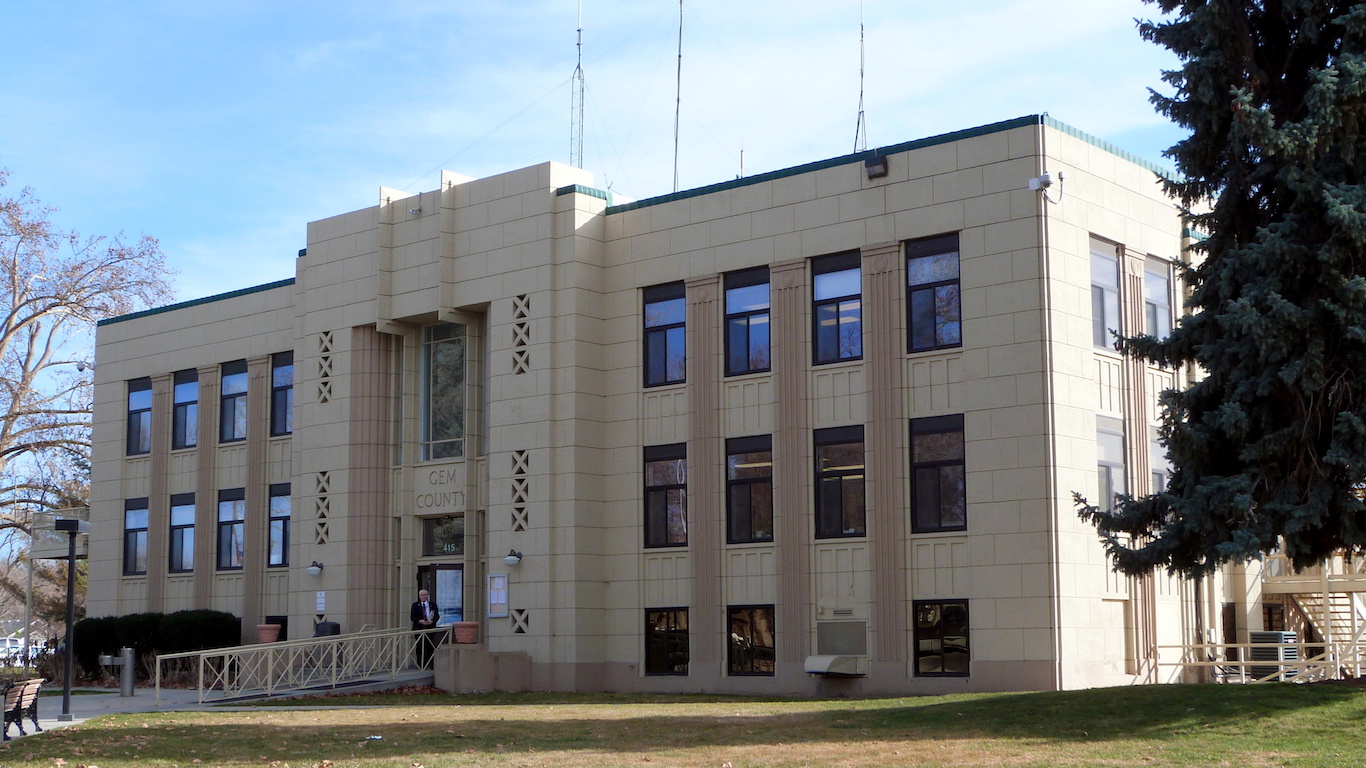
12. Gem County, Idaho
> Annual drug deaths per 100,000 residents: 25.0 (county) 14.0 (state)
> Drug-related deaths, 2012-16: 21 (county) 919 (state)
> Poverty rate: 22.2%
> Population 16,853
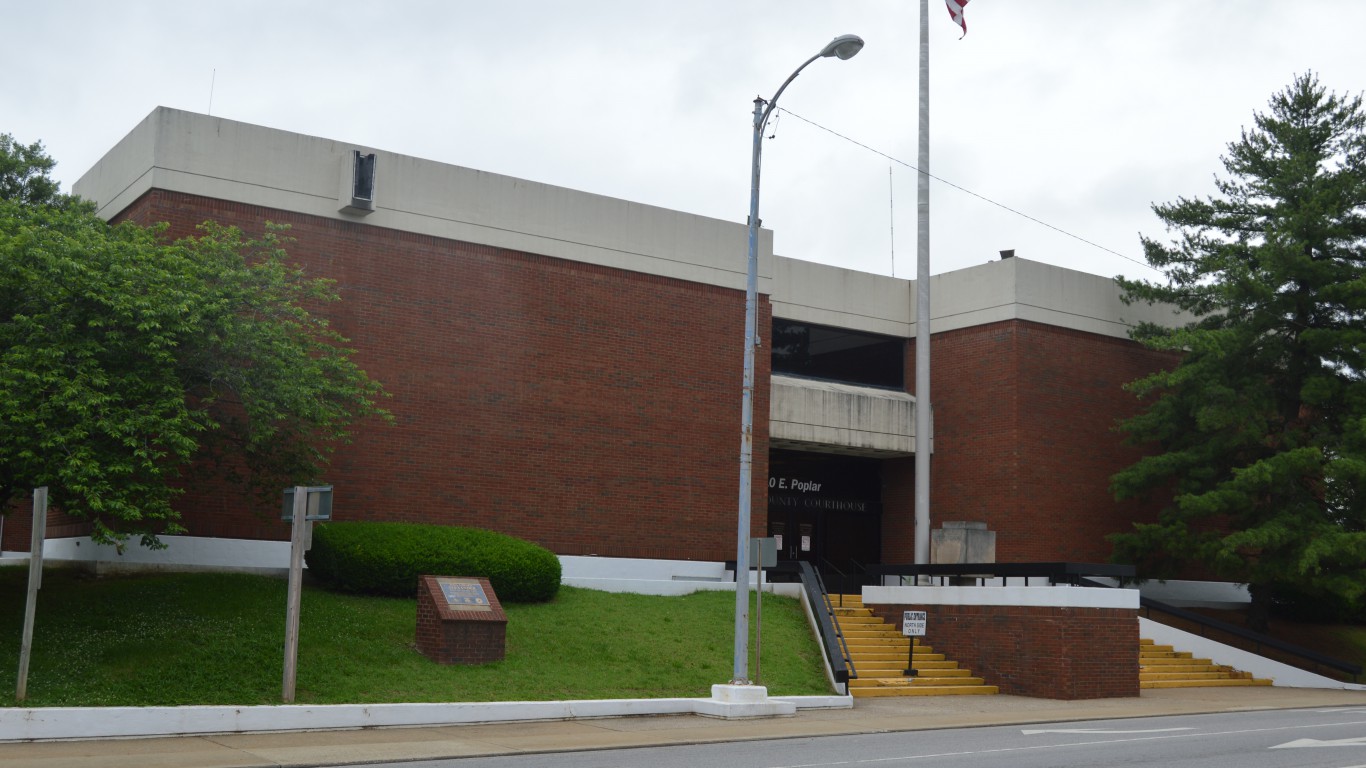
13. Saline County, Illinois
> Annual drug deaths per 100,000 residents: 23.9 (county) 14.9 (state)
> Drug-related deaths, 2012-16: 30 (county) 7,670 (state)
> Poverty rate: 22.3%
> Population 24,659
[in-text-ad-2]
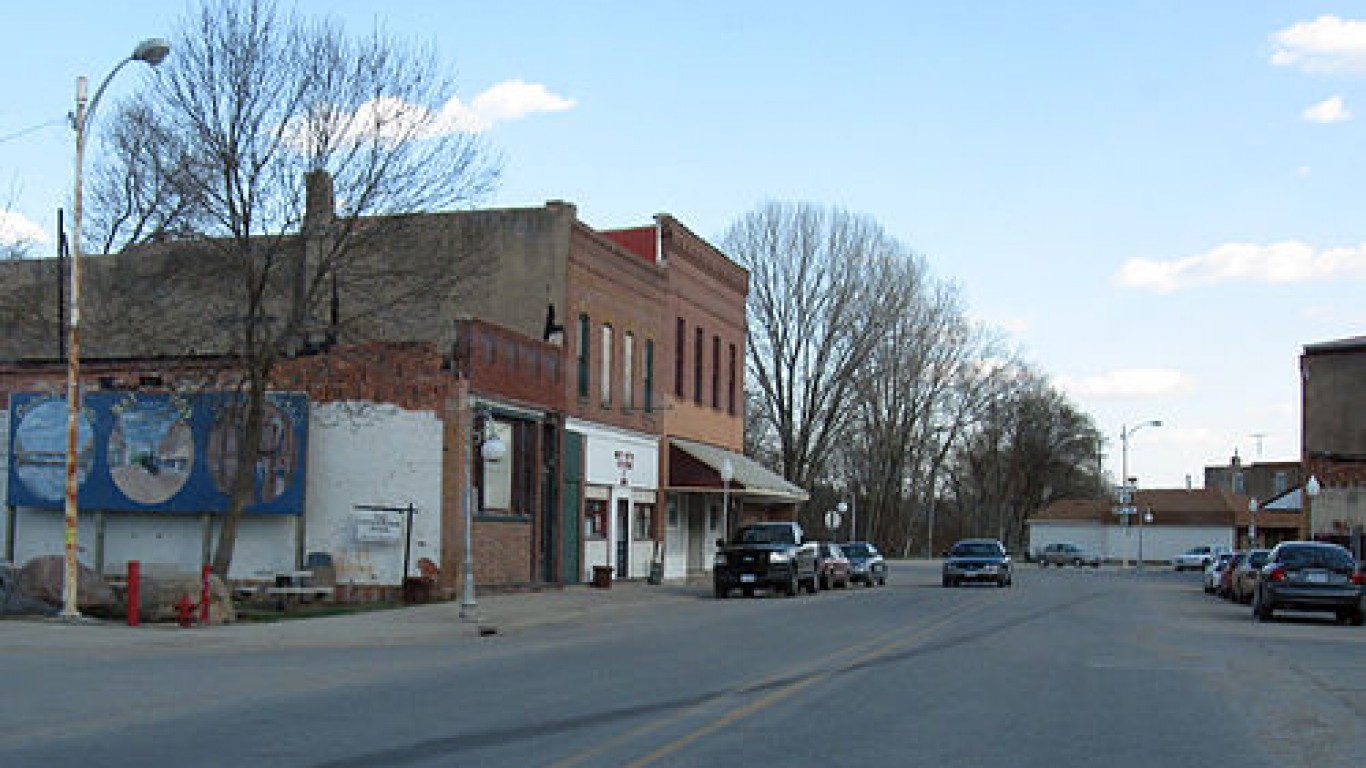
15. Webster County, Iowa
> Annual drug deaths per 100,000 residents: 15.7 (county) 9.9 (state)
> Drug-related deaths, 2012-16: 30 (county) 1,230 (state)
> Poverty rate: 15.7%
> Population 37,050
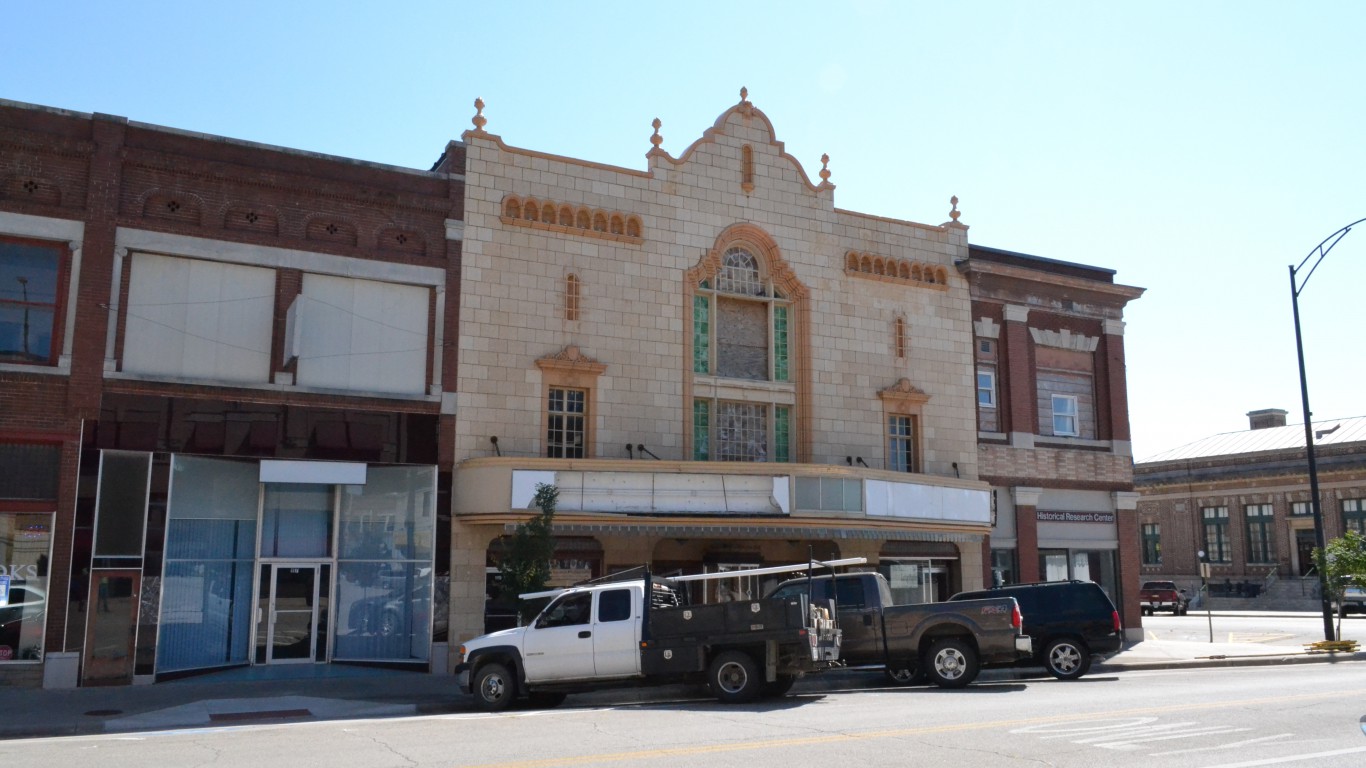
16. Montgomery County, Kansas
> Annual drug deaths per 100,000 residents: 17.5 (county) 11.9 (state)
> Drug-related deaths, 2012-16: 31 (county) 1,387 (state)
> Poverty rate: 19.0%
> Population 33,765
[in-text-ad]
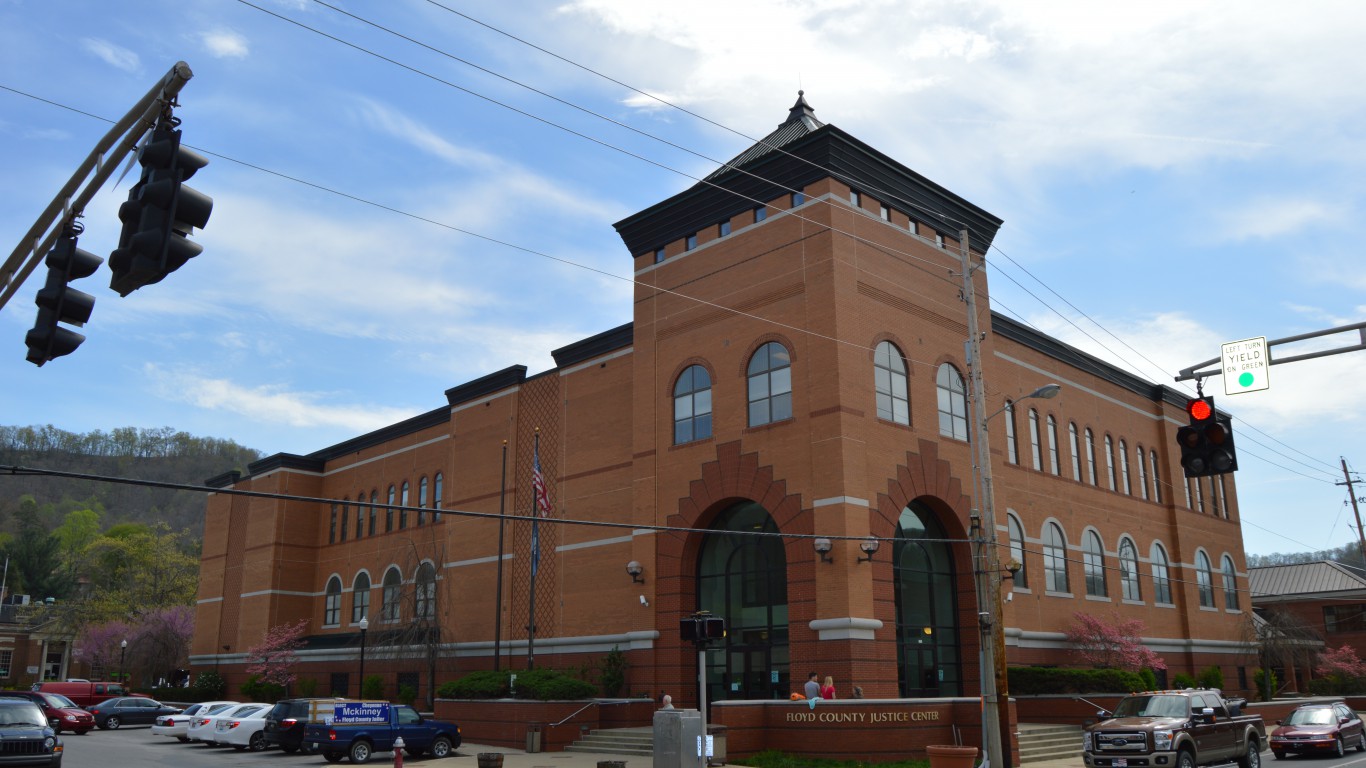
17. Floyd County, Kentucky
> Annual drug deaths per 100,000 residents: 68.5 (county) 28.5 (state)
> Drug-related deaths, 2012-16: 136 (county) 5,034 (state)
> Poverty rate: 30.7%
> Population 38,144

18. St. Bernard Parish, Louisiana
> Annual drug deaths per 100,000 residents: 44.8 (county) 19.2 (state)
> Drug-related deaths, 2012-16: 72 (county) 3,583 (state)
> Poverty rate: 20.1%
> Population 44,091
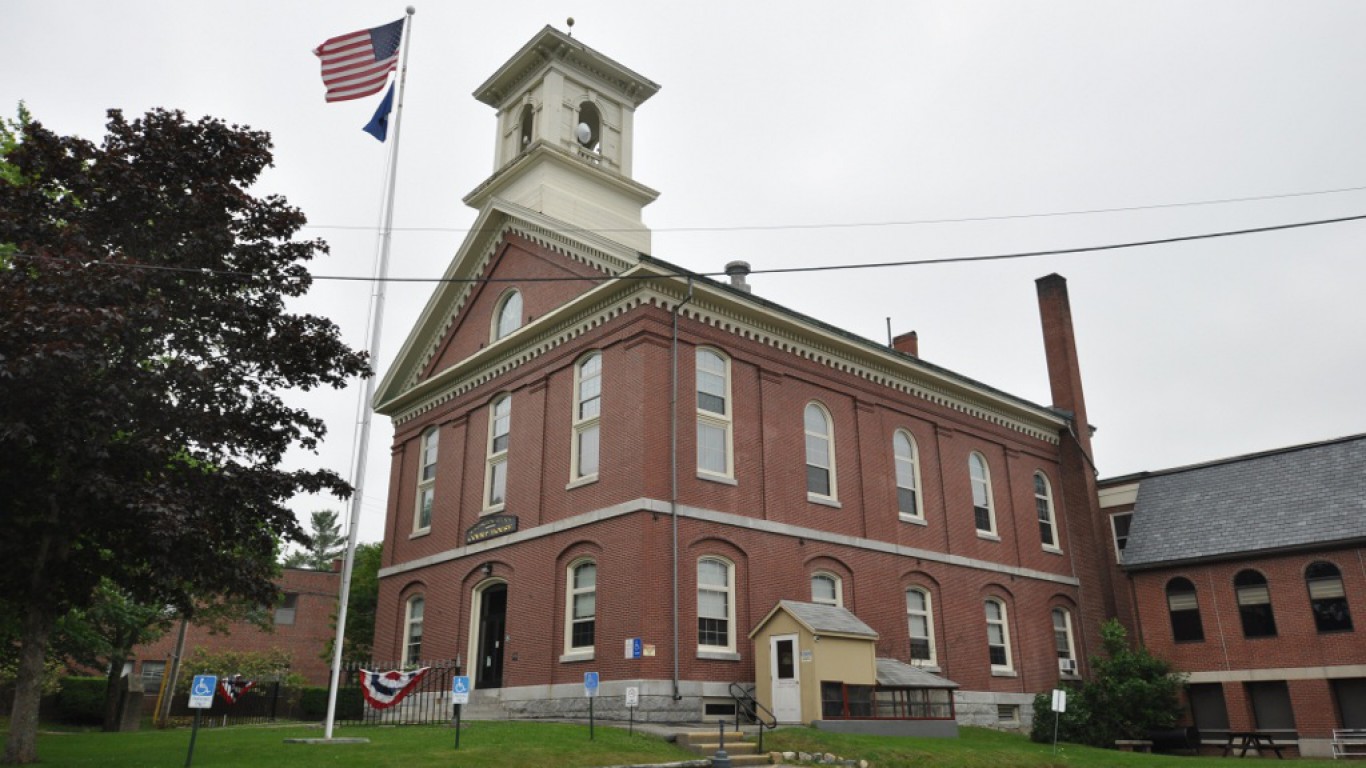
19. Washington County, Maine
> Annual drug deaths per 100,000 residents: 15.7 (county) 19.9 (state)
> Drug-related deaths, 2012-16: 26 (county) 1,057 (state)
> Poverty rate: 18.0%
> Population 31,925
[in-text-ad-2]

20. Baltimore city, Maryland
> Annual drug deaths per 100,000 residents: 30.1 (county) 22.6 (state)
> Drug-related deaths, 2012-16: 934 (county) 5,412 (state)
> Poverty rate: 23.1%
> Population 621,000

21. Bristol County, Massachusetts
> Annual drug deaths per 100,000 residents: 20.2 (county) 25.3 (state)
> Drug-related deaths, 2012-16: 554 (county) 6,832 (state)
> Poverty rate: 12.5%
> Population 554,868
[in-text-ad]

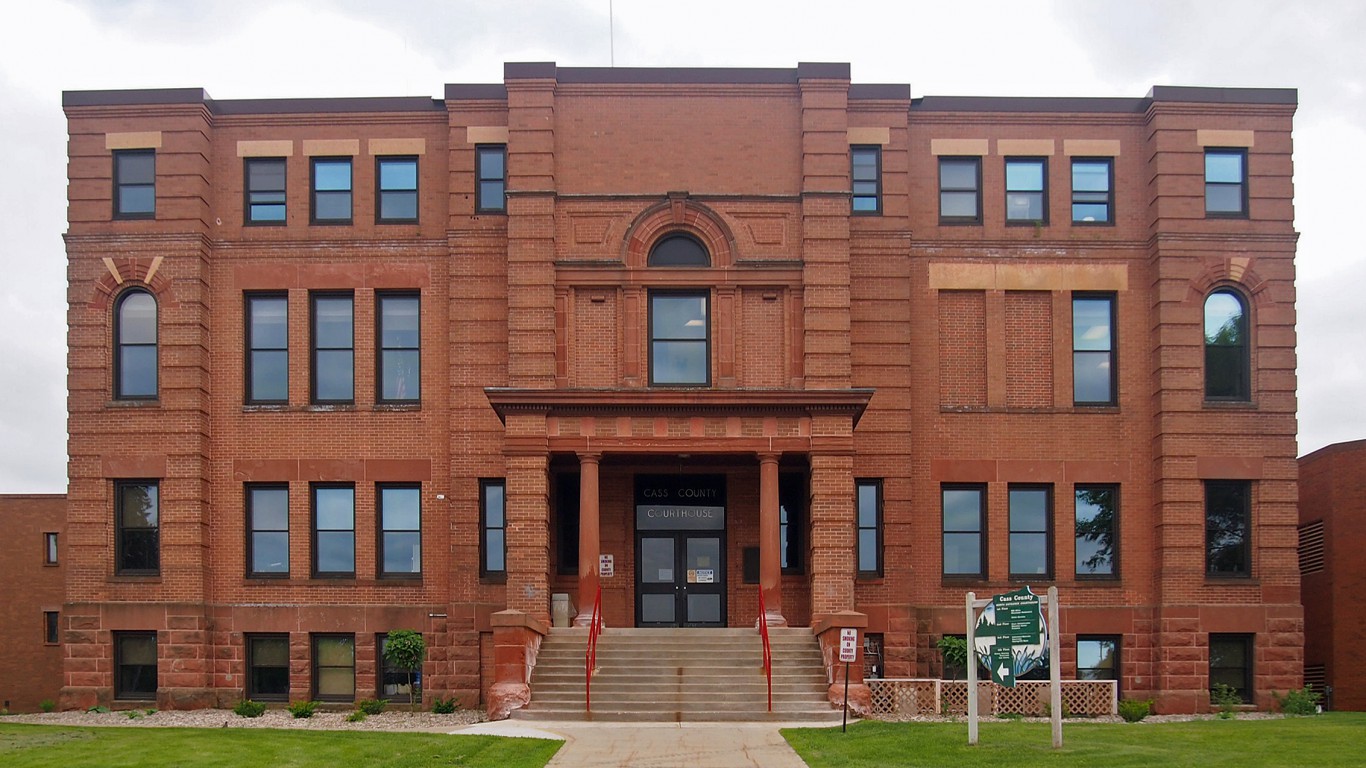
23. Cass County, Minnesota
> Annual drug deaths per 100,000 residents: 14.0 (county) 11.7 (state)
> Drug-related deaths, 2012-16: 20 (county) 2,568 (state)
> Poverty rate: 15.9%
> Population 28,633
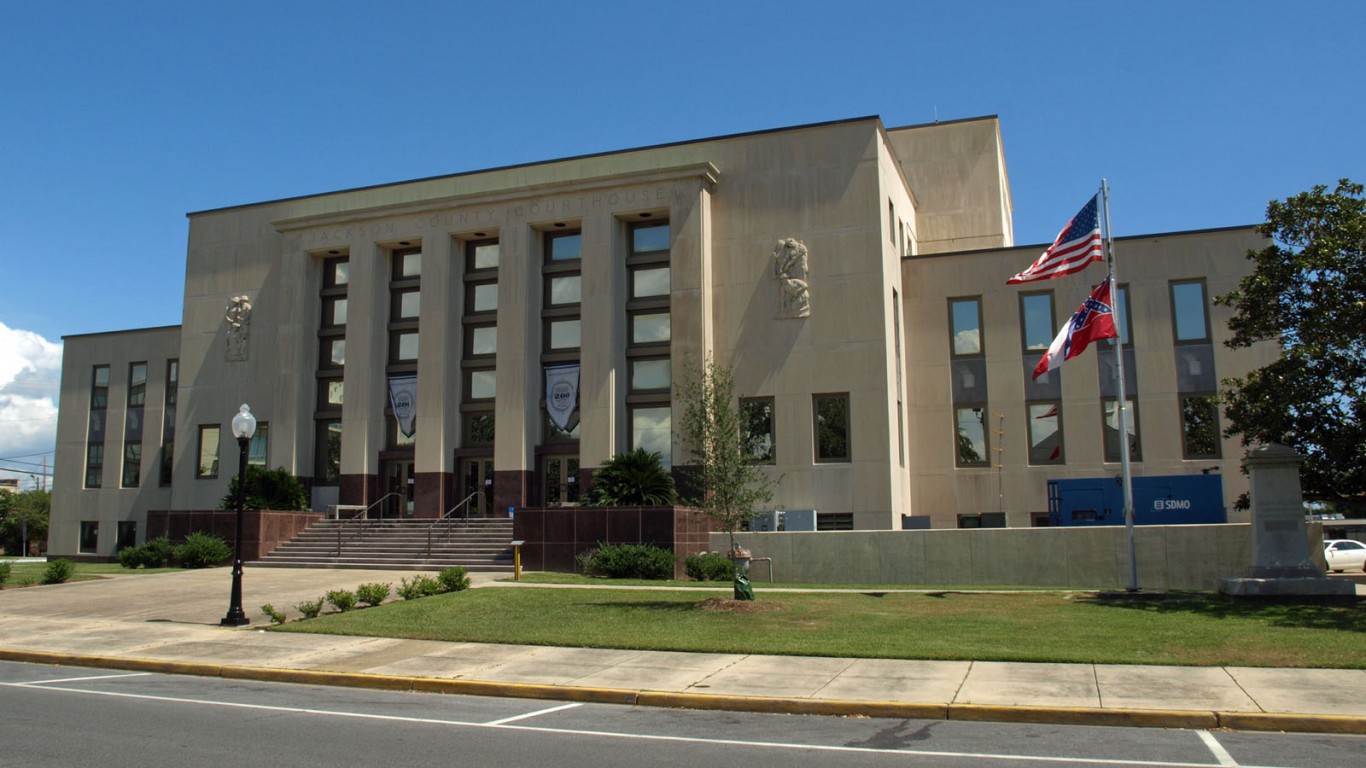
24. Jackson County, Mississippi
> Annual drug deaths per 100,000 residents: 27.3 (county) 12.0 (state)
> Drug-related deaths, 2012-16: 189 (county) 1,431 (state)
> Poverty rate: 15.6%
> Population 140,850
[in-text-ad-2]

25. Pemiscot County, Missouri
> Annual drug deaths per 100,000 residents: 38.0 (county) 19.2 (state)
> Drug-related deaths, 2012-16: 35 (county) 4,664 (state)
> Poverty rate: 29.1%
> Population 17,599

26. Hill County, Montana
> Annual drug deaths per 100,000 residents: 24.9 (county) 14.3 (state)
> Drug-related deaths, 2012-16: 20 (county) 589 (state)
> Poverty rate: 22.0%
> Population 16,529
[in-text-ad]

27. Scotts Bluff County, Nebraska
> Annual drug deaths per 100,000 residents: 12.0 (county) 7.4 (state)
> Drug-related deaths, 2012-16: 22 (county) 562 (state)
> Poverty rate: 13.5%
> Population 36,599

28. Nye County, Nevada
> Annual drug deaths per 100,000 residents: 31.8 (county) 21.7 (state)
> Drug-related deaths, 2012-16: 70 (county) 2,484 (state)
> Poverty rate: 17.2%
> Population 43,198

29. Belknap County, New Hampshire
> Annual drug deaths per 100,000 residents: 19.6 (county) 28.1 (state)
> Drug-related deaths, 2012-16: 59 (county) 1,493 (state)
> Poverty rate: 10.3%
> Population 60,392
[in-text-ad-2]
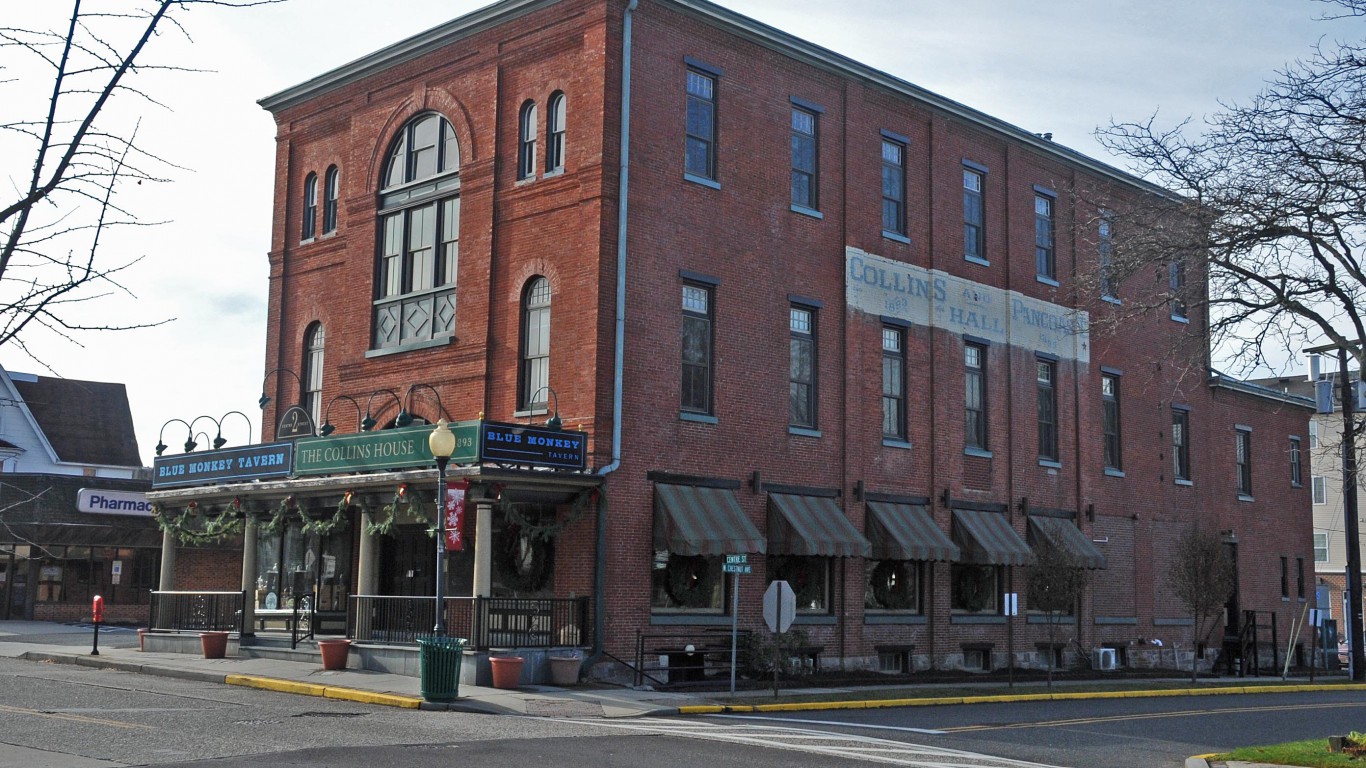
30. Camden County, New Jersey
> Annual drug deaths per 100,000 residents: 19.0 (county) 17.5 (state)
> Drug-related deaths, 2012-16: 489 (county) 6,272 (state)
> Poverty rate: 13.3%
> Population 511,145

31. Rio Arriba County, New Mexico
> Annual drug deaths per 100,000 residents: 60.2 (county) 24.8 (state)
> Drug-related deaths, 2012-16: 121 (county) 2,071 (state)
> Poverty rate: 23.4%
> Population 39,924
[in-text-ad]
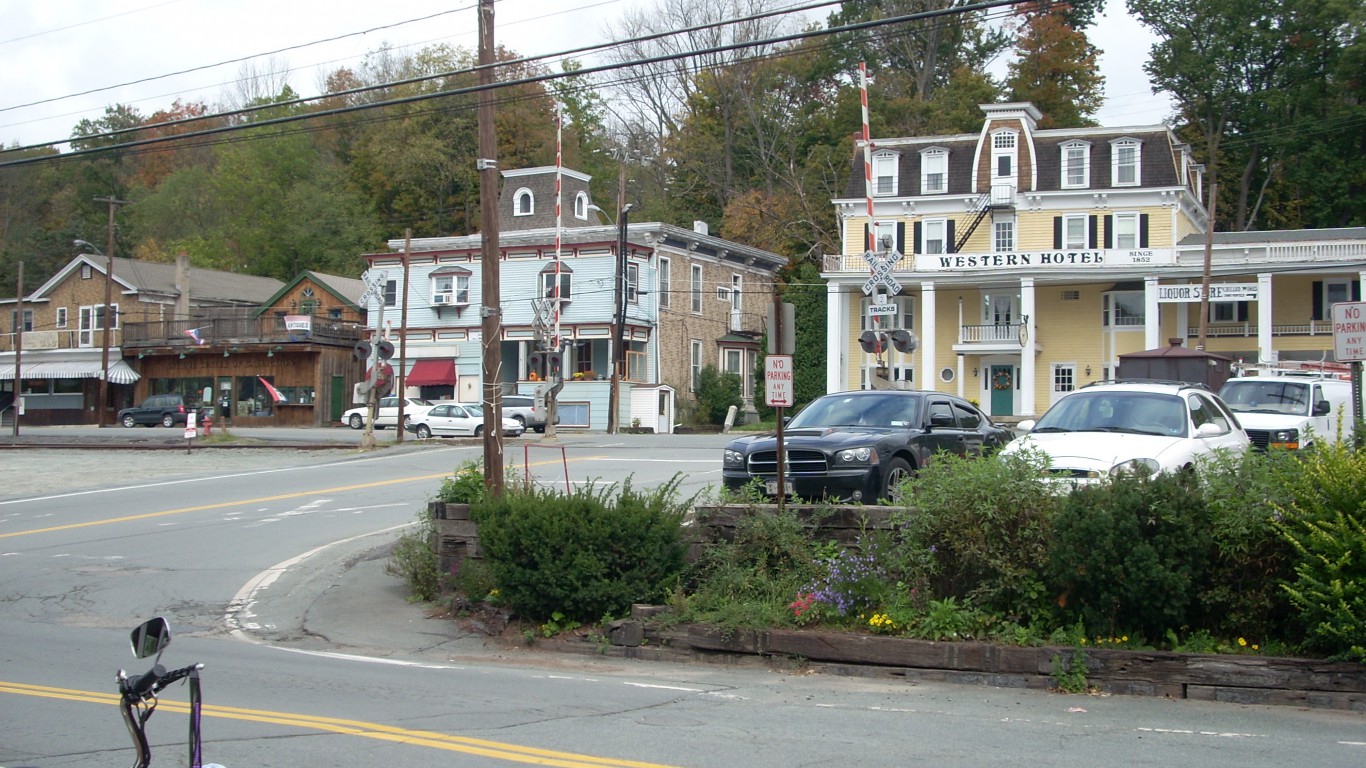
32. Sullivan County, New York
> Annual drug deaths per 100,000 residents: 19.9 (county) 15.1 (state)
> Drug-related deaths, 2012-16: 77 (county) 11,896 (state)
> Poverty rate: 17.1%
> Population 75,818
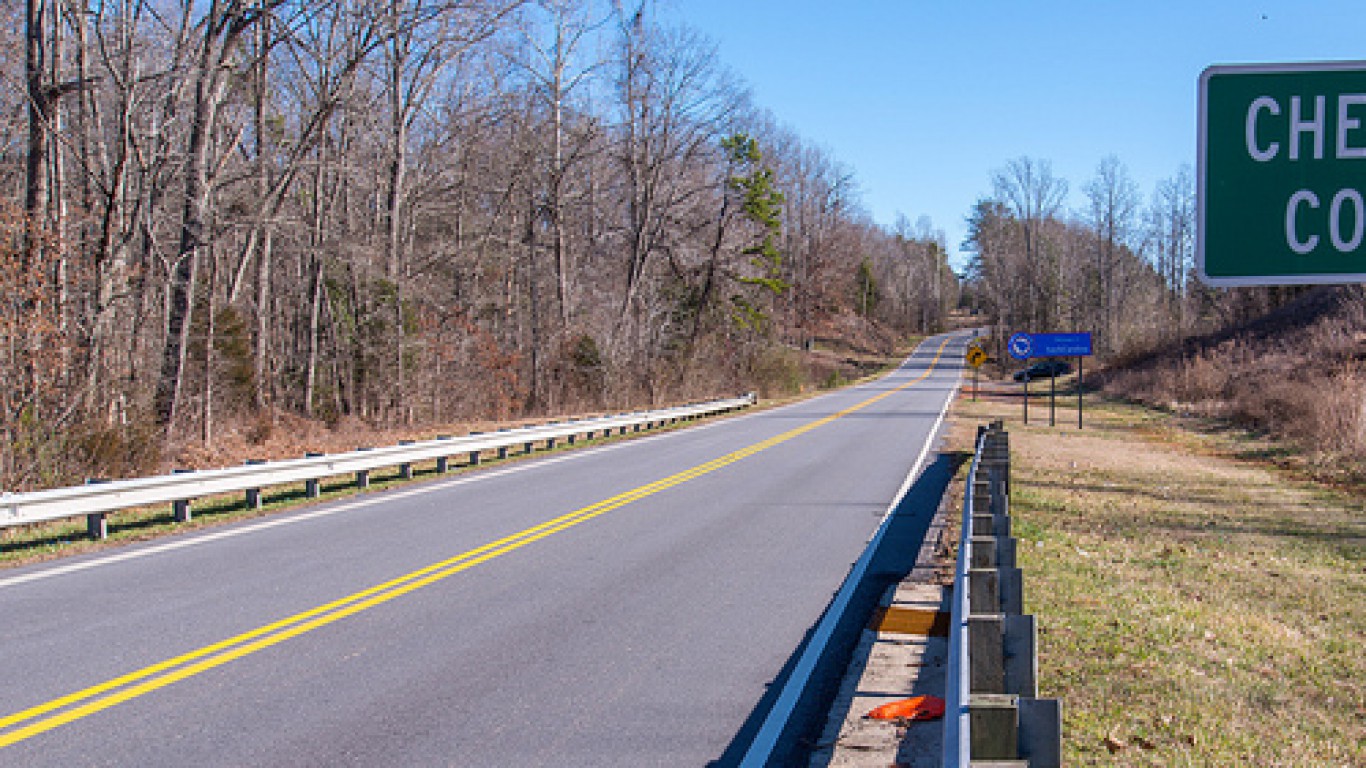
33. Cherokee County, North Carolina
> Annual drug deaths per 100,000 residents: 40.9 (county) 16.1 (state)
> Drug-related deaths, 2012-16: 56 (county) 6,419 (state)
> Poverty rate: 19.5%
> Population 27,226
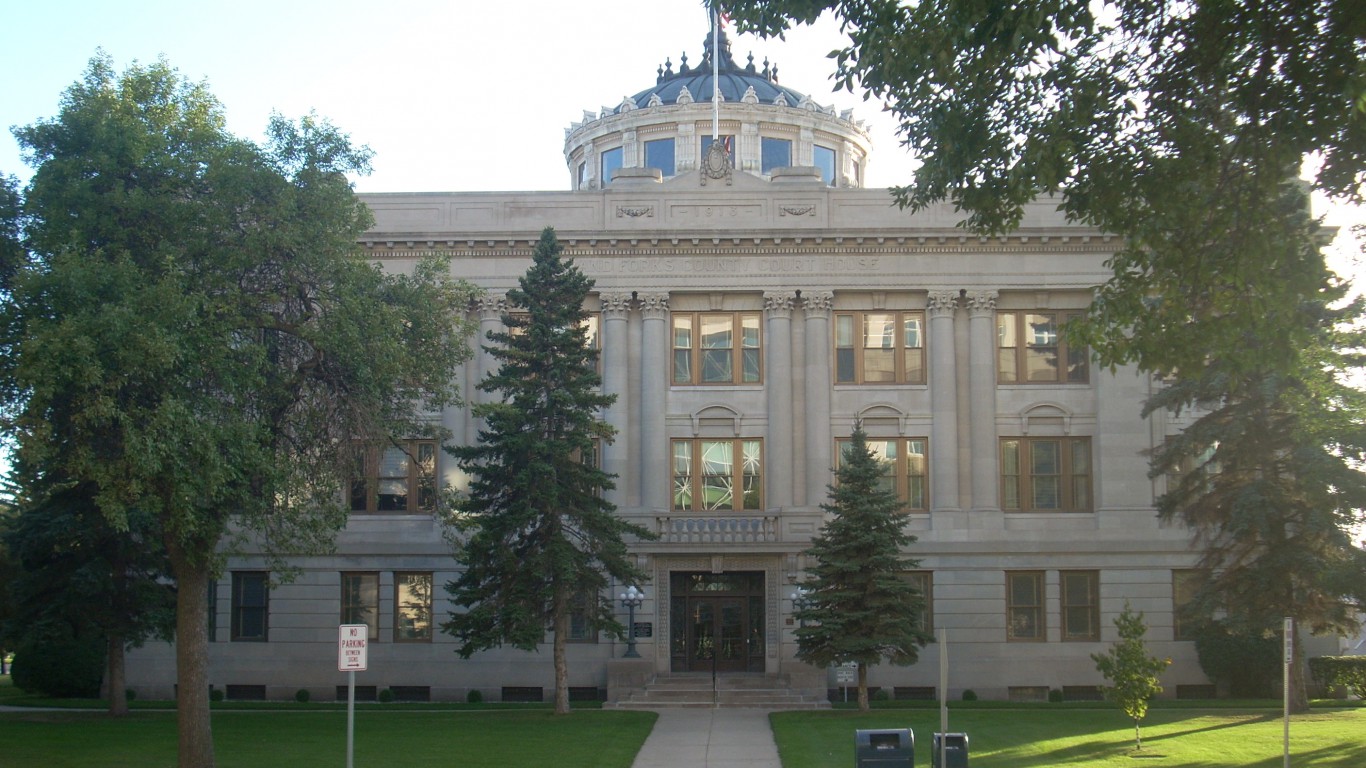
34. Grand Forks County, North Dakota
> Annual drug deaths per 100,000 residents: 6.6 (county) 7.6 (state)
> Drug-related deaths, 2012-16: 22 (county) 226 (state)
> Poverty rate: 17.7%
> Population 69,793
[in-text-ad-2]

35. Brown County, Ohio
> Annual drug deaths per 100,000 residents: 30.0 (county) 28.4 (state)
> Drug-related deaths, 2012-16: 67 (county) 13,177 (state)
> Poverty rate: 16.7%
> Population 44,059
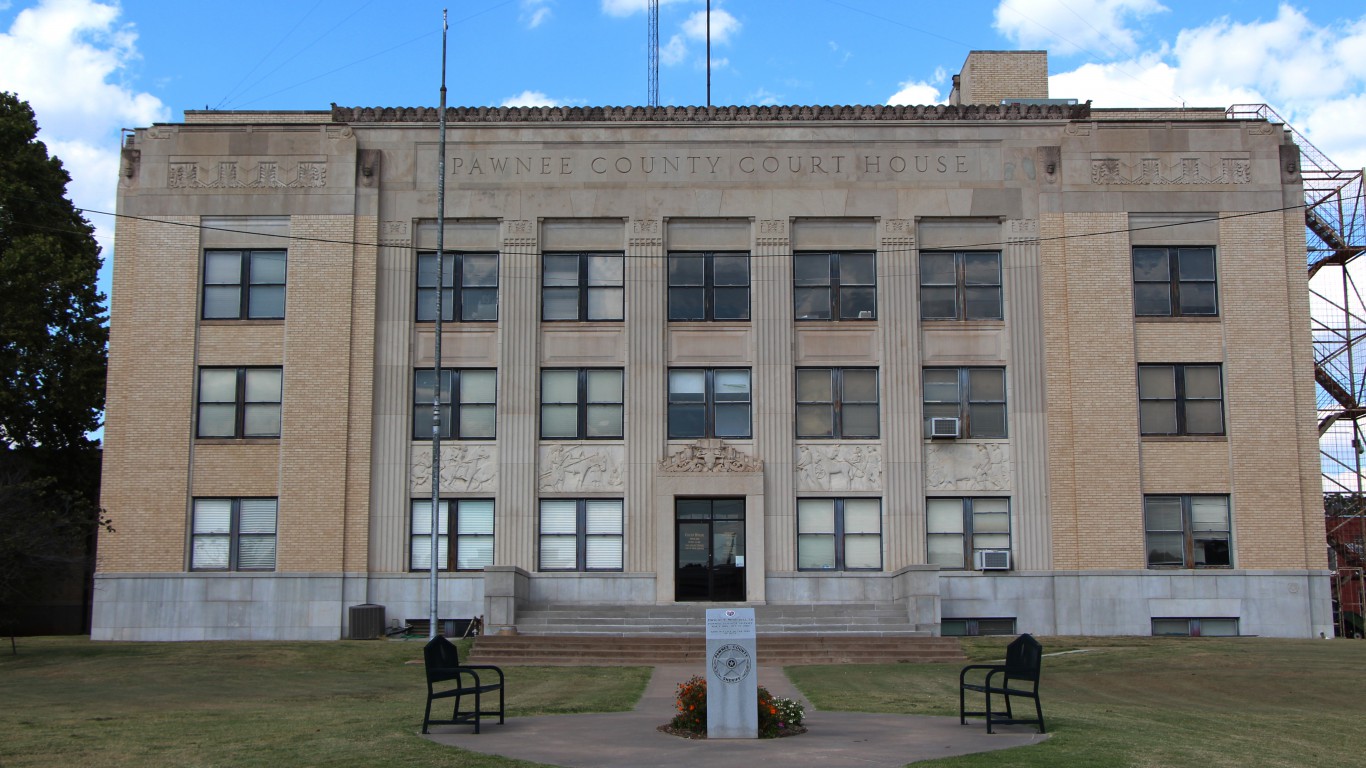
36. Pawnee County, Oklahoma
> Annual drug deaths per 100,000 residents: 36.2 (county) 20.6 (state)
> Drug-related deaths, 2012-16: 30 (county) 3,200 (state)
> Poverty rate: 14.6%
> Population 16,444
[in-text-ad]
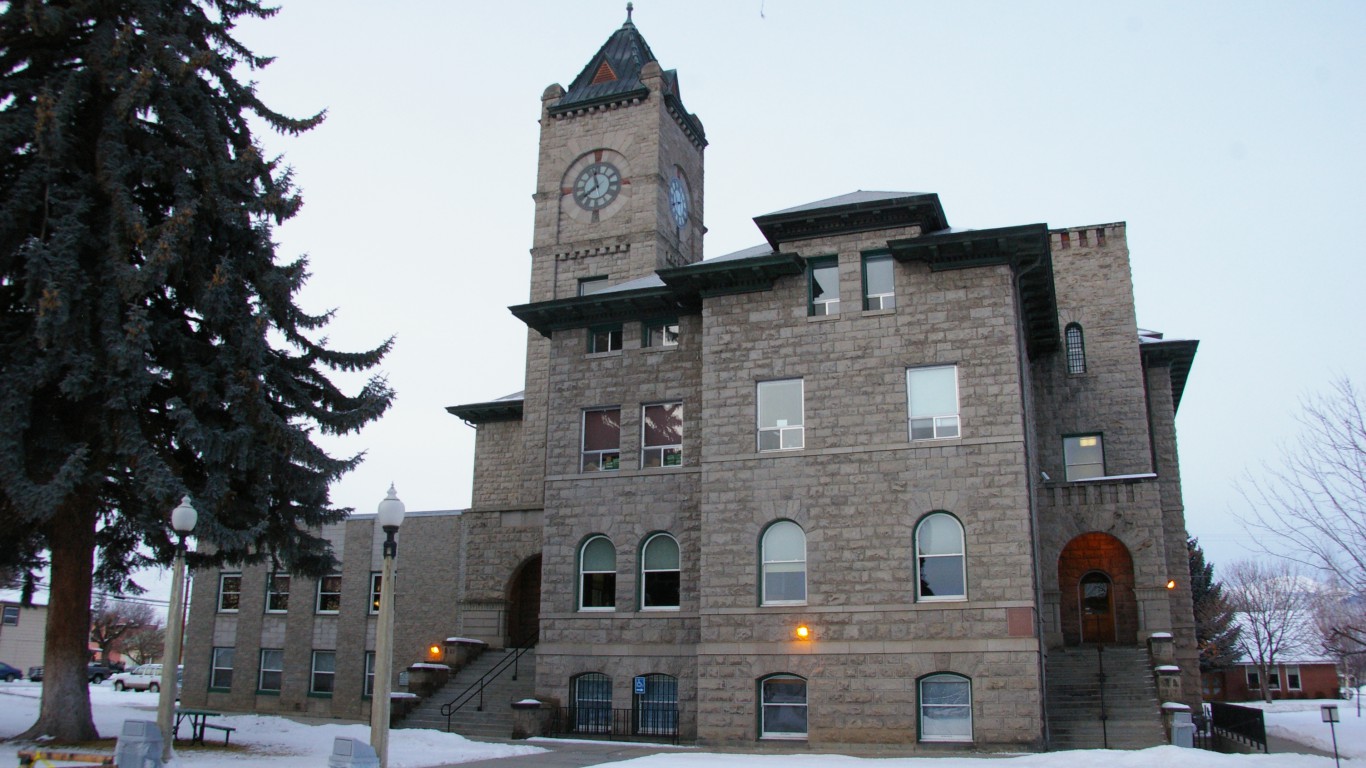
37. Baker County, Oregon
> Annual drug deaths per 100,000 residents: 24.8 (county) 15.1 (state)
> Drug-related deaths, 2012-16: 20 (county) 2,422 (state)
> Poverty rate: 15.1%
> Population 16,030

38. Philadelphia County, Pennsylvania
> Annual drug deaths per 100,000 residents: 25.2 (county) 26.4 (state)
> Drug-related deaths, 2012-16: 1,910 (county) 13,492 (state)
> Poverty rate: 25.9%
> Population 1,559,938

39. Kent County, Rhode Island
> Annual drug deaths per 100,000 residents: 18.5 (county) 27.3 (state)
> Drug-related deaths, 2012-16: 154 (county) 1,153 (state)
> Poverty rate: 8.2%
> Population 164,886
[in-text-ad-2]

40. Oconee County, South Carolina
> Annual drug deaths per 100,000 residents: 26.4 (county) 15.9 (state)
> Drug-related deaths, 2012-16: 97 (county) 3,094 (state)
> Poverty rate: 18.5%
> Population 75,375
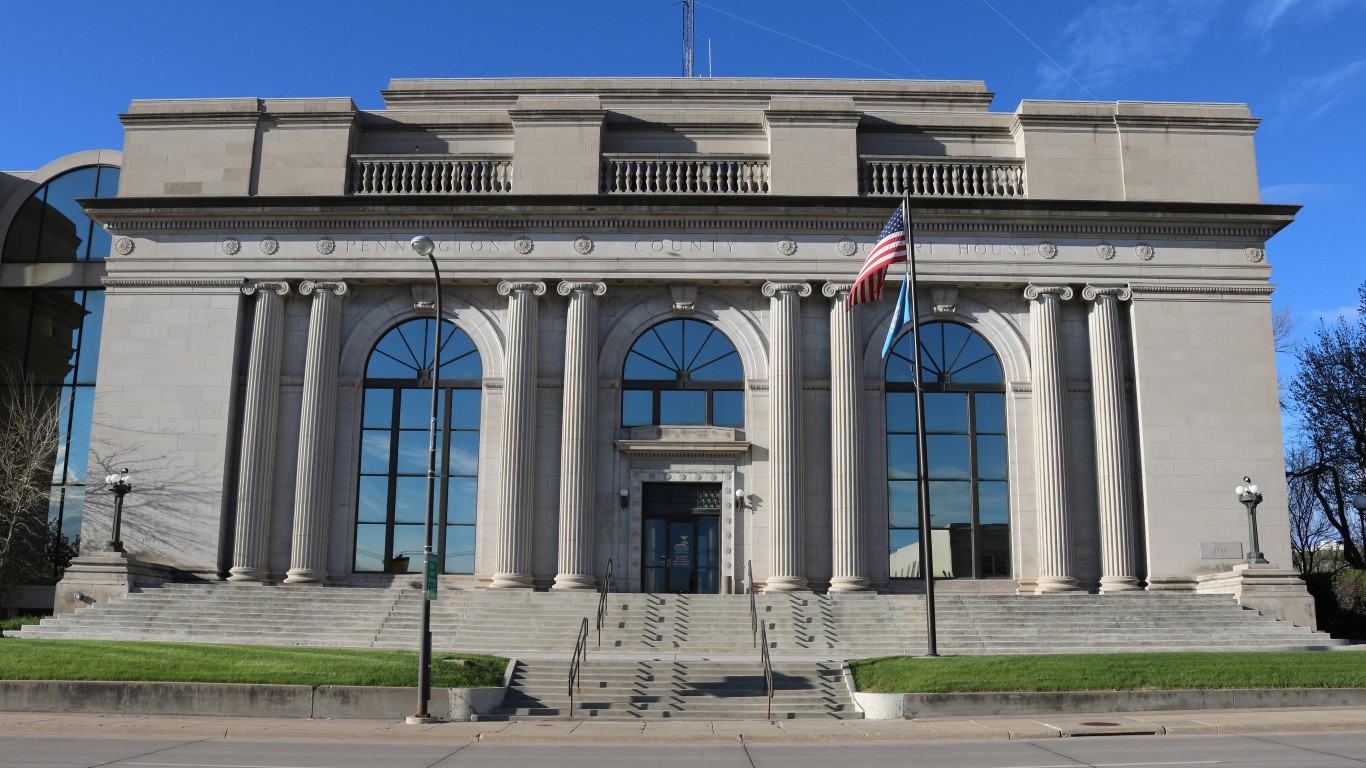
41. Pennington County, South Dakota
> Annual drug deaths per 100,000 residents: 10.9 (county) 8.0 (state)
> Drug-related deaths, 2012-16: 54 (county) 274 (state)
> Poverty rate: 13.8%
> Population 107,298
[in-text-ad]

42. Overton County, Tennessee
> Annual drug deaths per 100,000 residents: 37.4 (county) 22.4 (state)
> Drug-related deaths, 2012-16: 41 (county) 5,900 (state)
> Poverty rate: 20.0%
> Population 22,090
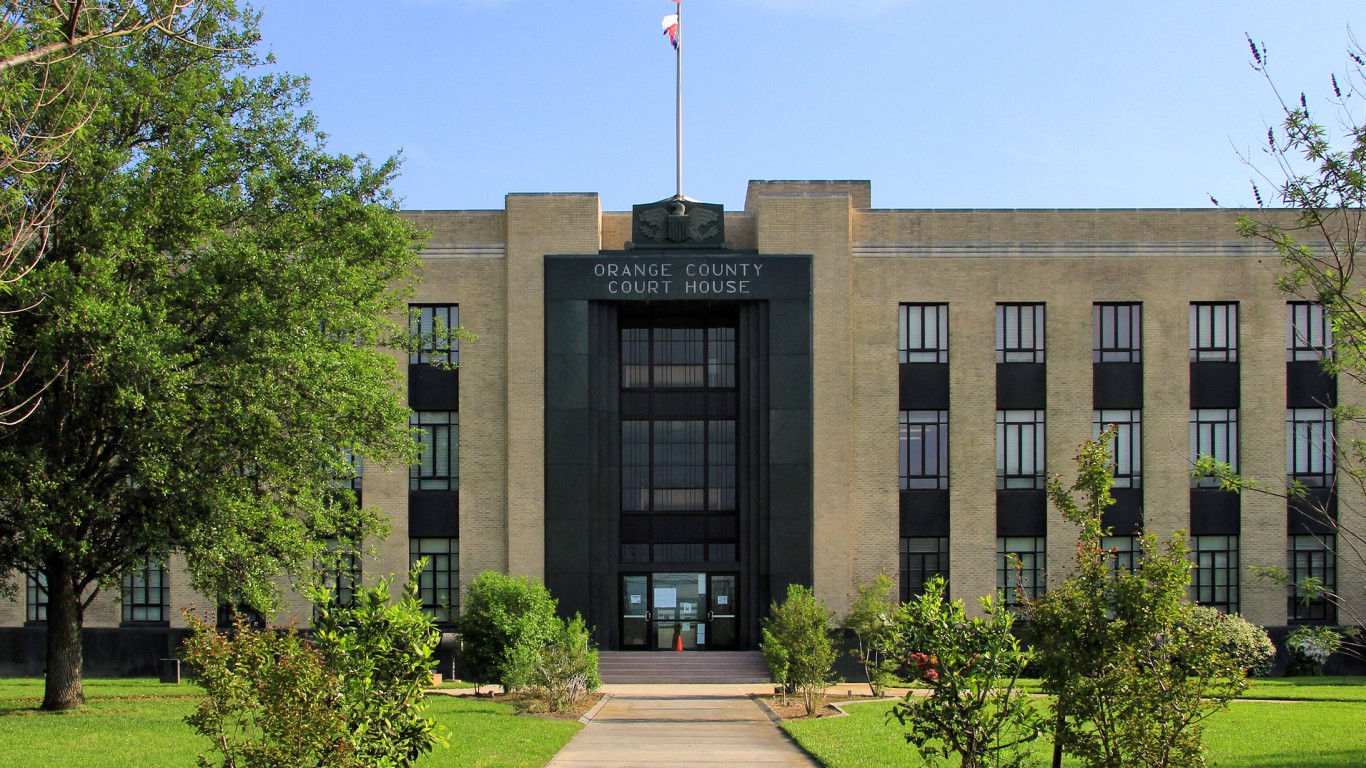
43. Orange County, Texas
> Annual drug deaths per 100,000 residents: 29.9 (county) 10.1 (state)
> Drug-related deaths, 2012-16: 123 (county) 11,030 (state)
> Poverty rate: 15.2%
> Population 83,751

44. Carbon County, Utah
> Annual drug deaths per 100,000 residents: 43.8 (county) 21.7 (state)
> Drug-related deaths, 2012-16: 46 (county) 2,581 (state)
> Poverty rate: 15.5%
> Population 20,733
[in-text-ad-2]

45. Windham County, Vermont
> Annual drug deaths per 100,000 residents: 17.1 (county) 17.2 (state)
> Drug-related deaths, 2012-16: 38 (county) 431 (state)
> Poverty rate: 14.0%
> Population 43,609
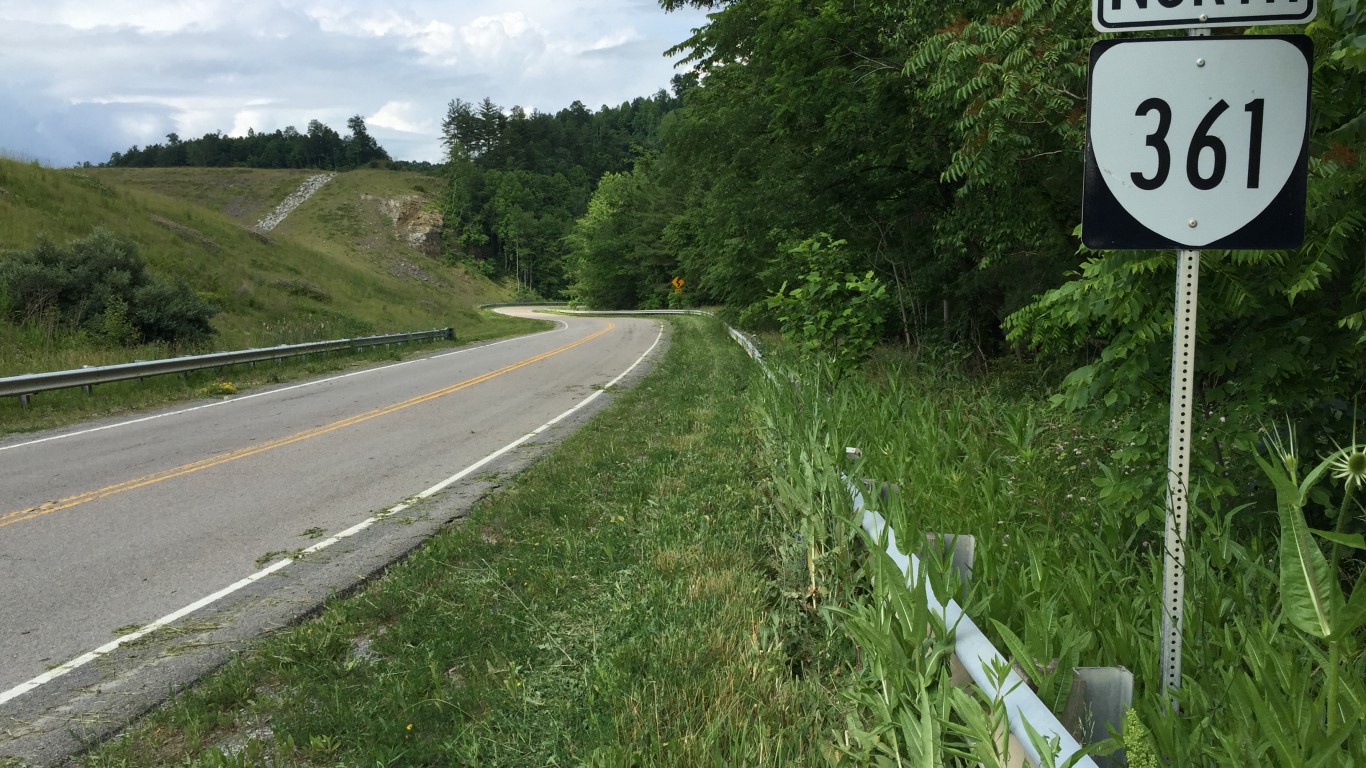
46. Dickenson County, Virginia
> Annual drug deaths per 100,000 residents: 51.5 (county) 13.2 (state)
> Drug-related deaths, 2012-16: 41 (county) 4,406 (state)
> Poverty rate: 21.5%
> Population 15,304
[in-text-ad]

47. Pacific County, Washington
> Annual drug deaths per 100,000 residents: 27.5 (county) 15.8 (state)
> Drug-related deaths, 2012-16: 29 (county) 4,501 (state)
> Poverty rate: 18.7%
> Population 20,743

48. McDowell County, West Virginia
> Annual drug deaths per 100,000 residents: 88.9 (county) 39.2 (state)
> Drug-related deaths, 2012-16: 99 (county) 2,891 (state)
> Poverty rate: 37.6%
> Population 20,273
[in-text-ad-2]
50. Uinta County, Wyoming
> Annual drug deaths per 100,000 residents: 22.1 (county) 17.7 (state)
> Drug-related deaths, 2012-16: 23 (county) 413 (state)
> Poverty rate: 16.8%
> Population 20,893
Detailed Findings & Methodology
The opioid epidemic has hit the poorest parts of the country the hardest. Drug addiction is often more common among the poorest Americans, who often lack the resources to seek substance abuse help and who live in communities that lack adequate funding for programs to fight the spread of drugs.
While nationwide 16.5 in every 100,000 Americans die each year from drug overdoses — mostly opioids — in some states the overdose mortality rate is more than double the national average. The three states with the highest overdose rates — West Virginia, Kentucky, and Ohio — all have poverty rates above the 15.1% national rate. These states also have some of the lowest median household incomes in the country.
Similarly, within each state, the county with the highest drug mortality rate is often among the poorest in the state. In 38 states, the county with the highest drug mortality rate has a higher poverty rate than the state as a whole. In 15 states, the county with the highest drug death rate also has one of the top three highest poverty rates in the state.
Unemployment is also highly correlated with drug overdose deaths. Of the 10 states with the highest drug-induced mortality rates, seven have unemployment rates greater than the 4.4% national rate. Similarly, eight of the 10 states with the lowest drug death rates have unemployment rates below the U.S. figure.
In 36 states, the county with the worst drug problem has a has a higher unemployment rate than than the comparable statewide rate. In 15 states, the county with the highest drug death rate also has one of the top three highest unemployment rates in the state.
To determine the counties with the worst drug problem in every state, 24/7 Wall St. reviewed the average number of drug-induced deaths per 100,000 residents each year for the period 2012 to 2016 with data from the Centers for Disease Control and Prevention’s WONDER web application. The cause of drug-induced deaths include unintentional overdoses, suicide, homicide, and undetermined causes. Data on poverty and population came from the U.S. Census Bureau’s American Community Survey and are five-year averages for the period 2012 to 2016. Annual average unemployment rates for 2017 came from the Bureau of Labor Statistics and were used to compare state and national geographies. Unemployment rates for 2016 were used to compare county and state geographies. All data is for the most recent period available.
The average American spends $17,274 on debit cards a year, and it’s a HUGE mistake. First, debit cards don’t have the same fraud protections as credit cards. Once your money is gone, it’s gone. But more importantly you can actually get something back from this spending every time you swipe.
Issuers are handing out wild bonuses right now. With some you can earn up to 5% back on every purchase. That’s like getting a 5% discount on everything you buy!
Our top pick is kind of hard to imagine. Not only does it pay up to 5% back, it also includes a $200 cash back reward in the first six months, a 0% intro APR, and…. $0 annual fee. It’s quite literally free money for any one that uses a card regularly. Click here to learn more!
Flywheel Publishing has partnered with CardRatings to provide coverage of credit card products. Flywheel Publishing and CardRatings may receive a commission from card issuers.
Thank you for reading! Have some feedback for us?
Contact the 24/7 Wall St. editorial team.