Special Report
25 Cities With the Highest (and Lowest) Paying Jobs

Published:
Last Updated:

For the vast majority of Americans, gainful employment is what makes a decent standard of living possible. While factors such as education, choice of vocation, luck, and personal attributes help determine an individual’s level of income, another major factor is simply the city where one lives.
Often, the same job can pay much more in one area of the country than in another. The average annual salary of a lawyer in San Jose, California, is $181,120. In Lake Charles, Louisiana, it is $50,370. To identify the cities with the highest (and lowest) paying jobs, 24/7 Wall St. reviewed annual wage statistics in U.S. metropolitan areas from the U.S. Labor Department.
Many of the highest paying cities are located in West Coast states like California and in East Coast states like Connecticut. But not all of the best paying cities are in coastal states. Metro areas Fairbanks, Alaska; Durham-Chapel Hill, North Carolina; and Minneapolis-St. Paul Bloomington, on the border of Minnesota and Wisconsin, are also among the best cities to find a high paying job.
On the other end of the spectrum, the two lowest-paying cities in the nation are in Texas, followed mostly by metro areas scattered across other Southern states. The median annual wage in all of these cities is less than $30,000. By contrast, the median annual wage in all of the top paying cities is well above $40,000.
Click here to see the cities with the highest paying jobs.
Click here to see the cities with the lowest paying jobs.
Click here to see our detailed findings and methodology.
Industrial composition invariably determines the distribution of jobs in a labor market, which in turn largely determines workers’ paychecks. One way to gauge a labor force is by comparing its composition to the nationwide workforce composition. The location quotient measures these differences. It is the ratio of the share of workers in a metro area employed in an occupation over the share of workers nationwide employed in that same occupation. A large location quotient does not necessarily mean the job is the most common, or even remotely common, in that area. Location quotients measure the relative concentration of occupations in a given metro area.
In 15 of the 25 cities with the highest paying jobs, the most heavily concentrated occupations relative to their national concentration — that is, the jobs with the highest location quotients — are in science or engineering. For example, in the 10th highest paying city Boulder, Colorado, workers are nearly 90 times more likely to be employed as atmospheric and space scientists than American workers are nationwide. In the remaining 10 metro areas, the leading occupation is either related to science, technology, engineering, or mathematics, or it is in a legal field.
Not only are these professions high paying compared to other jobs, but also these jobs tend to pay more in these cities compared to other cities. For example, in each of the nation’s three top paying metro, the median wage in the most highly concentrated occupation exceeds $100,000 annually. In all three cases, that typical paycheck is at least in line with or exceeds the national median wage for the occupation.
Compared to these tech and science hubs, jobs in the nation’s lowest paying cities are distributed very differently. The most heavily concentrated jobs in these areas vis-a-vis the national workforce tend to be lower-paying occupations such as personal care aides, miscellaneous food processing workers, rock splitters, and agricultural inspectors.
To identify the cities with the highest and lowest paying jobs, 24/7 Wall St. reviewed the annual median wage in 381 metropolitan statistical areas from the Occupational Employment Statistics program of the Bureau of Labor Statistics. Data is for May, 2017, the most recent period for which data is available. For larger metro areas, the BLS reports data metropolitan divisions, which are subsets of the broader metro area. For the purposes of our analysis, we aggregated metropolitan divisions to the corresponding metro area. The highly concentrated occupations listed are jobs with the largest location quotients. LQs are ratios measuring relative concentration of jobs in an area compared to their concentration in the national workforce. To calculate, the share of workers in a metro area employed in an occupation is divided by the share of workers nationwide employed in that same occupation. The Jan. 2018 unemployment rate for each metro area is the latest available seasonally adjusted rate and was also obtained from the BLS. Poverty rates came from came from the U.S. Census Bureau’s 2016 American Community Survey and are one year estimates.
Cities With the Highest Paying Jobs

25. San Diego-Carlsbad, CA
> Annual median wage: $41,920
> High concentrations of: Aerospace engineering and operations technicians (6.3 times more common than national distribution)
> Annual wage of aerospace engineering and operations technicians: $62,620
> Jan. 2018 unemployment rate: 3.5%
> Poverty rate: 12.3%
[in-text-ad]
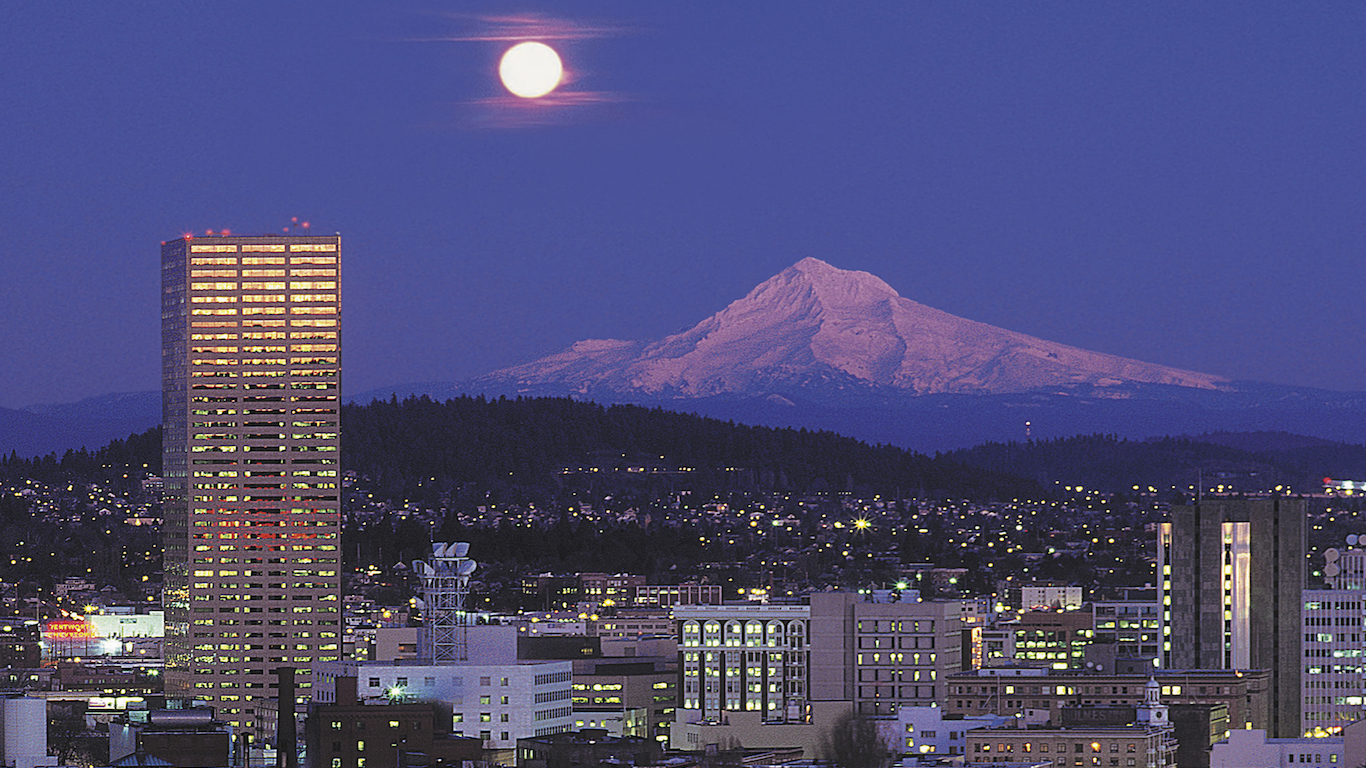
24. Portland-Vancouver-Hillsboro, OR-WA
> Annual median wage: $42,460
> High concentrations of: Semiconductor processors (16.9 times more common than national distribution)
> Annual wage of semiconductor processors: $35,960
> Jan. 2018 unemployment rate: 3.7%
> Poverty rate: 10.9%

23. Urban Honolulu, HI
> Annual median wage: $42,880
> High concentrations of: Airfield operations specialists (13.2 times more common than national distribution)
> Annual wage of airfield operations specialists: $22,870
> Jan. 2018 unemployment rate: 2.0%
> Poverty rate: 8.5%

22. Rochester, MN
> Annual median wage: $43,030
> High concentrations of: Nurse anesthetists (8.7 times more common than national distribution)
> Annual wage of nurse anesthetists: $192,150
> Jan. 2018 unemployment rate: 2.9%
> Poverty rate: 9.4%
[in-text-ad-2]

21. Olympia-Tumwater, WA
> Annual median wage: $43,140
> High concentrations of: Zoologists and wildlife biologists (20.6 times more common than national distribution)
> Annual wage of zoologists and wildlife biologists: $67,360
> Jan. 2018 unemployment rate: 5.0%
> Poverty rate: 10.5%

20. New Haven, CT
> Annual median wage: $43,550
> High concentrations of: Environmental science teachers, postsecondary (5.2 times more common than national distribution)
> Annual wage of environmental science teachers, postsecondary: $74,490
> Jan. 2018 unemployment rate: 4.7%
> Poverty rate: 11.2%
[in-text-ad]

19. Baltimore-Columbia-Towson, MD
> Annual median wage: $43,600
> High concentrations of: Shampooers (5.3 times more common than national distribution)
> Annual wage of shampooers: $19,740
> Jan. 2018 unemployment rate: 4.4%
> Poverty rate: 10.4%

18. Denver-Aurora-Lakewood, CO
> Annual median wage: $43,790
> High concentrations of: Mining and geological engineers, including mining safety engineers (6.6 times more common than national distribution)
> Annual wage of mining and geological engineers, including mining safety engineers: $98,700
> Jan. 2018 unemployment rate: 2.9%
> Poverty rate: 9.4%

17. Minneapolis-St. Paul-Bloomington, MN-WI
> Annual median wage: $44,220
> High concentrations of: Radio operators (10.5 times more common than national distribution)
> Annual wage of radio operators: $52,700
> Jan. 2018 unemployment rate: 2.9%
> Poverty rate: 8.8%
[in-text-ad-2]

16. Durham-Chapel Hill, NC
> Annual median wage: $44,660
> High concentrations of: Sociologists (24.1 times more common than national distribution)
> Annual wage of sociologists: $85,810
> Jan. 2018 unemployment rate: 3.8%
> Poverty rate: 14.9%

15. Ithaca, NY
> Annual median wage: $44,730
> High concentrations of: Animal scientists (133.8 times more common than national distribution)
> Annual wage of animal scientists: $59,550
> Jan. 2018 unemployment rate: 4.2%
> Poverty rate: 20.2%
[in-text-ad]

14. Bremerton-Silverdale, WA
> Annual median wage: $45,360
> High concentrations of: Layout workers, metal and plastic (90.4 times more common than national distribution)
> Annual wage of layout workers, metal and plastic: $52,620
> Jan. 2018 unemployment rate: 5.0%
> Poverty rate: 10.0%

13. New York-Newark-Jersey City, NY-NJ-PA
> Annual median wage: $45,970
> High concentrations of: Fashion designers (5.5 times more common than national distribution)
> Annual wage of fashion designers: $76,730
> Jan. 2018 unemployment rate: 4.3%
> Poverty rate: 13.5%

12. Anchorage, AK
> Annual median wage: $47,340
> High concentrations of: Misc. transportation workers (18.2 times more common than national distribution)
> Annual wage of misc. transportation workers: $36,390
> Jan. 2018 unemployment rate: 6.7%
> Poverty rate: 7.2%
[in-text-ad-2]

11. Hartford-West Hartford-East Hartford, CT
> Annual median wage: $48,050
> High concentrations of: Actuaries (6.3 times more common than national distribution)
> Annual wage of actuaries: $102,930
> Jan. 2018 unemployment rate: 4.7%
> Poverty rate: 10.1%
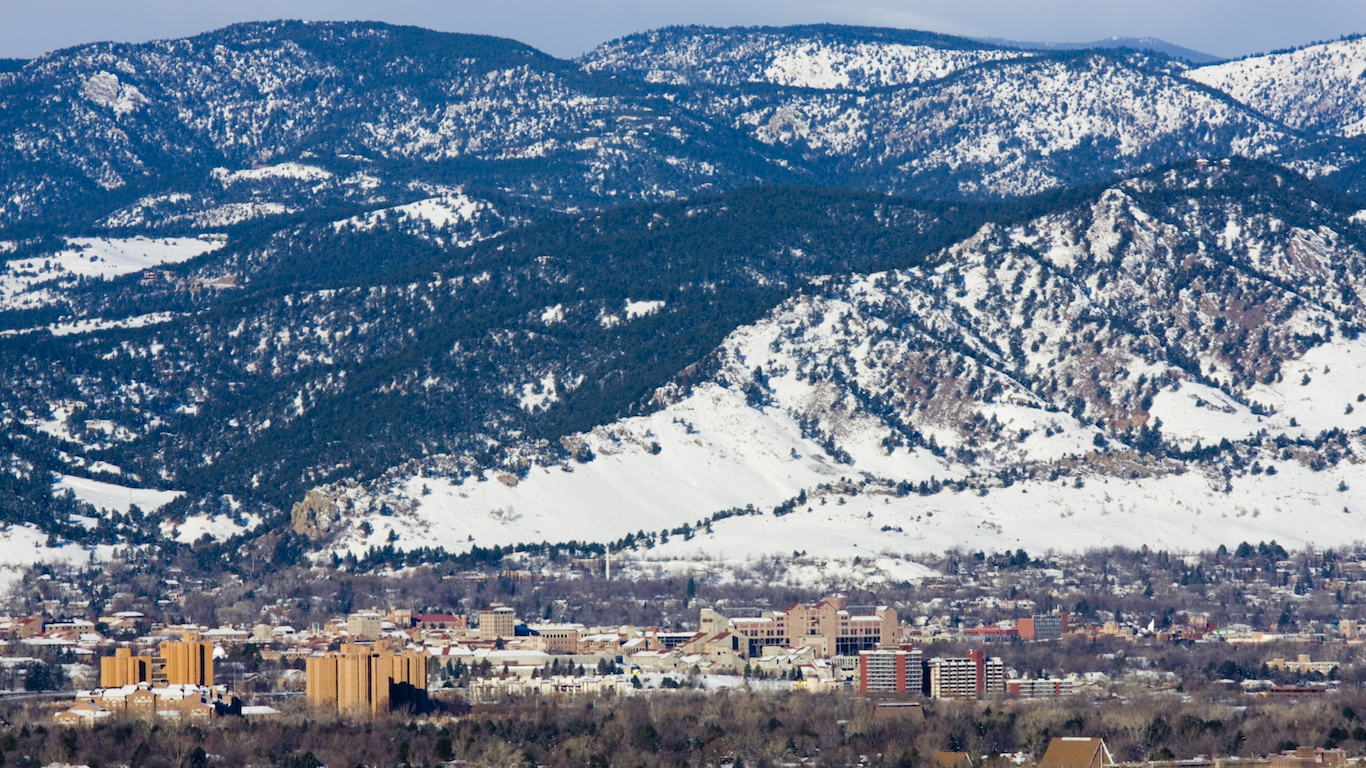
10. Boulder, CO
> Annual median wage: $48,050
> High concentrations of: Physicists (39.2 times more common than national distribution)
> Annual wage of physicists: $96,580
> Jan. 2018 unemployment rate: 2.6%
> Poverty rate: 11.0%
[in-text-ad]

9. Fairbanks, AK
> Annual median wage: $48,150
> High concentrations of: Mining and geological engineers, including mining safety engineers (19.0 times more common than national distribution)
> Annual wage of mining and geological engineers, including mining safety engineers: $137,690
> Jan. 2018 unemployment rate: 6.5%
> Poverty rate: 9.9%

8. Seattle-Tacoma-Bellevue, WA
> Annual median wage: $49,110
> High concentrations of: Ship engineers (5.3 times more common than national distribution)
> Annual wage of ship engineers: $90,420
> Jan. 2018 unemployment rate: 4.5%
> Poverty rate: 9.6%

7. Bridgeport-Stamford-Norwalk, CT
> Annual median wage: $49,630
> High concentrations of: Survey researchers (5.8 times more common than national distribution)
> Annual wage of survey researchers: $48,960
> Jan. 2018 unemployment rate: 4.6%
> Poverty rate: 8.6%
[in-text-ad-2]

6. Boston-Cambridge-Nashua, MA-NH
> Annual median wage: $50,550
> High concentrations of: Biochemists and biophysicists (7.2 times more common than national distribution)
> Annual wage of biochemists and biophysicists: $108,870
> Jan. 2018 unemployment rate: 3.1%
> Poverty rate: 9.6%

5. Trenton, NJ
> Annual median wage: $51,440
> High concentrations of: Chemists (8.4 times more common than national distribution)
> Annual wage of chemists: $94,250
> Jan. 2018 unemployment rate: 3.9%
> Poverty rate: 11.1%
[in-text-ad]

4. San Francisco-Oakland-Hayward, CA
> Annual median wage: $52,210
> High concentrations of: Multimedia artists and animators (5.5 times more common than national distribution)
> Annual wage of multimedia artists and animators: $88,020
> Jan. 2018 unemployment rate: 2.8%
> Poverty rate: 9.2%

3. Washington-Arlington-Alexandria, DC-VA-MD-WV
> Annual median wage: $53,430
> High concentrations of: Political scientists (32.8 times more common than national distribution)
> Annual wage of political scientists: $123,230
> Jan. 2018 unemployment rate: 3.6%
> Poverty rate: 8.4%
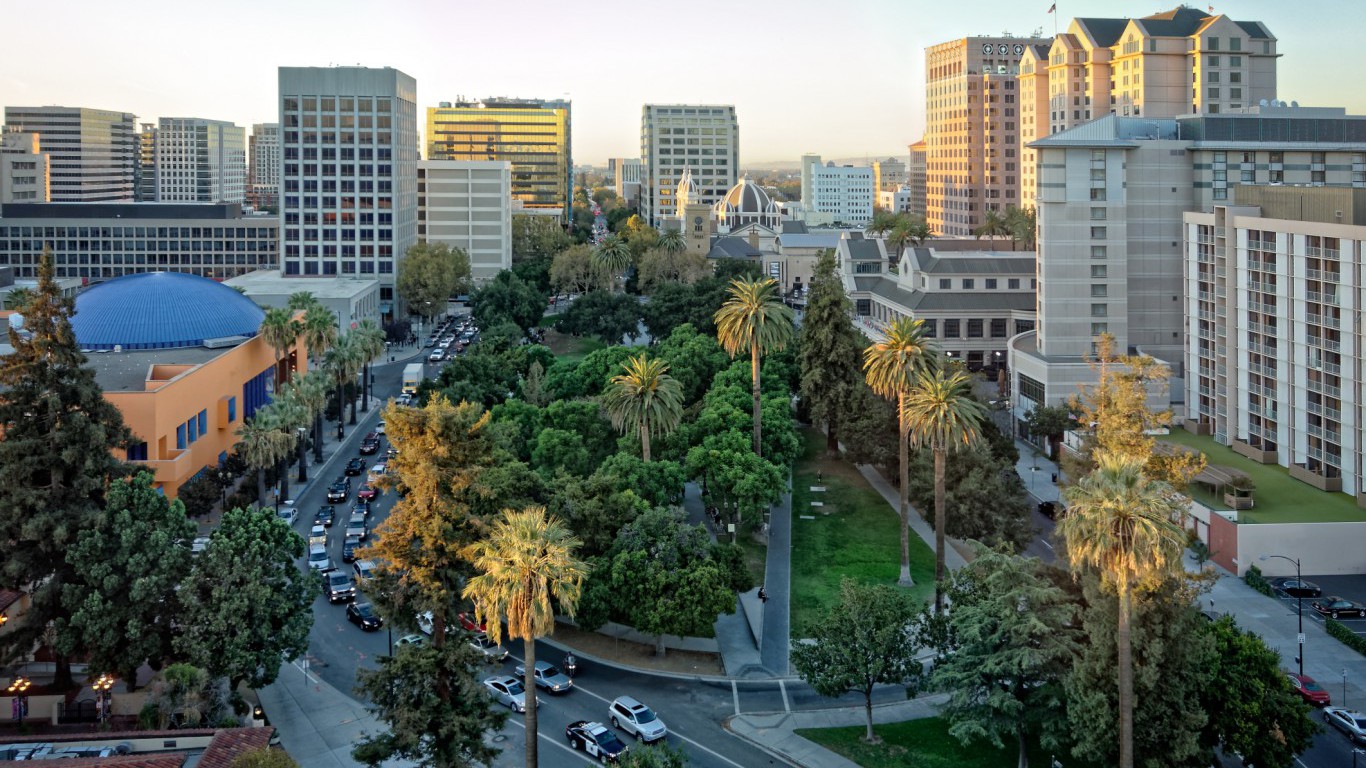
2. San Jose-Sunnyvale-Santa Clara, CA
> Annual median wage: $57,540
> High concentrations of: Computer hardware engineers (19.2 times more common than national distribution)
> Annual wage of computer hardware engineers: $145,510
> Jan. 2018 unemployment rate: 2.9%
> Poverty rate: 9.4%
[in-text-ad-2]

1. California-Lexington Park, MD
> Annual median wage: $62,820
> High concentrations of: Aerospace engineers (49.1 times more common than national distribution)
> Annual wage of aerospace engineers: $110,050
> Jan. 2018 unemployment rate: 4.3%
> Poverty rate: 10.0%
Cities With the Lowest Paying Jobs
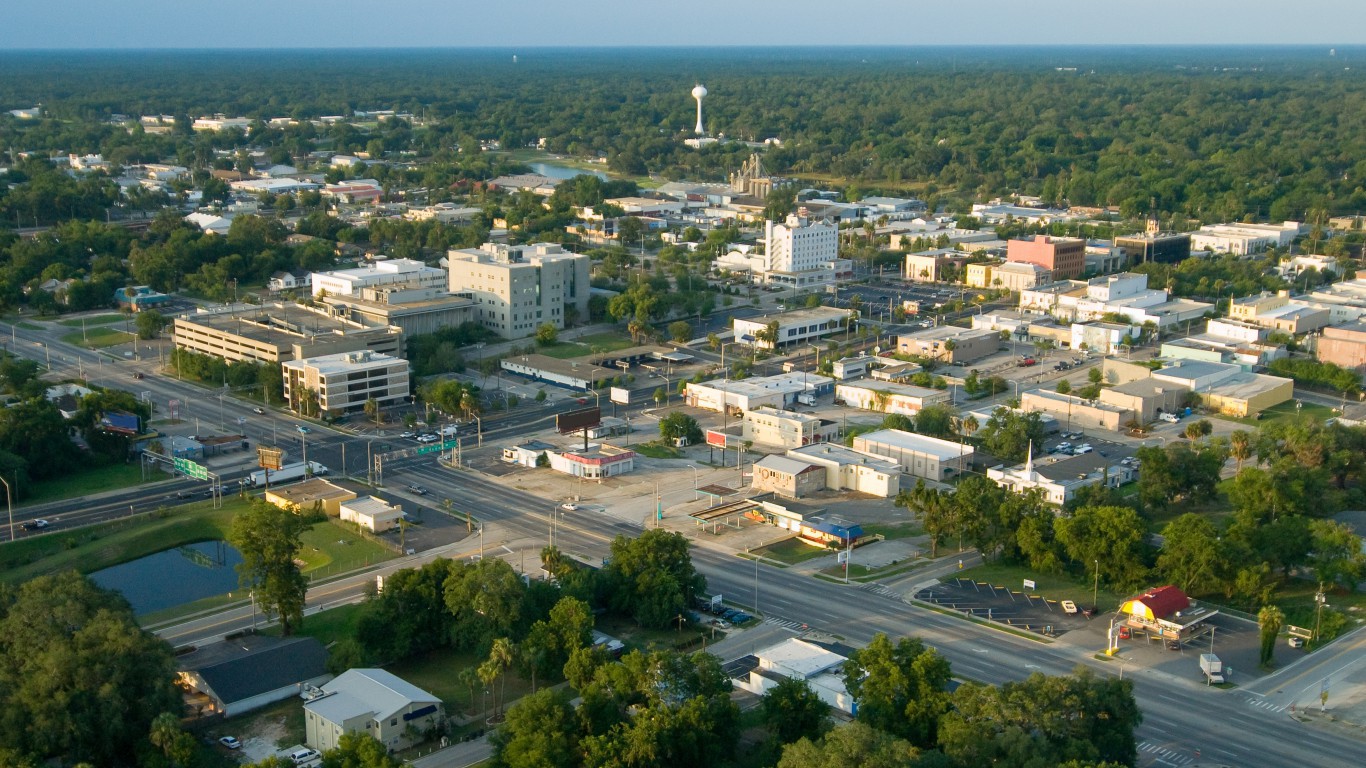
25. Ocala, FL
> Annual median wage: $29,770
> High concentrations of: Farmworkers, farm, ranch, and aquacultural animals (16.8 times more common than national distribution)
> Annual wage of farmworkers, farm, ranch, and aquacultural animals: $23,670
> Jan. 2018 unemployment rate: 4.6%
> Poverty rate: 17.6%
[in-text-ad]
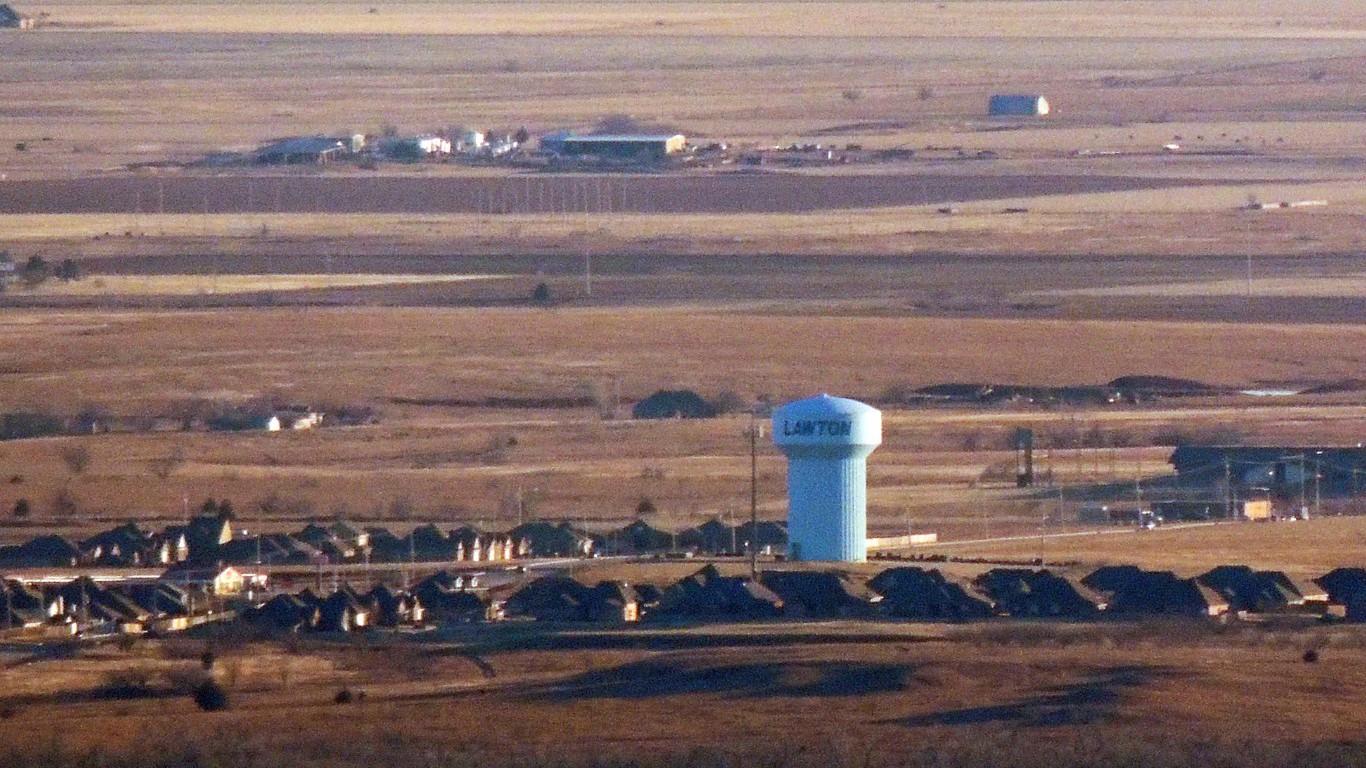
24. Lawton, OK
> Annual median wage: $29,760
> High concentrations of: Gaming surveillance officers and gaming investigators (25.7 times more common than national distribution)
> Annual wage of gaming surveillance officers and gaming investigators: $27,670
> Jan. 2018 unemployment rate: 4.3%
> Poverty rate: 14.8%

23. Parkersburg-Vienna, WV
> Annual median wage: $29,750
> High concentrations of: Gaming change persons and booth cashiers (19.1 times more common than national distribution)
> Annual wage of gaming change persons and booth cashiers: $19,200
> Jan. 2018 unemployment rate: 5.6%
> Poverty rate: 18.1%
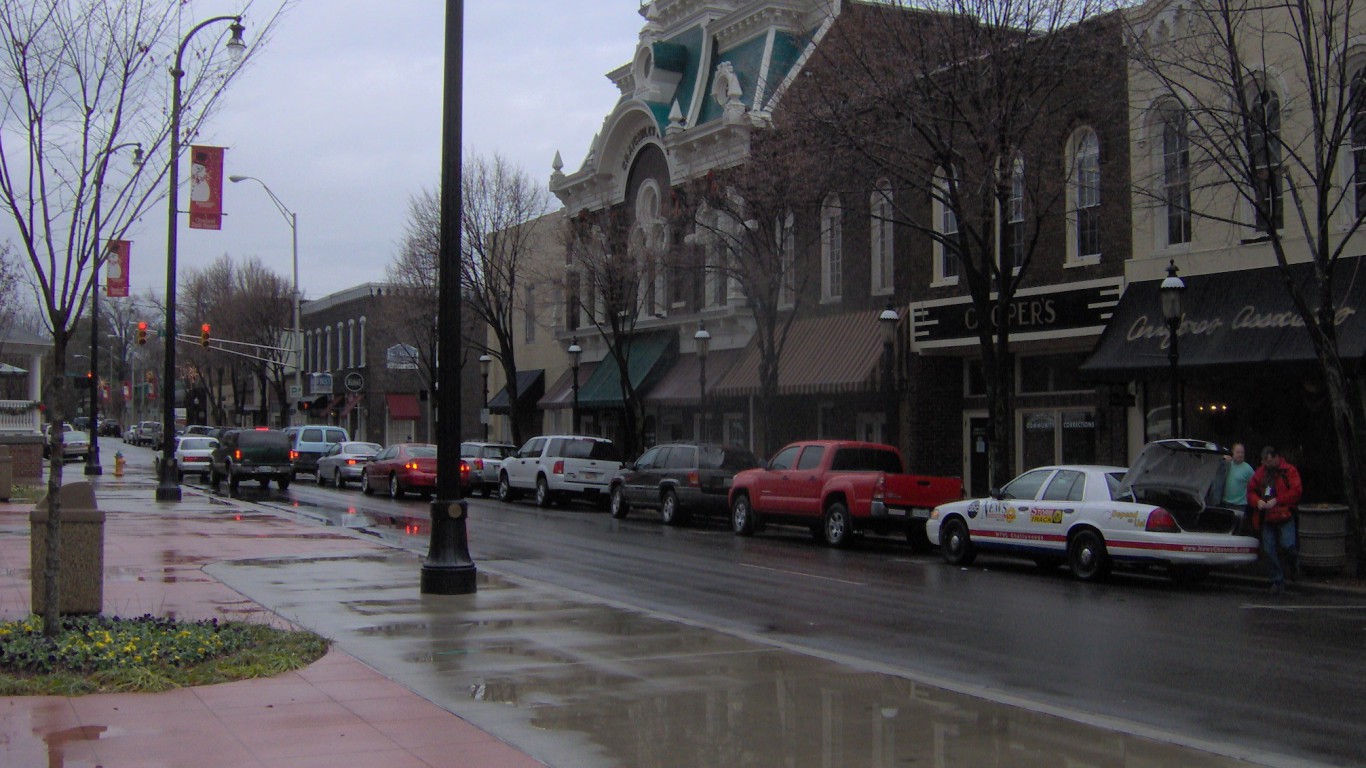
22. Cleveland, TN
> Annual median wage: $29,730
> High concentrations of: Photographic process workers and processing machine operators (12.5 times more common than national distribution)
> Annual wage of photographic process workers and processing machine operators: $22,970
> Jan. 2018 unemployment rate: 3.3%
> Poverty rate: 13.0%
[in-text-ad-2]

21. Sumter, SC
> Annual median wage: $29,570
> High concentrations of: Multiple machine tool setters, operators, and tenders, metal and plastic (11.8 times more common than national distribution)
> Annual wage of multiple machine tool setters, operators, and tenders, metal and plastic: $46,080
> Jan. 2018 unemployment rate: 5.5%
> Poverty rate: 21.2%

20. Deltona-Daytona Beach-Ormond Beach, FL
> Annual median wage: $29,560
> High concentrations of: Fiberglass laminators and fabricators (7.0 times more common than national distribution)
> Annual wage of fiberglass laminators and fabricators: $33,680
> Jan. 2018 unemployment rate: 4.0%
> Poverty rate: 13.5%
[in-text-ad]
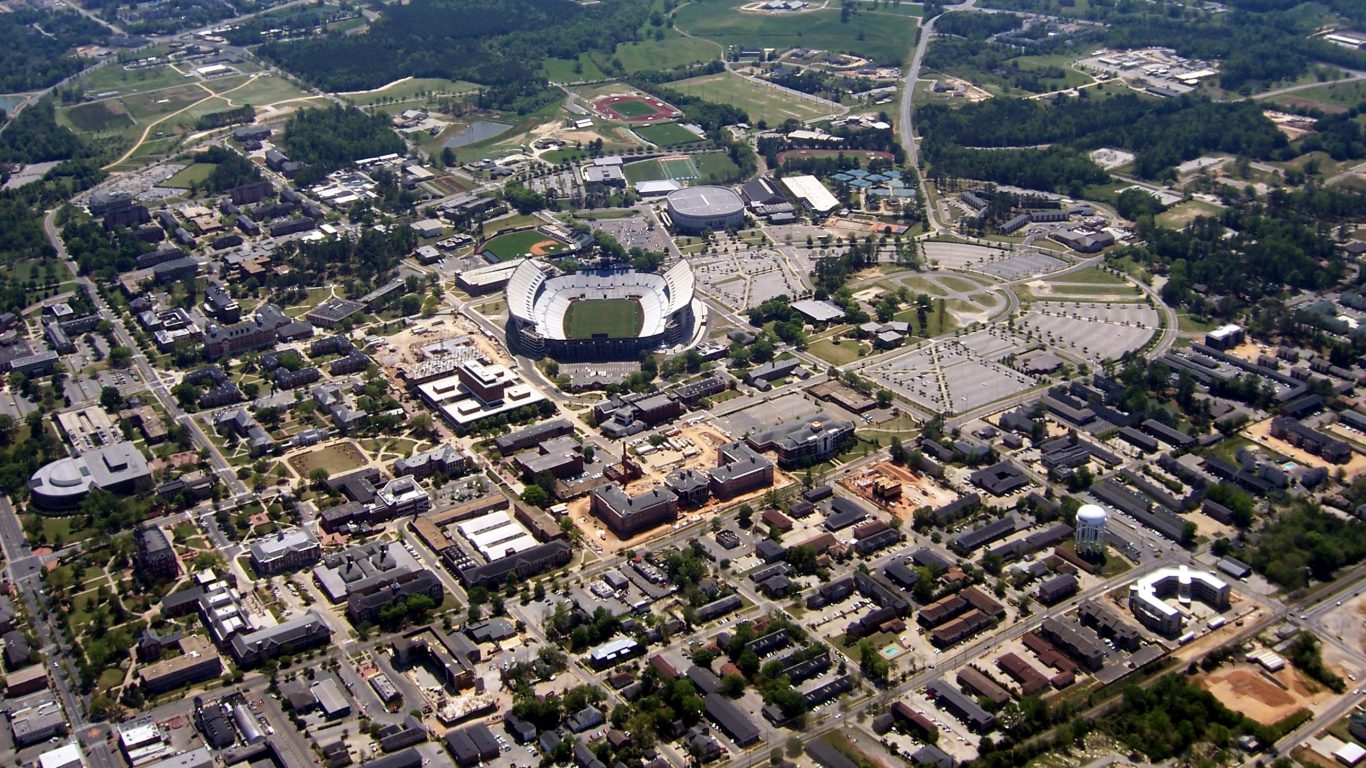
19. Auburn-Opelika, AL
> Annual median wage: $29,400
> High concentrations of: Education administrators, postsecondary (7.3 times more common than national distribution)
> Annual wage of education administrators, postsecondary: $103,480
> Jan. 2018 unemployment rate: 3.3%
> Poverty rate: 19.1%
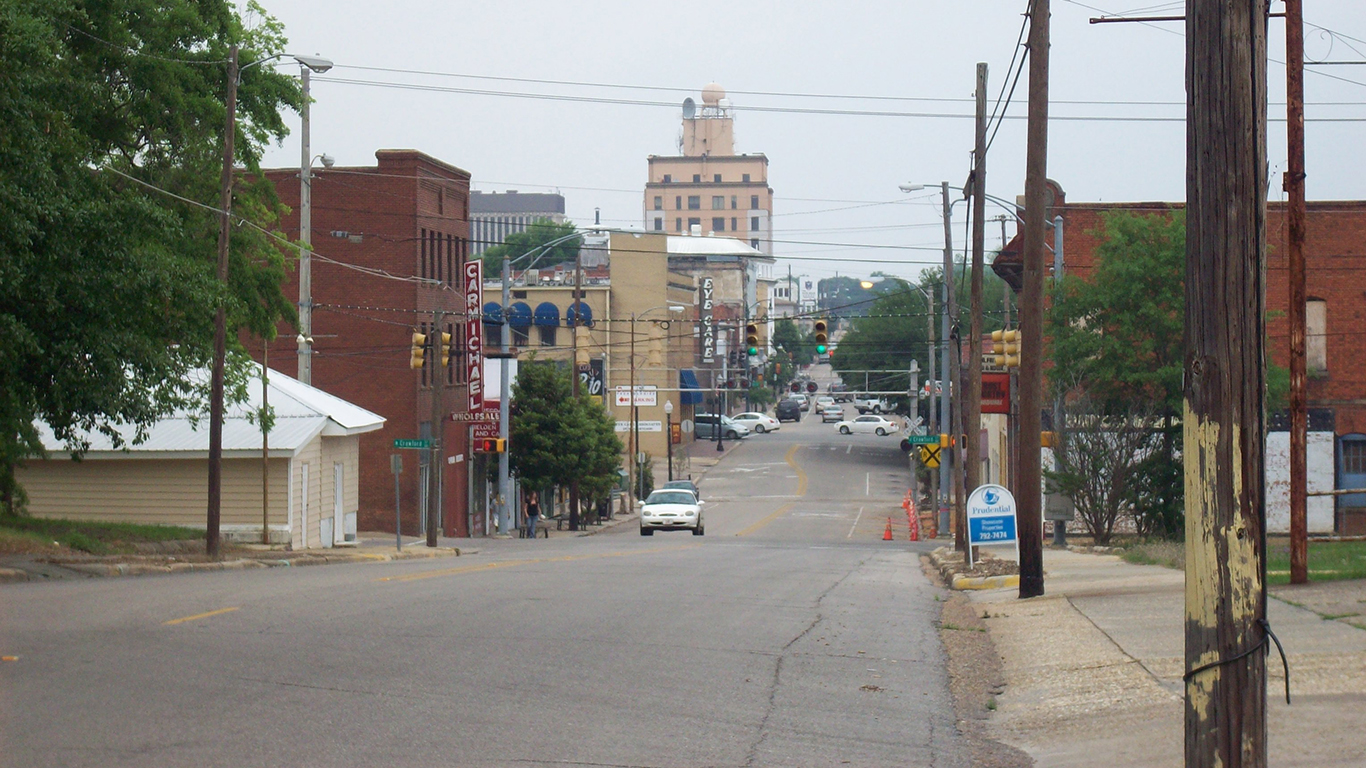
18. Dothan, AL
> Annual median wage: $29,320
> High concentrations of: Textile cutting machine setters, operators, and tenders (7.1 times more common than national distribution)
> Annual wage of textile cutting machine setters, operators, and tenders: $23,400
> Jan. 2018 unemployment rate: 3.9%
> Poverty rate: 19.5%
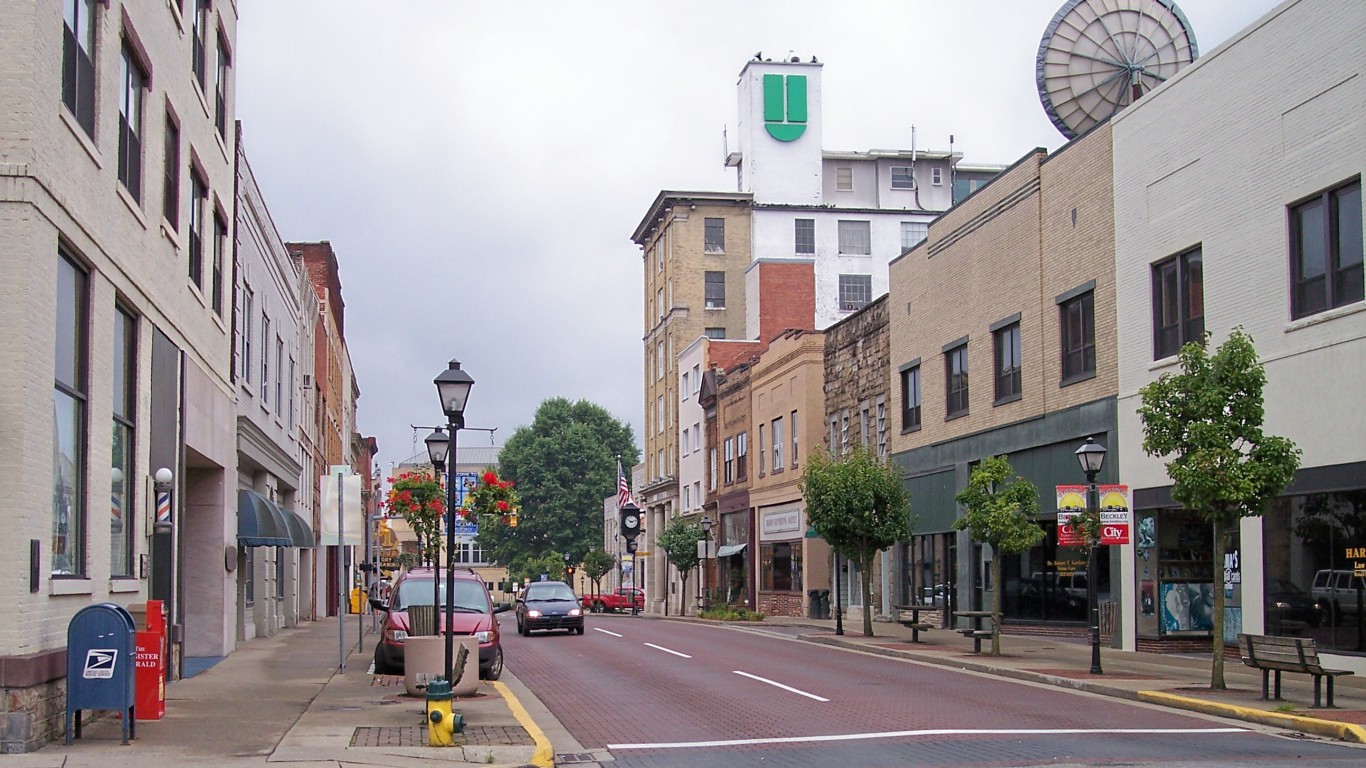
17. Beckley, WV
> Annual median wage: $29,150
> High concentrations of: Mine shuttle car operators (172.4 times more common than national distribution)
> Annual wage of mine shuttle car operators: $57,080
> Jan. 2018 unemployment rate: 5.5%
> Poverty rate: 15.9%
[in-text-ad-2]

16. Jonesboro, AR
> Annual median wage: $28,870
> High concentrations of: Farm equipment mechanics and service technicians (9.1 times more common than national distribution)
> Annual wage of farm equipment mechanics and service technicians: $31,450
> Jan. 2018 unemployment rate: 3.2%
> Poverty rate: 17.6%

15. Yuma, AZ
> Annual median wage: $28,690
> High concentrations of: Farmworkers and laborers, crop, nursery, and greenhouse (58.5 times more common than national distribution)
> Annual wage of farmworkers and laborers, crop, nursery, and greenhouse: $20,820
> Jan. 2018 unemployment rate: 18.0%
> Poverty rate: 18.0%
[in-text-ad]

14. Fort Smith, AR-OK
> Annual median wage: $28,360
> High concentrations of: Misc. food processing workers (41.0 times more common than national distribution)
> Annual wage of misc. food processing workers: $22,550
> Jan. 2018 unemployment rate: 4.2%
> Poverty rate: 18.2%

13. Daphne-Fairhope-Foley, AL
> Annual median wage: $28,230
> High concentrations of: Motorboat mechanics and service technicians (14.2 times more common than national distribution)
> Annual wage of motorboat mechanics and service technicians: $34,960
> Jan. 2018 unemployment rate: 3.2%
> Poverty rate: 11.4%
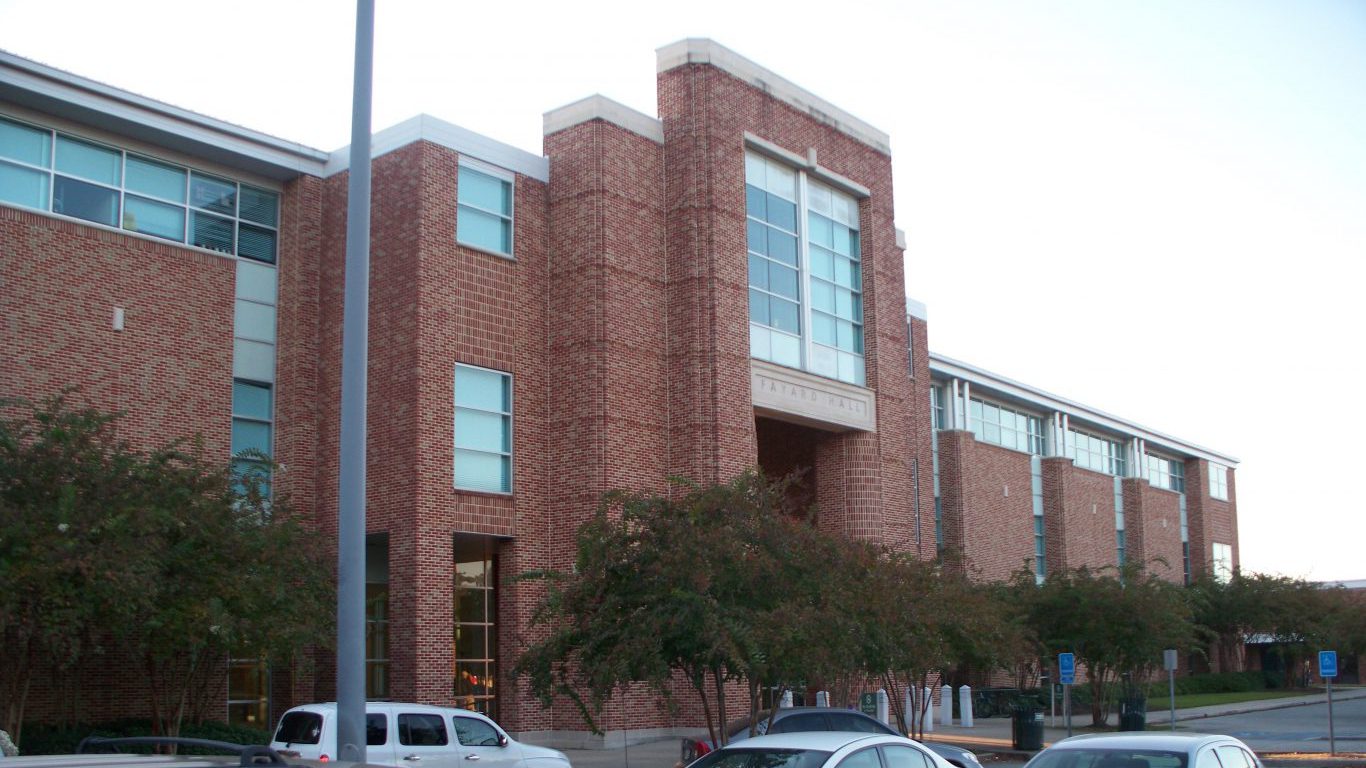
12. Hammond, LA
> Annual median wage: $28,230
> High concentrations of: Misc. food processing workers (15.3 times more common than national distribution)
> Annual wage of misc. food processing workers: $29,980
> Jan. 2018 unemployment rate: 4.6%
> Poverty rate: 20.4%
[in-text-ad-2]

11. Valdosta, GA
> Annual median wage: $28,220
> High concentrations of: Agricultural equipment operators (15.4 times more common than national distribution)
> Annual wage of agricultural equipment operators: $22,000
> Jan. 2018 unemployment rate: 4.3%
> Poverty rate: 22.6%

10. Hattiesburg, MS
> Annual median wage: $28,190
> High concentrations of: Logging equipment operators (5.4 times more common than national distribution)
> Annual wage of logging equipment operators: $34,690
> Jan. 2018 unemployment rate: 3.7%
> Poverty rate: 19.8%
[in-text-ad]

9. El Paso, TX
> Annual median wage: $28,080
> High concentrations of: Detectives and criminal investigators (7.6 times more common than national distribution)
> Annual wage of detectives and criminal investigators: $81,800
> Jan. 2018 unemployment rate: 4.3%
> Poverty rate: 22.8%

8. Jacksonville, NC
> Annual median wage: $27,710
> High concentrations of: Misc. education administrators (18.8 times more common than national distribution)
> Annual wage of misc. education administrators: $78,090
> Jan. 2018 unemployment rate: 4.7%
> Poverty rate: 13.1%

7. Sebring, FL
> Annual median wage: $27,240
> High concentrations of: Misc. cooks (10.5 times more common than national distribution)
> Annual wage of misc. cooks: $22,860
> Jan. 2018 unemployment rate: 5.4%
> Poverty rate: 18.8%
[in-text-ad-2]
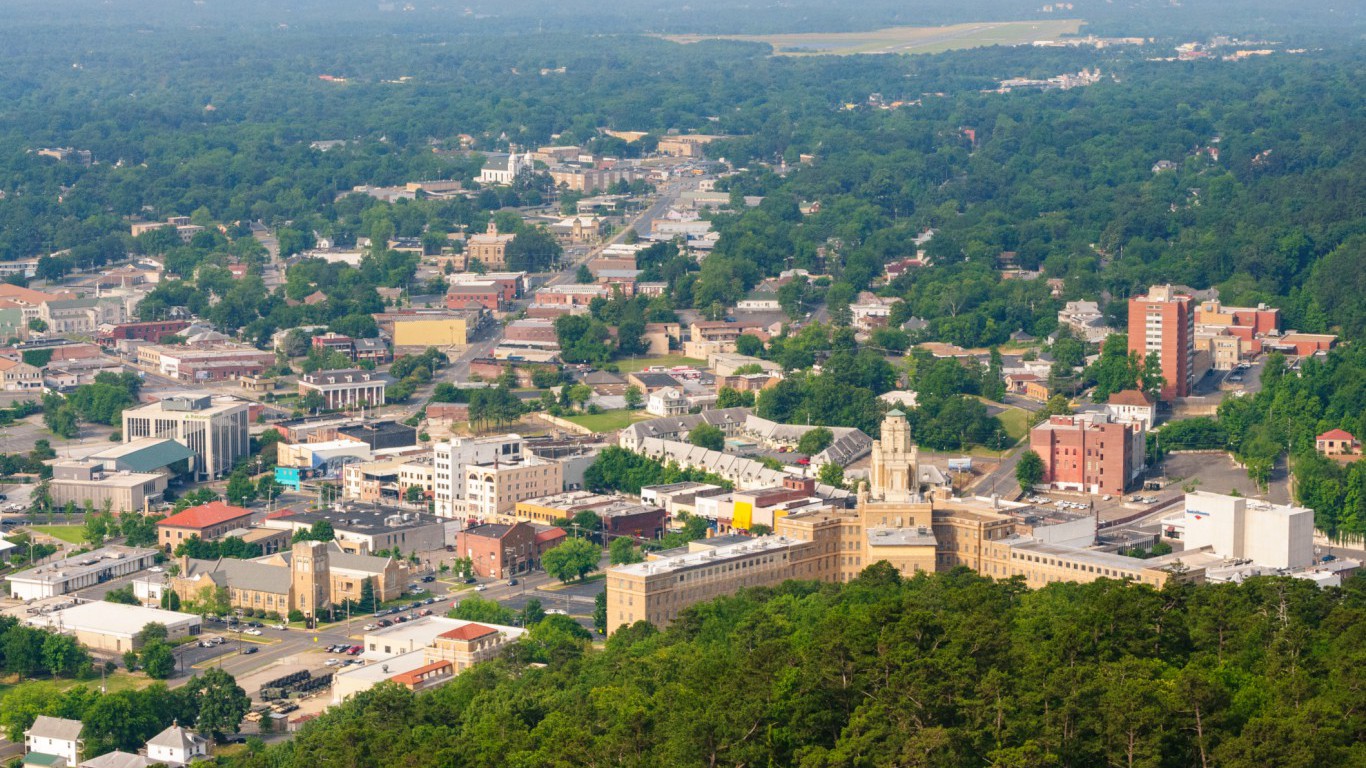
6. Hot Springs, AR
> Annual median wage: $26,910
> High concentrations of: Outdoor power equipment and other small engine mechanics (6.4 times more common than national distribution)
> Annual wage of outdoor power equipment and other small engine mechanics: $23,840
> Jan. 2018 unemployment rate: 4.0%
> Poverty rate: 18.6%

5. Gadsden, AL
> Annual median wage: $26,760
> High concentrations of: Food cooking machine operators and tenders (8.4 times more common than national distribution)
> Annual wage of food cooking machine operators and tenders: $27,720
> Jan. 2018 unemployment rate: 3.9%
> Poverty rate: 16.7%
[in-text-ad]

4. Laredo, TX
> Annual median wage: $26,760
> High concentrations of: Detectives and criminal investigators (15.4 times more common than national distribution)
> Annual wage of detectives and criminal investigators: $82,930
> Jan. 2018 unemployment rate: 3.7%
> Poverty rate: 33.0%

3. Myrtle Beach-Conway-North Myrtle Beach, SC-NC
> Annual median wage: $26,710
> High concentrations of: Airfield operations specialists (5.7 times more common than national distribution)
> Annual wage of airfield operations specialists: $39,640
> Jan. 2018 unemployment rate: 5.2%
> Poverty rate: 15.1%
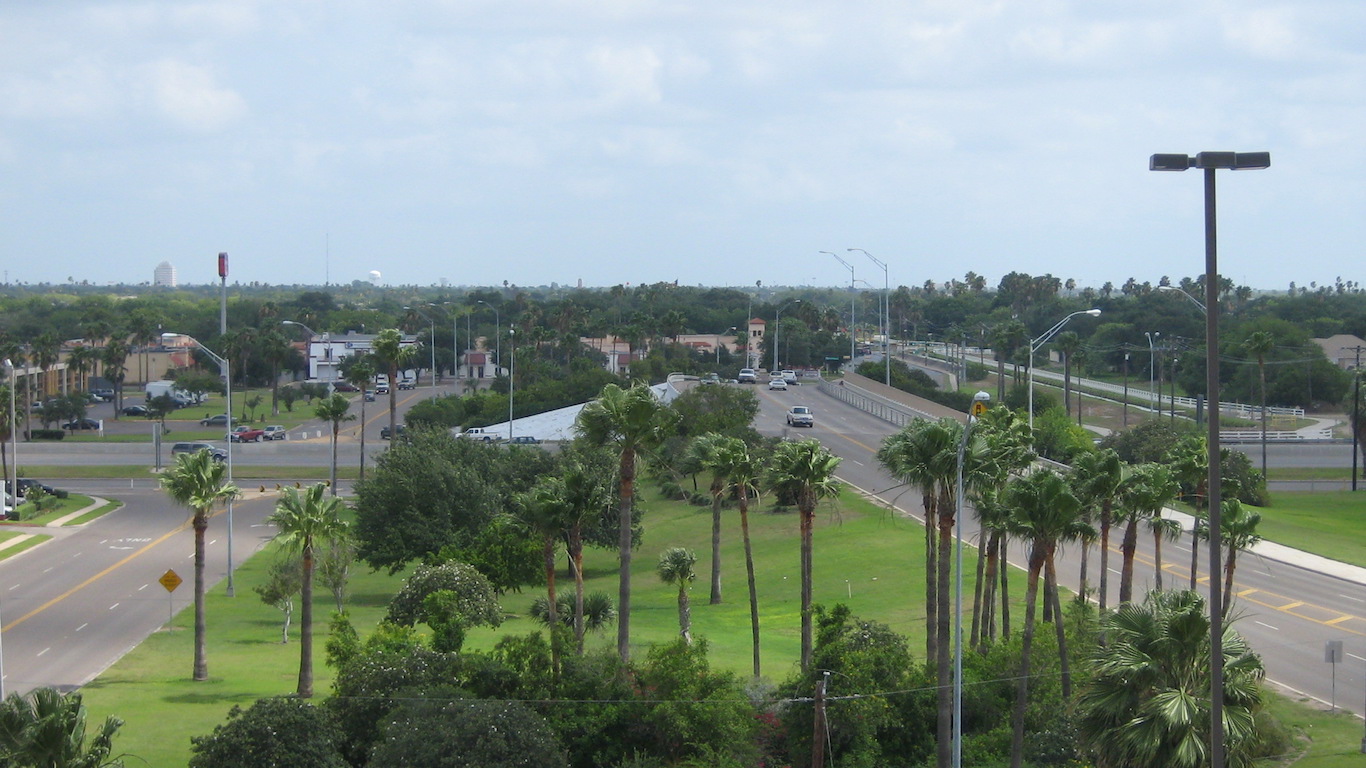
2. McAllen-Edinburg-Mission, TX
> Annual median wage: $25,600
> High concentrations of: Detectives and criminal investigators (7.6 times more common than national distribution)
> Annual wage of detectives and criminal investigators: $79,390
> Jan. 2018 unemployment rate: 6.9%
> Poverty rate: 31.4%
[in-text-ad-2]
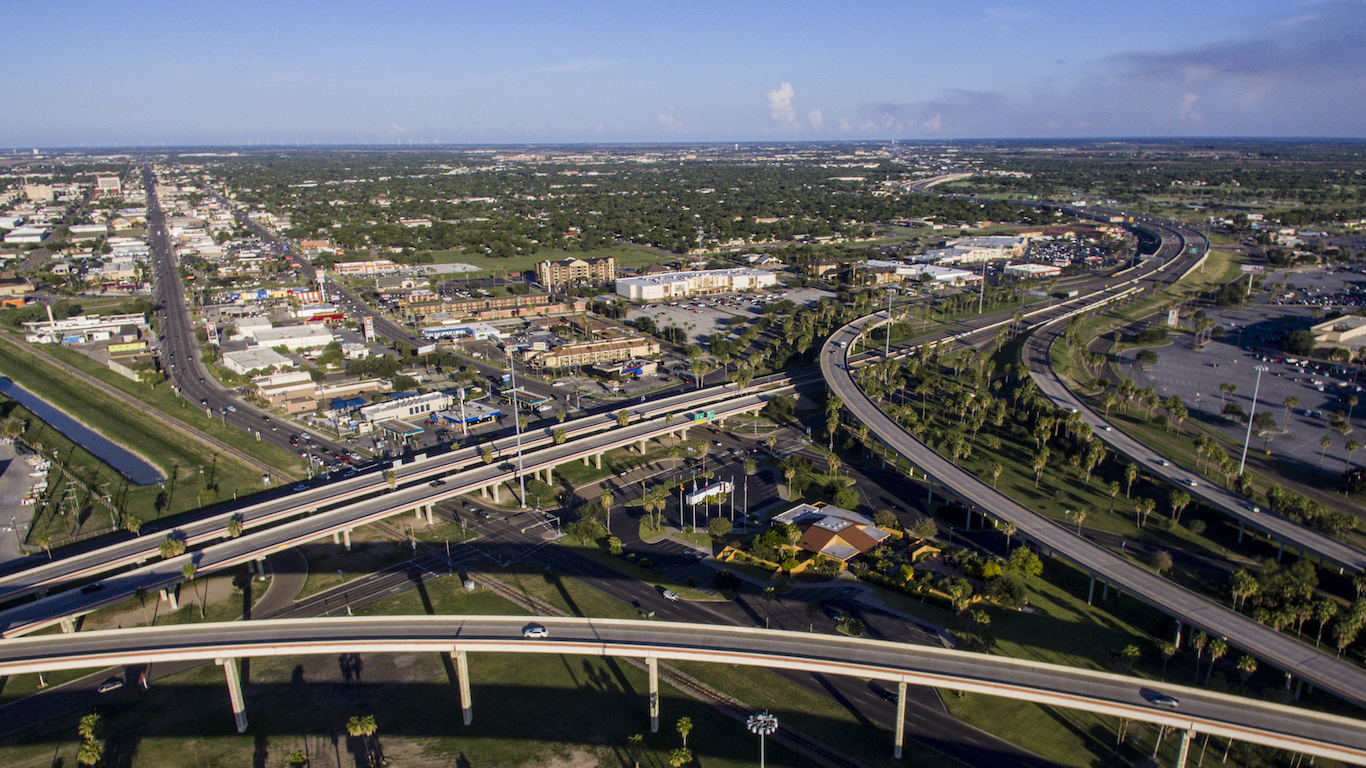
1. Brownsville-Harlingen, TX
> Annual median wage: $24,100
> High concentrations of: Nurse anesthetists (8.9 times more common than national distribution)
> Annual wage of nurse anesthetists: $77,450
> Jan. 2018 unemployment rate: 6.3%
> Poverty rate: 29.3%
Detailed Findings & Methodology
Industrial composition invariably determines the distribution of jobs in a labor market, which in turn largely determines workers’ paychecks. One way to gauge a labor force is by comparing its composition to the nationwide workforce composition. The location quotient measures these differences. It is the ratio of the share of workers in a metro area employed in an occupation over the share of workers nationwide employed in that same occupation. A large location quotient does not necessarily mean the job is the most common, or even remotely common, in that area. Location quotients measure the relative concentration of occupations in a given metro area.
In 15 of the 25 cities with the highest paying jobs, the most heavily concentrated occupations relative to their national concentration — that is, the jobs with the highest location quotients — are in science or engineering. For example, in the 10th highest paying city Boulder, Colorado, workers are nearly 90 times more likely to be employed as atmospheric and space scientists than American workers are nationwide. In the remaining 10 metro areas, the leading occupation is either related to science, technology, engineering, or mathematics, or it is in a legal field.
Not only are these professions high paying compared to other jobs, but also these jobs tend to pay more in these cities compared to other cities. For example, in each of the nation’s three top paying metro, the median wage in the most highly concentrated occupation exceeds $100,000 annually. In all three cases, that typical paycheck is at least in line with or exceeds the national median wage for the occupation.
Compared to these tech and science hubs, jobs in the nation’s lowest paying cities are distributed very differently. The most heavily concentrated jobs in these areas vis-a-vis the national workforce tend to be lower-paying occupations such as personal care aides, miscellaneous food processing workers, rock splitters, and agricultural inspectors.
To identify the cities with the highest and lowest paying jobs, 24/7 Wall St. reviewed the annual median wage in 381 metropolitan statistical areas from the Occupational Employment Statistics program of the Bureau of Labor Statistics. Data is for May, 2017, the most recent period for which data is available. For larger metro areas, the BLS reports data metropolitan divisions, which are subsets of the broader metro area. For the purposes of our analysis, we aggregated metropolitan divisions to the corresponding metro area. The highly concentrated occupations listed are jobs with the largest location quotients. LQs are ratios measuring relative concentration of jobs in an area compared to their concentration in the national workforce. To calculate, the share of workers in a metro area employed in an occupation is divided by the share of workers nationwide employed in that same occupation. The Jan. 2018 unemployment rate for each metro area is the latest available seasonally adjusted rate and was also obtained from the BLS. Poverty rates came from came from the U.S. Census Bureau’s 2016 American Community Survey and are one year estimates.
The thought of burdening your family with a financial disaster is most Americans’ nightmare. However, recent studies show that over 100 million Americans still don’t have proper life insurance in the event they pass away.
Life insurance can bring peace of mind – ensuring your loved ones are safeguarded against unforeseen expenses and debts. With premiums often lower than expected and a variety of plans tailored to different life stages and health conditions, securing a policy is more accessible than ever.
A quick, no-obligation quote can provide valuable insight into what’s available and what might best suit your family’s needs. Life insurance is a simple step you can take today to help secure peace of mind for your loved ones tomorrow.
Click here to learn how to get a quote in just a few minutes.
Thank you for reading! Have some feedback for us?
Contact the 24/7 Wall St. editorial team.