
By several measures, the United States is in a period of historic economic growth and prosperity. Major stock market indices have hit record highs, unemployment is at a near two-decade low, and we are in the midst of what may prove to be the longest period of sustained GDP growth in U.S. history.
However, amid all the good news, the poverty rate is on the rise, and several U.S. cities are becoming increasingly geographically and socially segregated by income.
The poverty level in the continental United States is set at annual income of $25,100 for a family of four, according to the Department of Health and Human Services. The share of Americans living below that income threshold climbed from 12.7% to 14.2% between 2010 and 2016. As poverty has affected more Americans, it has also has become more geographically concentrated. The number of neighborhoods nationwide in which 40% or more of the population lives in poverty climbed by 21.7% over the same period.
This increased concentration of poverty is far more pronounced in certain metropolitan areas. The share of poor residents living in extremely poor neighborhoods — defined as those with a poverty rate of at least 40% — climbed by more than 3.5 percentage points in 20 metro areas in the last six years.
Such high poverty neighborhoods are often characterized by high crime rates, low educational attainment rates, and high unemployment. Partially as a result, those living in these extremely poor neighborhoods are at a greatly reduced likelihood of success and upward economic mobility.
Using data from the U.S. Census Bureau, 24/7 Wall St. compared the percentage point change in concentrated poverty rates in U.S. metro areas between 2010 and 2016 to identify the cities where concentrated poverty is increasing most. The cities on this list span the United States geographically, from the West Coast to the East and from the South to the Midwest.
Click here to see the cities hit hardest by extreme poverty.
Click here to see our detailed findings and methodology.
Correction: A previous version of this article incorrectly identified Springfield as the capital of Massachusetts. The error has been corrected.
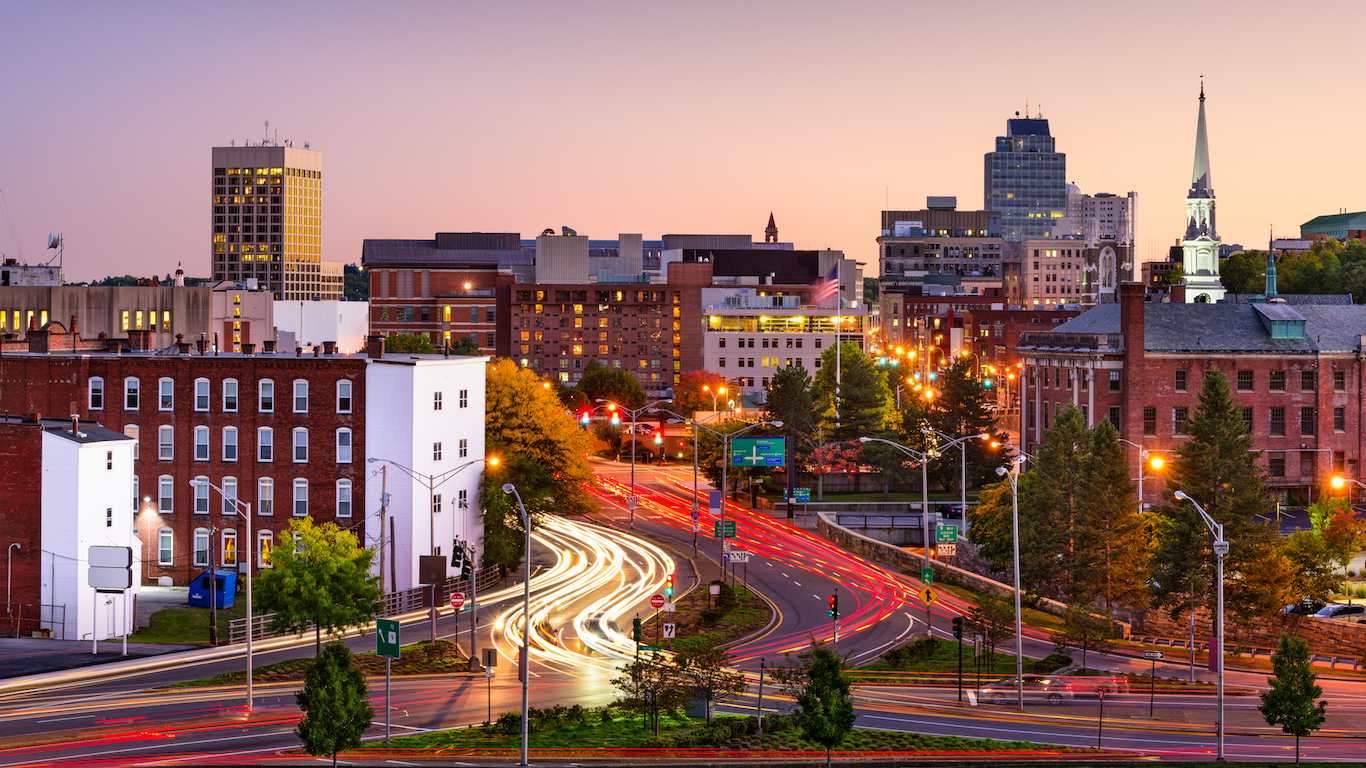
20. Worcester, MA-CT
> 2010-2016 increase in concentrated poverty: 3.6 ppts (+6,132 people)
> Concentrated poverty rate: 12.0%
> 2010-2016 increase in number of poor neighborhoods: +4 (+100%)
> Unemployment in poor neighborhoods: 16.1%
Since 2010, the share of the Worcester metro area’s poor population living in neighborhoods where at least 40% of the population live below the poverty line increased by 3.6 percentage points to 12.0%. The increase in concentrated poverty was more rapid than in all but 19 other metro areas nationwide. Over the same period, the number of Worcester neighborhoods in which at least 40% of the population are poor doubled from four to eight.
Despite the rapid increase in concentrated poverty in the metro area, Worcester is not as poor as the country as a whole. Both the metro area’s overall poverty rate of 11.4% and concentrated poverty rate of 12.0% are below the corresponding national rates of 14.2% and 12.9%.
[in-text-ad]

19. Jackson, MS
> 2010-2016 increase in concentrated poverty: 3.7 ppts (+8,948 people)
> Concentrated poverty rate: 31.6%
> 2010-2016 increase in number of poor neighborhoods: +4 (+20%)
> Unemployment in poor neighborhoods: 19.0%
The poverty rate in the Jackson metro area climbed since 2010 from 17.9% to 19.7%. Over the same period, poverty also became more concentrated in Mississippi’s capital city. Over the same time period, the metro area’s concentrated poverty rate climbed by 3.7 percentage points. Though the concentrated poverty rate increased for both the city’s black and white residents, the sharpest increase was among Hispanics. Some 25.3% of Hispanics who live below the poverty line live in extremely poor neighborhoods, an 8.5 percentage point increase from 2010.
People living in poor neighborhoods are much less likely to have a college education or a job than those living in a more financially secure neighborhood. In Jackson, just 11.3% of adults in poor neighborhoods have a bachelor’s degree compared to 31.9% of adults in the rest of the city. Additionally, the 19.0% unemployment rate in Jackson’s poor neighborhoods is nearly triple the 7.2% rate in the city’s more affluent areas.
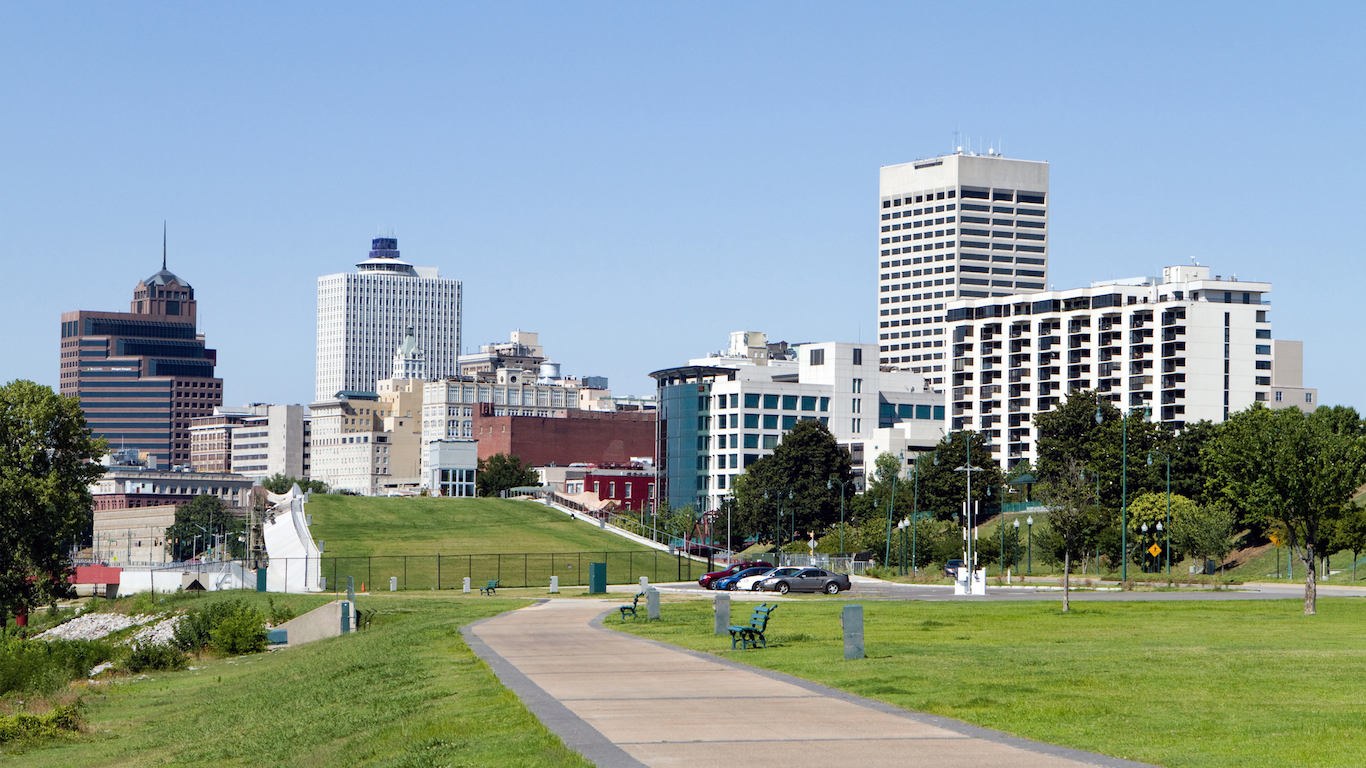
18. Memphis, TN-MS-AR
> 2010-2016 increase in concentrated poverty: 3.9 ppts (+15,117 people)
> Concentrated poverty rate: 32.3%
> 2010-2016 increase in number of poor neighborhoods: +14 (+31%)
> Unemployment in poor neighborhoods: 18.1%
Neighborhoods with at least a 40% poverty rate are considered extremely poor. In Memphis, the share of poor people living in extremely poor neighborhoods increased by 3.9 percentage points since 2010 — one of the largest increases of any metro area nationwide. The increase disproportionately affected the city’s hispanic population as the share of poor Hispanics living in concentrated poverty more than doubled from 14.4% to 33.4% over the same period. Today, the concentrated poverty rate of 32.3% in Memphis is nearly the highest in the country and well above the U.S. concentrated poverty rate of 12.9%.
Economically depressed pockets of any city are more susceptible to high crime rates than more affluent areas. In Memphis, poor neighborhoods may account for a disproportionate share of the metro area’s near nation-leading annual violent crime rate of 1,082 incidents per 100,000 people.

17. Indianapolis-Carmel-Anderson, IN
> 2010-2016 increase in concentrated poverty: 4.3 ppts (+20,345 people)
> Concentrated poverty rate: 17.1%
> 2010-2016 increase in number of poor neighborhoods: +14 (+67%)
> Unemployment in poor neighborhoods: 17.4%
The concentrated poverty rate in the Indianapolis metro area climbed from 12.7% in 2010 to 17.1% in 2016 — a steeper percentage point increase than the vast majority of metro areas nationwide. As is the case in a number of cities on this list, the share of Hispanics living in pockets of extreme poverty increased faster than any other ethnic group. Fewer than 13% of poor Hispanics lived in neighborhoods with highly concentrated poverty in 2010. By 2016, nearly 25% did.
Economic opportunity is often scarce for residents of extremely poor neighborhoods. In the poorest parts of Indianapolis, the unemployment rate of 17.4% is well above the 6.5% rate in the city’s more affluent neighborhoods.
[in-text-ad-2]

16. Little Rock-North Little Rock-Conway, AR
> 2010-2016 increase in concentrated poverty: 4.4 ppts (+6,080 people)
> Concentrated poverty rate: 14.0%
> 2010-2016 increase in number of poor neighborhoods: +5 (+71%)
> Unemployment in poor neighborhoods: 16.1%
Concentrated poverty is expanding faster in the Little Rock metro area than in all but 15 other metro areas nationwide. As recently as 2010, 9.6% of the poor population in and around the Arkansas state capital lived in highly poor neighborhoods, below the comparable 13.2% share nationwide. As of 2016, 14.0% of Little Rock’s poor population lived in high poverty neighborhoods, a larger share than the 12.9% of America’s poor that same year.
Economic conditions have also worsened in Little Rock’s poor neighborhoods over the same period. Today, some 16.1% of workers in high poverty neighborhoods around the metro are out of a job, up from 14.4% in 2010. Nationwide, the unemployment rate in high poverty neighborhoods improved from 17.6% to 16.3% over the same period.
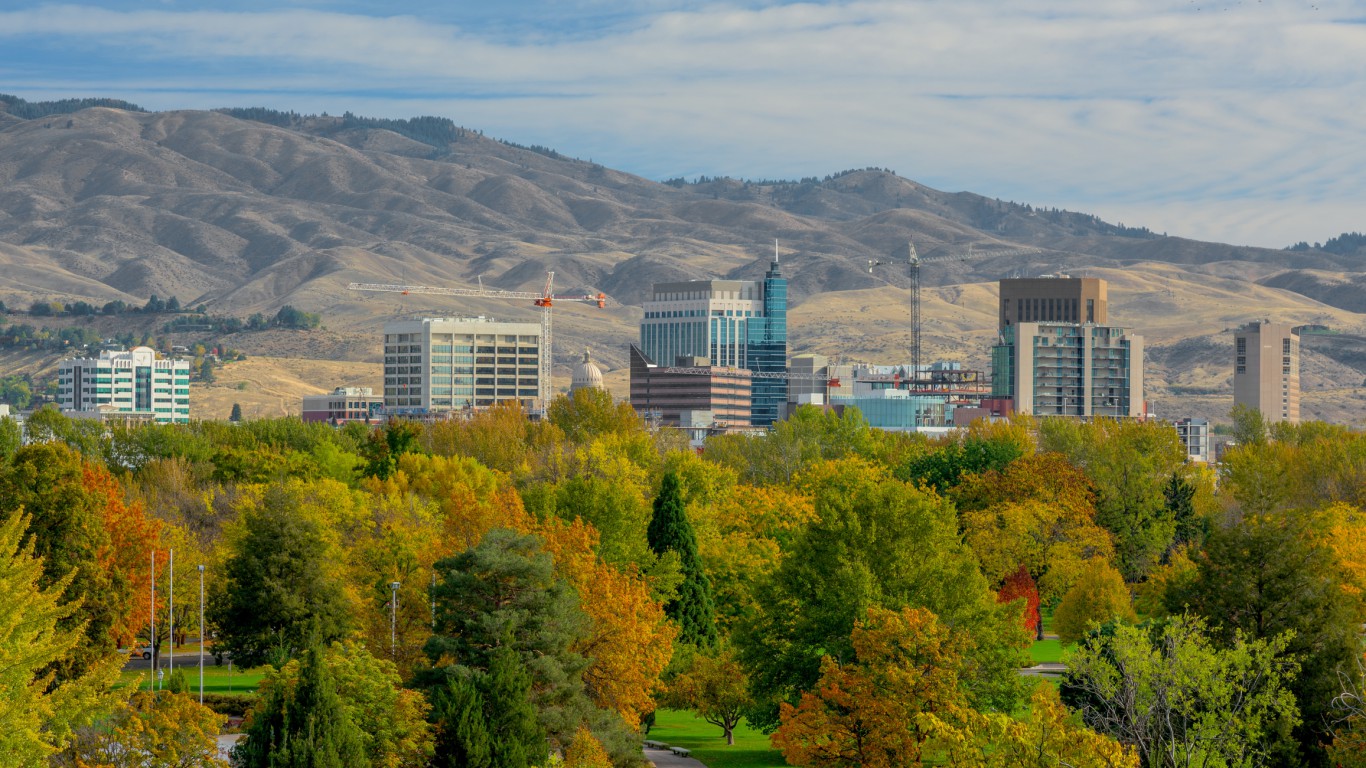
15. Boise City, ID
> 2010-2016 increase in concentrated poverty: 4.7 ppts (+5,010 people)
> Concentrated poverty rate: 7.1%
> 2010-2016 increase in number of poor neighborhoods: +2 (+100%)
> Unemployment in poor neighborhoods: 9.9%
Over the last six years, the poverty rate in the Boise metro area tracked closely with the overall U.S. poverty rate, climbing from 12.8% to 14.7%. However, the share of the poor population living in extremely poor neighborhoods increased far faster than it did on average nationwide. Some 7.1% of Boise’s poor now live in high poverty neighborhoods, up from just 2.4% in 2010. Meanwhile, concentrated poverty decreased from 13.2% to 12.9% nationwide. Over the same period, the number of poor neighborhoods in Boise doubled from two to four.
Residents of poor neighborhoods are less likely than those in wealthier neighborhoods to own their home. In Boise, the homeownership rate across the city’s four high poverty neighborhoods is just 25.7%. In the metro area’s other neighborhoods, the homeownership rate is 69.4%.
[in-text-ad]

14. Las Vegas-Henderson-Paradise, NV
> 2010-2016 increase in concentrated poverty: 4.9 ppts (+20,726 people)
> Concentrated poverty rate: 11.3%
> 2010-2016 increase in number of poor neighborhoods: +12 (+120%)
> Unemployment in poor neighborhoods: 16.4%
The poverty rate in the Las Vegas metro area increased from 11.7% in 2010 to 15.0% in 2016. While the poverty rate increased across all racial groups, the sharpest increase was among the area’s black population — whose poverty rate increased from 19.0% in 2010 to 25.0% in 2016.
Concentrated poverty has also increased relatively rapidly in Las Vegas. The number of people living below the poverty line in extremely poor neighborhoods increased by nearly 21,000 in the metro area in the last six years. Despite the rapid increase, concentrated poverty is not as common in Las Vegas as it is nationwide. Some 11.3% of poor metro area residents live in high poverty areas, below the comparable 12.9% share nationwide.

13. Scranton–Wilkes-Barre–Hazleton, PA
> 2010-2016 increase in concentrated poverty: 5.2 ppts (+4,675 people)
> Concentrated poverty rate: 8.9%
> 2010-2016 increase in number of poor neighborhoods: +4 (+200%)
> Unemployment in poor neighborhoods: 13.2%
The poverty rate among black residents of the Scranton metro area is higher than in any other metro area considered. Some 44.9% of Scranton–Wilkes-Barre–Hazleton’s black population lives below the poverty line, up from 43.5% in 2010 and well above the 24.3% poverty rate among black Americans nationwide. In the last six years, the share of poor black residents living in high poverty neighborhoods more than doubled from 11.4% to 25.2%. The share of poor Hispanics in the area living in high poverty neighborhoods also more than doubled, from 8.9% to 22.9% over the same period. The increased concentrated poverty among the region’s minority populations contributed to the 5.2 percentage point increase in concentrated poverty overall in Scranton since 2010.
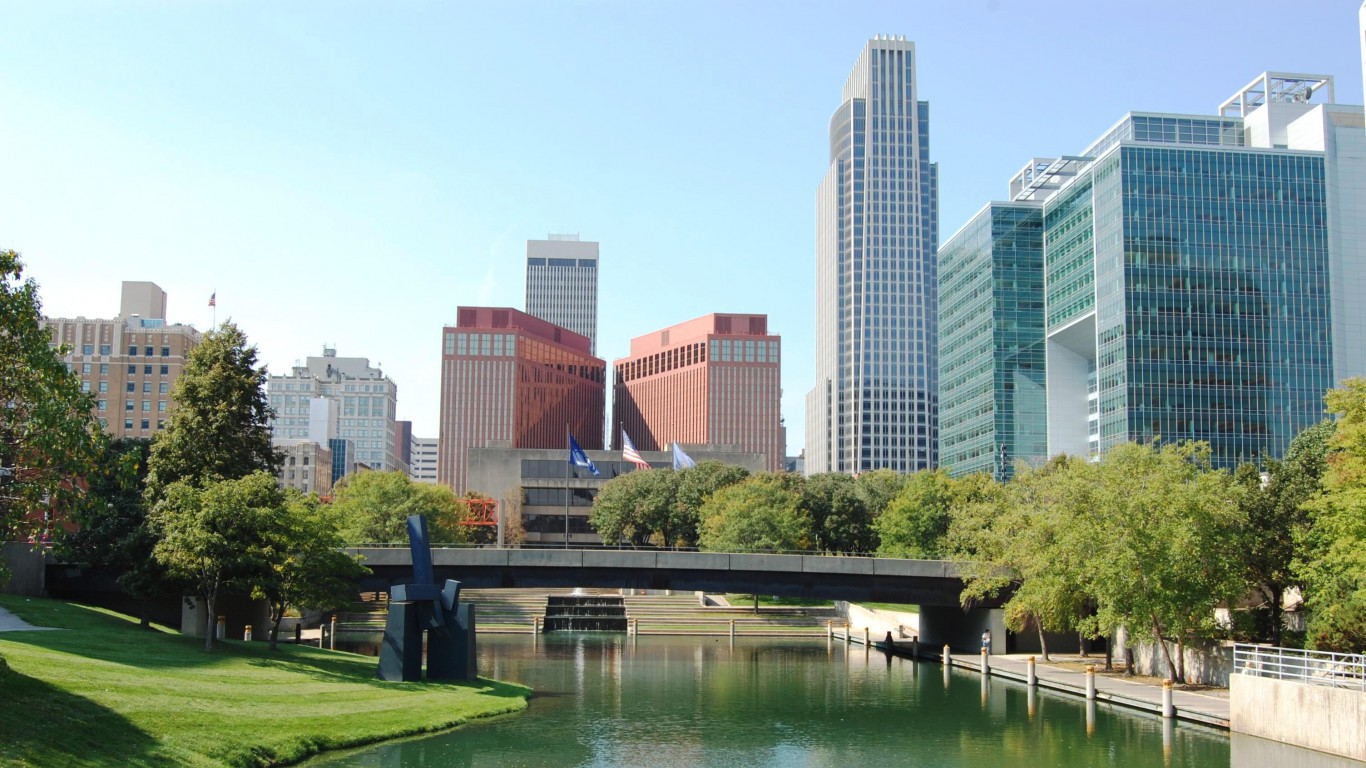
12. Omaha-Council Bluffs, NE-IA
> 2010-2016 increase in concentrated poverty: 5.5 ppts (+6,429 people)
> Concentrated poverty rate: 10.4%
> 2010-2016 increase in number of poor neighborhoods: +4 (+80%)
> Unemployment in poor neighborhoods: 14.9%
The share of poor Omaha-Council Bluffs metro area residents living in high poverty neighborhoods more than doubled over the last six years, from 4.9% to 10.4%. Over the same period, the number of high poverty neighborhoods in the metro area increased from five to nine. Despite the rapid increase, concentrated poverty remains less common in Omaha than it is nationwide, as 12.9% of the nation’s poor live in extremely poor neighborhoods.
Poverty in general is less of a problem in the Omaha metro area than it is nationwide. Some 11.8% of Omaha residents live in poverty, below the 14.2% U.S. poverty rate.
[in-text-ad-2]
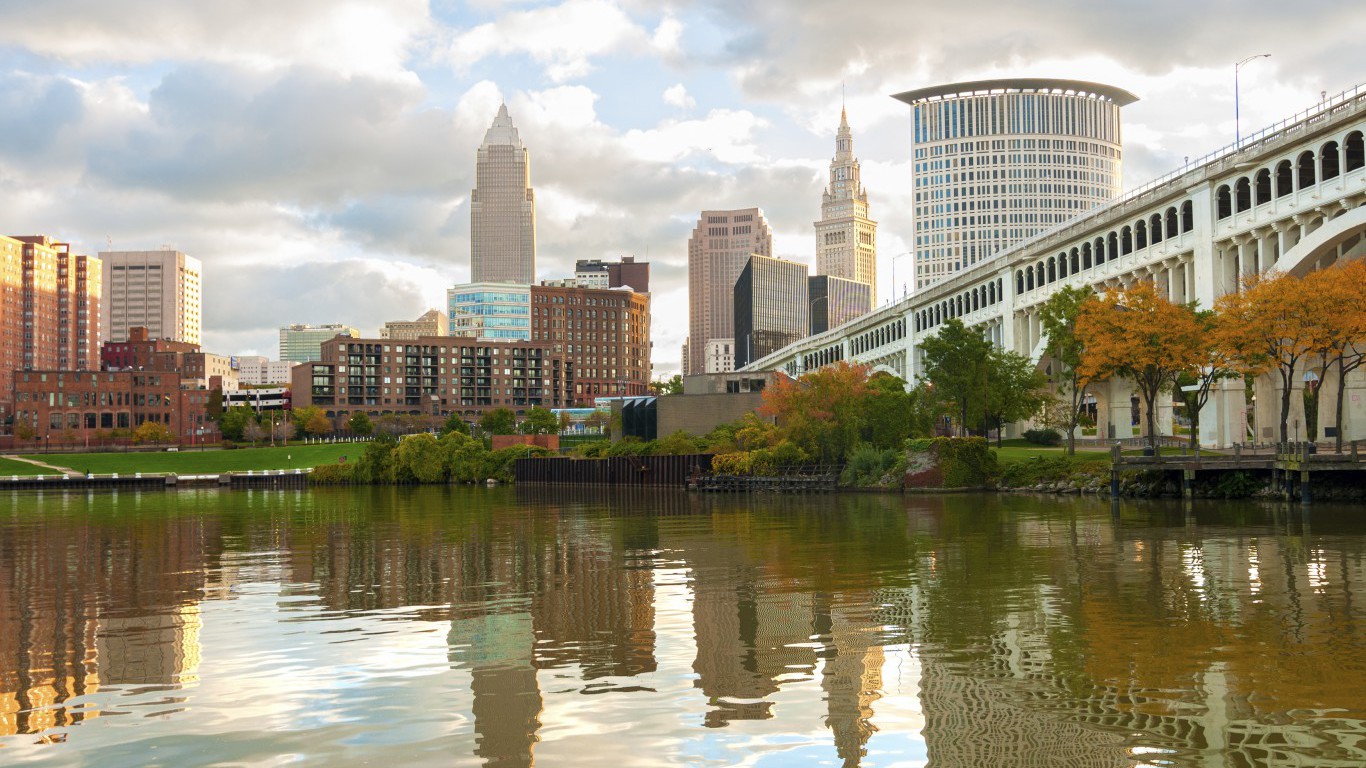
11. Cleveland-Elyria, OH
> 2010-2016 increase in concentrated poverty: 5.6 ppts (+22,554 people)
> Concentrated poverty rate: 27.7%
> 2010-2016 increase in number of poor neighborhoods: +30 (+52%)
> Unemployment in poor neighborhoods: 24.9%
The Cleveland metro area’s concentrated poverty rate of 27.7% is nearly the highest in the country and up considerably from the 22.2% rate in 2010. Over the same period, the number of neighborhoods in the metro area in which at least 40% of the population lives in poverty climbed from 58 to 88.
The city’s economic segregation also appears to isolate employment opportunities to those living in wealthier areas. Some 25% of the labor force living in Cleveland’s poor neighborhoods are unemployed, well above the 7.0% unemployment rate across the metro area’s other neighborhoods. As is the case nationwide, residents of Cleveland’s poorest neighborhoods are also less likely than residents in other parts of the city to have a college degree. Just 10.3% of adults in high poverty neighborhoods have a bachelor’s degree, about three times lower than the 31.2% share in the rest of the city.
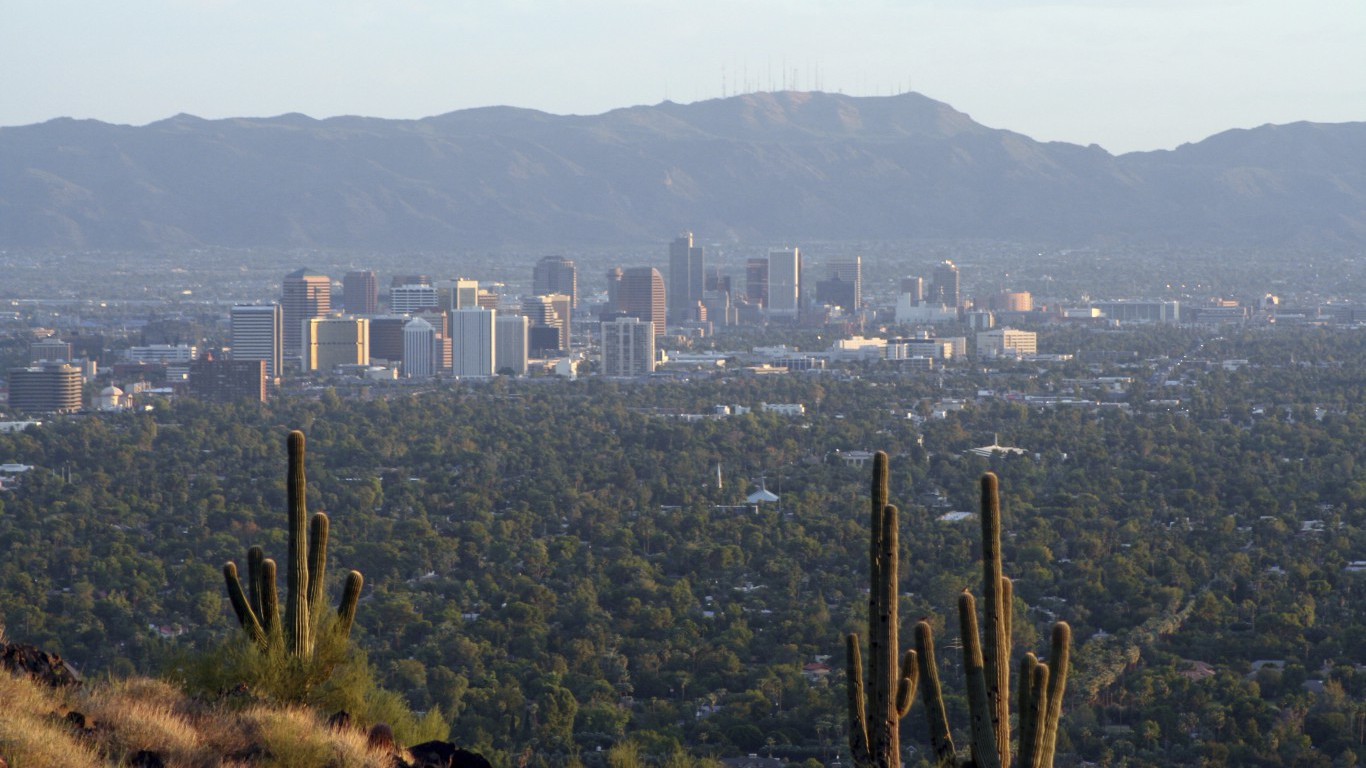
10. Phoenix-Mesa-Scottsdale, AZ
> 2010-2016 increase in concentrated poverty: 6.0 ppts (+69,740 people)
> Concentrated poverty rate: 21.3%
> 2010-2016 increase in number of poor neighborhoods: +28 (+53%)
> Unemployment in poor neighborhoods: 12.2%
The number of high poverty neighborhoods in the Phoenix metro area increased from 53 to 81 since 2010. Today, an estimated 21.3% of metro area residents subsisting on poverty level income live in one of those poor neighborhoods, up considerably from the area’s 15.3% concentrated poverty rate in 2010.
The area’s poor Hispanics are the most likely of any ethnic group to also live in a poor neighborhood. The concentrated poverty rate among Phoenix’s hispanic population of 30.1% is higher than the concentrated poverty rate of 21.9% among the area’s poor black residents and the 8.1% rate among poor whites. With a 27.4% poverty rate, Hispanics in the city are also the most likely to be poor in the first place. Among black and white metro area residents, the poverty rate is 23.4% and 10.0%, respectively.
[in-text-ad]

9. Oklahoma City, OK
> 2010-2016 increase in concentrated poverty: 6.1 ppts (+13,544 people)
> Concentrated poverty rate: 13.2%
> 2010-2016 increase in number of poor neighborhoods: +7 (+50%)
> Unemployment in poor neighborhoods: 9.9%
The poverty rate in Oklahoma City changed very little over the last six years, climbing from 14.7% to 15.0%. However, the share of the city’s poor residents living in high poverty neighborhoods increased considerably, from 7.1% to 13.2% over the same period.
Neighborhoods of highly concentrated poor populations tend to face greater challenges to upward economic mobility than more financially secure neighborhoods, and the high poverty pockets of Oklahoma City are no exception. Unemployment across the metro area’s poorest neighborhoods is 9.9%, nearly double the 5.0% unemployment rate in the remaining neighborhoods in Oklahoma City. Additionally, the 39.2% homeownership rate in the metro area’s poor neighborhoods is well below the 65.3% homeownership rate in the rest of the city.
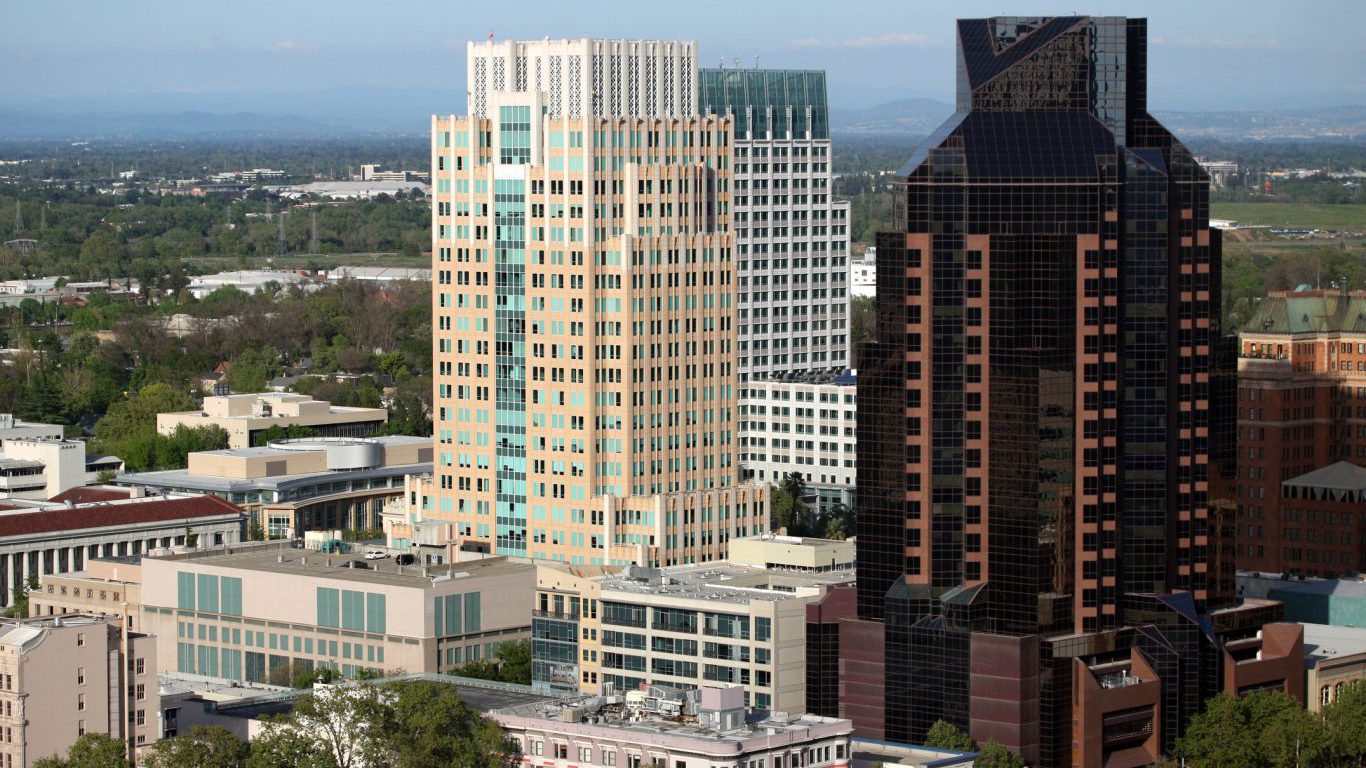
8. Sacramento–Roseville–Arden-Arcade, CA
> 2010-2016 increase in concentrated poverty: 6.3 ppts (+25,008 people)
> Concentrated poverty rate: 9.7%
> 2010-2016 increase in number of poor neighborhoods: +12 (+200%)
> Unemployment in poor neighborhoods: 16.7%
As recently as 2010, Sacramento’s poverty rate of 12.5% was below the the U.S. poverty rate of 12.7% at the time. Today, an estimated 15.8% of metro area residents live in poverty, a larger share than the 14.2% of Americans nationwide. Over the same period, concentrated poverty has also increased considerably in the metro area around California’s capital. The share of the metro area’s poor residents living in high poverty neighborhoods increased from 3.4% to 9.7%. Despite the uptick, concentrated poverty is less common in Sacramento than it is nationwide as the U.S. concentrated poverty rate stands at 12.9%.
The increase in concentrated poverty in Sacramento was not isolated to a single ethnic group. The share of Sacramento’s poor white, black, and Hispanic residents living in high poverty neighborhoods each more than doubled since 2010.
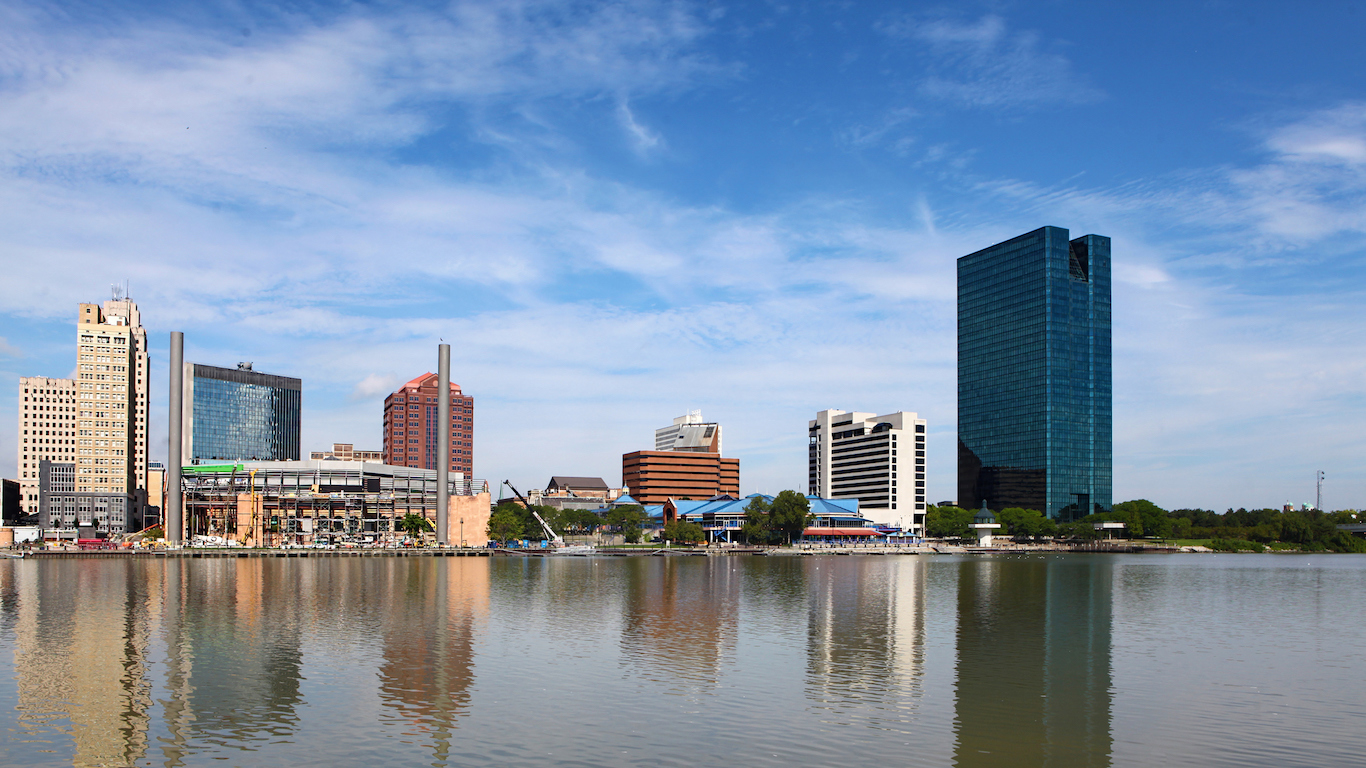
7. Toledo, OH
> 2010-2016 increase in concentrated poverty: 6.6 ppts (+9,560 people)
> Concentrated poverty rate: 34.0%
> 2010-2016 increase in number of poor neighborhoods: +9 (+38%)
> Unemployment in poor neighborhoods: 16.8%
The share of poor Toledo residents living in high poverty neighborhoods increased by 6.6 percentage points since 2010 to 34.0% in 2016 — one of the highest concentrated poverty rates and one of the highest increases in its prevalence. Poor neighborhoods are more likely to report high crime rates, and Toledo’s near nation-leading concentrated poverty rate likely contributes disproportionately to a high incidence of violent crime. There were 617 violent crimes in the metro area for every 100,000 residents in 2016, well above the U.S. violent crime rate of 386 incidents per 100,000 people.
Toledo is one of three Ohio metro areas in which concentrated poverty is rapidly increasing.
[in-text-ad-2]

6. Youngstown-Warren-Boardman, OH-PA
> 2010-2016 increase in concentrated poverty: 6.8 ppts (+7,337 people)
> Concentrated poverty rate: 27.6%
> 2010-2016 increase in number of poor neighborhoods: +7 (+44%)
> Unemployment in poor neighborhoods: 19.5%
Since 2010, the share of poor Youngstown residents living in high poverty neighborhoods increased by 6.8 percentage points, a larger increase than in all but five other metro areas nationwide. Currently, over half of all the metro area’s poor black and hispanic residents live in high poverty neighborhoods.
As is often the case in metro areas with the greatest increases in concentrated poverty, economic growth in Youngstown has stagnated in recent years. Youngstown’s annualized economic growth rate over the same six-year period was just 0.7%, less than half the comparable 2.0% national GDP growth. Employment opportunities are even more scarce for those in high poverty neighborhoods. Nearly one in every five workers in extremely poor Youngstown neighborhoods are unemployed, well above the 6.7% unemployment rate in the metro area’s more affluent neighborhoods.
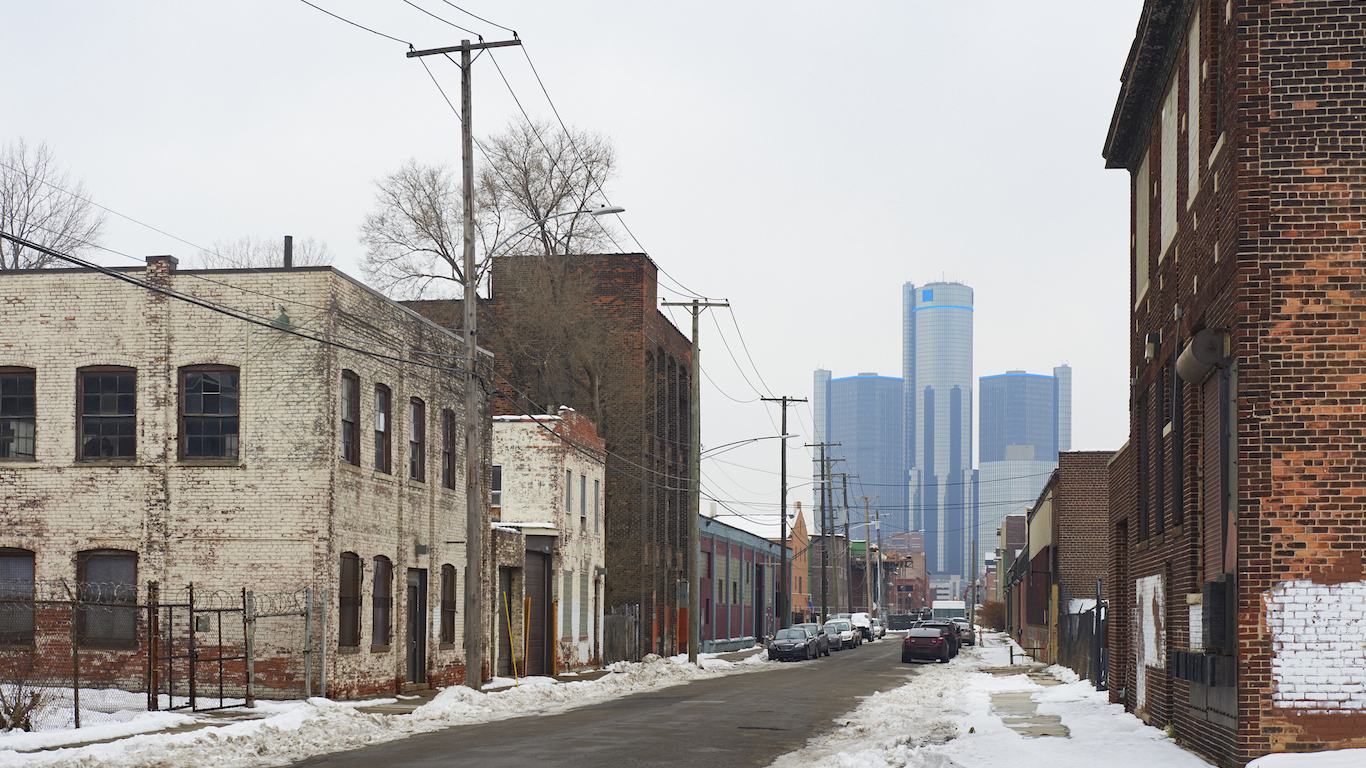
5. Detroit-Warren-Dearborn, MI
> 2010-2016 increase in concentrated poverty: 7.2 ppts (+66,826 people)
> Concentrated poverty rate: 31.6%
> 2010-2016 increase in number of poor neighborhoods: +60 (+48%)
> Unemployment in poor neighborhoods: 23.2%
Detroit has long been the poster child for economic decline in post-industrial America. In recent years, the metro area’s economic conditions have grown only more dire. The share of Detroit residents living in poverty climbed from 14.4% in 2010 to 16.2% in 2016. Over the same period, the share of those poor residents living in neighborhoods with high concentrations of poverty climbed from 24.4% to 31.6%. At the same time, the number of extremely poor neighborhood in the Detroit metro area rose from 126 in 2010 to 186 in 2016.
Extremely poor neighborhoods often have a higher than typical incidence of violent crime, and the highly concentrated pockets of poverty in Detroit likely contribute disproportionately to the metro area’s high violent crime rate. There were 556 violent crimes for every 100,000 metro area residents in 2016, well above the U.S. violent crime rate of 386 per 100,000.
[in-text-ad]
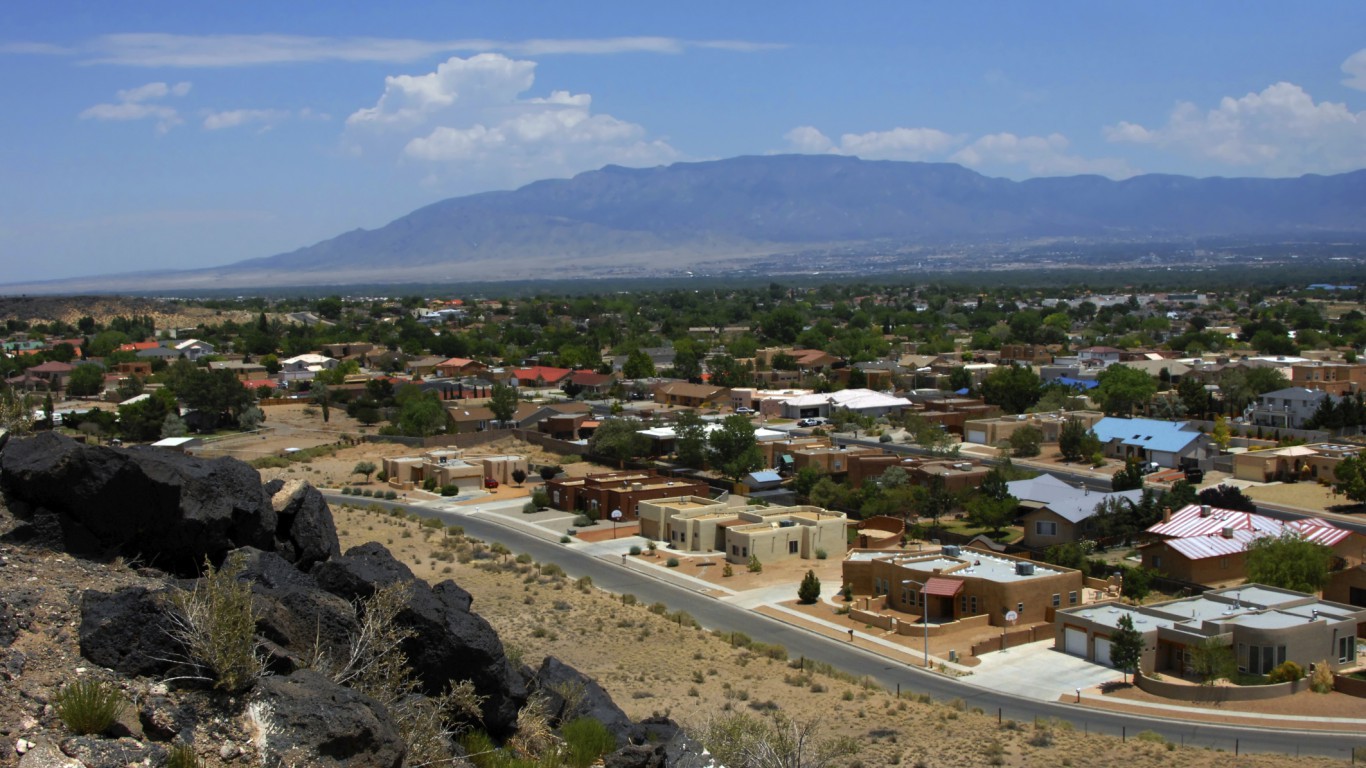
4. Albuquerque, NM
> 2010-2016 increase in concentrated poverty: 7.7 ppts (+13,902 people)
> Concentrated poverty rate: 10.7%
> 2010-2016 increase in number of poor neighborhoods: +7 (+350%)
> Unemployment in poor neighborhoods: 15.7%
The share of poor Albuquerque residents living in high poverty neighborhoods climbed from just 2.9% in 2010 to 10.7% in 2016, one of the largest percentage point increases of any U.S. metro area. Despite the increase, concentrated poverty is less common in New Mexico’s largest metro area than it is across the United States, where 12.9% of poor Americans live in extremely poor neighborhoods. Much like in other metro areas on this list, Albuquerque’s hispanic population was disproportionately affected by concentrated poverty. Over the last six years, the concentrated poverty rate among the metro area’s Hispanic population climbed from 2.8% to 10.3%.
Stronger economic growth would likely have halted or slowed the spread of concentrated poverty in the Albuquerque metro area. In the last six years, Albuquerque’s average annual economic growth of 0.3% was among the lowest of any U.S. metro area and a fraction of the overall 2.0% national average growth.

3. Springfield, MA
> 2010-2016 increase in concentrated poverty: 11.8 ppts (+11,781 people)
> Concentrated poverty rate: 33.6%
> 2010-2016 increase in number of poor neighborhoods: +5 (+36%)
> Unemployment in poor neighborhoods: 17.9%
Along with Worcester, Massachusetts, Springfield is one of only two New England metro areas to rank among those with the fastest growing concentrated poverty rates. In Springfield, concentrated poverty climbed from 21.9% to 33.6% between 2010 and 2016. Currently, only three other metro areas nationwide have a higher concentrated poverty rate than Springfield, and only two had a faster increase in concentrated poverty in the last six years.
The likelihood of living in an extremely poor neighborhood in Springfield appears to be strongly dependent on race. For example, just 12.5% of the metro area’s poor white population live in a high poverty neighborhood. Meanwhile, 52.9% of poor Hispanics and 41.7% of poor black residents live in extremely poor neighborhoods.
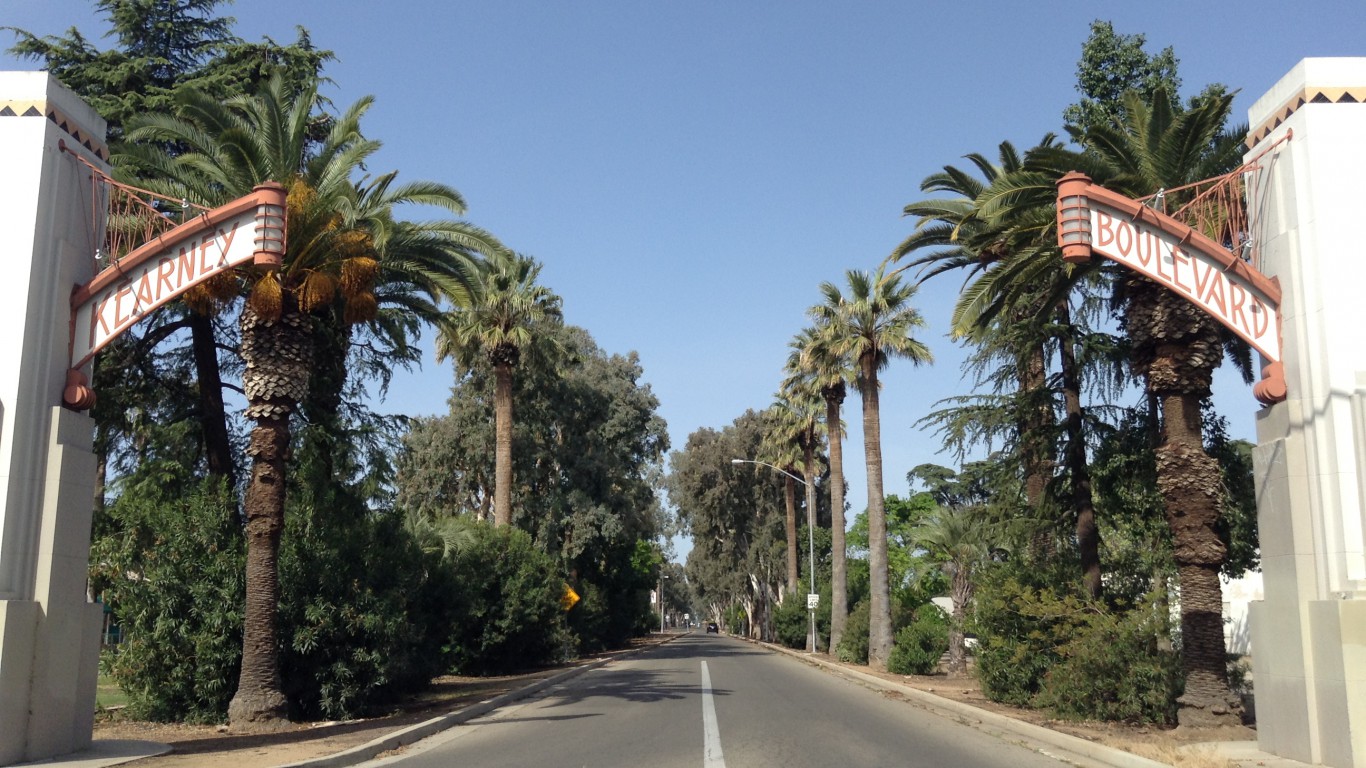
2. Fresno, CA
> 2010-2016 increase in concentrated poverty: 12.8 ppts (+48,774 people)
> Concentrated poverty rate: 42.2%
> 2010-2016 increase in number of poor neighborhoods: +19 (+66%)
> Unemployment in poor neighborhoods: 17.7%
The share of Fresno’s extremely poor residents living in high poverty neighborhoods increased by 12.8 percentage points since 2010, the second largest increase of any metro area. As a result, the metro area’s 42.2% concentrated poverty rate is the highest of any metro area in the country. High poverty areas are at increased risk of a high incidence of crime, and Fresno’s high concentrated poverty rate may largely explain the city’s high violent crime rate. There were 613 violent crimes for every 100,000 metro area residents in 2016, well above the U.S. violent crime rate of 384 per 100,000.
The disparity in educational attainment between Fresno’s extremely poor neighborhoods and the rest of the metro area is especially stark. Just 6.7% of adults in Fresno’s high poverty neighborhoods have a bachelor’s degree compared to 23.3% of adults living in the remaining neighborhoods.
[in-text-ad-2]

1. Bakersfield, CA
> 2010-2016 increase in concentrated poverty: 16.4 ppts (+37,388 people)
> Concentrated poverty rate: 32.5%
> 2010-2016 increase in number of poor neighborhoods: +17 (+155%)
> Unemployment in poor neighborhoods: 18.3%
Bakersfield is one of three California metro areas with the largest increases in concentrated poverty since 2010. In the last six years, the share of the metro area’s poor population living in high poverty neighborhoods more than doubled from 16.1% to 32.5%, the largest increase of any U.S. metro area. Over the same period, the share of Bakersfield residents living below the poverty line climbed from 20.6% to 23.1%.
Stratification between the metro area’s poor neighborhoods and the rest of the city is underscored by disparities in educational attainment and employment opportunities. Just 4.2% of adults in Bakersfield’s extremely poor neighborhoods have a bachelor’s degree, well below the 18.0% share of adults in the city’s more affluent neighborhoods. Additionally, 18.3% of the workforce living in the metro area’s extremely poor neighborhoods are out of a job, well above the 10.9% unemployment rate in the city’s other neighborhoods.
Detailed Findings
The causes of increasingly concentrated poverty are varied. In some parts of the country, the growing number of people living below the poverty line was enough to drive up the number of neighborhoods that are considered extremely poor. In every city on this list, the poverty rate increased since 2010. Additionally, Boise, Idaho, Omaha, Nebraska, and Worcester, Massachusetts are the only metro areas on this list with a lower poverty rate than the 14.2% U.S. rate.
Migration also likely explains the increasing concentrations of poverty in many cities on this list — either as lower income individuals move to poorer neighborhoods or wealthier individuals move out of them.
Although concentrated poverty increased substantially in each of these cities, this does not necessarily mean these areas are not benefiting from economic growth. Memphis, Tennessee is the only metro area on this list with a stagnant annualized economic growth rate since 2010. In more than a third of the cities on this list, annualized GDP growth outpaced the comparable 2.0% national GDP growth rate. However, not all metro area residents are benefitting equally from growth — as highlighted by the increase in concentrated poverty.
Concentrated poverty also varies by city along ethnic lines. Nationwide, the share of poor white Americans living in high poverty neighborhoods increased slightly from 4.9% in 2010 to 5.2% in 2016. Similarly, the share of poor black Americans living in extremely poor neighborhoods climbed from 22.5% to 22.9% over the same period. Meanwhile, the concentrated poverty among poor Hispanics fell from 16.7% to 15.0%. However, these patterns vary considerably from city to city.
Extremely poor neighborhoods typically share a number of of socioeconomic characteristics beyond a high poverty rate. According to a recent report on concentrated poverty released by the non-profit public policy think tank Brookings Institution, residents of high poverty neighborhoods tend to have weaker job-seeking networks. To be sure, in every metro area on this list, the unemployment rate in extremely poor neighborhoods is well above the corresponding rate in the city’s higher income neighborhoods. In Cleveland, the unemployment rate in high poverty neighborhoods is nearly 18 percentage points higher than in the rest of the city’s neighborhoods.
Educational attainment rates further underscore the social segregation precipitated by increasingly concentrated poverty. In every metro area on this list, adults in extremely poor neighborhoods are less likely to be college educated than those outside high poverty neighborhoods. The disparity in bachelor’s degree attainment rates range from 8 percentage points in Scranton, Pennsylvania to 24.3 percentage points in Indianapolis.
High poverty neighborhoods also tend to report higher crime rates and may account for a disproportionate share of violent crime in the metro areas on this list. Omaha, Nebraska and Boise, Idaho are the only metro area on this list, for which FBI data is available, with lower violent crime rates than the U.S. as a whole.
Methodology
To identify the major metropolitan areas where poverty is concentrating the fastest, 24/7 Wall St. reviewed U.S. Census Bureau American Community Survey data on poverty rates at the tract level. The concentrated poverty rate is the share of a metropolitan area’s poor population that lives in a census tract characterized by extreme poverty — having a poverty rate of 40% or higher. The concentrated poverty rate was reviewed for 2010 — represented as a five-year average for 2006-2010, and 2016 — a five-year average for 2012-2016. Census tracts in which more than 50% of the population is enrolled in postsecondary school or where the total population is fewer than 500 were excluded from consideration of extreme poverty. Violent crime rates are as of 2015 and are from the FBI’s Uniform Crime Report. We also reviewed other data from the American Community Survey, including educational attainment rates for both groups in concentrated poverty and those not in poverty. These data are also averages of the 2006-2010 and 2012-2016 five-year periods.
Want to Retire Early? Start Here (Sponsor)
Want retirement to come a few years earlier than you’d planned? Or are you ready to retire now, but want an extra set of eyes on your finances?
Now you can speak with up to 3 financial experts in your area for FREE. By simply clicking here you can begin to match with financial professionals who can help you build your plan to retire early. And the best part? The first conversation with them is free.
Click here to match with up to 3 financial pros who would be excited to help you make financial decisions.
Have questions about retirement or personal finance? Email us at [email protected]!
By emailing your questions to 24/7 Wall St., you agree to have them published anonymously on a673b.bigscoots-temp.com.
By submitting your story, you understand and agree that we may use your story, or versions of it, in all media and platforms, including via third parties.
Thank you for reading! Have some feedback for us?
Contact the 24/7 Wall St. editorial team.
 24/7 Wall St.
 24/7 Wall St.
 24/7 Wall St.

