About 134 million American were exposed to unhealthy levels of air pollution between 2014 and 2016, according to figures just released by the American Lung Association. That figure represents a substantial increase over the 125 million people who were exposed to unhealthy levels of pollution between 2013 and 2015.
The ALA considers two types of pollution: ozone pollution and particle pollution, measured in short-term spikes in a given year and in long-term annual averages. People who inhale high levels of these particles are at considerably greater risk of adverse health outcomes such as difficulty breathing and cardiovascular-related illnesses. People suffering from asthma, chronic obstructive pulmonary disease (COPD), and diabetes, as well as the elderly and the very young, are at an even greater risk.
This recent rise in exposure to air pollution is primarily due to an increase in ozone gases — partially the result of the deadly wildfires that have swept through California. Meanwhile, non-gaseous particle pollution has reduced steadily in the decades since the Clean Air Act was passed.
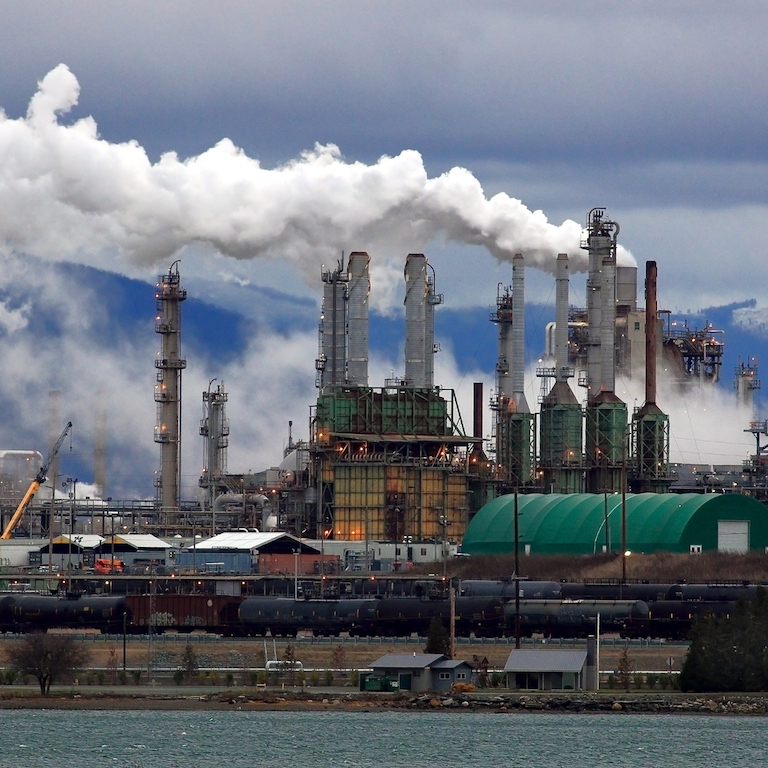
24/7 Wall St. reviewed the 25 metropolitan areas with the highest levels of ozone pollution — also known as smog — from the American Lung Association’s annual “State of the Air 2018” report. Harmful to breathe, ozone is created when pollutants, such as gases coming out of tailpipes and smokestacks, come into contact with sunlight.
Of the over 100 million Americans living in the 25 most polluted cities, 8.5 million have asthma, including nearly 2 million children. Because housing costs tend to reflect the desirability of an area, low-income neighborhoods are often clustered around truck routes, power plants, industrial sites, and other high pollution zones.
For this reason, residents of poor communities within these cities tend to be exposed to greater levels of pollution than communities in other parts of these cities. A combined 14 million people live below the poverty line in the 25 smoggiest cities.
Click here to see the 25 most polluted cities in America.
Click here to see our detailed findings and methodology.
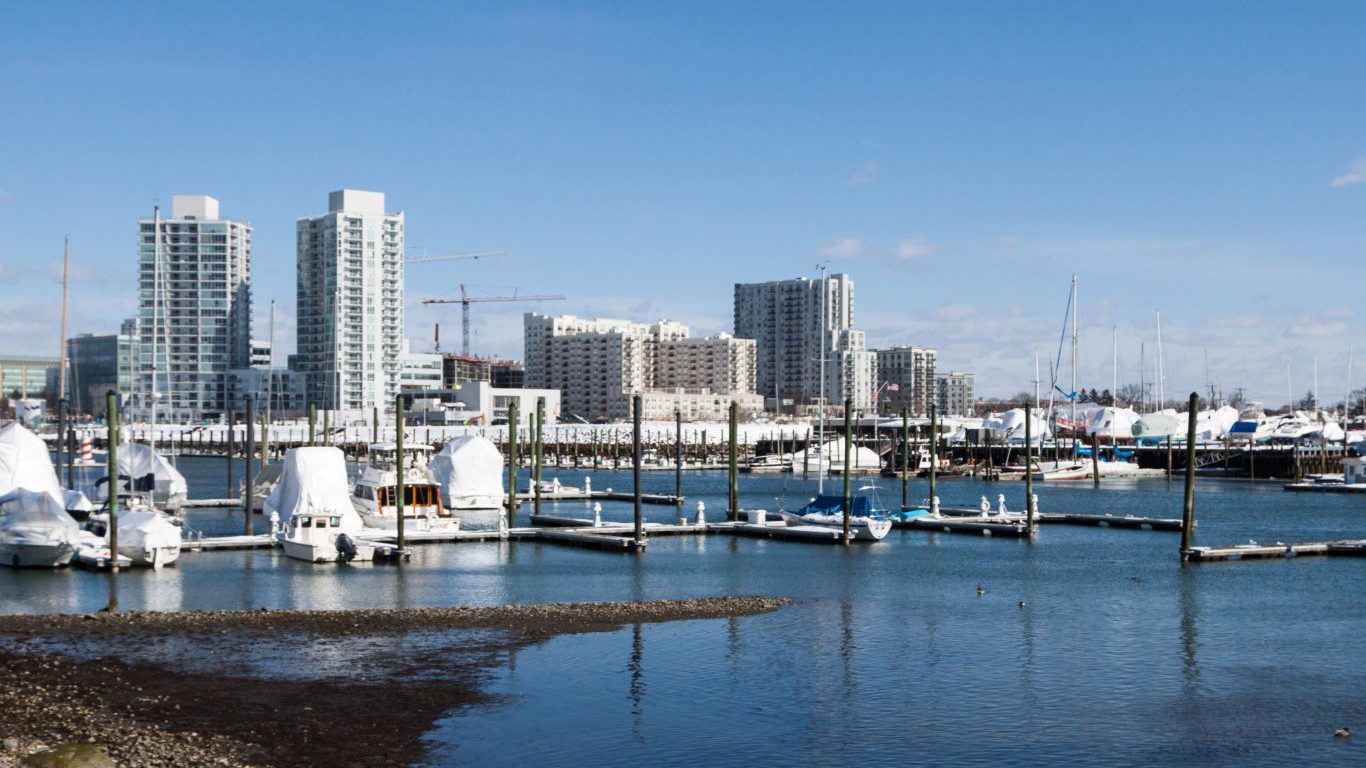
25. Bridgeport-Stamford-Norwalk, CT
> High ozone days per year: 24.2
> Number of days with unhealthy particle pollution: 0.7
> People with asthma: 100,616
> Population: 944,177
[in-text-ad]

24. Hartford-West Hartford-East Hartford, CT
> High ozone days per year: 27.3
> Number of days with unhealthy particle pollution: 0.0
> People with asthma: 128,173
> Population: 1,206,836
 24/7 Wall St.
23. Cincinnati, OH-KY-IN
> High ozone days per year: 27.5
> Number of days with unhealthy particle pollution: 0.3
> People with asthma: 171,016
> Population: 2,161,441

22. St. Louis, MO-IL
> High ozone days per year: 28.2
> Number of days with unhealthy particle pollution: 5.3
> People with asthma: 241,601
> Population: 2,807,954
[in-text-ad-2]

21. Washington-Arlington-Alexandria, DC-VA-MD-WV
> High ozone days per year: 28.3
> Number of days with unhealthy particle pollution: 0.7
> People with asthma: 437,947
> Population: 6,133,552

20. Baltimore-Columbia-Towson, MD
> High ozone days per year: 31.2
> Number of days with unhealthy particle pollution: 0.3
> People with asthma: 261,161
> Population: 2,798,886
[in-text-ad]
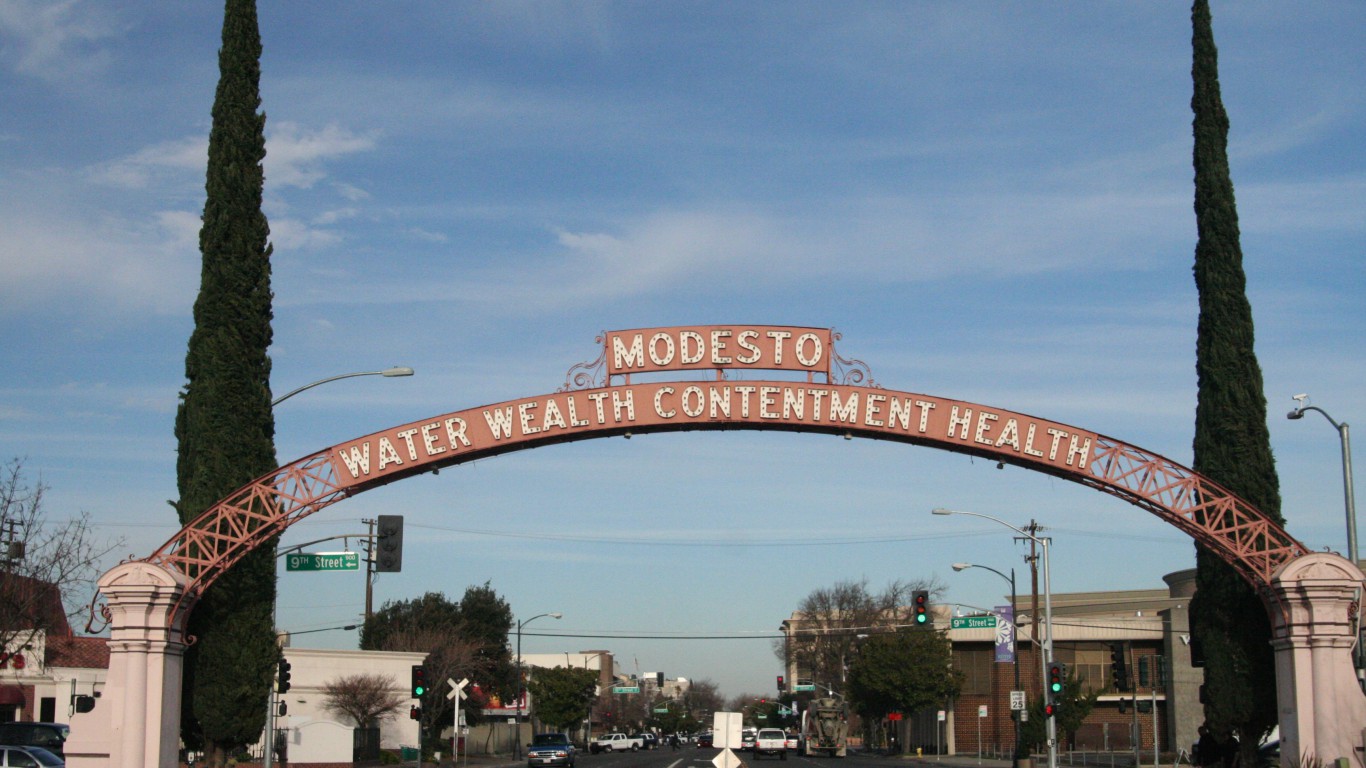
19. Modesto, CA
> High ozone days per year: 32.5
> Number of days with unhealthy particle pollution: 19.0
> People with asthma: 42,104
> Population: 541,560
 24/7 Wall St.
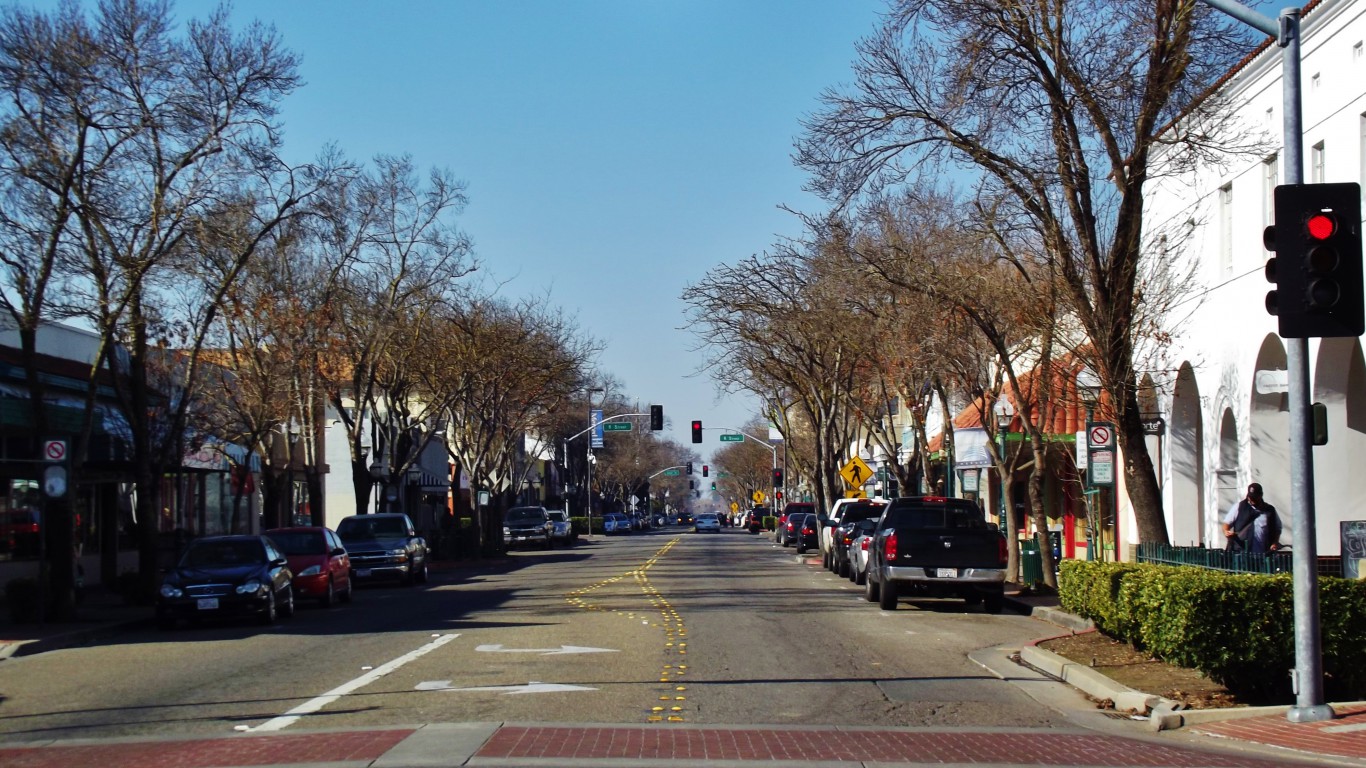
18. Merced, CA
> High ozone days per year: 33.2
> Number of days with unhealthy particle pollution: 14.5
> People with asthma: 20,737
> Population: 268,672
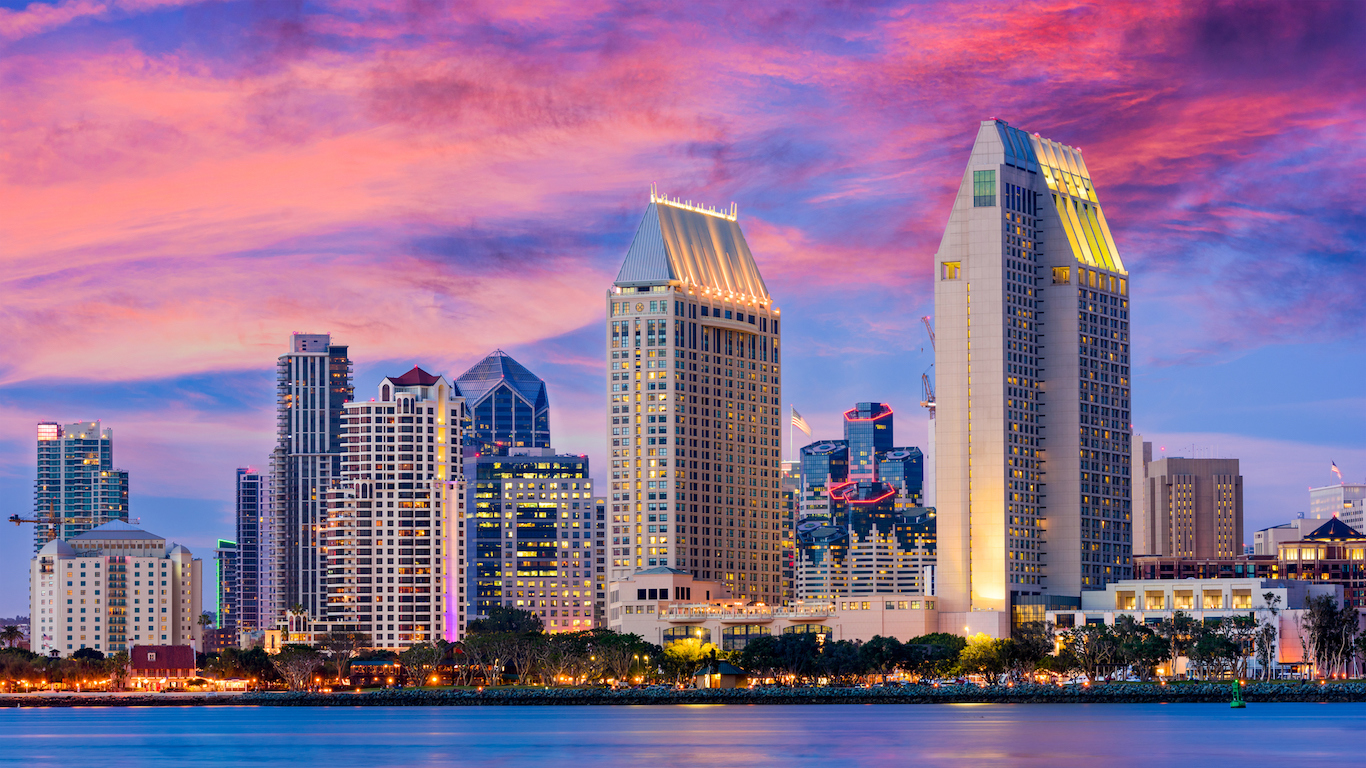
17. San Diego-Carlsbad, CA
> High ozone days per year: 36.8
> Number of days with unhealthy particle pollution: 1.5
> People with asthma: 257,458
> Population: 3,317,749
[in-text-ad-2]
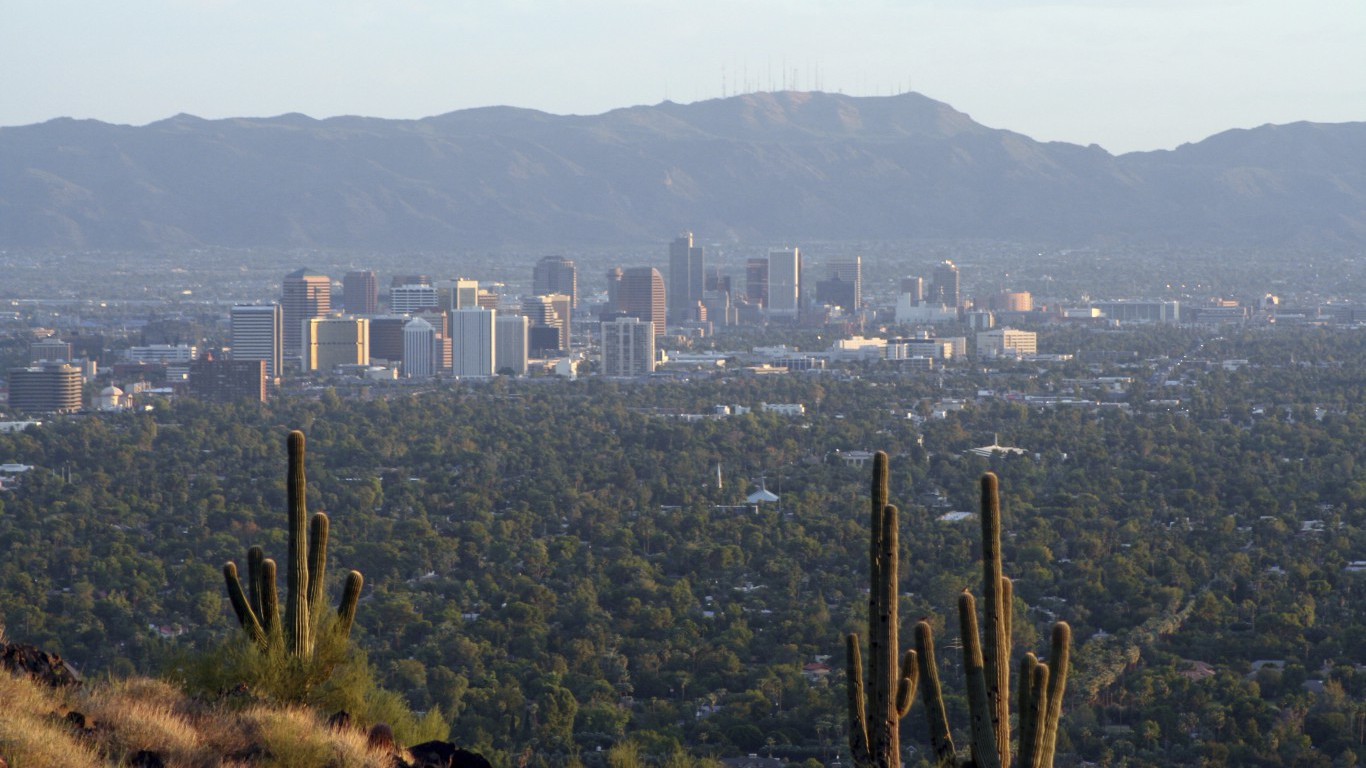
16. Phoenix-Mesa-Scottsdale, AZ
> High ozone days per year: 38.8
> Number of days with unhealthy particle pollution: 7.8
> People with asthma: 423,165
> Population: 4,661,537

15. Chicago-Naperville-Elgin, IL-IN-WI
> High ozone days per year: 43.2
> Number of days with unhealthy particle pollution: 5.7
> People with asthma: 792,811
> Population: 9,512,968
[in-text-ad]
14. Madera, CA
> High ozone days per year: 43.5
> Number of days with unhealthy particle pollution: 17.5
> People with asthma: 12,039
> Population: 154,697
 24/7 Wall St.
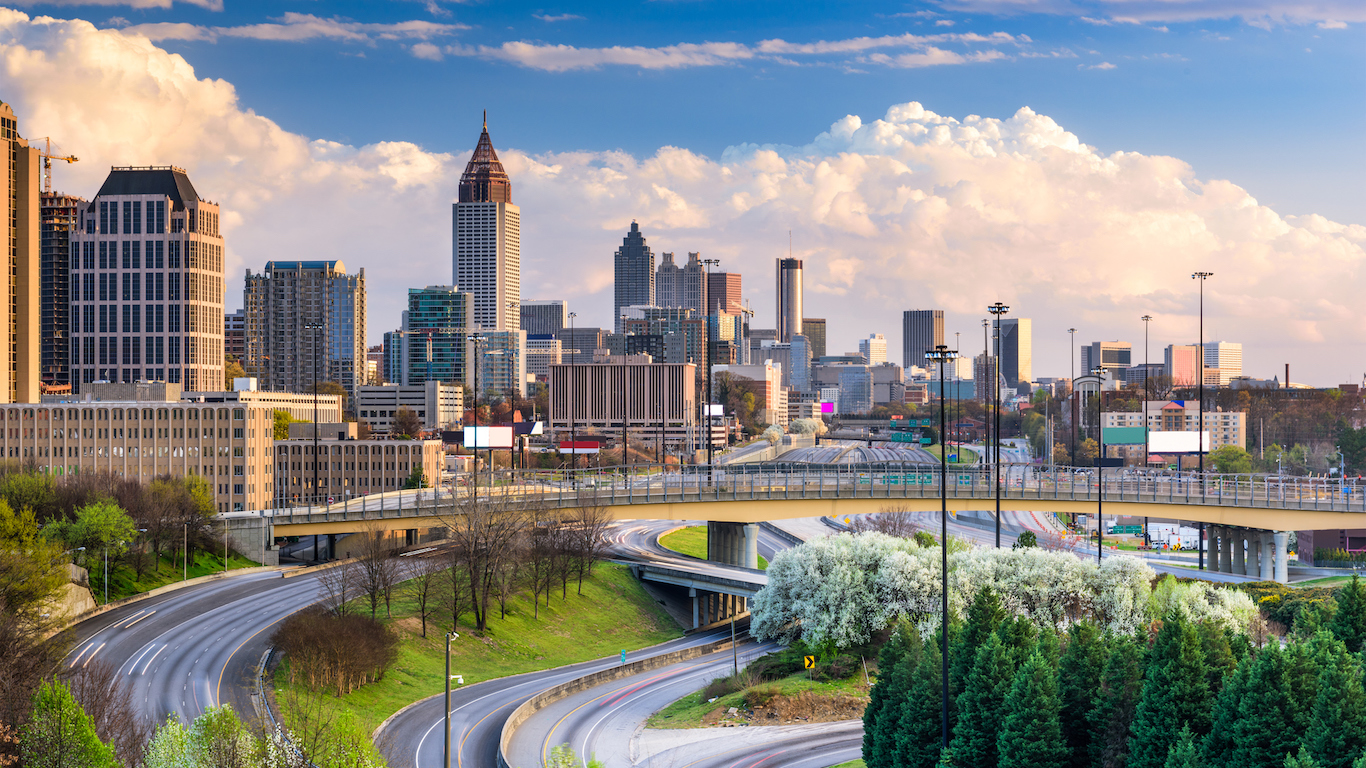
13. Atlanta-Sandy Springs-Roswell, GA
> High ozone days per year: 43.7
> Number of days with unhealthy particle pollution: 2.2
> People with asthma: 391,797
> Population: 5,790,210
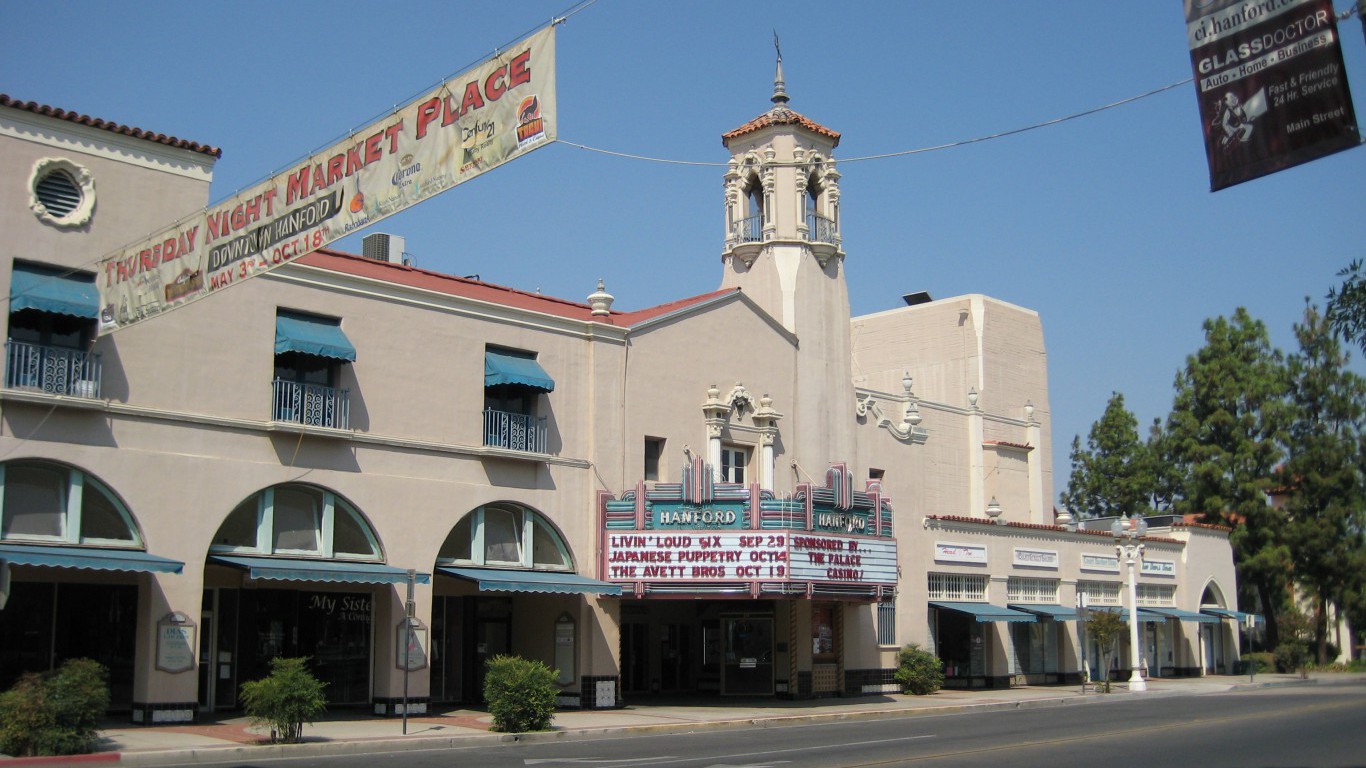
12. Hanford-Corcoran, CA
> High ozone days per year: 44.7
> Number of days with unhealthy particle pollution: 32.8
> People with asthma: 11,487
> Population: 149,785
[in-text-ad-2]

11. Houston-The Woodlands-Sugar Land, TX
> High ozone days per year: 44.8
> Number of days with unhealthy particle pollution: 1.0
> People with asthma: 448,435
> Population: 6,772,470

10. Denver-Aurora-Lakewood, CO
> High ozone days per year: 47.0
> Number of days with unhealthy particle pollution: 4.2
> People with asthma: 237,872
> Population: 2,853,077
[in-text-ad]

9. Philadelphia-Camden-Wilmington, PA-NJ-DE-MD
> High ozone days per year: 65.2
> Number of days with unhealthy particle pollution: 4.2
> People with asthma: 544,040
> Population: 6,070,500
 24/7 Wall St.
8. Dallas-Fort Worth-Arlington, TX
> High ozone days per year: 65.3
> Number of days with unhealthy particle pollution: 0.0
> People with asthma: 551,321
> Population: 7,232,599
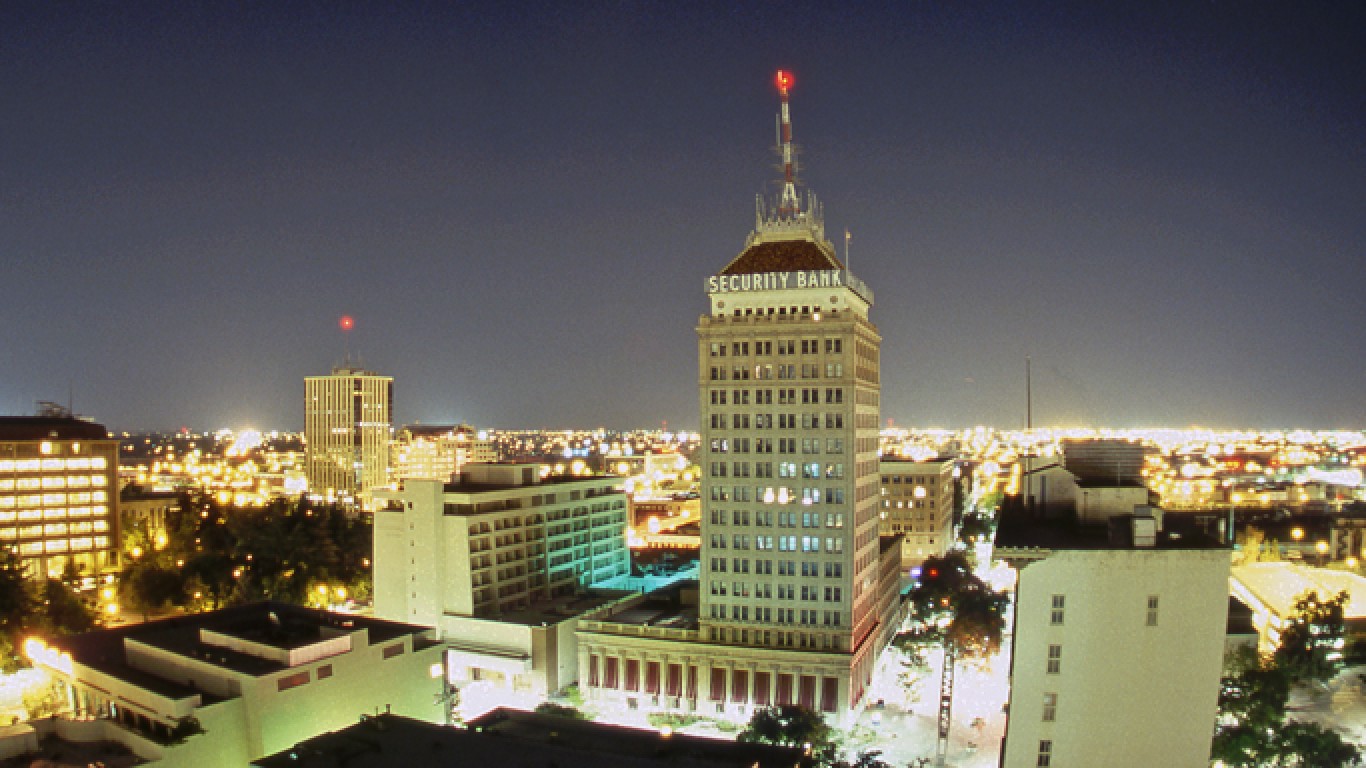
7. Fresno, CA
> High ozone days per year: 92.7
> Number of days with unhealthy particle pollution: 30.2
> People with asthma: 75,782
> Population: 979,915
[in-text-ad-2]

6. New York-Newark-Jersey City, NY-NJ-PA
> High ozone days per year: 94.2
> Number of days with unhealthy particle pollution: 3.0
> People with asthma: 1,647,547
> Population: 20,153,634

5. Visalia-Porterville, CA
> High ozone days per year: 96.8
> Number of days with unhealthy particle pollution: 9.5
> People with asthma: 35,563
> Population: 460,437
[in-text-ad]
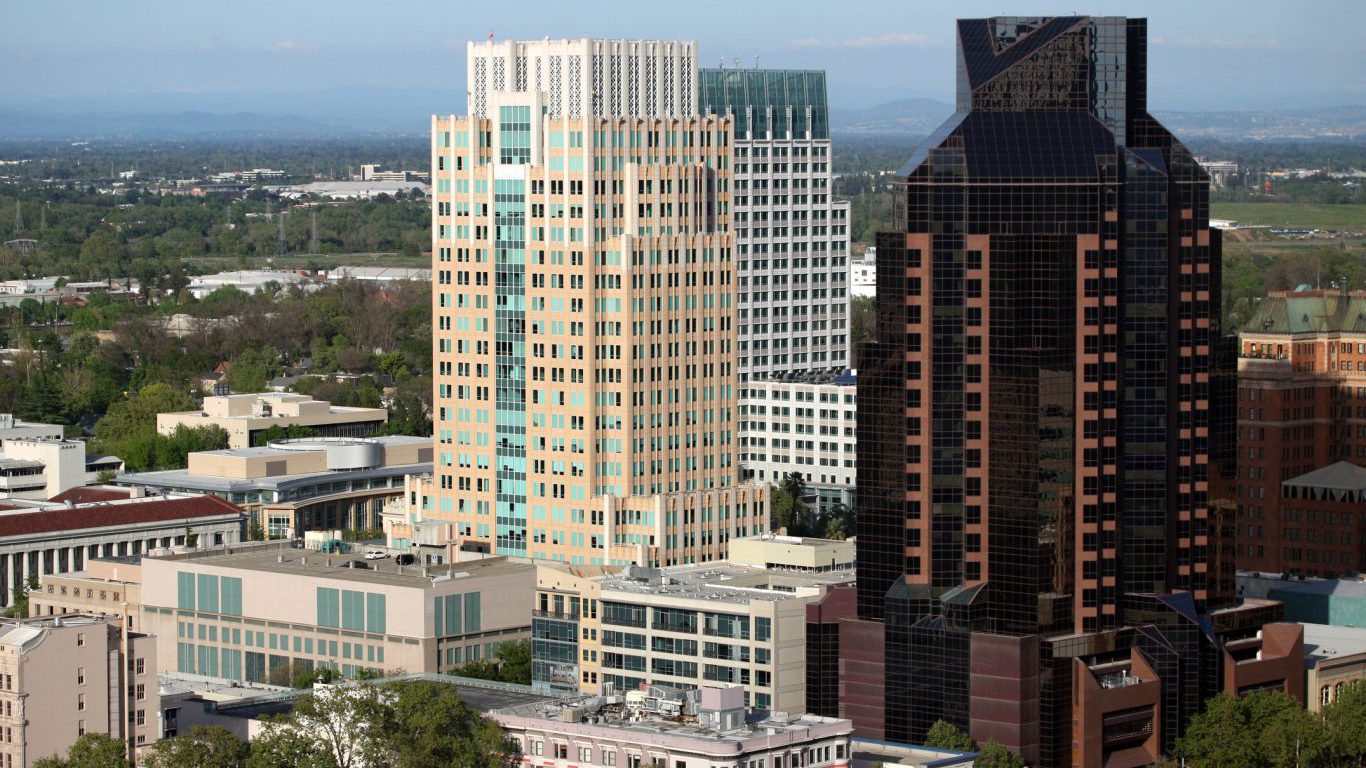
4. Sacramento–Roseville–Arden-Arcade, CA
> High ozone days per year: 101.5
> Number of days with unhealthy particle pollution: 6.8
> People with asthma: 179,666
> Population: 2,296,418
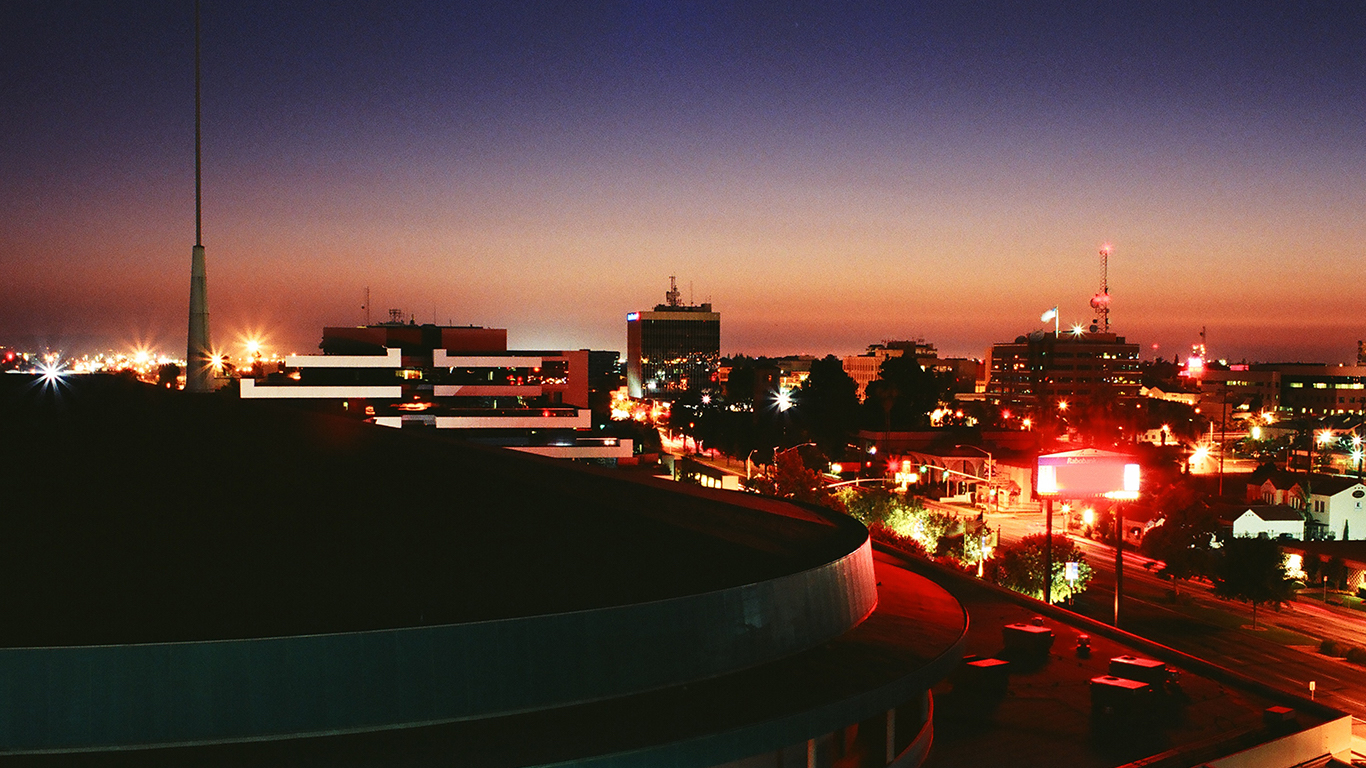
3. Bakersfield, CA
> High ozone days per year: 103.3
> Number of days with unhealthy particle pollution: 40.5
> People with asthma: 68,228
> Population: 884,788
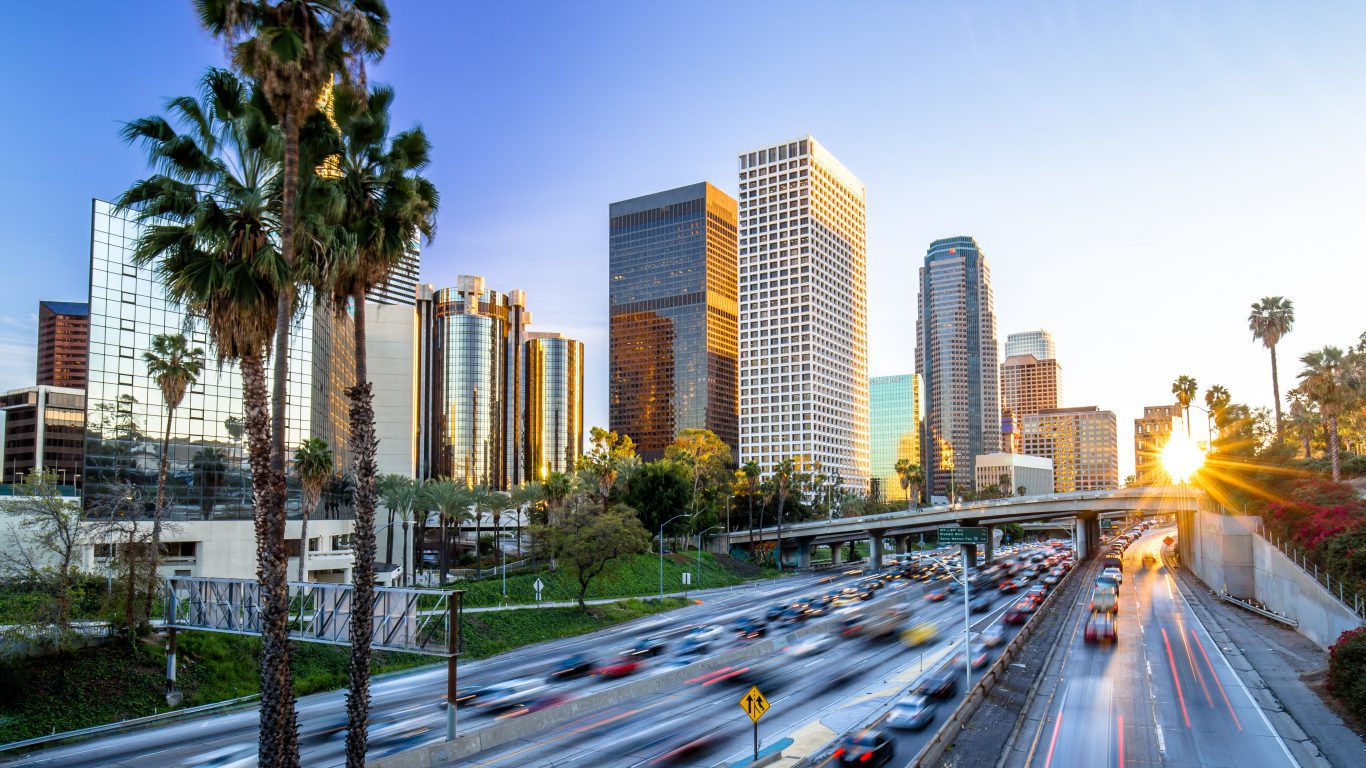
2. Los Angeles-Long Beach-Anaheim, CA
> High ozone days per year: 124.2
> Number of days with unhealthy particle pollution: 12.7
> People with asthma: 1,035,752
> Population: 13,310,447
[in-text-ad-2]
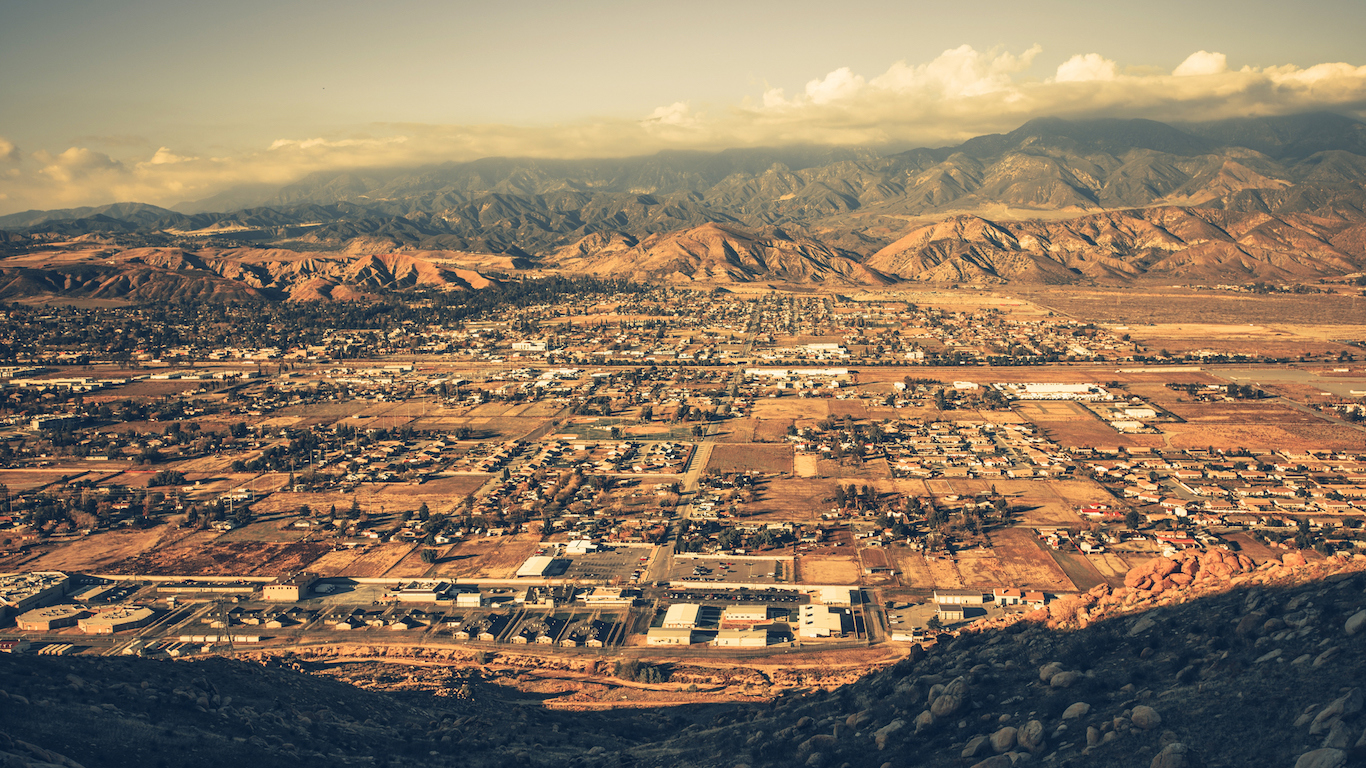
1. Riverside-San Bernardino-Ontario, CA
> High ozone days per year: 267.3
> Number of days with unhealthy particle pollution: 20.8
> People with asthma: 351,692
> Population: 4,527,837
Detailed Findings & Methodology
The Environmental Protection Agency reports that the most common causes of life-threatening ozone pollution include vehicle exhaust, chemical processing, and industrial production. Particulate pollution, which includes matter such as dirt, dust, and soot, can often have similar root causes, including manufacturing, construction, and automobile use. Given that the sources of both types of pollution can overlap, it is not surprising that the majority of the worst cities for ozone pollution are also among the 25 worst for either short or long-term particulate pollution.
Of the 25 most ozone polluted cities, 11 are in California, including seven of the eight worst. According to the ALA, California’s weather and geography complicate the strong effort the state continues to make to reduce emissions. In particular, California’s Central Valley traps air pollution generated by its major western cities. Of the 11 cities in the state with the worst ozone pollution, almost all are in the Central Valley.
To identify the 25 most polluted U.S. cities, 24/7 Wall St. reviewed the metropolitan statistical areas with the highest levels of ozone pollution, measured in days in a year when the concentration of ozone, or smog, exceeded the EPA standard from the ALA’s 2018 “State of the Air 2018” report. Short-term particle pollution, which is measured in days with excessive particle pollution levels each year and long-term particle pollution, expressed as the annual average concentration of particulate matter, as well as the number of area residents with asthma, including the number of adults and the number of pediatric cases of the disease, also came from the ALA. The incidence of cardiovascular disease and the number of residents who have been diagnosed with chronic obstructive pulmonary disease (COPD) at some point in their lives also came from the ALA.
Travel Cards Are Getting Too Good To Ignore (sponsored)
Credit card companies are pulling out all the stops, with the issuers are offering insane travel rewards and perks.
We’re talking huge sign-up bonuses, points on every purchase, and benefits like lounge access, travel credits, and free hotel nights. For travelers, these rewards can add up to thousands of dollars in flights, upgrades, and luxury experiences every year.
It’s like getting paid to travel — and it’s available to qualified borrowers who know where to look.
We’ve rounded up some of the best travel credit cards on the market. Click here to see the list. Don’t miss these offers — they won’t be this good forever.
Thank you for reading! Have some feedback for us?
Contact the 24/7 Wall St. editorial team.
Latest from 24/7


Our expert who first called NVIDIA in 2009 is predicting 2025 will see a historic AI breakthrough.
You can follow him investing $500,000 of his own money on our top AI stocks for free.