
The U.S. is on the verge of a massive surge of retirement in the coming years. As of 2016, 14.3% of the population was aged 65 or older. That figure is expected to rise to over 20% in the next decade.
The rapidly-aging American population is currently changing the face of our economy, creating urgent need for new medical services, retirement communities, and recreational facilities and activities. For those millions of retiring Americans who are looking to find a place to live out their post-work years, a warm climate is often enough.
There are, however, many other considerations that seniors are keeping in mind when choosing a place to retire. 24/7 Wall St. identified the best cities for older Americans to retire based on an index of a dozen measures.
We included in our analysis the concentration of recreational facilities such as golf courses and bowling alleys, the presence of doctors and dentists, and retirement income. We also rewarded areas with already high concentrations of seniors, as they are likely indicative of older residents there finding peers and facilities tailored to them.
Based on these factors, 24/ Wall St. ranked the 30 best cities for older Americans.
Click here to see the best cities for older Americans.
Click here to see our methodology.
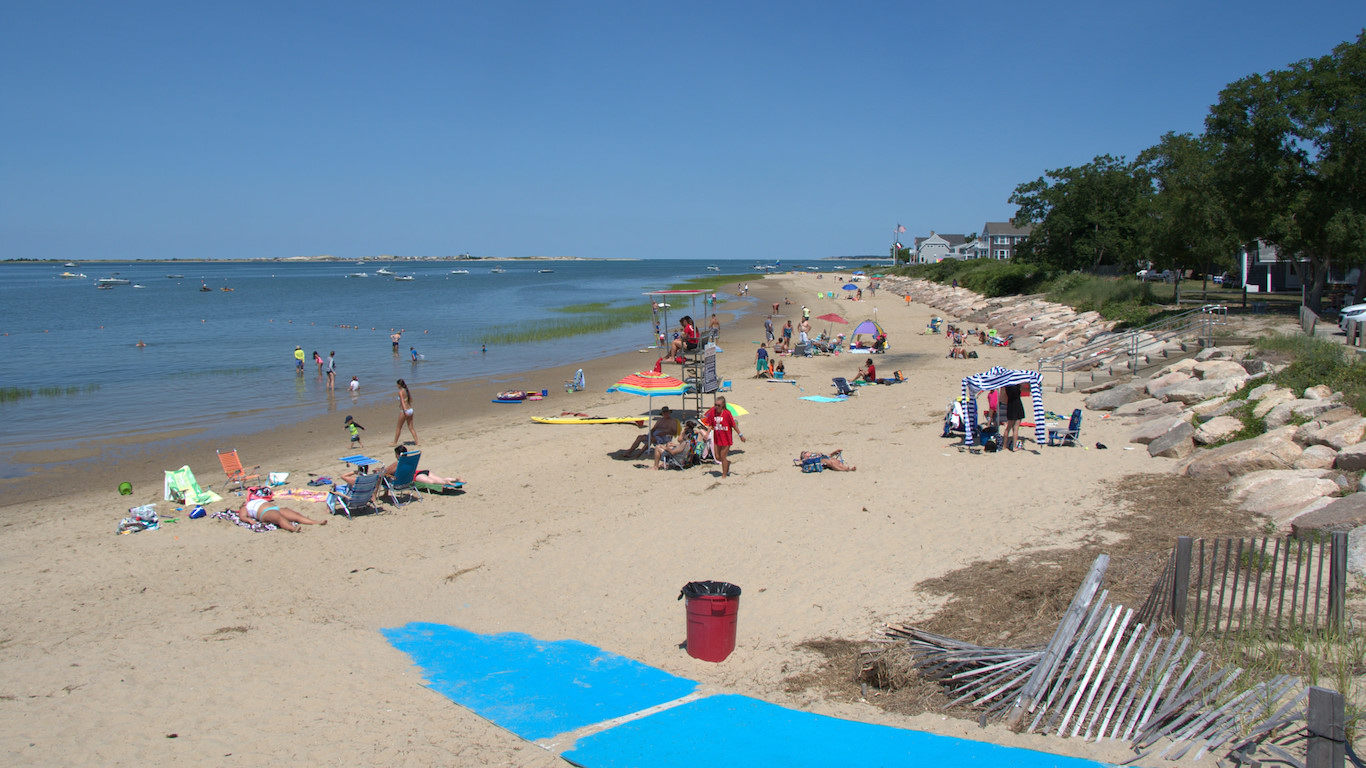
30. Barnstable Town, MA
> Share of population 65+: 27.9% (top 10%)
> Fitness centers per 100,000 people 65+: 70.3
> Physicians per 100,000 people 65+: 99.9 (top 10%)
> Average retirement income: $32,576 (top 10%)
[in-text-ad]

29. Appleton, WI
> Share of population 65+: 13.0%
> Fitness centers per 100,000 people 65+: 95.6 (top 25%)
> Physicians per 100,000 people 65+: 69.6
> Average retirement income: $20,693 (bottom 25%)
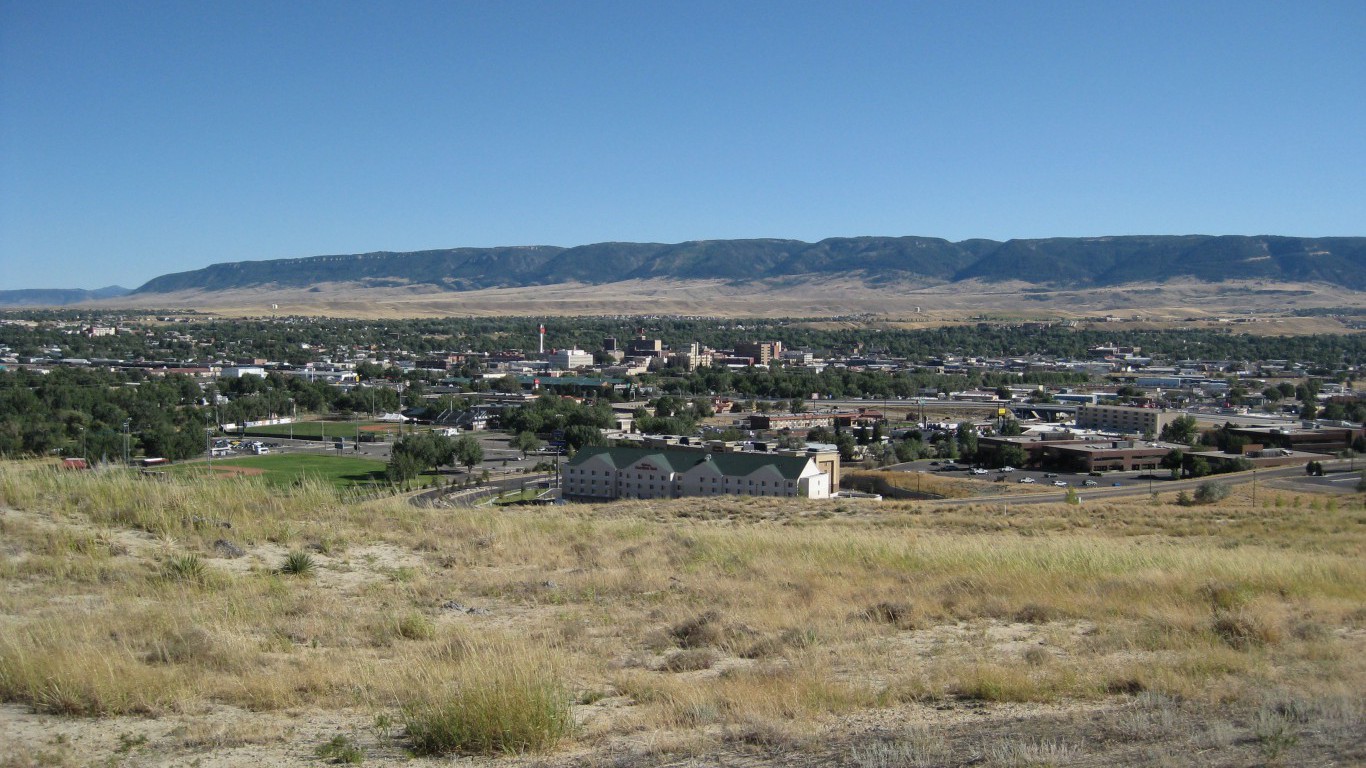
28. Casper, WY
> Share of population 65+: 12.8%
> Fitness centers per 100,000 people 65+: 125.3 (top 10%)
> Physicians per 100,000 people 65+: 72.8
> Average retirement income: $21,979

27. Parkersburg-Vienna, WV
> Share of population 65+: 18.8% (top 10%)
> Fitness centers per 100,000 people 65+: 58.6
> Physicians per 100,000 people 65+: 82.8
> Average retirement income: $18,722 (bottom 25%)
[in-text-ad-2]

26. Fond du Lac, WI
> Share of population 65+: 16.5%
> Fitness centers per 100,000 people 65+: 71.1
> Physicians per 100,000 people 65+: 54.8 (bottom 25%)
> Average retirement income: $19,068 (bottom 25%)

25. Ames, IA
> Share of population 65+: 10.5% (bottom 10%)
> Fitness centers per 100,000 people 65+: 166.7 (top 10%)
> Physicians per 100,000 people 65+: 70.0
> Average retirement income: $30,159 (top 25%)
[in-text-ad]
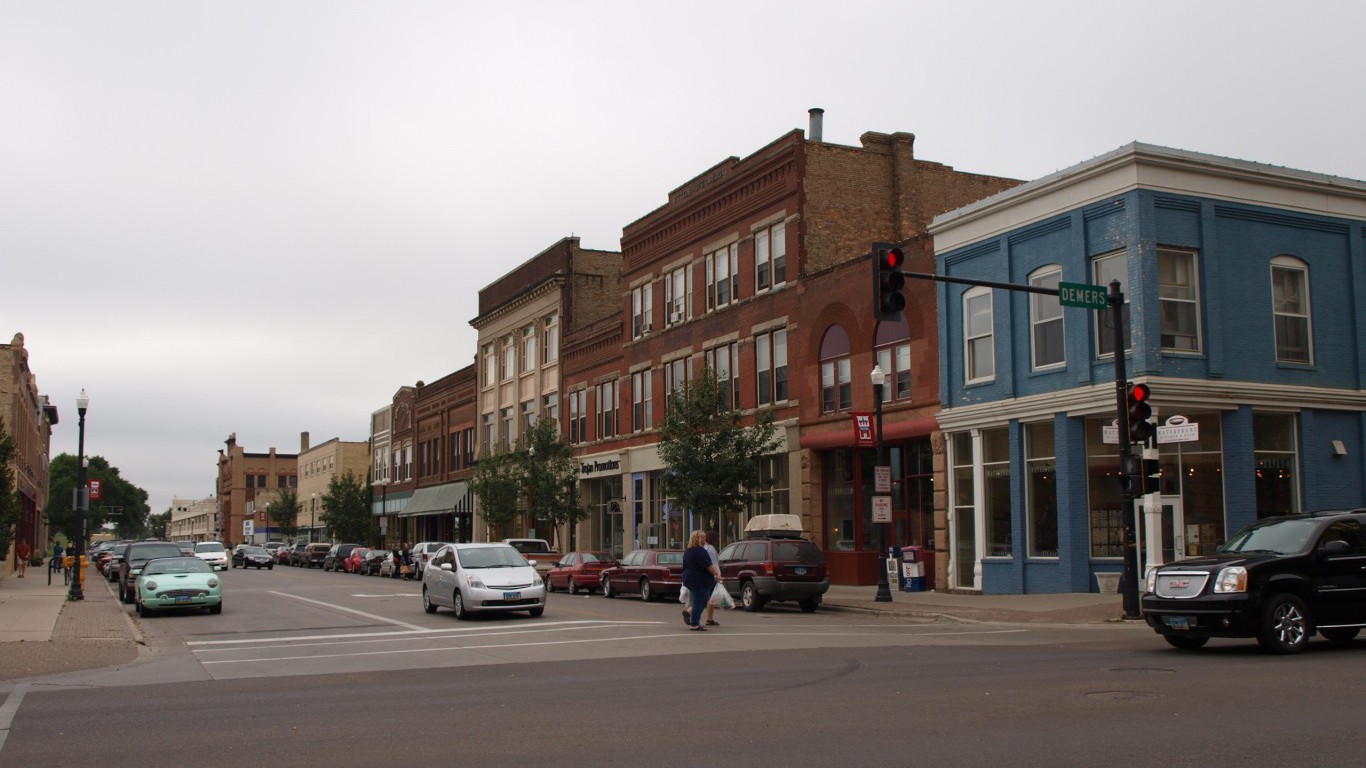
24. Grand Forks, ND-MN
> Share of population 65+: 12.9%
> Fitness centers per 100,000 people 65+: 60.2
> Physicians per 100,000 people 65+: 109.0 (top 10%)
> Average retirement income: $27,218 (top 25%)

23. Columbia, MO
> Share of population 65+: 10.3% (bottom 10%)
> Fitness centers per 100,000 people 65+: 187.5 (top 10%)
> Physicians per 100,000 people 65+: 111.0 (top 10%)
> Average retirement income: $27,008 (top 25%)

22. Morgantown, WV
> Share of population 65+: 12.4% (bottom 25%)
> Fitness centers per 100,000 people 65+: 99.3 (top 25%)
> Physicians per 100,000 people 65+: 101.9 (top 10%)
> Average retirement income: $22,237
[in-text-ad-2]
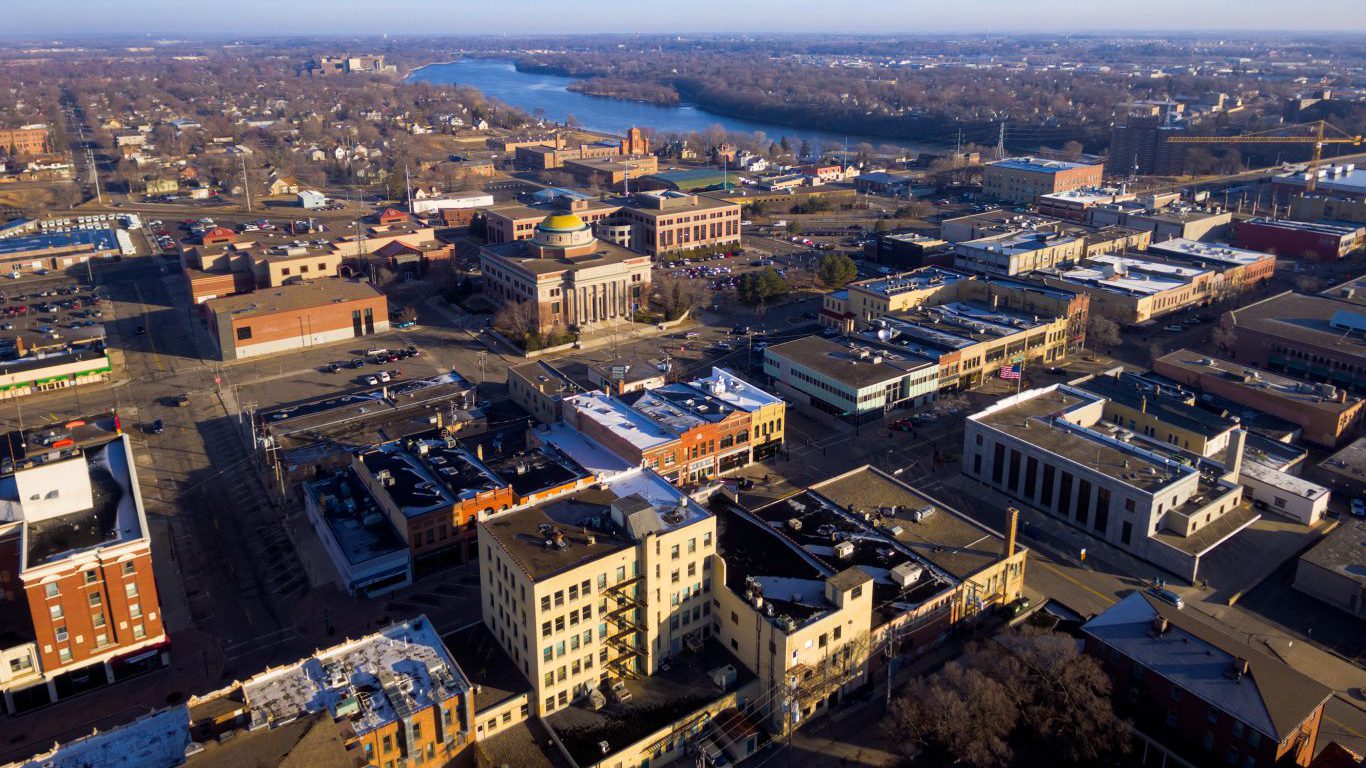
21. St. Cloud, MN
> Share of population 65+: 13.2%
> Fitness centers per 100,000 people 65+: 96.5 (top 25%)
> Physicians per 100,000 people 65+: 85.4
> Average retirement income: $20,428 (bottom 25%)

20. Eau Claire, WI
> Share of population 65+: 14.6%
> Fitness centers per 100,000 people 65+: 94.4 (top 25%)
> Physicians per 100,000 people 65+: 109.8 (top 10%)
> Average retirement income: $20,018 (bottom 25%)
[in-text-ad]

19. Duluth, MN-WI
> Share of population 65+: 17.0% (top 25%)
> Fitness centers per 100,000 people 65+: 69.4
> Physicians per 100,000 people 65+: 101.4 (top 10%)
> Average retirement income: $20,832 (bottom 25%)

18. Pittsfield, MA
> Share of population 65+: 21.1% (top 10%)
> Fitness centers per 100,000 people 65+: 52.2
> Physicians per 100,000 people 65+: 113.5 (top 10%)
> Average retirement income: $24,120

17. Bloomsburg-Berwick, PA
> Share of population 65+: 17.9% (top 25%)
> Fitness centers per 100,000 people 65+: 92.1 (top 25%)
> Physicians per 100,000 people 65+: 141.6 (top 10%)
> Average retirement income: $17,523 (bottom 10%)
[in-text-ad-2]

16. Dubuque, IA
> Share of population 65+: 16.1%
> Fitness centers per 100,000 people 65+: 89.8 (top 25%)
> Physicians per 100,000 people 65+: 78.3
> Average retirement income: $18,444 (bottom 10%)

15. Sheboygan, WI
> Share of population 65+: 16.2%
> Fitness centers per 100,000 people 65+: 53.4
> Physicians per 100,000 people 65+: 57.2 (bottom 25%)
> Average retirement income: $18,292 (bottom 10%)
[in-text-ad]
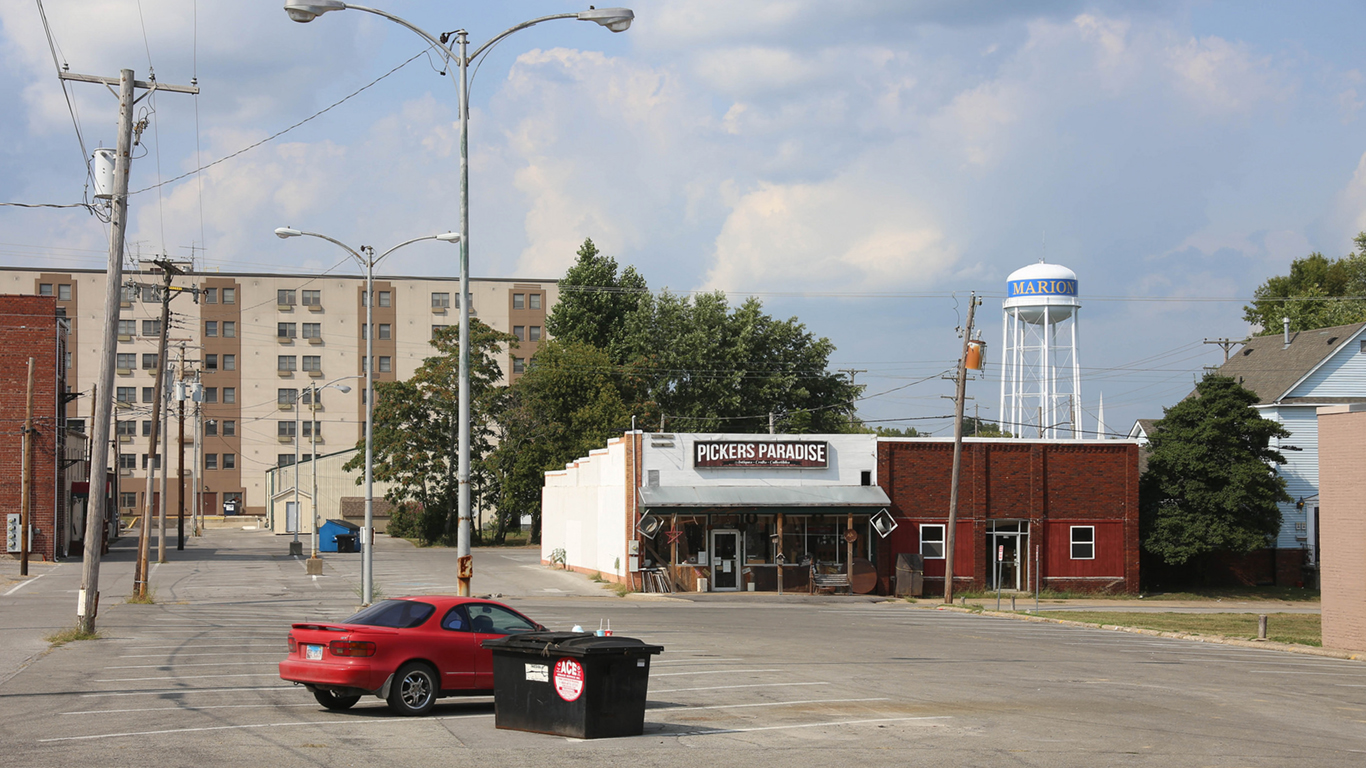
14. Carbondale-Marion, IL
> Share of population 65+: 15.5%
> Fitness centers per 100,000 people 65+: 66.5
> Physicians per 100,000 people 65+: 102.0 (top 10%)
> Average retirement income: $28,751 (top 25%)
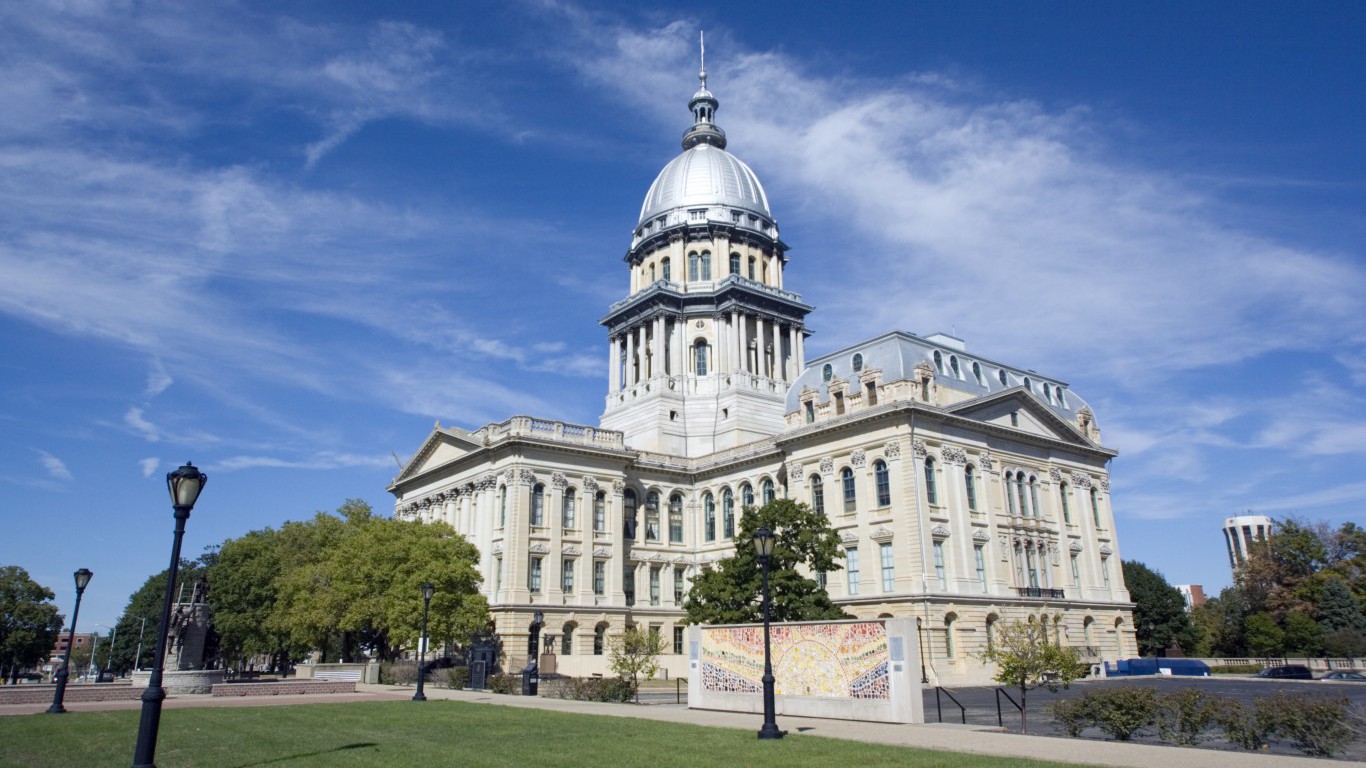
13. Springfield, IL
> Share of population 65+: 15.9%
> Fitness centers per 100,000 people 65+: 87.4 (top 25%)
> Physicians per 100,000 people 65+: 115.4 (top 10%)
> Average retirement income: $31,332 (top 10%)
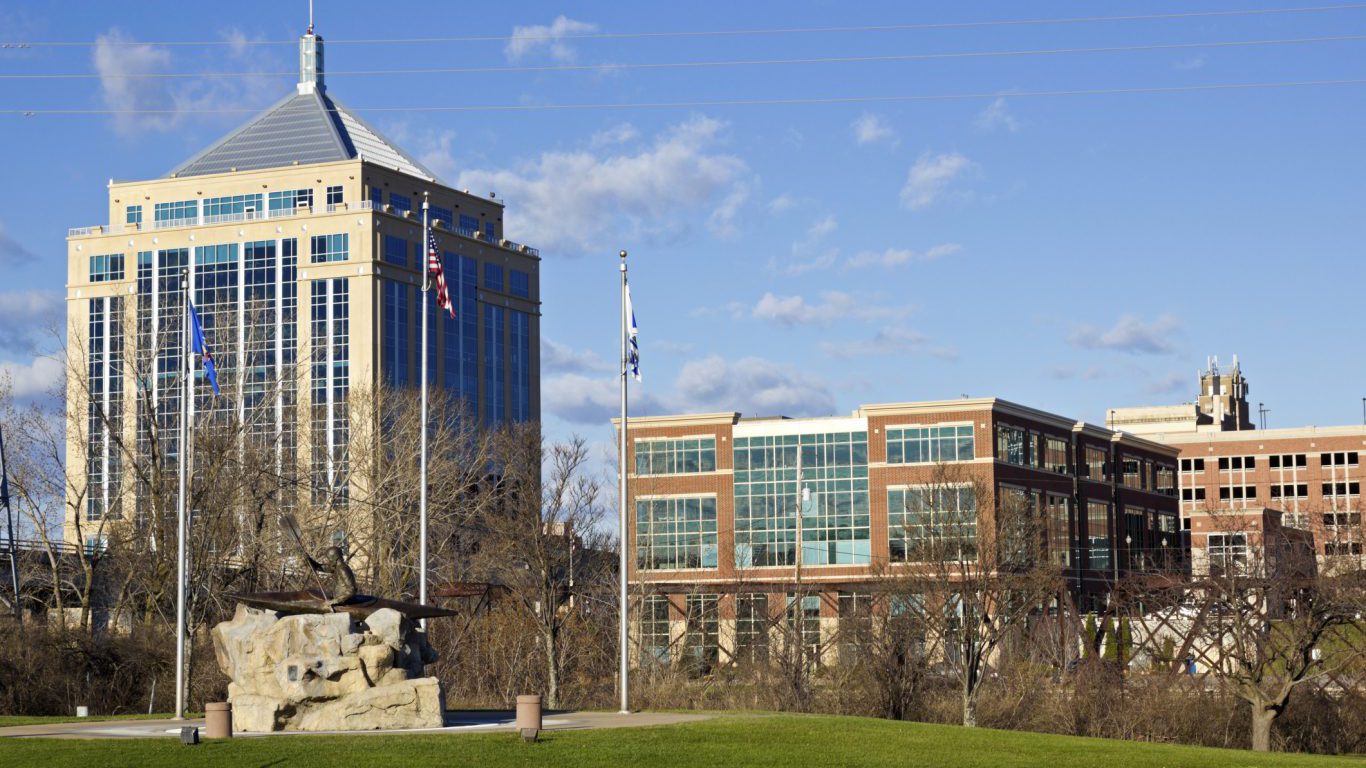
12. Wausau, WI
> Share of population 65+: 15.9%
> Fitness centers per 100,000 people 65+: 69.5
> Physicians per 100,000 people 65+: 90.7 (top 25%)
> Average retirement income: $18,537 (bottom 10%)
[in-text-ad-2]

11. Jefferson City, MO
> Share of population 65+: 14.7%
> Fitness centers per 100,000 people 65+: 64.2
> Physicians per 100,000 people 65+: 59.1
> Average retirement income: $22,660

10. Lima, OH
> Share of population 65+: 16.0%
> Fitness centers per 100,000 people 65+: 66.1
> Physicians per 100,000 people 65+: 73.3
> Average retirement income: $21,182
[in-text-ad]

9. Grand Island, NE
> Share of population 65+: 15.3%
> Fitness centers per 100,000 people 65+: 76.4
> Physicians per 100,000 people 65+: 65.4
> Average retirement income: $19,041 (bottom 25%)
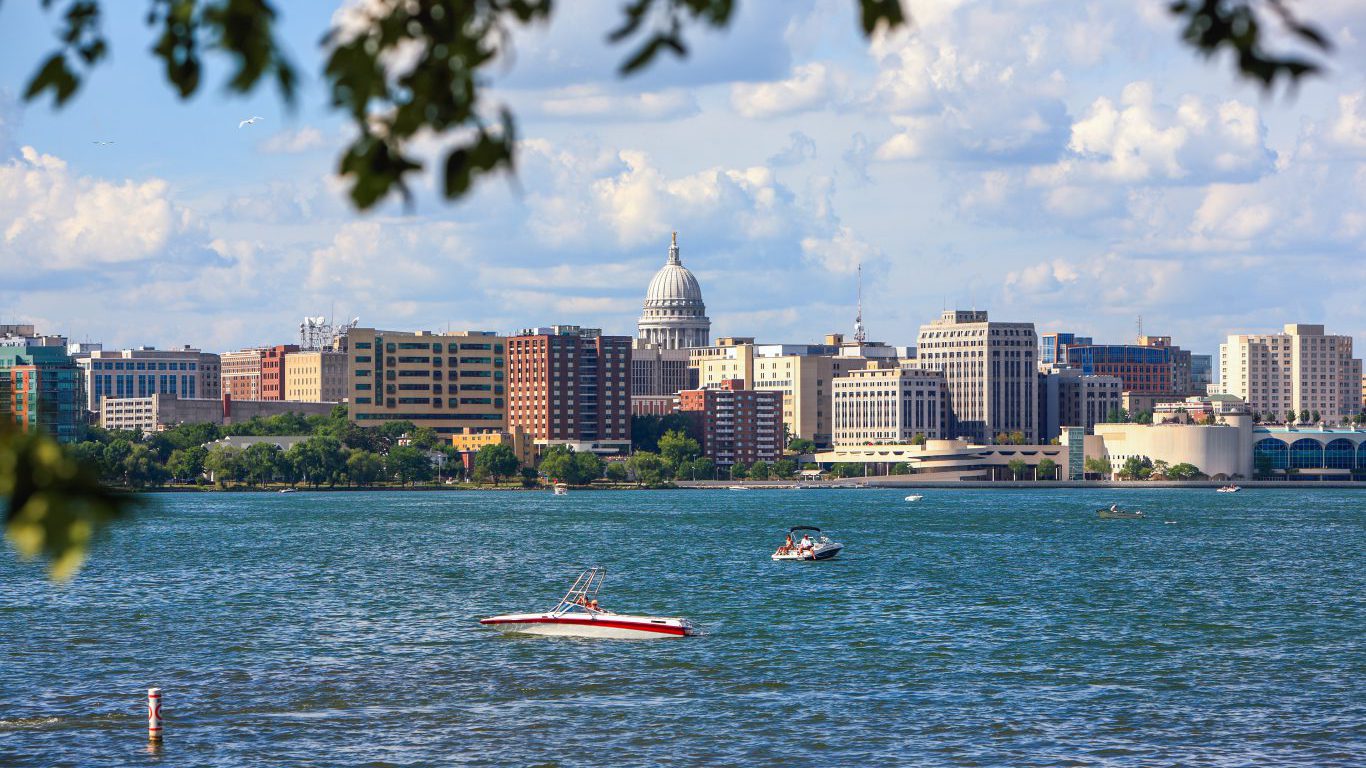
8. Madison, WI
> Share of population 65+: 12.5% (bottom 25%)
> Fitness centers per 100,000 people 65+: 154.1 (top 10%)
> Physicians per 100,000 people 65+: 112.6 (top 10%)
> Average retirement income: $28,360 (top 25%)

7. La Crosse-Onalaska, WI-MN
> Share of population 65+: 15.3%
> Fitness centers per 100,000 people 65+: 119.1 (top 10%)
> Physicians per 100,000 people 65+: 132.9 (top 10%)
> Average retirement income: $20,613 (bottom 25%)
[in-text-ad-2]

6. Waterloo-Cedar Falls, IA
> Share of population 65+: 15.7%
> Fitness centers per 100,000 people 65+: 74.9
> Physicians per 100,000 people 65+: 81.8
> Average retirement income: $18,915 (bottom 25%)
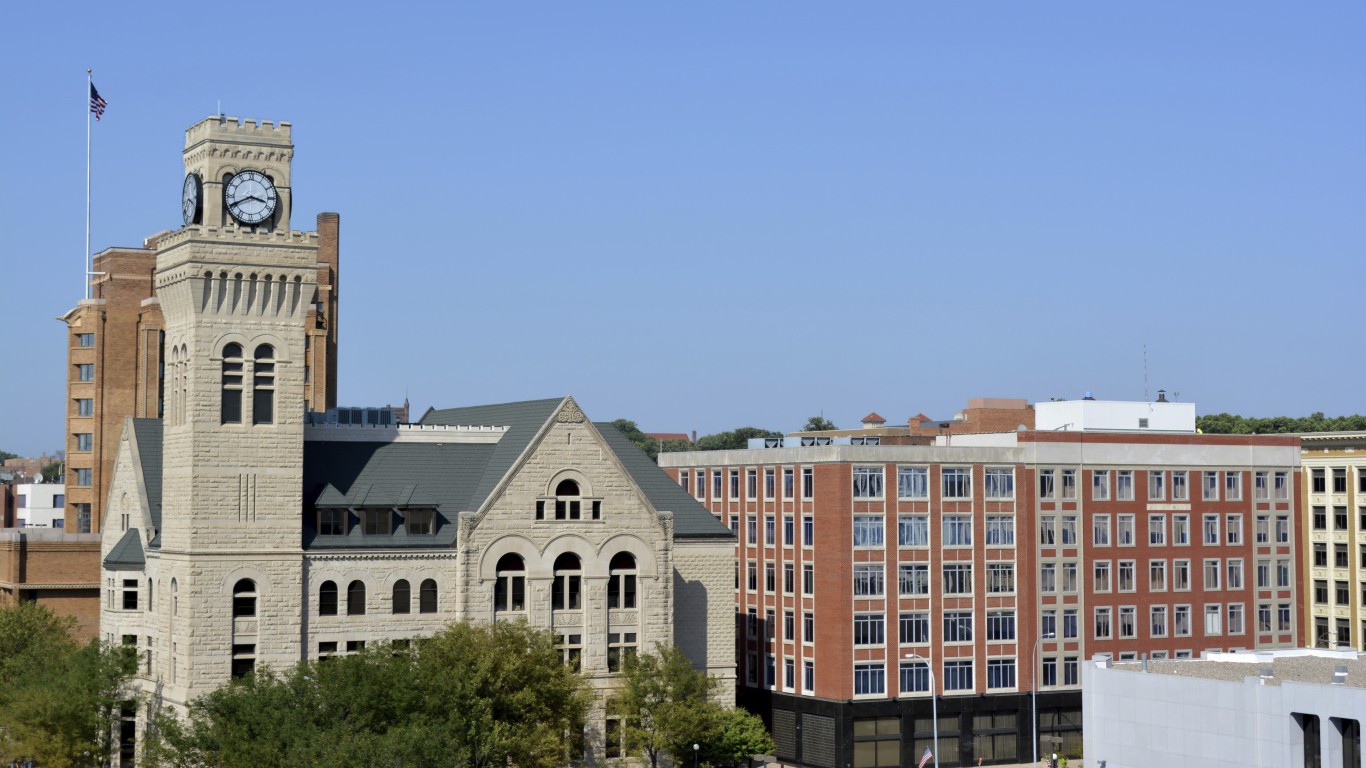
5. Sioux City, IA-NE-SD
> Share of population 65+: 14.6%
> Fitness centers per 100,000 people 65+: 65.2
> Physicians per 100,000 people 65+: 53.0 (bottom 25%)
> Average retirement income: $18,361 (bottom 10%)
[in-text-ad]
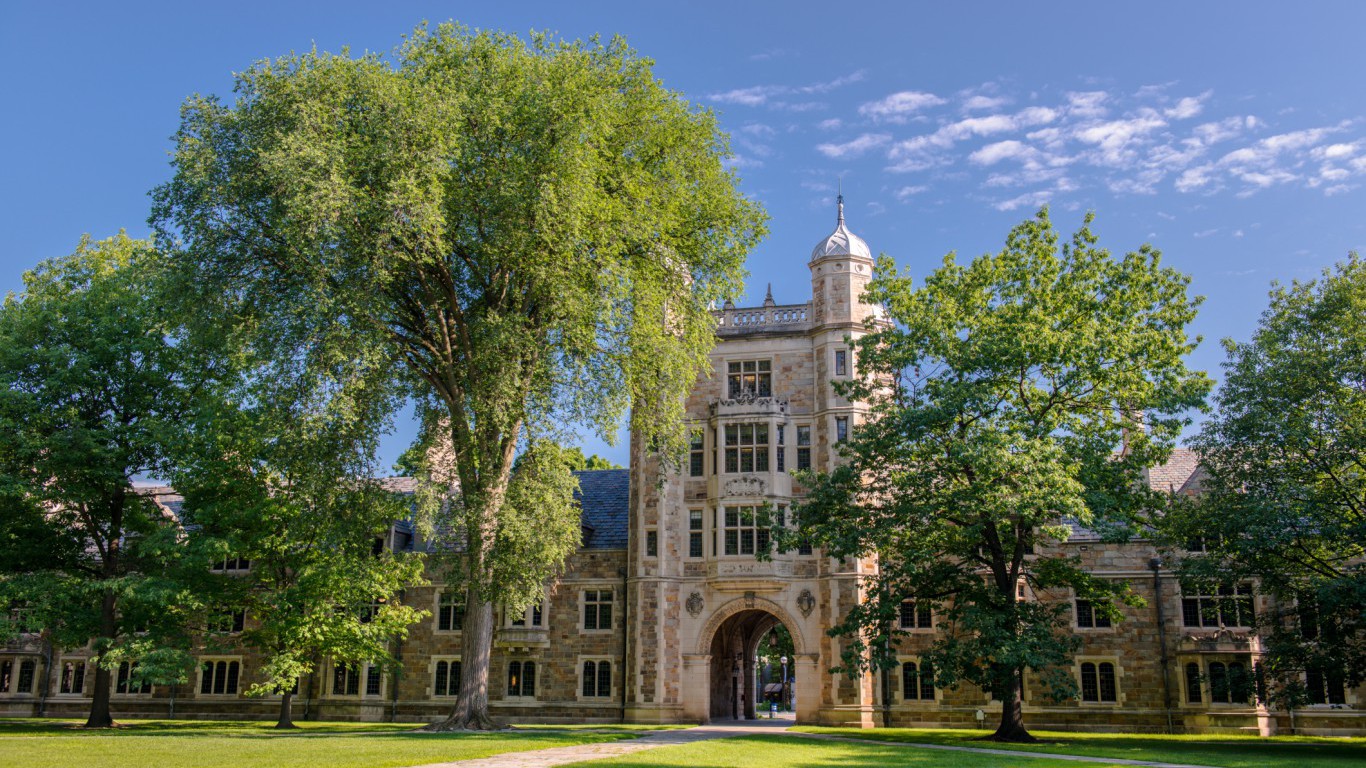
4. Ann Arbor, MI
> Share of population 65+: 11.8% (bottom 25%)
> Fitness centers per 100,000 people 65+: 118.9 (top 10%)
> Physicians per 100,000 people 65+: 174.7 (top 10%)
> Average retirement income: $28,981 (top 25%)

3. Sioux Falls, SD
> Share of population 65+: 11.8% (bottom 25%)
> Fitness centers per 100,000 people 65+: 142.3 (top 10%)
> Physicians per 100,000 people 65+: 102.5 (top 10%)
> Average retirement income: $22,963

2. Iowa City, IA
> Share of population 65+: 10.7% (bottom 10%)
> Fitness centers per 100,000 people 65+: 116.5 (top 10%)
> Physicians per 100,000 people 65+: 163.5 (top 10%)
> Average retirement income: $25,766
[in-text-ad-2]

1. Rochester, MN
> Share of population 65+: 14.8%
> Fitness centers per 100,000 people 65+: 62.7
> Physicians per 100,000 people 65+: 175.1 (top 10%)
> Average retirement income: $26,217
Methodology
To identify the 20 best cities for older Americans, 24/7 Wall St. created an index based on indicators that best captured the social, health, and economic climate of each metropolitan statistical area specifically for the population 65 years and older. The number of institutions that are popular among this demographic (golf courses, fitness centers, bowling centers, and nursing care facilities) per 100,000 comes from the U.S Census’ County Business Patterns for 2016. Primary care physicians, dentists, and social associations per 100,000, as well as the percentages of adults who report fair or poor health, come from the County Health Rankings & Roadmaps, a Robert Wood Johnson Foundation and University of Wisconsin Population Health Institute joint program. Mean retirement income, population living in poverty, median monthly home ownership costs, and gross rent for the population 65 years and over are from the U.S Census Bureau’s American Community Survey 1-year estimates for 2016.
Thank you for reading! Have some feedback for us?
Contact the 24/7 Wall St. editorial team.
 24/7 Wall St.
 24/7 Wall St.
 24/7 Wall St.


