Special Report
The Most Dangerous City in Every State
Published:
Last Updated:

Since America’s violent crime rate hit a half-century peak in 1991 — when the FBI logged more than 1.9 million incidents in total about 758 for every 100,000 Americans — this measure has steadily declined almost every year. In 2016, the country’s violent crime rate was barely half that, at 386 incidents per 100,000 people.
The improvement in the nation’s safety has not been even, however, and some U.S. cities today are far more dangerous than the country as a whole was in the early 1990s.
Some of the most violent U.S. cities are major metropolises that rack up hundreds of murders and tens of thousands of assaults each year. And others are small places, home to less than 50,000 people. While these smaller cities have lower violent crime totals, if their figures are adjusted for population size, these tiny places can be deemed more violent than most major cities.
Even states with relatively low violent crime rates are home to at least one city where violent crime is common. The states with higher rates, however, tend to have the most violent cities in the country. Alabama, Louisiana, Illinois, and Michigan, for example, all have cities whose violent crime rate is five times the national average or more. When the FBI tallies figures on violent crimes, that designation includes murders, rapes, robberies, and aggravated assaults.
Click here to see the most dangerous city in every state.
Click here to see our detailed findings and methodology.
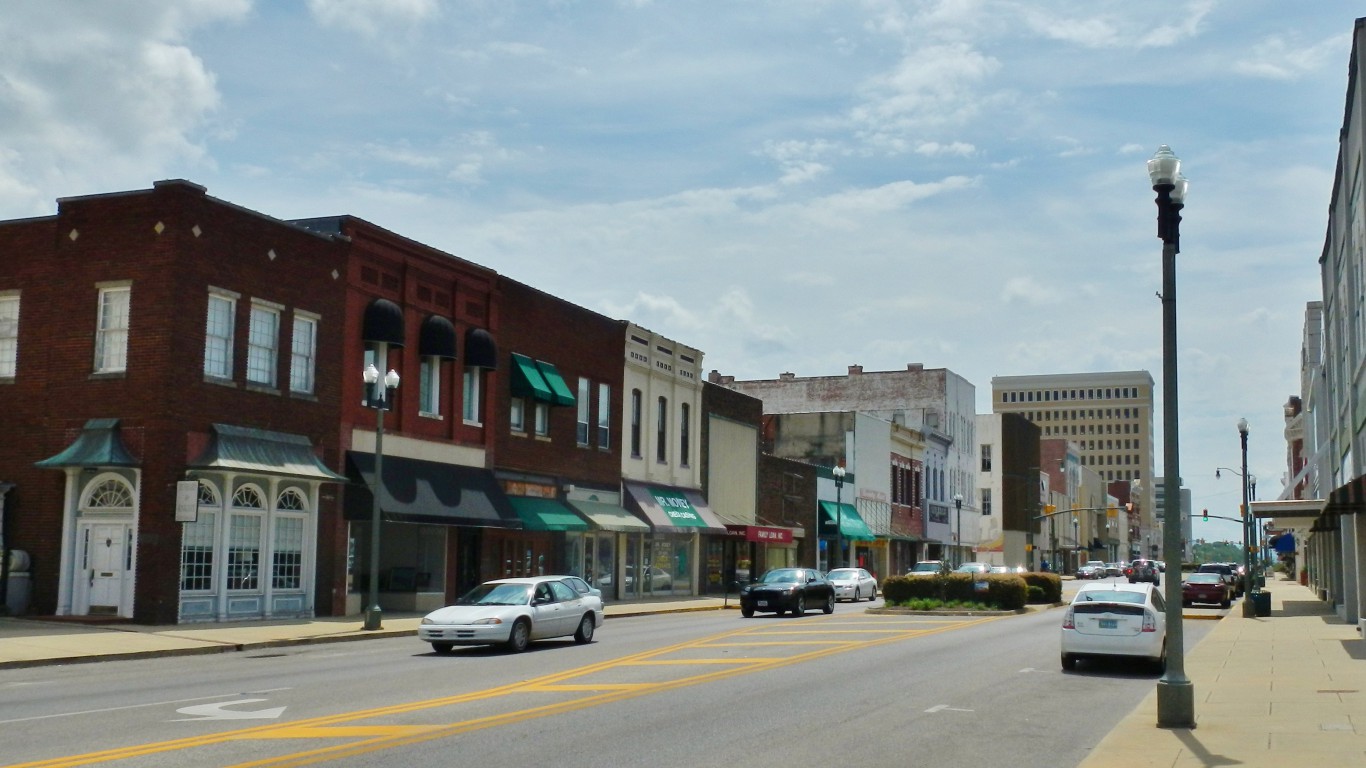
1. Anniston, Alabama
> City violent crime rate: 3,310 per 100,000
> State violent crime rate: 532 per 100,000 (7th highest)
> City poverty rate: 32.1%
> City unemployment rate: 5.9%
Anniston, the most violent city in Alabama, also ranks as the most violent in the United States. Violent crimes are an FBI designation consisting of murder, rape, robbery, and aggravated assault. There were 3,310 violent crimes in Anniston for every 100,000 residents in 2016, nearly nine times the U.S. violent crime rate of 386 incidents per 100,000 people that year and more than six times the state violent crime rate of 532 per 100,000.
As is the case nationwide, aggravated assault accounted for the vast majority of violent crimes in Anniston in 2016.
[in-text-ad]

2. Anchorage, Alaska
> City violent crime rate: 1,144 per 100,000
> State violent crime rate: 804 per 100,000 (the highest)
> City poverty rate: 8.1%
> City unemployment rate: 6.0%
Anchorage is the most dangerous city in the most dangerous state. There were 804 reported incidents of violent crime in Alaska for every 100,000 residents in 2016, more than double the U.S. violent crime rate of 386 per 100,000 the same year. In Anchorage, there were 1,144 violent crimes for every 100,000 in 2016.
Alaska’s high crime rate is driven largely by violence in Anchorage. About 57% of the state’s 5,966 reported incidents of violent crime in 2016 occurred within the city limits.
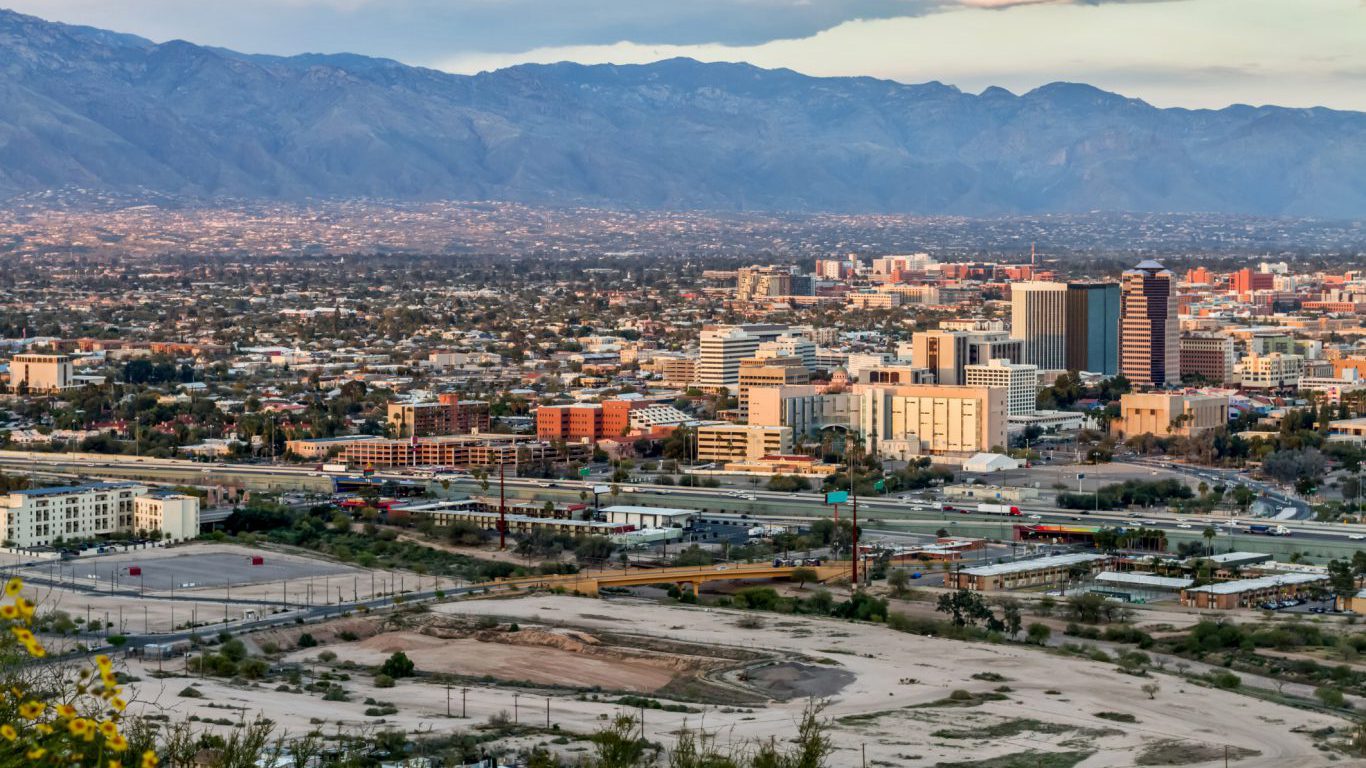
3. Tucson, Arizona
> City violent crime rate: 795 per 100,000
> State violent crime rate: 470 per 100,000 (12th highest)
> City poverty rate: 25.1%
> City unemployment rate: 4.7%
Driven largely by robbery and aggravated assault, Tucson’s violent crime rate is the highest of any city in Arizona. Property crime — an FBI designation comprising burglary, larceny, and motor vehicle theft — is also a problem in Tucson. There were 5,859 reported property crimes for every 100,000 people in the city in 2016, the most of any city in the state and more than double the statewide property crime rate of 2,451 per 100,000.
For a variety of reasons, low-income areas are prone to higher crime rates, and in Tucson, more than one in every four residents live in poverty, well above the statewide poverty rate of 17.7% and the nationwide rate of 15.1%.
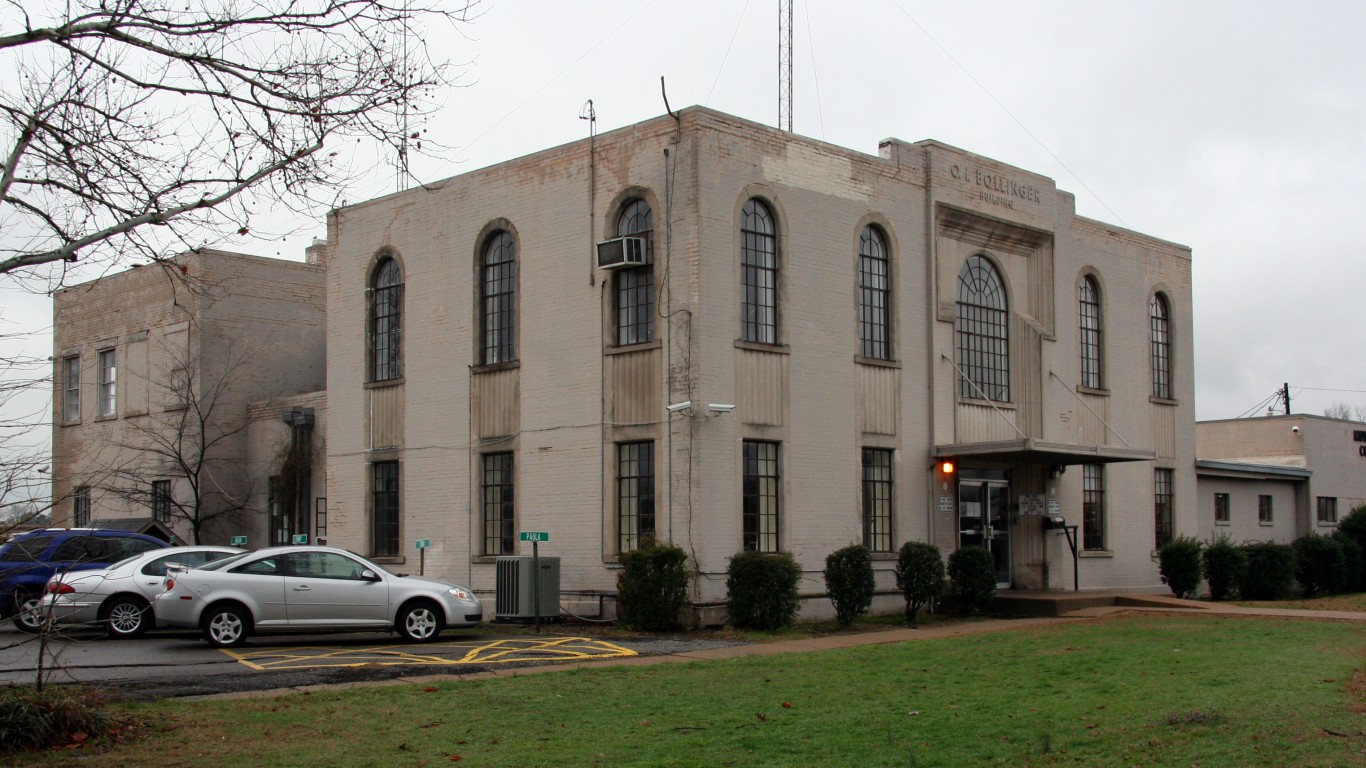
4. West Memphis, Arkansas
> City violent crime rate: 1,858 per 100,000
> State violent crime rate: 551 per 100,000 (6th highest)
> City poverty rate: 31.3%
> City unemployment rate: 4.9%
Across the Mississippi River from Memphis, Tennessee, is the small city of West Memphis, Arkansas. West Memphis shares more than just a name and a border with the Tennessee metropolis — it has one of the highest violent crime rates in the country. The city of less than 25,000 people had close to 500 reported incidents of violent crime, and adjusting for population had the seventh highest violent crime rate of any city. Memphis, Tennessee, has the ninth highest violent crime rate in the country, and both cities have the highest violent crime rate in their respective states.
[in-text-ad-2]

5. Barstow, California
> City violent crime rate: 1,511 per 100,000
> State violent crime rate: 445 per 100,000 (15th highest)
> City poverty rate: 36.7%
> City unemployment rate: N/A
Of the nearly 300 cities in California, Barstow is the most dangerous. There were 1,511 violent crimes in Barstow for every 100,000 people in 2016, more than three times the statewide violent crime rate of 445 per 100,000. Local authorities point to a range of causes for the high crime rates in the region, including drugs and insufficient resources to reintroduce ex-convicts into society.
Like many of the cities on this list, a large share of Barstow residents are poor. Some 36.7% of area residents live below the poverty line, more than double the 15.8% state poverty rate and the 15.1% U.S. rate.

6. Pueblo, Colorado
> City violent crime rate: 983 per 100,000
> State violent crime rate: 343 per 100,000 (23rd lowest)
> City poverty rate: 25.1%
> City unemployment rate: 4.8%
Colorado’s violent crime rate of 343 incidents per 100,000 residents falls slightly below the national figure of 386 violent crimes per 100,000 Americans. The state has some of the safest places in the country, including Windsor, which has a violent crime rate of just 13 incidents per 100,000 people. Driving up Colorado’s violent crime rate is Pueblo, the state’s most dangerous city. Pueblo’s violent crime rate of 983 incidents per 100,000 residents is 89th worst of of the over 2,000 U.S. cities considered.
[in-text-ad]

7. Hartford, Connecticut
> City violent crime rate: 1,093 per 100,000
> State violent crime rate: 227 per 100,000 (5th lowest)
> City poverty rate: 31.9%
> City unemployment rate: 8.1%
Hartford is the only city in Connecticut with a violent crime rate above 1,000 incidents per 100,000 people. The most dangerous city in the state, Hartford’s violent crime rate is nearly five times the violent crime rate across Connecticut of 227 per 100,000.
Crime rates are often higher in low-income areas, and with a 31.9% poverty rate, Hartford is the poorest city in the state. In comparison, 10.1% of Connecticut residents and 15.1% of Americans nationwide live below the poverty line.
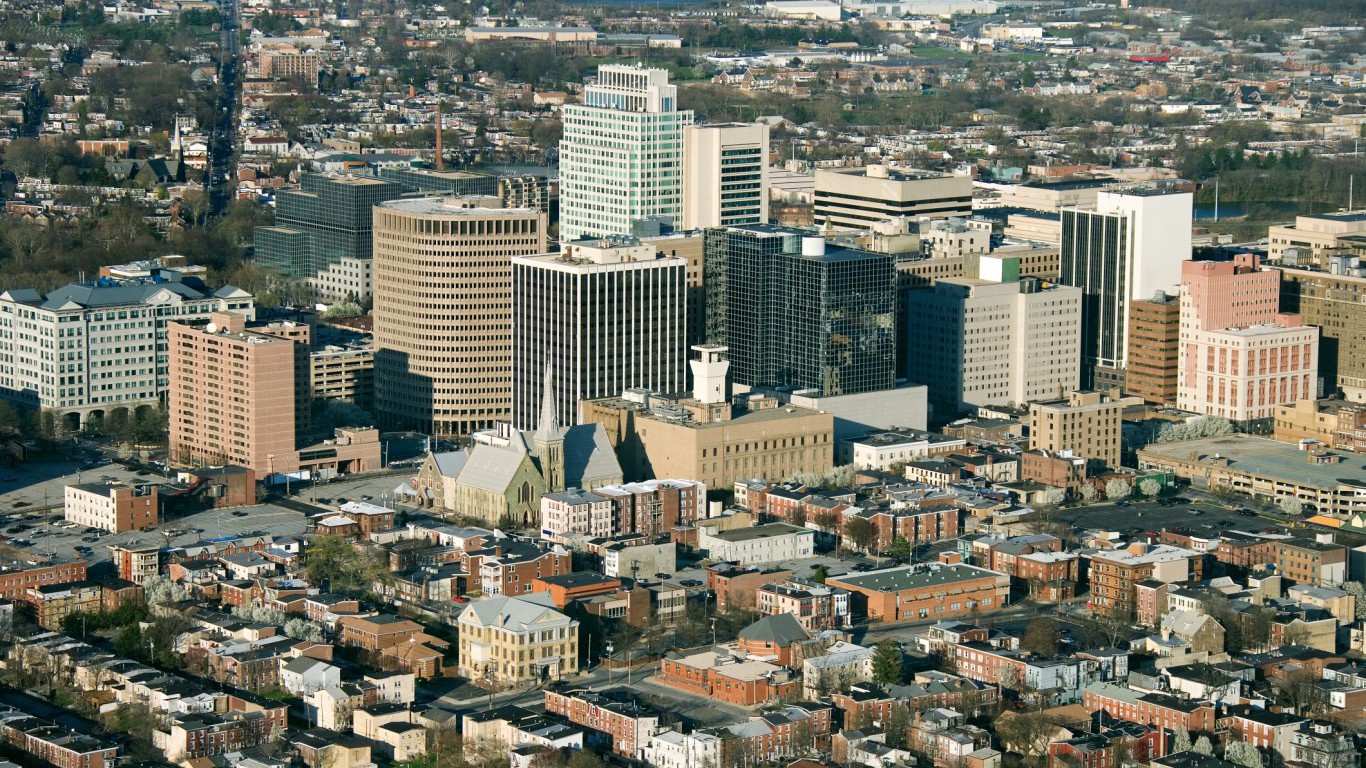
8. Wilmington, Delaware
> City violent crime rate: 1,780 per 100,000
> State violent crime rate: 509 per 100,000 (9th highest)
> City poverty rate: 26.1%
> City unemployment rate: 6.5%
Delaware is one of the few U.S. states without a major city. The most populous place in the state is Wilmington, a city of just 72,000 residents. Wilmington also happens to be Delaware’s most violent place, with the 12th highest violent crime rate in the country. The city had 26 reported homicides in 2017. Of the 80 places with at least 25 reported homicides last year, Wilmington is one of just five with a population of under 100,000.

9. Riviera Beach, Florida
> City violent crime rate: 1,385 per 100,000
> State violent crime rate: 430 per 100,000 (18th highest)
> City poverty rate: 23.6%
> City unemployment rate: 5.1%
Riviera Beach’s violent crime rate of 1,385 incidents per 100,000 is the highest of Florida’s more than 100 cities. The city is struggling with a recent uptick in violence tied to rivalries between local gangs and those in nearby West Palm Beach. Riveria Beach had nine murders in 2016, including a gang-related shooting death of a 15-year-old.
As has been the case nationwide, homicides comprised the smallest share of Riviera Beach’s violent crimes in 2016: The vast majority of its violent crimes in were aggravated assaults.
[in-text-ad-2]

10. Union City, Georgia
> City violent crime rate: 1,211 per 100,000
> State violent crime rate: 398 per 100,000 (21st highest)
> City poverty rate: 21.3%
> City unemployment rate: N/A
Union City is the most dangerous city in Georgia and one of the most unsafe in the United States. In 2016 Union City’s violent crime rate was 1,211 incidents per 100,000 residents, more than three times the country’s overall 386-per-100,000 rate and Georgia’s 398-per-100,000 rate.
According to criminologist John Roman, Violent crime tends to be more common in areas with high concentrations of idle young men lacking in opportunity, and a high poverty rate often indicates of a long-term dearth of economic opportunity. In 2016 21.3% of Union City’s population lived in poverty compared with 15.1% of the population in the United States and 17.8% of that in Georgia.

11. Honolulu, Hawaii
> City violent crime rate: 335 per 100,000
> State violent crime rate: 309 per 100,000 (21st lowest)
> City poverty rate: 12.1%
> City unemployment rate: 2.2%
With a 2016 violent crime rate of 309 incidents per 100,000 people, Hawaii is a relatively safe place. Even in Honolulu, the state’s most dangerous city, the violent crime rate of 335 incidents per 100,000 was well below the comparable 386-per-100,000 rate nationwide.
According to criminologist John Roman, states with relatively strict gun laws and isolated from regions with fewer firearm restrictions tend to be safer. Not only is Hawaii geographically isolated, but its gun laws are stricter than those in most other states.
[in-text-ad]

12. Idaho Falls, Idaho
> City violent crime rate: 424 per 100,000
> State violent crime rate: 230 per 100,000 (6th lowest)
> City poverty rate: 15.2%
> City unemployment rate: 2.8%
Idaho is a relatively safe state, and even its most dangerous city, Idaho Falls, is only slightly more dangerous than the U.S. as a whole. In 2016 Idaho Falls had a violent crime rate of 424 incidents per 100,000 inhabitants compared with the country’s rate that same year of 386 per 100,000. As has been true across the country, aggravated assault accounted for the majority of the city’s violence in 2016: Idaho Falls reported only one homicide.
13. East St. Louis, Illinois
> City violent crime rate: 2,828 per 100,000
> State violent crime rate: 436 per 100,000 (16th highest)
> City poverty rate: 44.7%
> City unemployment rate: 7.9%
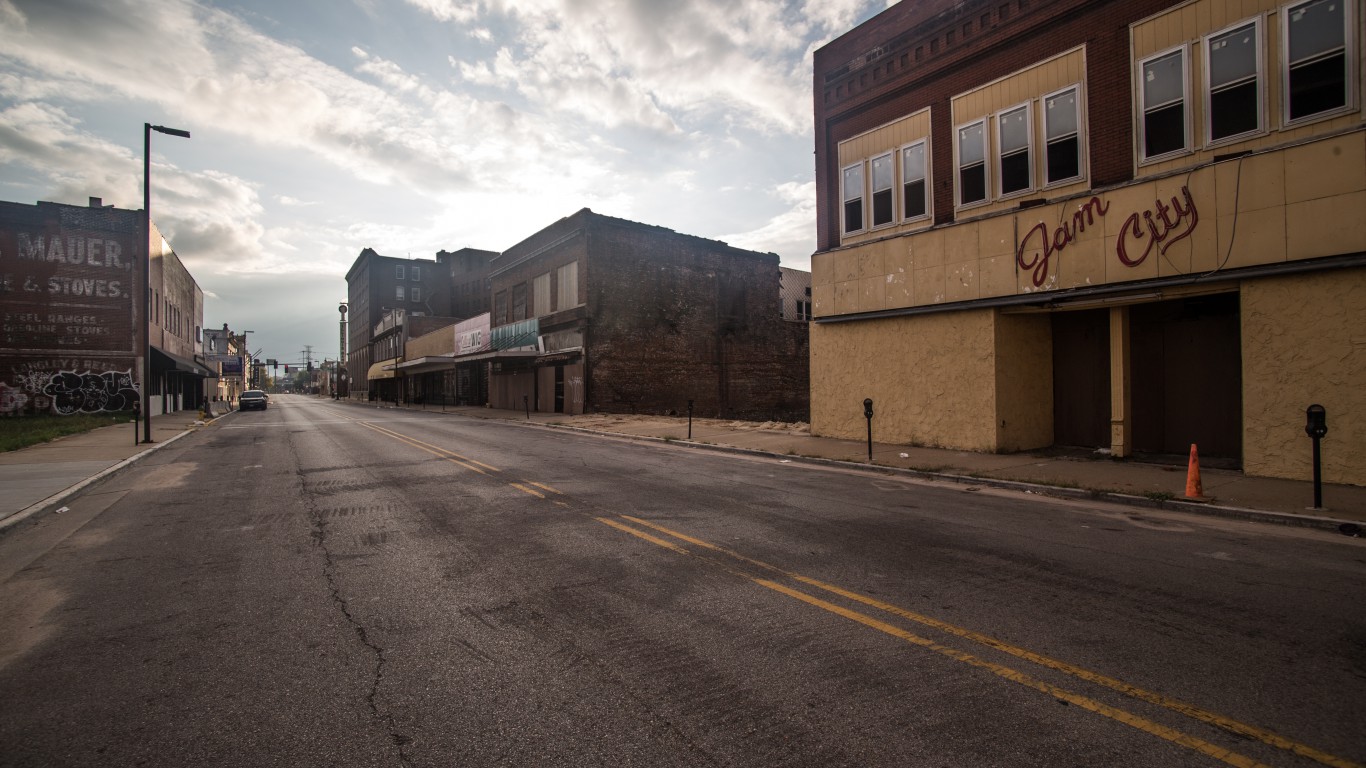
East St. Louis is the most violent city in Illinois and the country’s fourth most violent. In 2016 this Midwest city reported a violent crime rate of 2,828 incidents per 100,000 residents, more than six times the state’s rate for the year. Homicide accounts for a large share of the city’s violence: East St. Louis logged a 2016 murder rate of more than 100 murders per 100,000 residents, the highest rate of any U.S. city by a wide margin. As of the end 2017, less than one quarter of the city’s murders for that year had been solved. City officials have attributed the low clearance rate to its understaffed police force’s facing a steady year-over-year uptick in homicides.

14. Elkhart, Indiana
> City violent crime rate: 1,507 per 100,000
> State violent crime rate: 405 per 100,000 (20th highest)
> City poverty rate: 27.1%
> City unemployment rate: 2.9%
In 2016 Elkhart, Indiana, registered a violent crime rate of 1,507 incidents per 100,000 residents, a ratio that’s more than three times the comparable state figure . The city’s murder rate of 28.6 cases per 100,000 people is more than four times the state’s rate of 6.6 murders per 100,000. As has been the case throughout much of the country, Elkhart’s high incidence of violent crime can be attributed in part to drug trafficking and drug abuse.
[in-text-ad-2]
15. Clinton, Iowa
> City violent crime rate: 884 per 100,000
> State violent crime rate: 291 per 100,000 (16th lowest)
> City poverty rate: 16.6%
> City unemployment rate: 4.4%
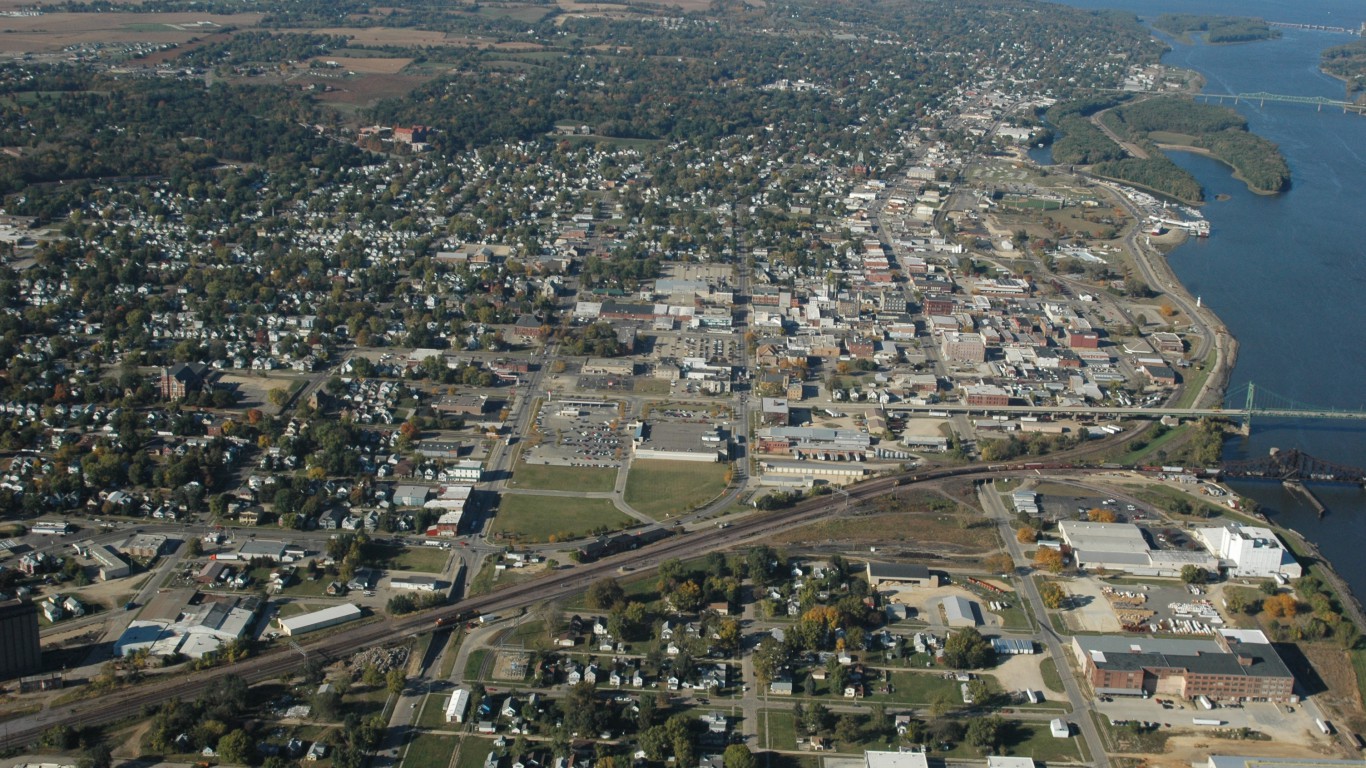
Iowa is a relatively safe state. For all of 2016, its violent crime rate was just 291 incidents per 100,000 residents, well below the nation’s 386-per-100,000 rate at the time. Not all parts of the state fared as well, however. Clinton, a city on Illinois’ western border, racked up a 2016 rate of 884 violent crimes per 100,000 residents, three times Iowa’s rate and the highest of any city in the state. Despite this, Clinton is the only municipality on this list with no reported murders in 2016.
16. Wichita, Kansas
> City violent crime rate: 1,057 per 100,000
> State violent crime rate: 380 per 100,000 (22nd highest)
> City poverty rate: 17.1%
> City unemployment rate: 4.4%
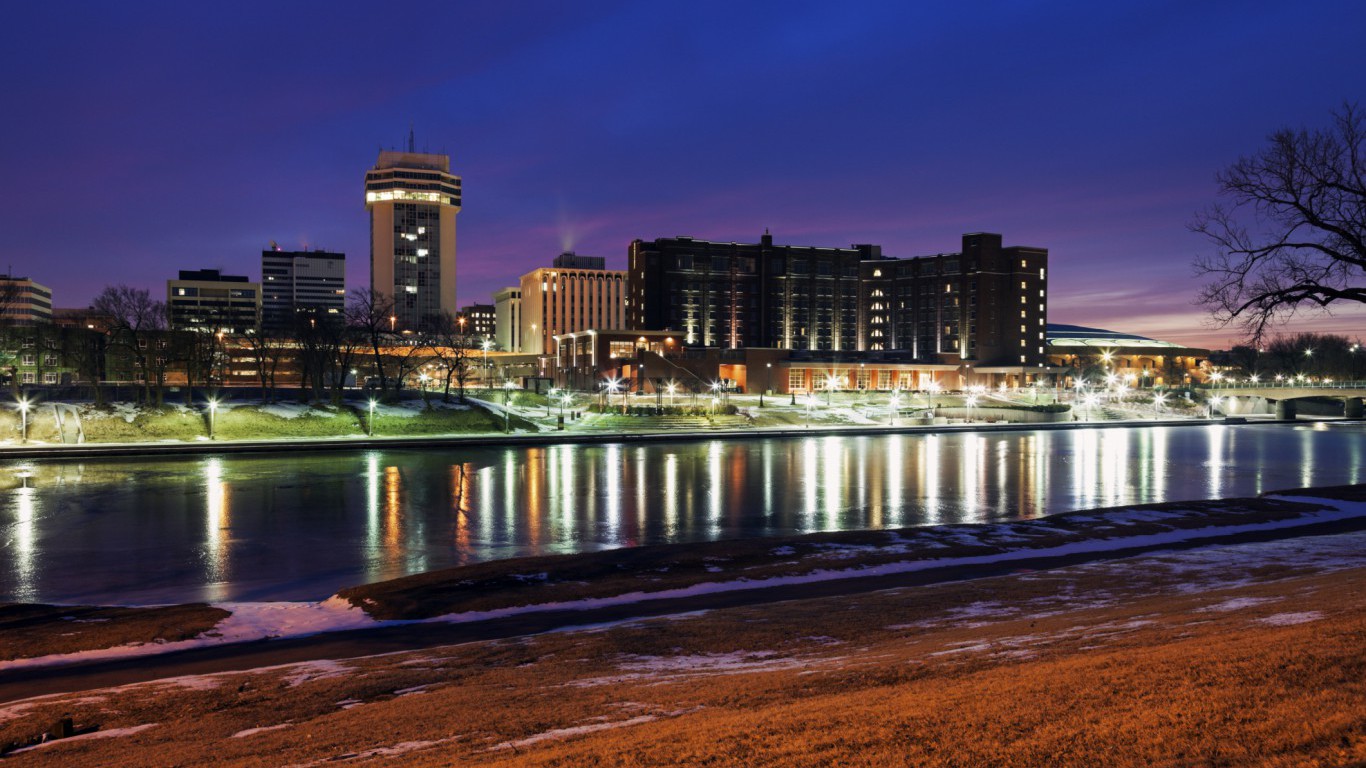
Wichita is by far the most dangerous city in the Sunflower State. For 2016, its violent crime rate soared to 1,057 incidents per 100,000 inhabitants, well above the 706-per-100,000 rate in Junction City, Kansas’ second most dangerous city.
Yet Kansas as a whole is not especially burdened by crime. The state’s violent crime rate of 380 incidents per 100,000 people is in line with the country’s 386-per-100,000 rate. Nonetheless, more than a third of all of Kansas’ reported violent crimes in 2016 occurred in Wichita.
[in-text-ad]

17. Louisville, Kentucky
> City violent crime rate: 676 per 100,000
> State violent crime rate: 232 per 100,000 (7th lowest)
> City poverty rate: 17.7%
> City unemployment rate: 4.4%
About 45% of the 10,308 violent crimes reported in Kentucky for 2016 took place in Louisville. Louisville’s violent crime rate for 2016 — 676 incidents per 100,000 residents — is nearly three times the state’s rate, and this city ranks as the state’s most dangerous.
According to crime analyst John Roman, violent cities are often situated at the confluence of major intersections, which criminal enterprises take advantage of to transport drugs. Indeed Interstates 71, 65, and 64 all converge in Louisville.
18. Monroe, Louisiana
> City violent crime rate: 3,005 per 100,000
> State violent crime rate: 566 per 100,000 (5th highest)
> City poverty rate: 34.7%
> City unemployment rate: 6.3%
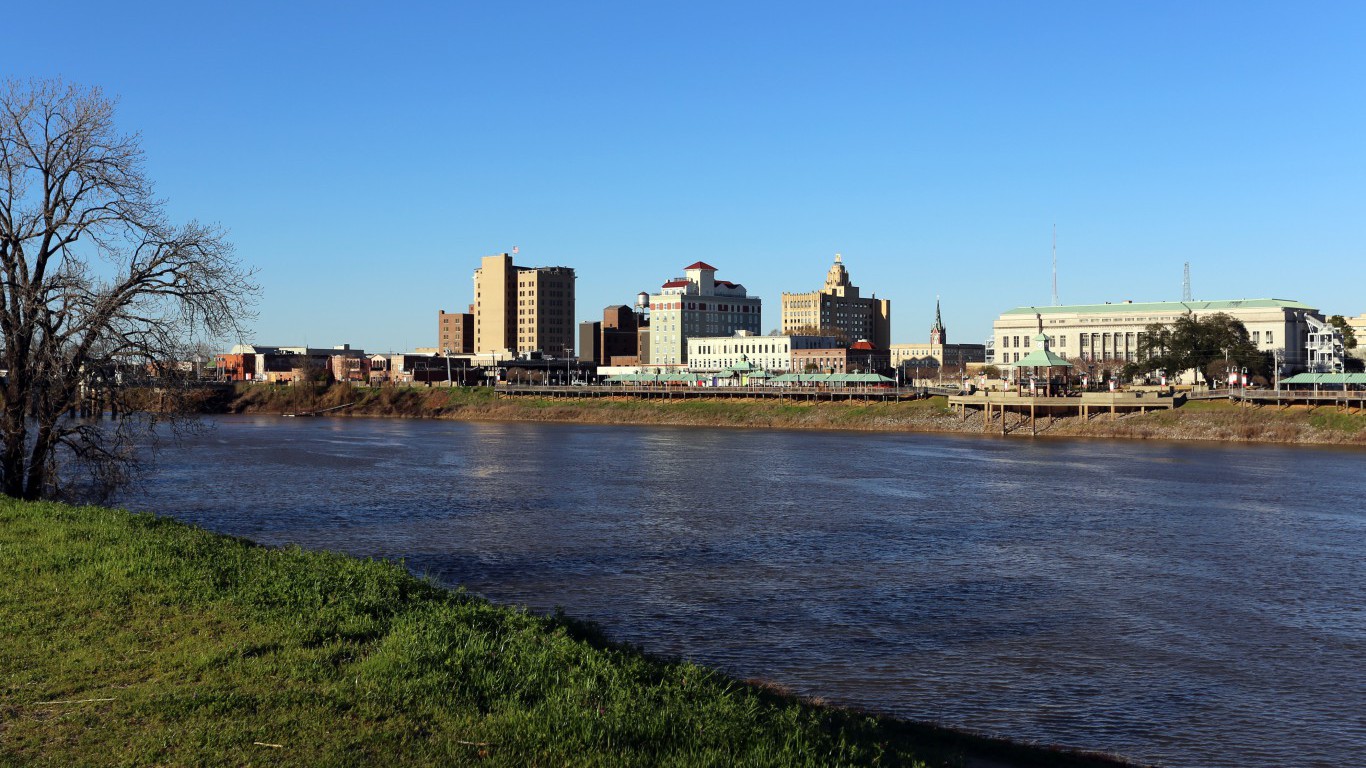
With a violent crime rate of 566 incidents per 100,000 residents, Louisiana is less safe than most states. Monroe, the state’s most dangerous city and the country’s second most dangerous, experienced a 2016 violent crime rate of 3,005 incidents per 100,000 residents. That was nearly eight times the 386-per-100,000 U.S. rate. Robbery and aggravated assault dominated the violence in Monroe.
Areas bereft of economic opportunity tend to foster crime, and poverty is often indicative of a long-term lack of opportunity. More than a third of Monroe’s residents live in poverty, more than double the U.S. rate of 15.1%.
19. Biddeford, Maine
> City violent crime rate: 409 per 100,000
> State violent crime rate: 124 per 100,000 (the lowest)
> City poverty rate: 18.1%
> City unemployment rate: 2.9%
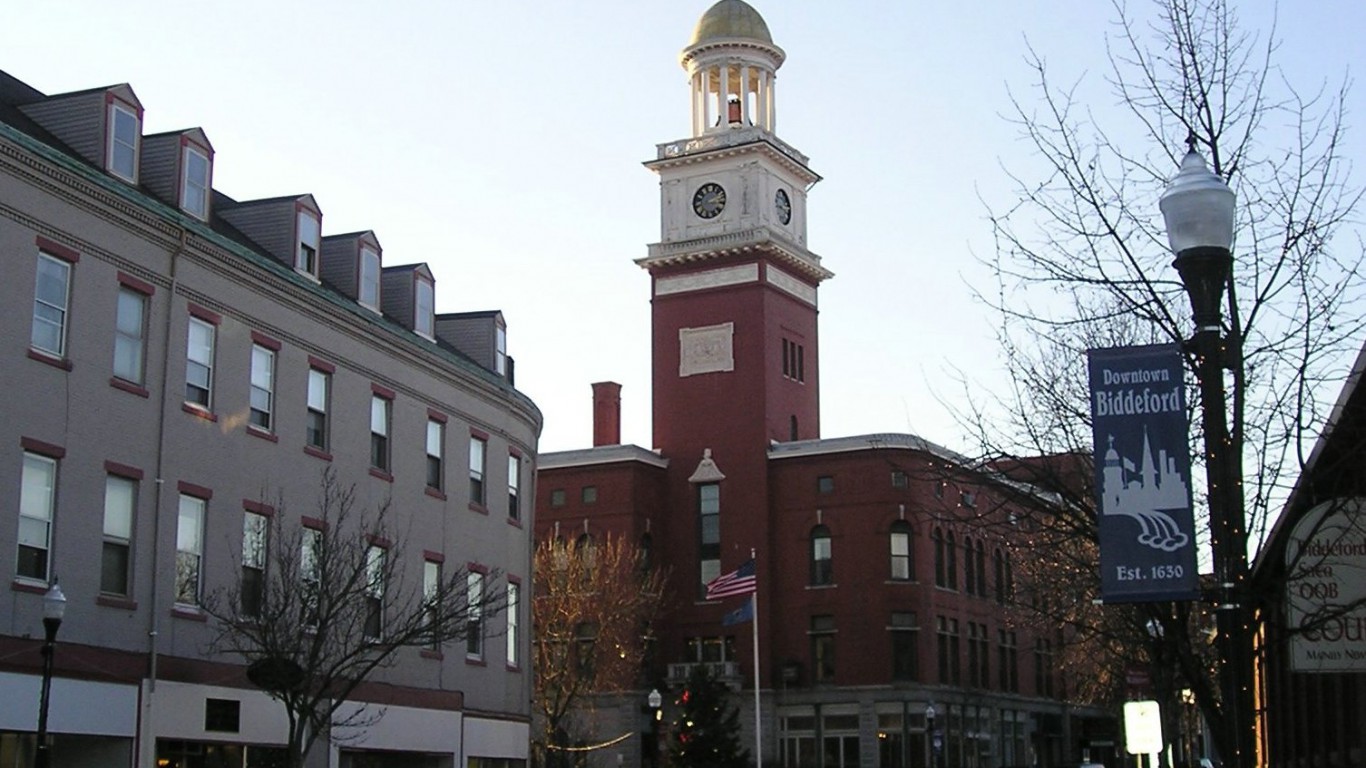
With a violent crime rate of just 124 incidents per 100,000 residents in 2016, Maine ranks as the safest state in the country. Not all parts of the state have reported below-average levels of violence, however. The southern coastal city of Biddeford experienced a 2016 violent crime rate of 409 incidents per 100,000 residents; this is considerably higher than the nation’s rate of 386 crimes per 100,000 residents. Aggravated assault — which can range from a bar brawl to a shooting — accounted for the bulk of Biddeford’s reported violent crimes in 2016.
[in-text-ad-2]

20. Baltimore, Maryland
> City violent crime rate: 1,780 per 100,000
> State violent crime rate: 472 per 100,000 (11th highest)
> City poverty rate: 23.1%
> City unemployment rate: 6.1%
Baltimore ranks as Maryland’s most dangerous city and one of the country’s most crime-ridden.. For 2016 Baltimore logged a violent crime rate of 1,780 incidents per 100,000 residents, nearly four times the state’s rate during thats year. Of Maryland’s 28,400 known incidents of violence in 2016, about 39% took place in Baltimore. The city’s homicide rate of 51.4 slayings per 100,000 residents is higher than those of all but five other cities nationwide.
The extent of Baltimore’s challenge in addressing widespread violence became apparent in February, with the city’s appointment of its third police commissioner in five years. The new commissioner’s strategy includes increasing police presence on city streets.
21. Fall River, Massachusetts
> City violent crime rate: 1,093 per 100,000
> State violent crime rate: 377 per 100,000 (23rd highest)
> City poverty rate: 22.0%
> City unemployment rate: 6.4%
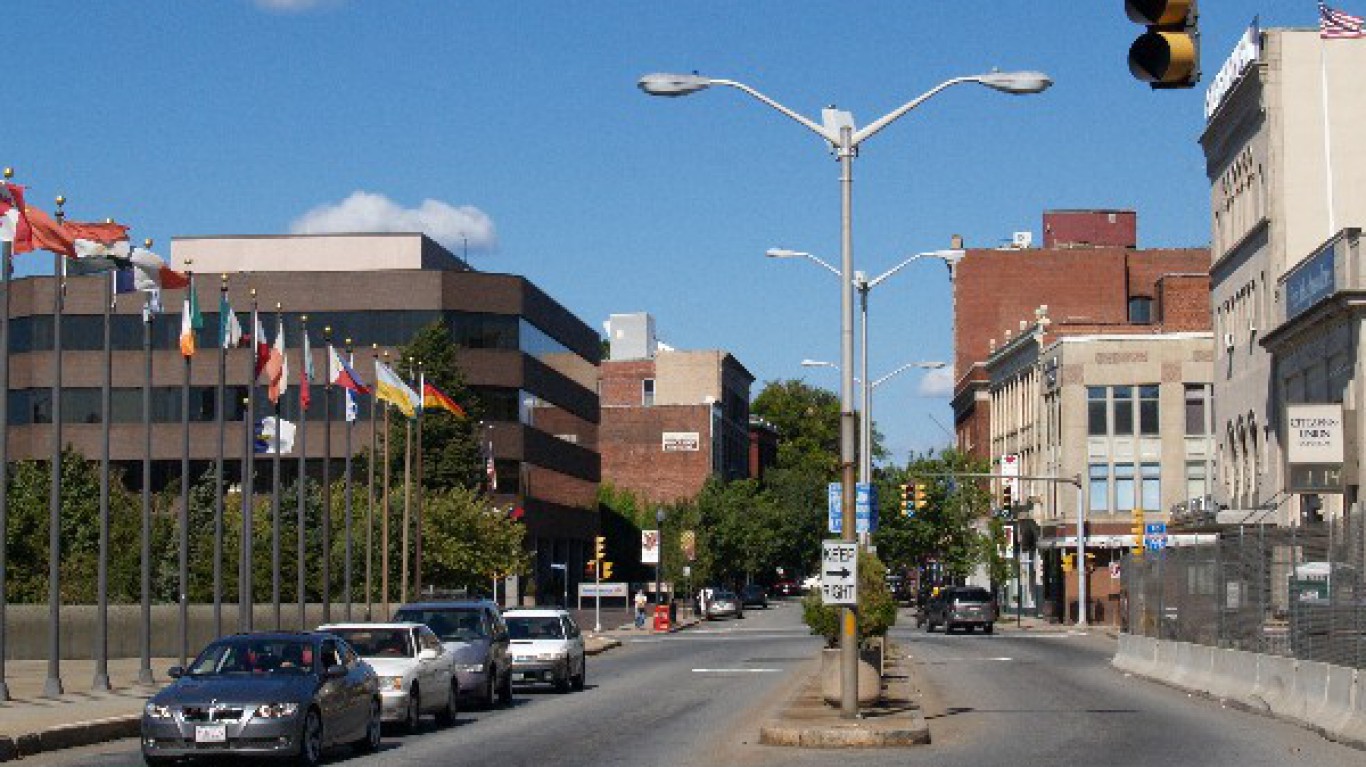
The Bay State’s most dangerous city, Fall River is also New England’s second most dangerous, trailing only Hartford, Connecticut. And Fall River’s 2016 violent crime rate of 1,093 incidents per 100,000 people is nearly triple the state’s rate for that year.
Fall River is one of nearly 100 U.S. cities that adopted ShotSpotter, a technology designed to alert law enforcement about shootings in real time, as well as to share the number of shots fired, the direction they were fired, and the caliber of weapon used. Earlier this year, Fall River police announced, however, a decision to discontinue the product’s use, citing its failure effectively assist in reducing gun violence.
[in-text-ad]

22. Detroit, Michigan
> City violent crime rate: 2,047 per 100,000
> State violent crime rate: 459 per 100,000 (13th highest)
> City poverty rate: 39.4%
> City unemployment rate: 9.3%
Detroit law enforcement logged 13,705 violent crimes in 2016, representing a rate of 2,047 incidents for every 100,000 residents. This represents the highest violent crime rate in Michigan and the fifth highest of any city in the country. Nonviolent offenses are also common in Motor City. In addition to bearing the state’s highest violent crime rate, Detroit also has more burglary and motor-vehicle theft than any other city in the Great Lake State.
A high rate of violent crime is more likely in areas bereft of economic opportunity, and for many in Detroit opportunity is scarce. The city’s 9.3% annual unemployment rate and 39.4% poverty rate both rank among the highest in the country.

23. Minneapolis, Minnesota
> City violent crime rate: 1,109 per 100,000
> State violent crime rate: 243 per 100,000 (9th lowest)
> City poverty rate: 21.3%
> City unemployment rate: 3.1%
Minneapolis’s 2016 violent crime rate of 1,109 incidents per 100,000 residents ranks as the highest of any city in Minnesota for that year. The city had more rapes, robberies, and aggravated assaults per capita than any other municipality in the North Star State and its murder rate of 8.4 homicides per 100,000 residents trailed only that of Faribault, Minnesota, that year.
In most cities on this list, the percentage of adults with a four-year college education is lower than the national rate of 30.3%. Minneapolis stands as one of the exceptions. Almost 48% of Minneapolis’ adults have at least a bachelor’s degree, a share that’s well above the state’s 34.2% rate as well as the national one.
24. Jackson, Mississippi
> City violent crime rate: 853 per 100,000
> State violent crime rate: 281 per 100,000 (15th lowest)
> City poverty rate: 30.7%
> City unemployment rate: 5.0%
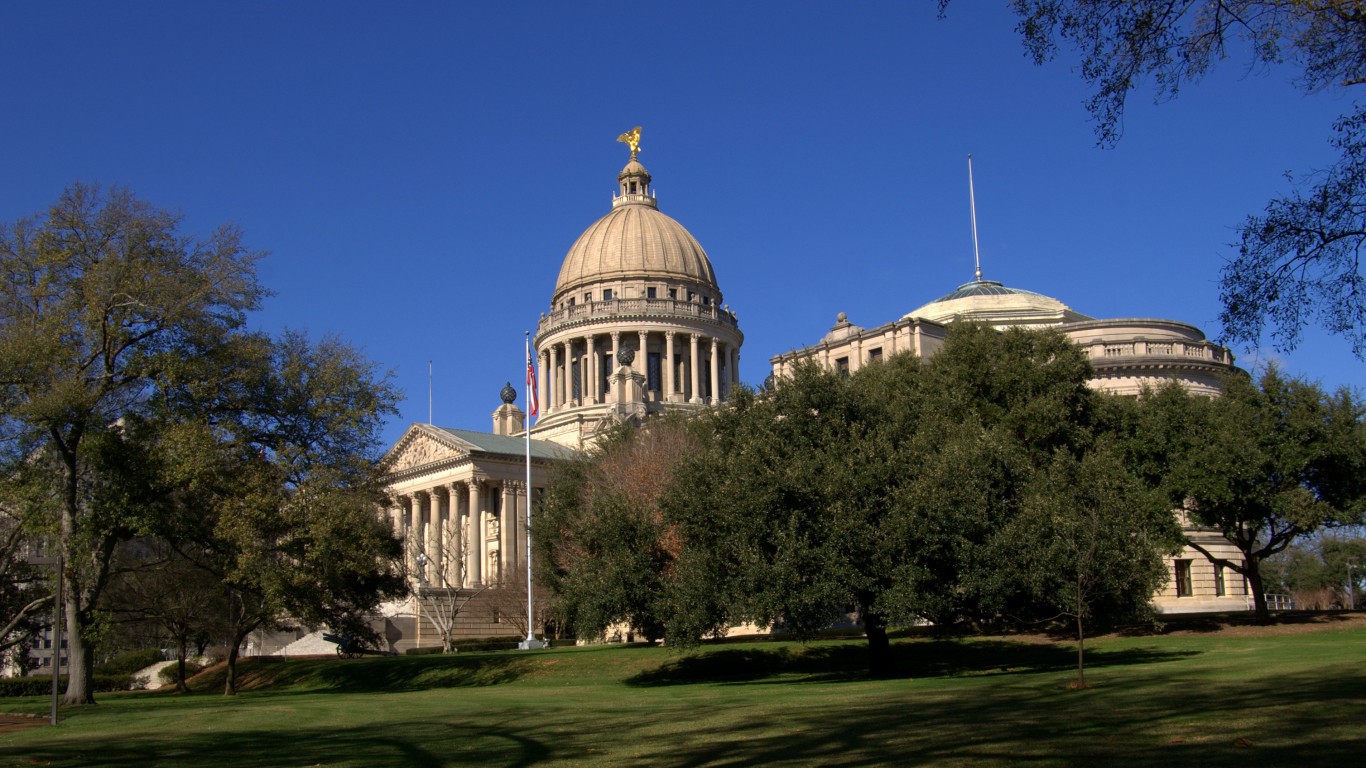
Of the 14 cities in Mississippi for which the FBI compiles crime statistics, Jackson’s violent crime rate is the highest. In 2016, the city’s law enforcement tallied 1,451 violent crimes, adding up to a rate of 853 incidents for every 100,000 residents. In comparison, Mississippi’s violent crime rate for the same year was only 281 incidents per 100,000 residents and the national rate was 386 incidents per 100,000. As is true for most cities on this list, Jackson is a community of relatively poor inhabitants. Its 30.7% poverty rate is well above the state’s 22.3% and nation’s 15.1% rates.
[in-text-ad-2]

25. St. Louis, Missouri
> City violent crime rate: 1,913 per 100,000
> State violent crime rate: 519 per 100,000 (8th highest)
> City poverty rate: 26.7%
> City unemployment rate: 4.4%
Directly across the Mississippi River from East St. Louis — Illinois’ most unsafe city — lies St. Louis, the most dangerous city in Missouri. St. Louis’ violent crime rate of 1,913 incidents per 100,000 residents is higher than that of any other city in the state and greater than that of all but five other U.S. cities. While this Midwest city struggles with nearly the nation’s top rates for aggravated assault and robbery, its murder rate is also especially high: St. Louis’ 2016 rate was 60 homicides per 100,000 individuals, higher than that of all but three other U.S. cities. In an effort to reduce homicide, the St. Louis Police Department is increasing the presence of police in problem areas.
26. Helena, Montana
> City violent crime rate: 654 per 100,000
> State violent crime rate: 368 per 100,000 (25th lowest)
> City poverty rate: 16.5%
> City unemployment rate: 3.1%
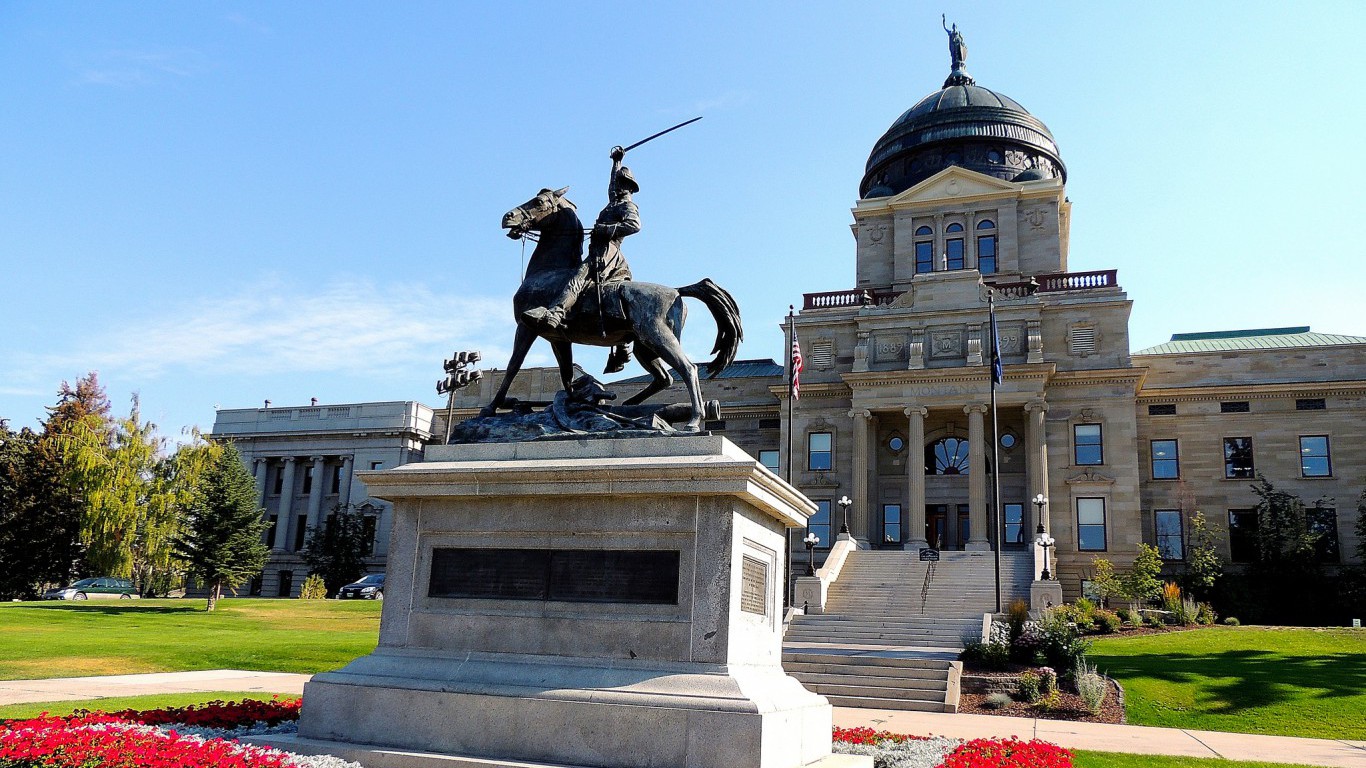
Reported rape represents a relatively small share of violent crime nationwide. But in some areas its prevalence is a significant addition to the relatively high violent crime rate. In Helena, Montana, the 2016 rate for reported rapes was 167 incidents per 100,000 residents, the ninth highest in the country. On average, the U.S. cities with at least 52 reported rapes in 2017 had populations three times that of Helena.
[in-text-ad]
27. Omaha, Nebraska
> City violent crime rate: 567 per 100,000
> State violent crime rate: 291 per 100,000 (17th lowest)
> City poverty rate: 16.3%
> City unemployment rate: 3.2%
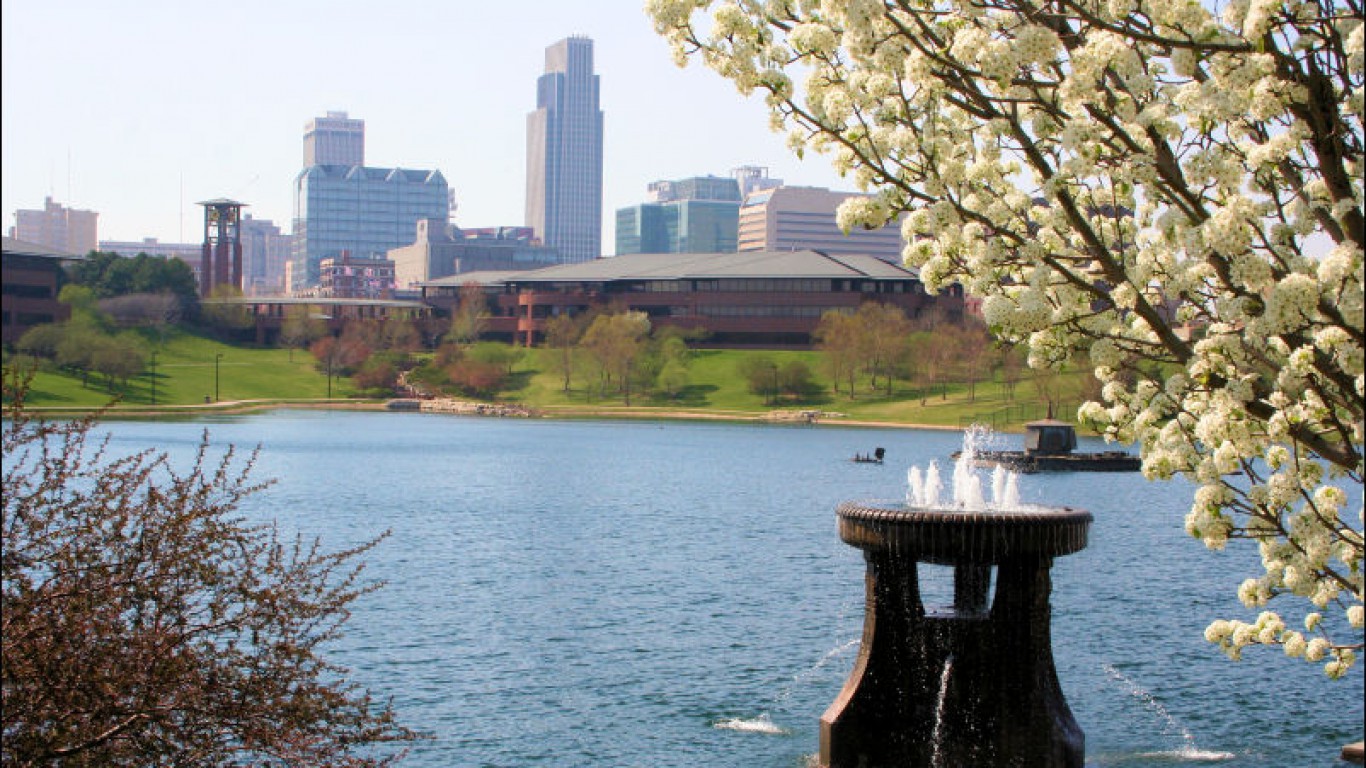
In 2016 law enforcement in Omaha, Nebraska, tallied 2,531 incidents of violent crime, the most for any city in the state. Even adjusting for Omaha’s relatively large population, the city’s violent crime rate of 567 incidents per 100,000 residents is the state’s steepest. In comparison, the nation’s 2016 violent crime rate was 386 incidents per 100,000 individuals. Omaha is the only city in Nebraska that’s more dangerous than the U.S. as a whole.
28. North Las Vegas, Nevada
> City violent crime rate: 954 per 100,000
> State violent crime rate: 678 per 100,000 (3rd highest)
> City poverty rate: 15.8%
> City unemployment rate: 5.8%
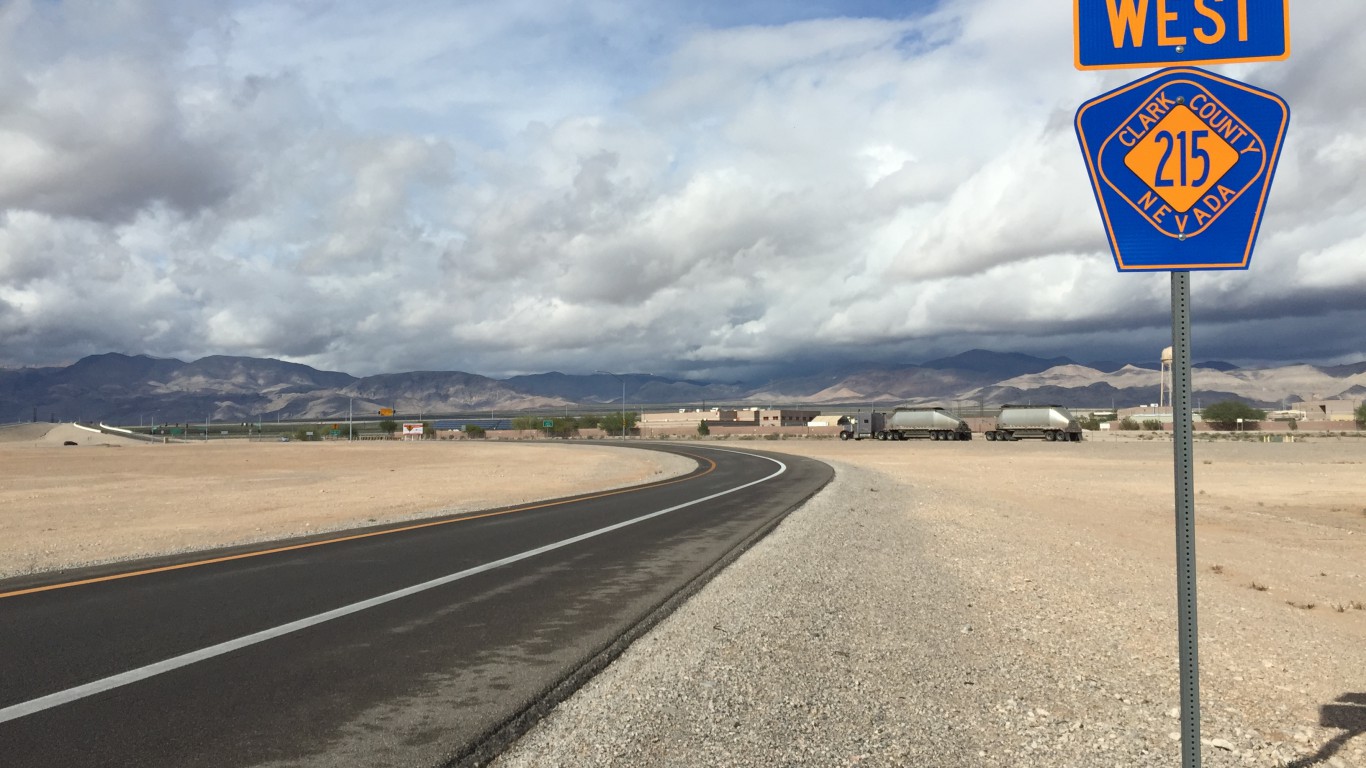
North Las Vegas is a city covering about 100 square miles at the northern tip of the Las Vegas Valley. The city logged for 2016 a total of 2,276 violent crimes, representing a rate of 954 incidents for every 100,000 residents; that’s higher than in any other city in Nevada. Like in most of the country, aggravated assault in North Las Vegas accounted for the biggest share of violent crime, with robbery being the next largest.
29. Manchester, New Hampshire
> City violent crime rate: 672 per 100,000
> State violent crime rate: 198 per 100,000 (3rd lowest)
> City poverty rate: 14.6%
> City unemployment rate: 2.8%
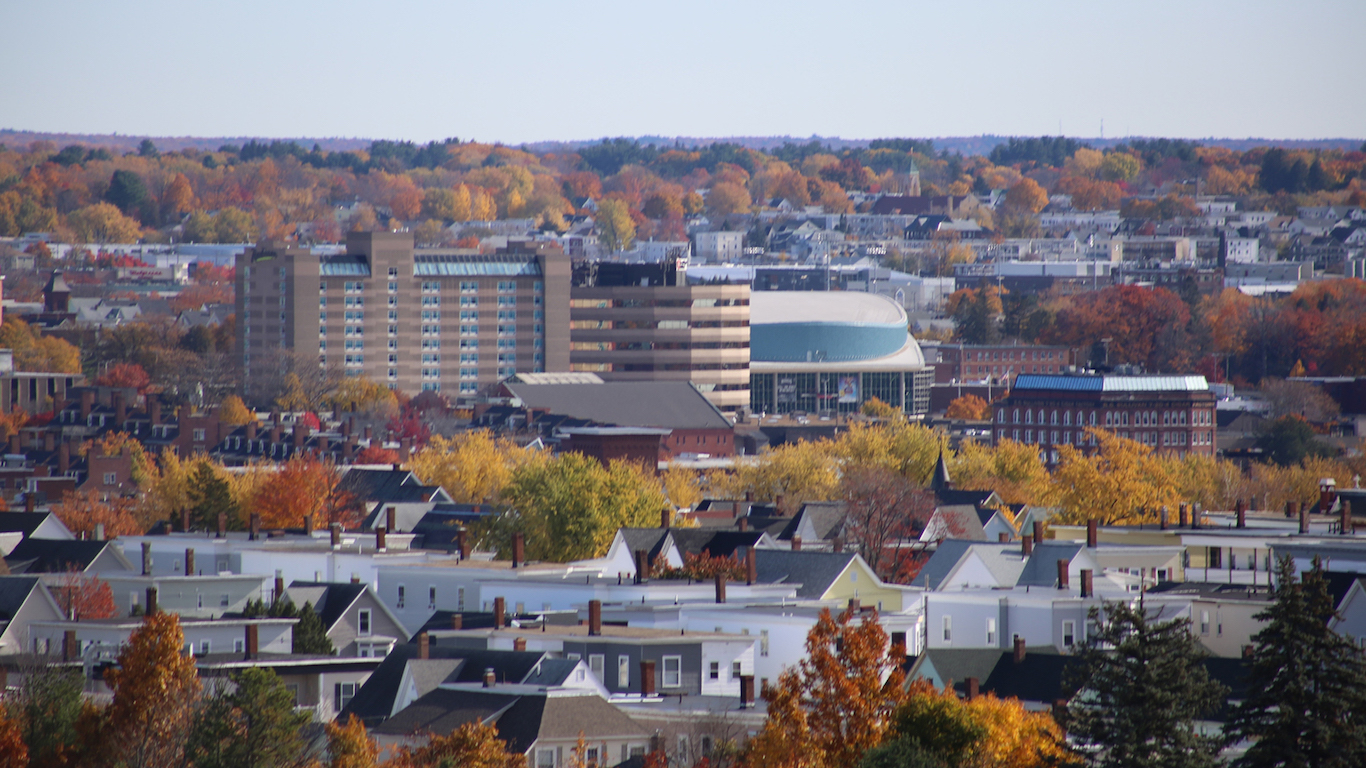
Of the 13 cities in New Hampshire whose crime is tracked by the FBI Manchester is the most dangerous. Manchester’s 2016 violent crime rate was 672 incidents for every 100,000 residents, nearly double the rate for nearby Rochester, the Granite State’s second most dangerous city.
Violent crime is about three times as common in Manchester than it is across the state as a whole. Of the 2,637 violent crimes in New Hampshire that occurred in 2016, about 28% occurred in Manchester.
[in-text-ad-2]
30. Trenton, New Jersey
> City violent crime rate: 1,347 per 100,000
> State violent crime rate: 245 per 100,000 (12th lowest)
> City poverty rate: 27.6%
> City unemployment rate: 6.9%
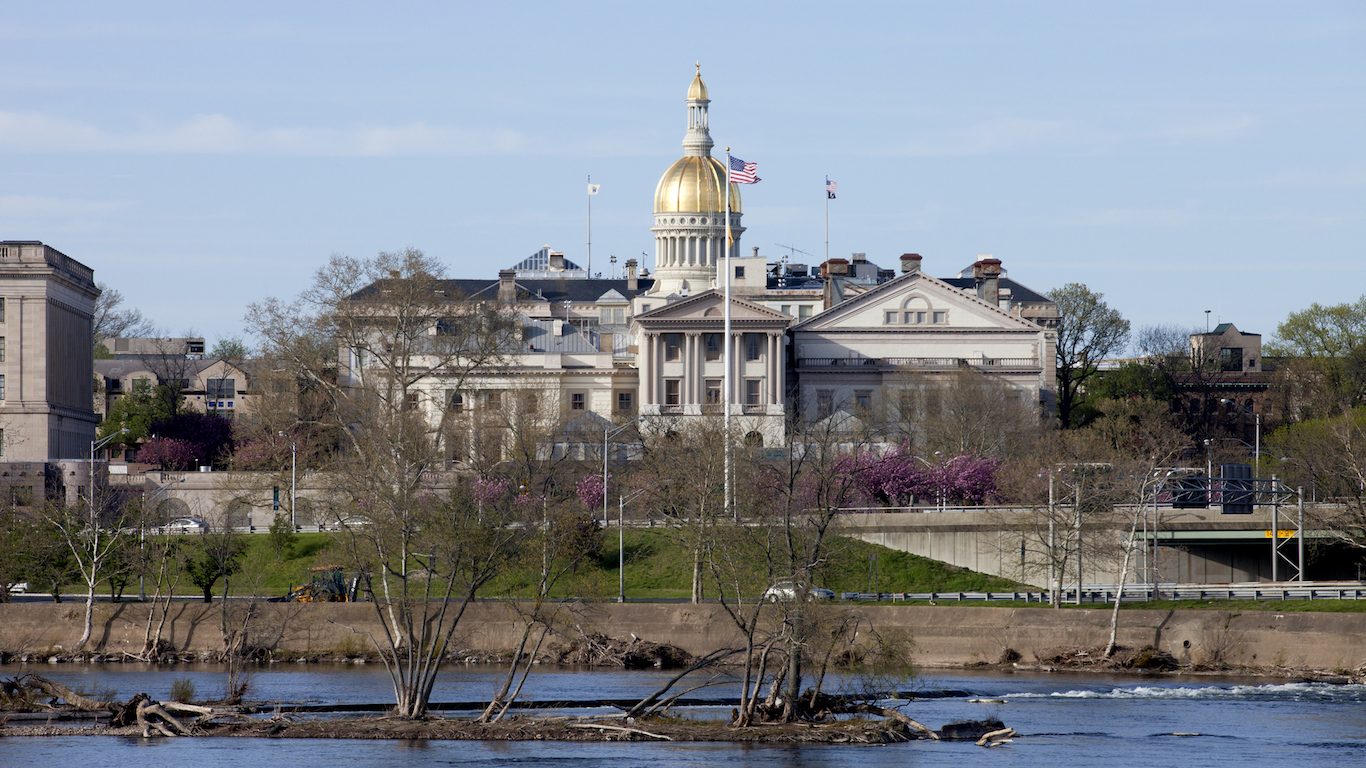
A relatively safe state, New Jersey had a 2016 violent crime rate of 245 incidents per 100,000 residents. That’s considerably lower than the comparable U.S. rate of 386 incidents per 100,000 individuals. Not all cities in the state, however, are free of violence, especially Trenton, the capital. For 2016 Trenton police recorded 1,127 violent crimes, which represents a rate of 1,347 cases per 100,000 residents — the highest of any city in the state.
Violent areas often lack economic opportunity, and a high poverty rate can signal a long term lack of such opportunity. In Trenton, 27.6% of the population lives below the poverty line, which stands in sharp contrast to New Jersey’s 10.9% rate.
31. Gallup, New Mexico
> City violent crime rate: 1,726 per 100,000
> State violent crime rate: 703 per 100,000 (2nd highest)
> City poverty rate: 29.1%
> City unemployment rate: N/A
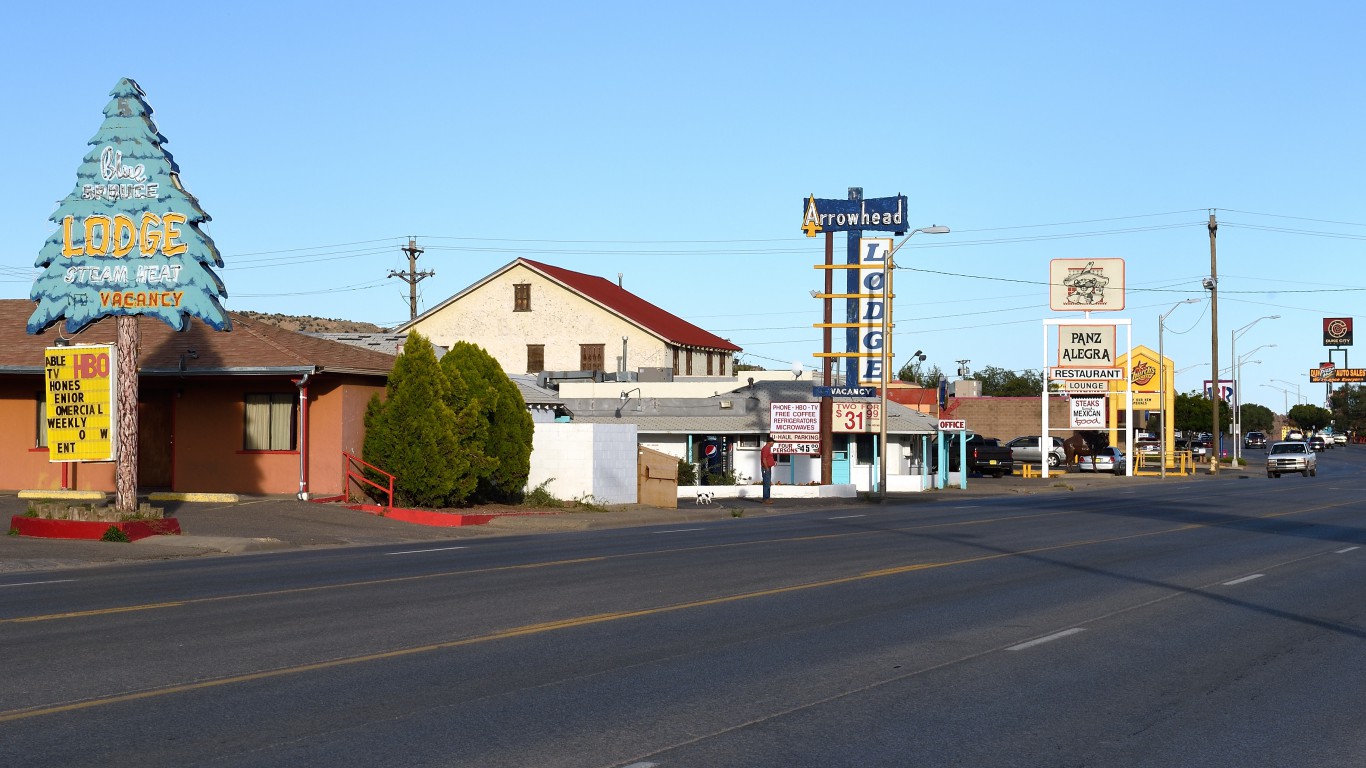
New Mexico’s 2016 violent crime rate of 703 incidents per 100,000 residents was nearly the highest of any state and second only to Alaska’s. In Gallup, New Mexico’s most dangerous city, violent crime is more than twice as common as it is in the state as a whole. The city’s violent crime rate for 2016 was 1,726 incidents for every 100,000 residents; and the crimes reported in this category were primarily aggravated assaults.
High crime areas are also often poor districts, and Gallup represents no exception. A 29.1% share of the city’s population lives below the poverty line, the largest percentage found in any city in New Mexico. This is nearly double the country’s 15.1% rate.
[in-text-ad]
32. Newburgh, New York
> City violent crime rate: 1,431 per 100,000
> State violent crime rate: 376 per 100,000 (24th highest)
> City poverty rate: 33.0%
> City unemployment rate: 5.9%
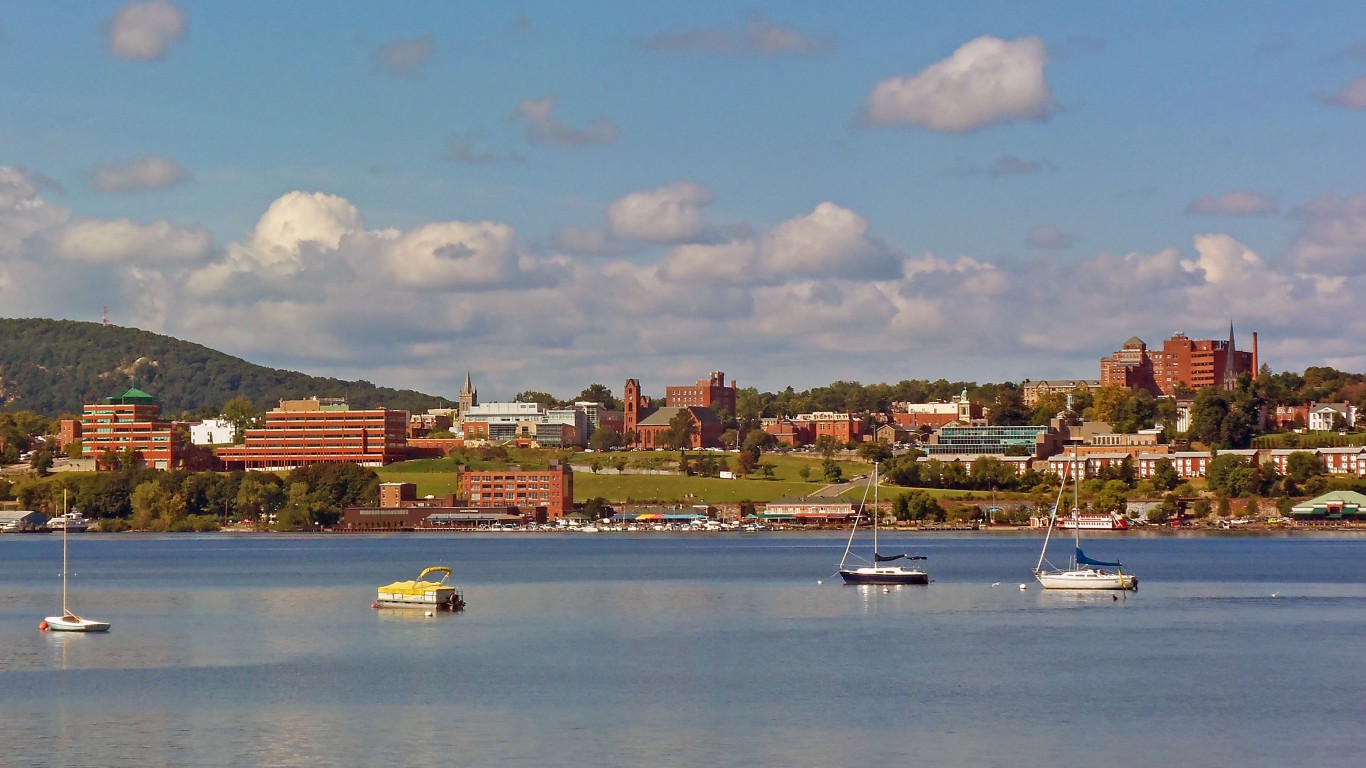
Newburgh, New York, is the most violent place in the Empire State. Its violent crime rate in 2016 was close to four times that of the nation. The small city is situated 50 miles north of New York City along the Hudson River but close to the intersection of Interstates 84 and 90. Criminologist John Roman told 24/7 Wall St. in an interview that Newburgh’s high crime rate can likely be attributed to its location by a major transportation node. Criminal organizations, Roman explained, may find such a place an appealing spot to engage in illegal activities because they can efficiently ship illicit goods in all directions.
33. Lumberton, North Carolina
> City violent crime rate: 1,812 per 100,000
> State violent crime rate: 372 per 100,000 (25th highest)
> City poverty rate: 35.1%
> City unemployment rate: N/A
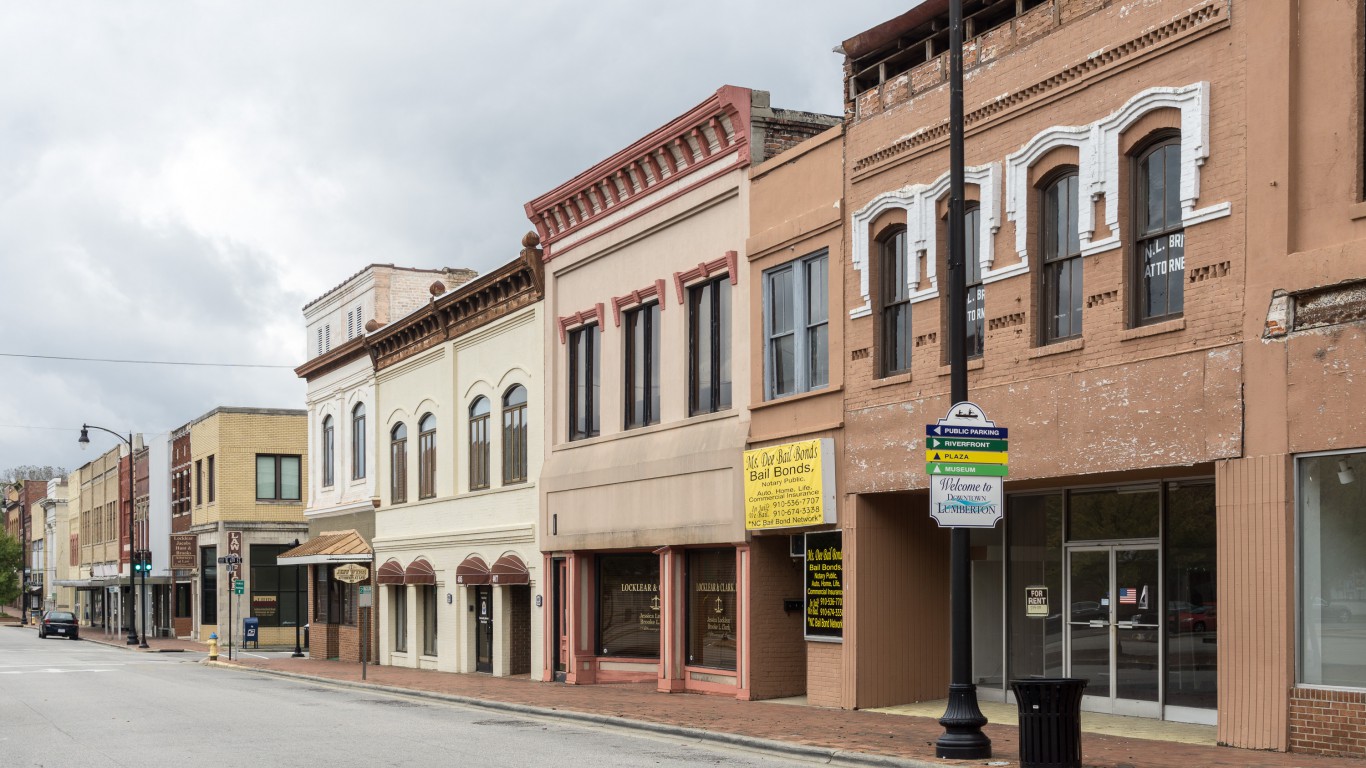
Of the 32 cities in North Carolina that figure into the the FBI’s crime statistics, Lumberton is the fourth smallest, with slightly fewer than 22,000 residents. Nonetheless, the city’s law enforcement personnel tallied for 2016 nine murders there, more than in all but six other North Carolina cities, including some five times the population of Lumberton. The city’s violent crime rate of 1,812 incidents per 100,000 residents is the highest of any North Carolina city and nearly five times the state’s rate.
Like most cities on this list, Lumberton is home to a relatively poor population. More than 1 in 3 Lumberton residents live in poverty; this represents the highest rate for any municipality in North Carolina and it is more than double the nation’s 15.1% rate.
34. Fargo, North Dakota
> City violent crime rate: 385 per 100,000
> State violent crime rate: 251 per 100,000 (13th lowest)
> City poverty rate: 14.6%
> City unemployment rate: 2.1%
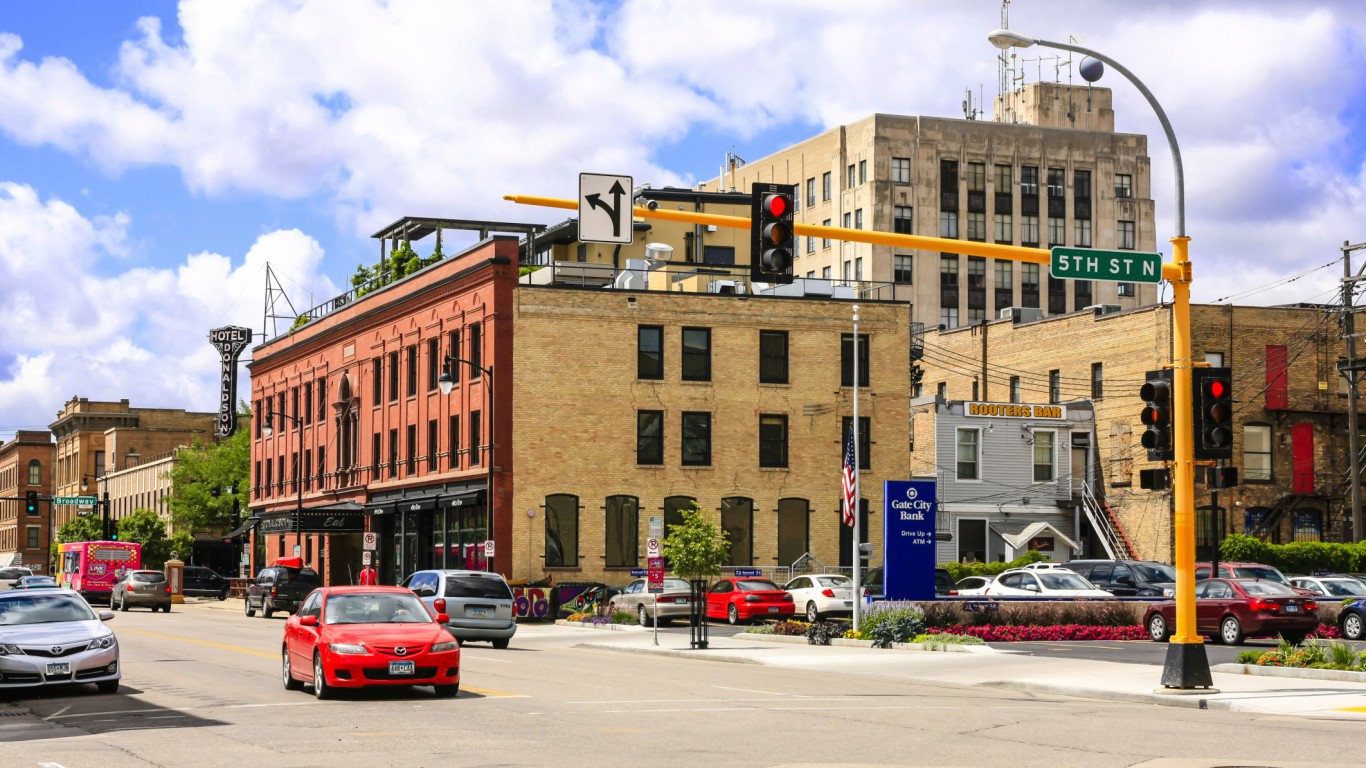
The town of Fargo, North Dakota, is famed for the fictional crimes committed there in the 1996 Coen brothers film bearing the same name. Regardless of the events of the film, however, murder is not a major issue for this city of 121,000 people. Fargo had a total of just three murder and nonnegligent manslaughter cases in 2016. In real life the city’s 2016 violent crime rate of 385 incidents per 100,000 residents was in line with the nation’s rate. Fargo makes our list only because North Dakota’s other cities have even lower crime rates.
[in-text-ad-2]
35. Cleveland, Ohio
> City violent crime rate: 1,631 per 100,000
> State violent crime rate: 300 per 100,000 (18th lowest)
> City poverty rate: 36.0%
> City unemployment rate: 7.4%
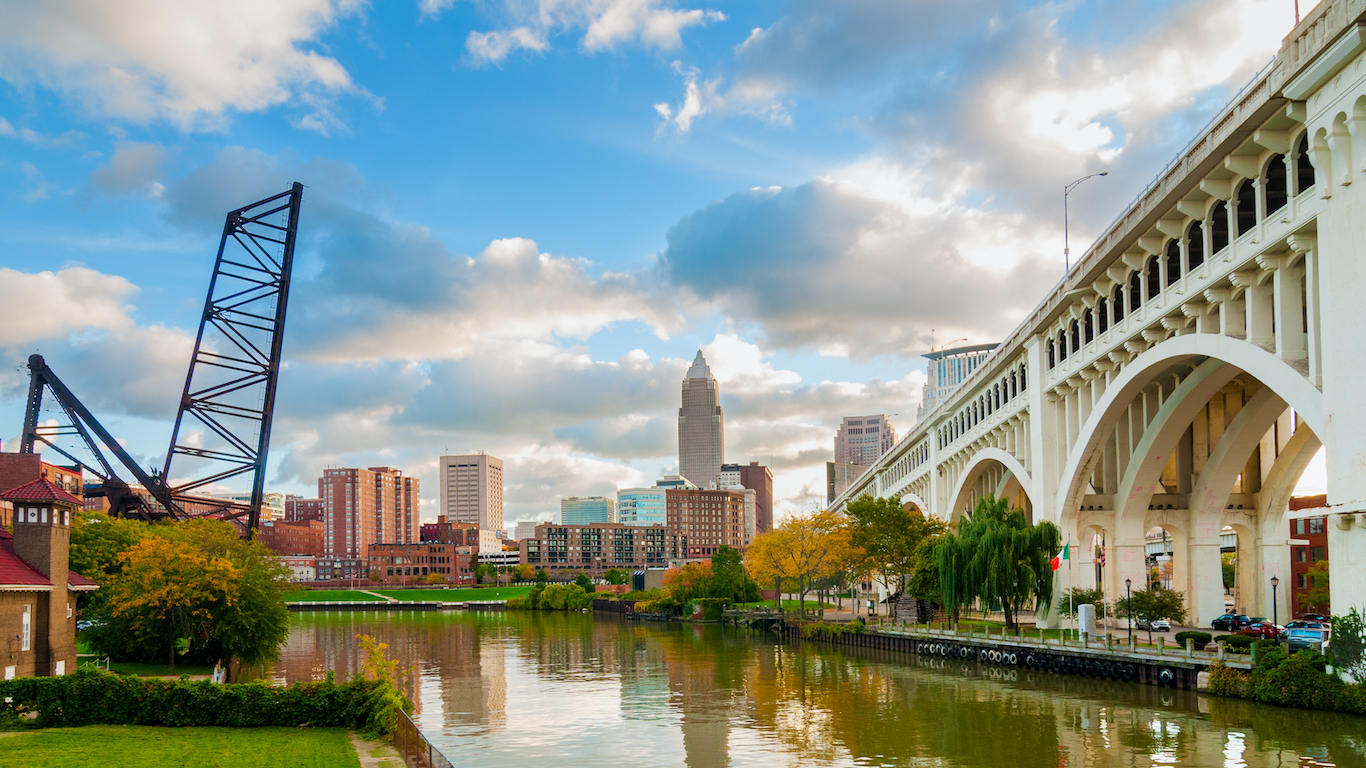
The most dangerous city in Ohio, Cleveland had a violent crime rate of 1,631 incidents per 100,000 residents, more than five times the comparable statewide rate. In the vast majority of U.S. cities, aggravated assault accounts for the largest share of violent crime. In a break from the broader trend, robbery, rather than aggravated assault, is the most common violent crime in Cleveland. The city had 772 robberies for every 100,000 people in 2016, the highest robbery rate in the state and second highest in the country.
High violent crime rates are more common in areas bereft of economic opportunity, and for many in Cleveland, opportunity is scarce. The city’s 7.4% annual unemployment rate and 36.0% poverty rank among the worst in the country.

36. Tulsa, Oklahoma
> City violent crime rate: 1,095 per 100,000
> State violent crime rate: 450 per 100,000 (14th highest)
> City poverty rate: 20.3%
> City unemployment rate: 4.5%
Tulsa had 72 homicides, 439 rapes, and 2,845 aggravated assaults reported in 2016. All three figures ranked among the 30 highest in their category for that year. Yet the city is only the 47th most populous in the country among cities with available crime data. While some places have high rates of certain categories of violent or non-violent crimes, Tulsa appears to have a problem with every major type of crime. The city ranks among the worst in each of the four components of violent crime, as well as burglary, larceny, and motor vehicle theft.
[in-text-ad]

37. Medford, Oregon
> City violent crime rate: 504 per 100,000
> State violent crime rate: 265 per 100,000 (14th lowest)
> City poverty rate: 21.4%
> City unemployment rate: 4.7%
Oregon is a relatively safe state. Oregon’s violent crime rate of 265 incidents per 100,000 residents is lower than the U.S. violent crime rate of 386 per 100,000. However, not all parts of the state are safer than the nation as a whole. In Medford, the most dangerous city in the state, there were 504 violent crimes for every 100,000 people in 2016.
Medford also has a serious problem with property crimes like larceny and motor-vehicle theft. There were 7,040 property crimes for every 100,000 city residents in 2016, the highest property crime rate in the state and one of the highest in the country.

38. Chester, Pennsylvania
> City violent crime rate: 1,571 per 100,000
> State violent crime rate: 316 per 100,000 (22nd lowest)
> City poverty rate: 36.9%
> City unemployment rate: 8.5%
Chester, Pennsylvania, had 23 murders and nonnegligent manslaughters reported in 2016. While that may not sound like much considering that cities like Chicago and New York would record as many murders in less than two weeks, Chester is a city of just 34,000 people. The average population of a city reporting at least 20 homicides in 2016 was 617,000. Together with the other violent crime categories, there were 513 violent crimes in the city in 2016 for a violent crime rate of 1,571 per 100,000 — one of the highest of U.S. cities.
39. Providence, Rhode Island
> City violent crime rate: 575 per 100,000
> State violent crime rate: 239 per 100,000 (8th lowest)
> City poverty rate: 28.2%
> City unemployment rate: 5.4%
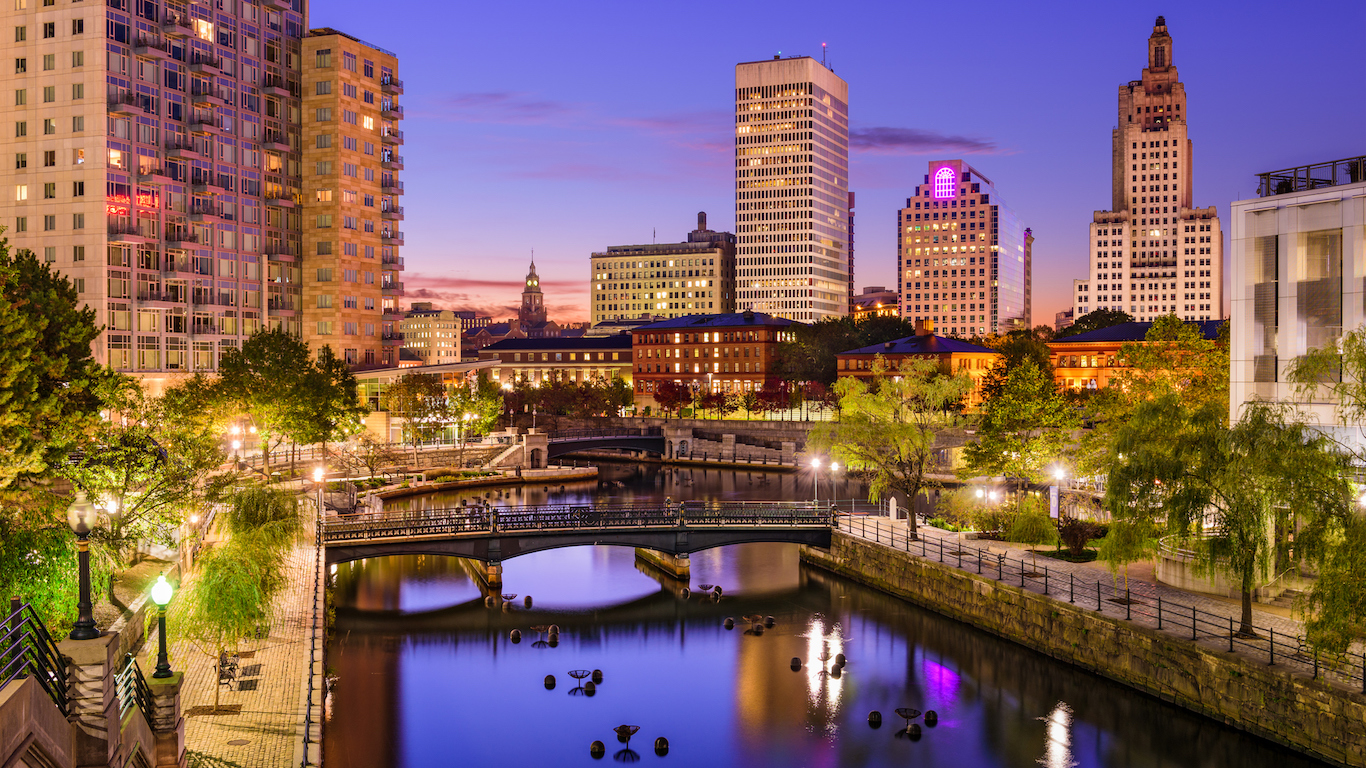
Providence, Rhode Island’s largest and most dangerous city, accounted for over 40% of all violent crime in the state in 2016, its. Of the 29 murders recorded in Rhode Island in 2016, 10 were in Providence. Providence’s violent crime rate of 575 incidents per 100,000 residents is more than double the statewide violent crime rate of 239 incidents for every 100,000 people.
The city is taking active, holistic measures to reduce the incidence of violence. Thanks to funding from a Justice Department program, non-profits in the area have been working with the police in high crime neighborhoods aiming to help reduce crime by taking measures such as equipping parks with better lighting.
[in-text-ad-2]

40. Myrtle Beach, South Carolina
> City violent crime rate: 1,688 per 100,000
> State violent crime rate: 502 per 100,000 (10th highest)
> City poverty rate: 22.9%
> City unemployment rate: 5.6%
Myrtle Beach, South Carolina, is one of the most popular tourist destinations in the United States. The city has of just 31,864 people had a record 18 million tourists in the summer of 2016 alone. Alcohol consumption can often lead to violent crime incidence, and Myrtle Beach is a popular spring break destination, where young Americans to come drink alcohol. This likely contributes to the area’s extremely high violent crime rate.

41. Rapid City, South Dakota
> City violent crime rate: 719 per 100,000
> State violent crime rate: 418 per 100,000 (19th highest)
> City poverty rate: 16.4%
> City unemployment rate: 3.4%
Rapid City has the highest violent crime rate in the South Dakota, at 719 incidents for every 100,000 residents. However, the city had just two reported homicides and nonnegligent manslaughters in 2016. Even adjusting for the population, the city’s homicide rate is less than half the national figure. Homicide might be one of the most heavily covered aspect of violent crime, but it only accounts for a very small portion all violent crimes. Including rape, aggravated assault, and robbery, Rapid City’s violent crime rate comes to 719 incidents per 100,000, which is roughly double the national rate.
[in-text-ad]

42. Memphis, Tennessee
> City violent crime rate: 1,820 per 100,000
> State violent crime rate: 633 per 100,000 (4th highest)
> City poverty rate: 27.6%
> City unemployment rate: 4.8%
Memphis is one of the most violent cities not just in Tennessee, but also in the country. The city’s violent crime rate of 1,820 incidents per 100,000 in 2016 was easily the worst in the state — and the ninth worst in the nation. Among cities with populations greater than 500,000, only Detroit has a higher violent crime rate. Memphis also has the ninth highest property crime rate, at 6,635 incidents per 100,000 residents.
43. Beaumont, Texas
> City violent crime rate: 1,113 per 100,000
> State violent crime rate: 434 per 100,000 (17th highest)
> City poverty rate: 20.8%
> City unemployment rate: 6.4%
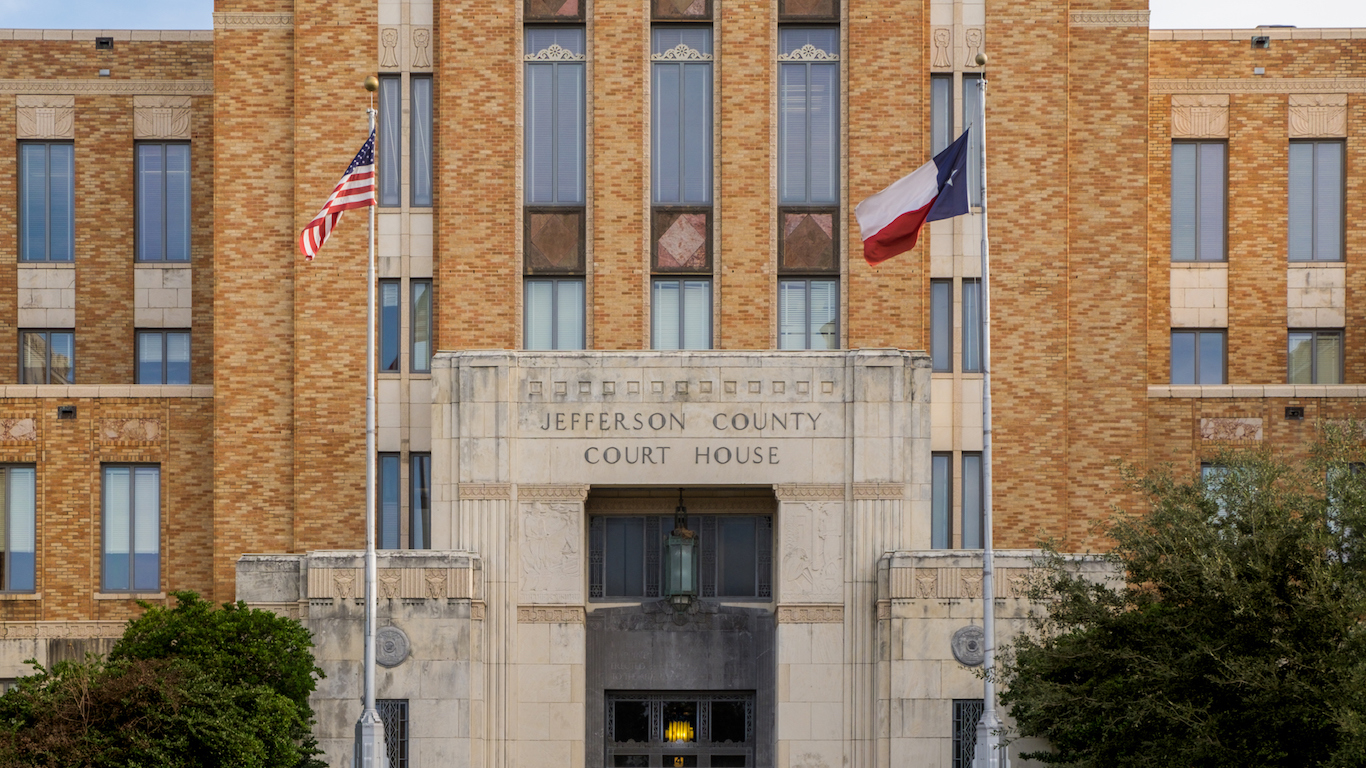
In 2016 Beaumont, Texas, had 14 murders, more than double the total count for some other Lone Star cities more than twice its size. The city is located near the Gulf Coast as well as Texas’ border with Louisiana, which had the fifth-highest rate of violent crime among all states in 2016. Texas itself had the 17th highest violent crime rate that year.
44. Salt Lake City, Utah
> City violent crime rate: 936 per 100,000
> State violent crime rate: 243 per 100,000 (10th lowest)
> City poverty rate: 19.1%
> City unemployment rate: 3.1%
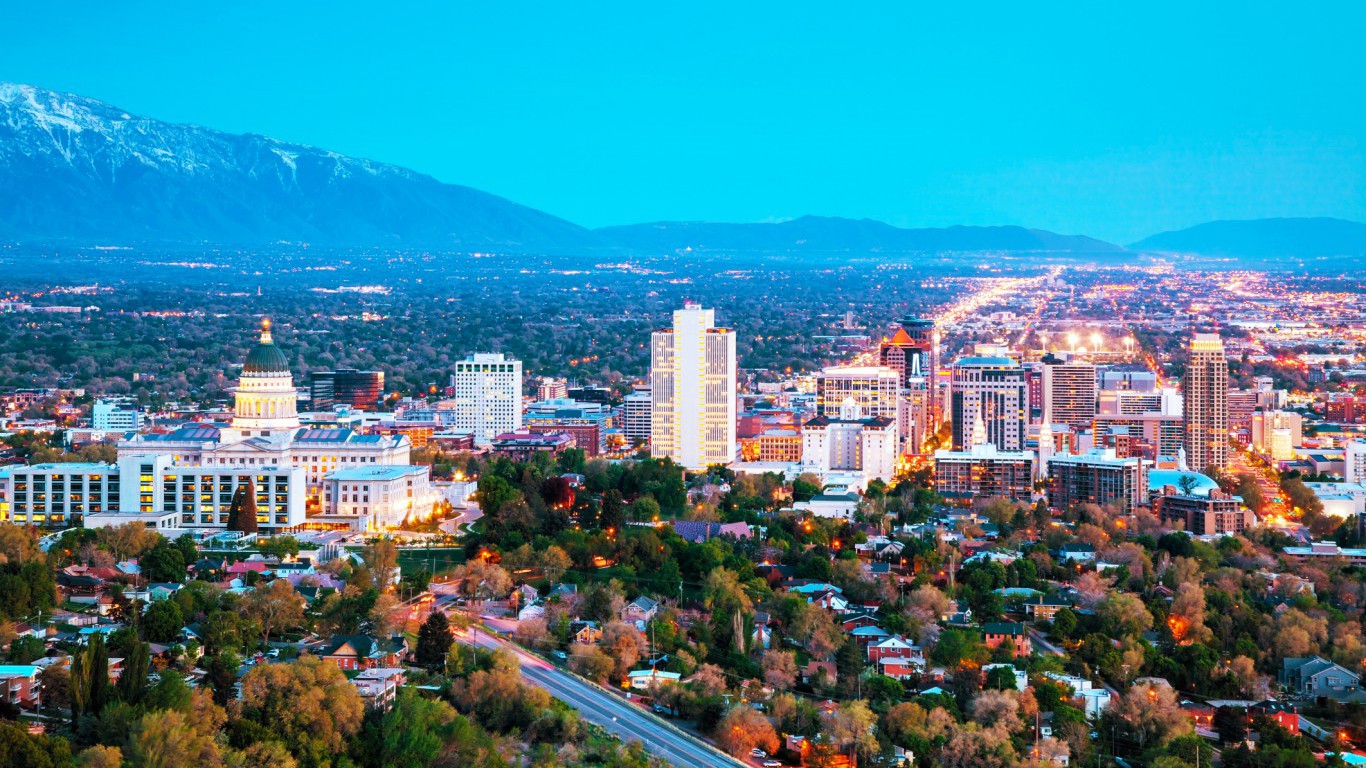
Utah is one of the least violent states in the country, with just 243 reported incidents per 100,000 residents, compared to the national rate of 386 incidents per 100,000 people. However, the state’s most populous city, Salt Lake City, has a violent crime rate close to four times the state rate. The city’s rate of rape, at 136 reported incidents per 100,000 people, is the 23rd worst in the country.
[in-text-ad-2]
45. Essex, Vermont
> City violent crime rate: 38 per 100,000
> State violent crime rate: 158 per 100,000 (2nd lowest)
> City poverty rate: N/A
> City unemployment rate: N/A
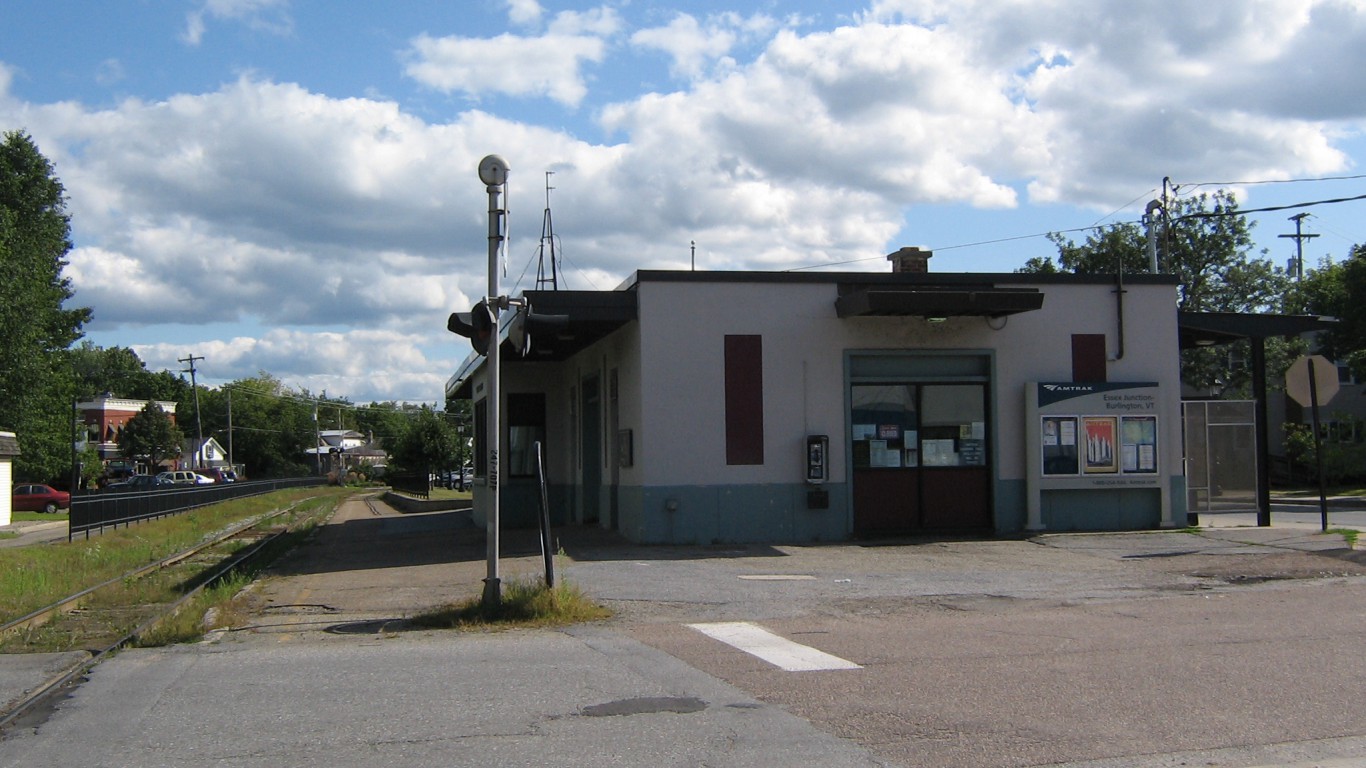
Essex is the only place with a population of 20,000 or more in the state of Vermont with available crime data. While Essex has the highest violent crime rate in Vermont, it is by no means a violent place. In fact, the city had just eight reported violent crimes in 2016, for a rate of 38 incidents per 100,000 people.

46. Danville, Virginia
> City violent crime rate: 804 per 100,000
> State violent crime rate: 218 per 100,000 (4th lowest)
> City poverty rate: 22.5%
> City unemployment rate: 6.0%
Virginia is one of the least violent states in the country. The state’s violent crime rate for 2016 was 218 incidents per 100,000 people, the fourth lowest rate among all U.S. states. While murder typically represents only a small fraction of the total violent crime count, the conditions that drive up violent crime in any given locale do not tend to differ meaningfully from one type of crime to the next. Danville had 16 reported homicides in 2016, and when the city’s population size is factored in, this city had the 14th highest murder rate among more than 2,000 cities considered.
[in-text-ad]

47. Tacoma, Washington
> City violent crime rate: 953 per 100,000
> State violent crime rate: 302 per 100,000 (19th lowest)
> City poverty rate: 17.9%
> City unemployment rate: 5.7%
Tacoma is Washington’s most dangerous city, with a violent crime rate of 953 incidents per 100,000 residents. While this is a relatively high rate — the 96th worst in the country — the city’s incidence of property crime stands out even more. Tacoma had 13,749 reported property crimes in 2016, including 2,619 motor vehicle thefts. When the figure is adjusted for Tacoma’s population size, the city had the 11th highest motor vehicle theft rate of any city.
48. Charleston, West Virginia
> City violent crime rate: 1,552 per 100,000
> State violent crime rate: 358 per 100,000 (24th lowest)
> City poverty rate: 20.0%
> City unemployment rate: 4.9%
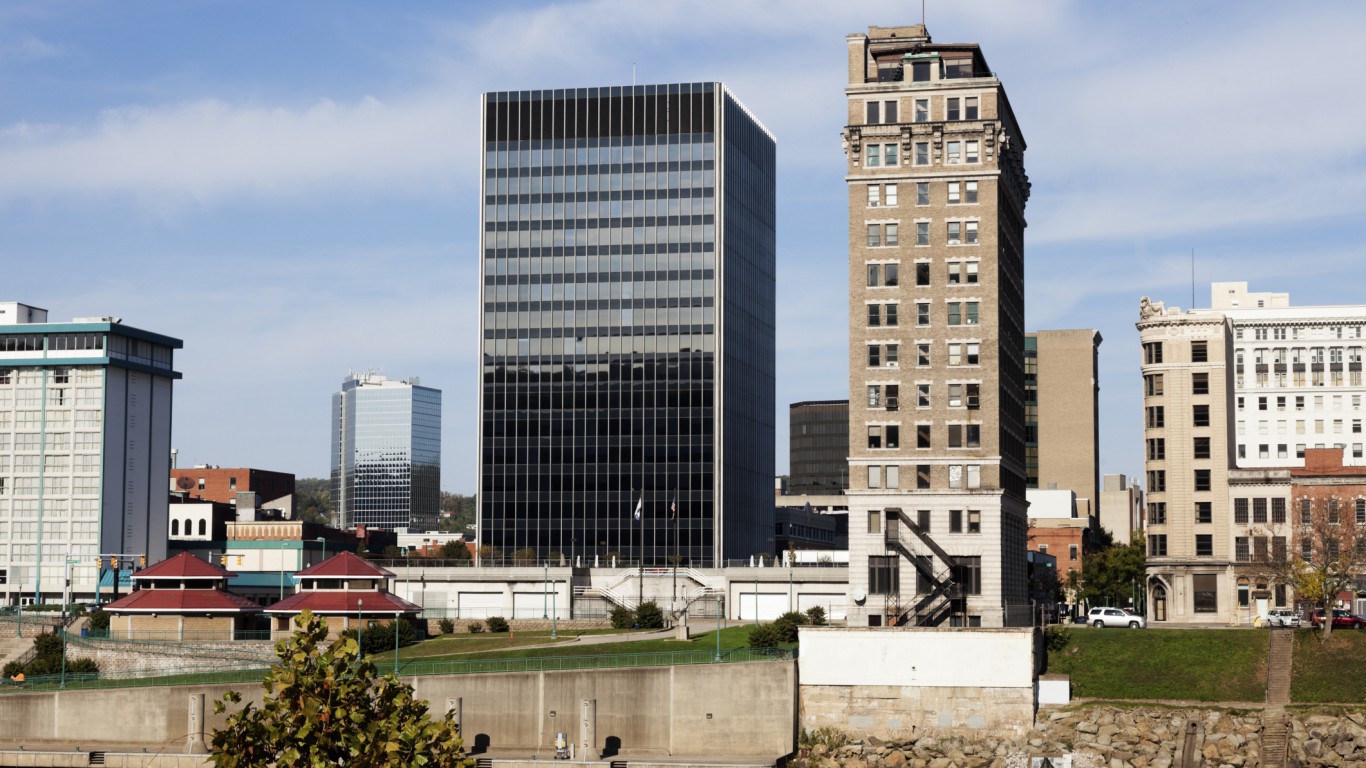
Although West Virginia has several cities with very high crime rates, Charleston’s 2016 violent crime rate of 1,552 incidents per 100,000 people is the state’s worst in the state by a wide margin. Plus, Charleston is also challenged by high rates of nonviolent crime (similar to the levels of assaults, robbery, and murder). Indeed, the city had the country’s 15th highest property crime rate in 2016.

49. Milwaukee, Wisconsin
> City violent crime rate: 1,533 per 100,000
> State violent crime rate: 306 per 100,000 (20th lowest)
> City poverty rate: 28.4%
> City unemployment rate: 4.6%
Of the 41 Wisconsin cities with crime data available for 2016, only four had violent crime rates exceeding the nation’s average of 386 incidents per 100,000 residents. And one city, Milwaukee, had a violent crime rate that greatly surpassed that — amounting to 1,533 incidents per 100,000 residents. Milwaukee is not only the state’s most violent city; it is also the place where most of the state’s violence occurs. Of Wisconsin’s 229 reported homicides for 2016, 141 occurred in Milwaukee. And 9,201 of the state’s 17,679 reported violent crimes for that year happened in the city.
[in-text-ad-2]
50. Rock Springs, Wyoming
> City violent crime rate: 327 per 100,000
> State violent crime rate: 244 per 100,000 (11th lowest)
> City poverty rate: 11.7%
> City unemployment rate: N/A
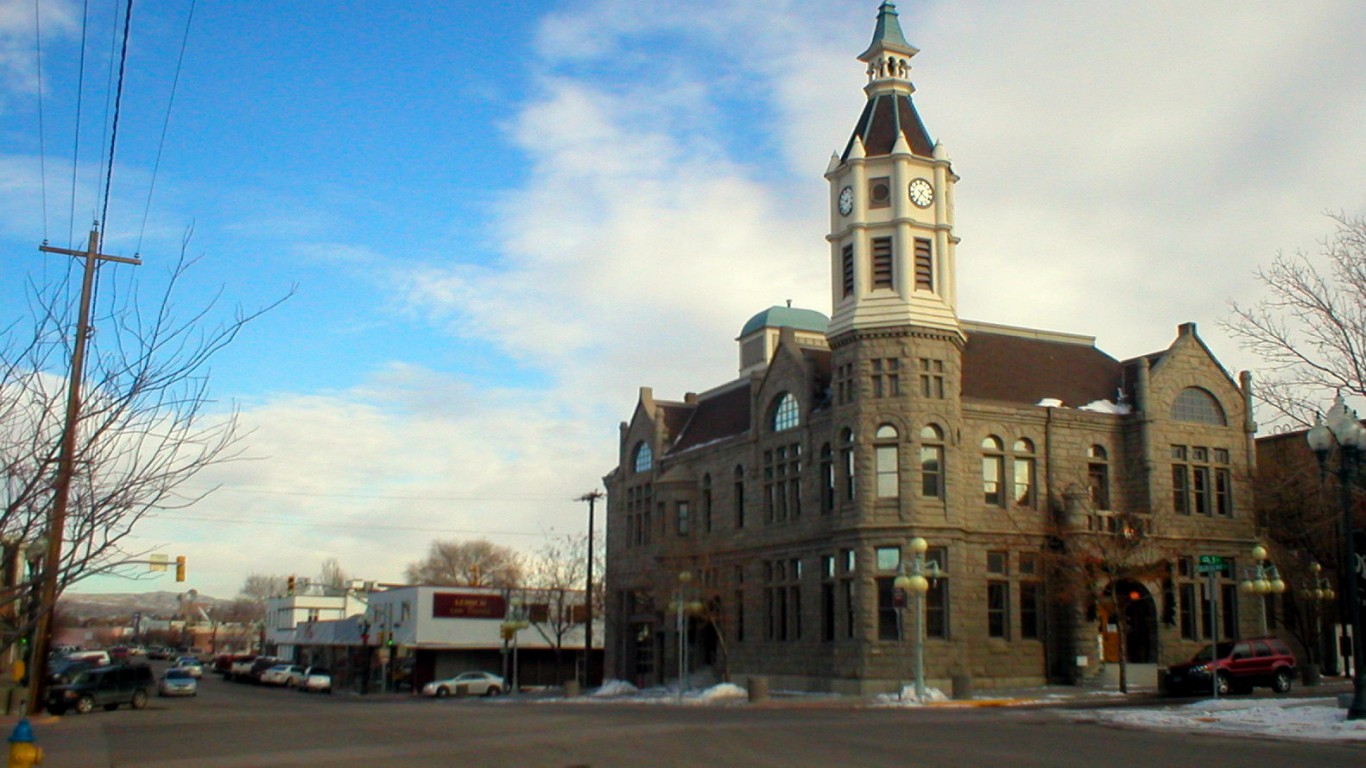
Violent crime is less common in Wyoming than it is in most U.S. states. This explains why in even Wyoming’s most unsafe city, Rock Springs, the violent crime rate is dramatically lower than the nation’s average. Rock Springs, which lies in southern Wyoming, about 45 miles from the Utah border, had for 2016 a violent crime rate of 327 reported incidents per 100,000 residents, sharply below the national average of 386 incidents per 100,000 individuals.
While Rock Springs’ overall violent crime rate is low, it compares very unfavorably with its city counterparts elsewhere in one regard — in the incidence of sexual assault. In 2016 Rock Springs’ rate of reported rapes reached 145 cases per 100,000 residents, the 20th highest rate of any city, and more than three and a half times higher than the national average.
Detailed findings and methodology:
While murder tends to receive the greatest news coverage, these offenses represent only a small portion of violent crime in the United States. This category also includes rapes, robberies, and aggravated assaults. While across the nation aggravated assaults represent the largest share of violent crimes, followed by robbery, the less common — or at least less commonly-reported — murder and rape rates tend to be high in cities challenged with high overall violent crime counts.
Several social and economic factors have been shown to bear a relationship to crime rates, both violent and nonviolent. For example, cities with high unemployment also tend to have high crime rates. Of the 100 cities with the highest violent crime rates and available unemployment figures, just 21 had an annual unemployment rate equal to or below that of the nation.
Many of the cities on this list, and high crime cities in general, also have high poverty rates. of their populations are living in extreme poverty. Of the 100 U.S. Cities with the highest violent crime rates, just a single city — Anchorage, Alaska — has a below-average poverty rate. Of those 100 cities, the average poverty rate is 26.9%, compared to a national poverty rate of 15.1%.
While there has been shown to be a correlation between high poverty rates and unemployment in a city and high violent crime, experts caution that the relationship between crime and socioeconomic factors like these tend to be extremely complex. Blaming the poor, for example, for violent crime, is a far too simplistic way of looking at the issue. John Roman, a senior fellow at NORC at the University of Chicago, emphasized the complexity of the issue.
Roman noted that the presence of poverty can be indicative of many other structural and economic problems in a city that can lead to higher crime rates. The presence of violence can have serious negative effects on the the mental health and economy of the region. Roman noted that the prevalence of poverty and unemployment can reflect an area’s “a long-term lack of opportunity,” which leads to higher rate of crime.
Roman also said that while social and economic factors can contribute to the high violent crime rate of certain cities, other variables play a role. Location is one factor he cited. New York state’s most violent city is Newburgh, almost 70 miles north of New York City and near the junction of Interstates 84 and 90.
“Newburgh is at the intersection of two major interstates, [one going] north [to] south and an [another] east [to] west, so it’s easy to see why that would be an appealing place to put [a] criminal enterprise,” he said. Starting a criminal organization in a city like Newburgh allows for ease in moving illicit substances quickly in both directions, and the presence of such an organization can lead to a rise in crime of all types, he added.
To identify the most dangerous city in each state, 24/7 Wall St. examined the FBI’s 2016 Uniform Crime Report, culling violent crime data for all U.S. cities with populations of 20,000 or more. We examined each state’s figures for murder, nonnegligent manslaughter, rape, robbery, and aggravated assault, which make up violent crime. We also reviewed the FBI’s figures for burglaries, larceny, motor vehicle thefts, and arson, all classified a property crimes. The unemployment rates for each city came from U.S. Bureau of Labor Statistics figures for 2017. The U.S. Census Bureau’s American Community Survey served as our source for poverty rates, median household income figures, and prevalence of adults with high school diplomas or bachelor’s degrees; estimates for the period of 2012 to 2016, were used
Let’s face it: If your money is just sitting in a checking account, you’re losing value every single day. With most checking accounts offering little to no interest, the cash you worked so hard to save is gradually being eroded by inflation.
However, by moving that money into a high-yield savings account, you can put your cash to work, growing steadily with little to no effort on your part. In just a few clicks, you can set up a high-yield savings account and start earning interest immediately.
There are plenty of reputable banks and online platforms that offer competitive rates, and many of them come with zero fees and no minimum balance requirements. Click here to see if you’re earning the best possible rate on your money!
Thank you for reading! Have some feedback for us?
Contact the 24/7 Wall St. editorial team.