Special Report
25 Richest Cities in America

Published:
Last Updated:

Incomes have been on the rise in the United States for the last several years, but of course income levels are not uniform nationwide. According to the U.S. Census Bureau, the typical American household earns $57,617 per year. In some U.S. cities, however, more than half of all households earn well over $70,000 per year.
The median household income in a given city is closely tied to several factors. The wealthiest metropolitan areas are typically home to large college-educated populations. They also have a healthy job market and a concentration of industries that tend to pay higher wages.
The wealthiest cities in the country also tend be geographically concentrated. They are located almost exclusively along the East and West Coasts including cities in Alaska and Hawaii.
24/7 Wall St. reviewed income levels in 382 metropolitan areas to identify the 25 richest cities in America. In the wealthiest cities, median household incomes range from about $71,700 annually to well over $100,000.
Click here to see the 25 richest cities in America.
Click here to see our detailed findings and methodology.
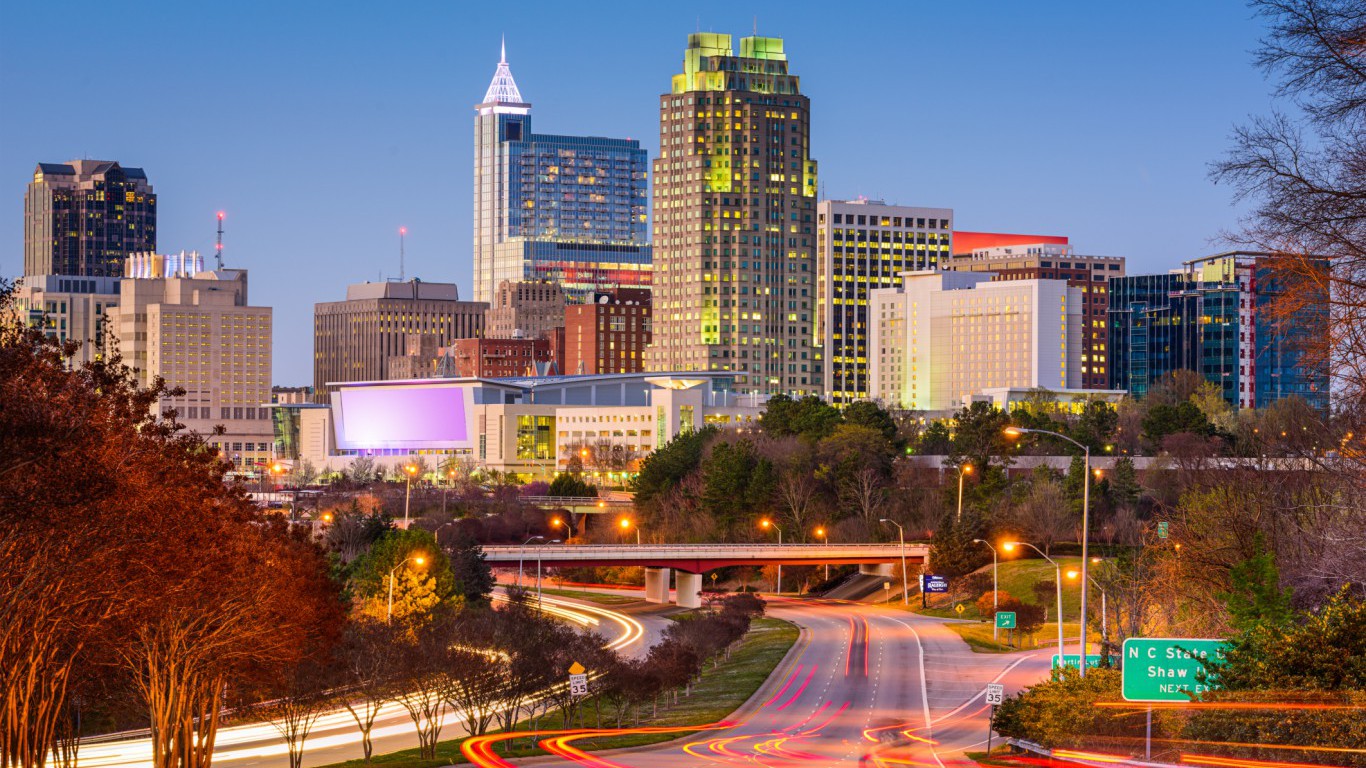
25. Raleigh, NC
> Median household income: $71,685
> Households earning $200,000 or more: 8.0%
> Adults with at least a bachelor’s degree: 47.2%
> March unemployment rate: 3.8%
Raleigh is by far the wealthiest metro area in North Carolina and the 25th wealthiest in the United States. The typical household in the state capital earns $71,685 a year — about $21,000 more than what the typical North Carolina household earns and $14,000 more than what the typical American household earns. The area’s relative high concentration of a high-paying industries likely bolsters the area’s incomes. Some 16.9% of metro area workers are employed in the professional, scientific, and management sector, a larger share than in all but five other metro areas nationwide.
As is the case with most cities on this list, a large share of adults in Raleigh — 47.2% — have a bachelor’s degree. The region is home to several higher education institutions including North Carolina State University. Area colleges and universities awarded 17,891 degrees in 2015 alone.
[in-text-ad]

24. New York-Newark-Jersey City, NY-NJ-PA
> Median household income: $71,897
> Households earning $200,000 or more: 12.1%
> Adults with at least a bachelor’s degree: 39.0%
> March unemployment rate: 4.4%
New York is the most populous metro area in the United States — and also one of the wealthiest. The typical household in the metro area earns $71,897 a year, more than in any other metro area in New York state and well above the national median household income of $57,617. The area’s high incomes, however, are largely offset by a high cost of living. Goods and services in New York-Newark-Jersey City are about 22% more expensive than they are on average nationwide.
New York City is home to a number of high paying industries — most famously finance. Some 9.2% of the metro area labor force work in the finance, insurance, and real estate industry, one of the largest shares of any U.S. metro area.

23. Denver-Aurora-Lakewood, CO
> Median household income: $71,926
> Households earning $200,000 or more: 9.0%
> Adults with at least a bachelor’s degree: 42.5%
> March unemployment rate: 2.8%
The metro area around Colorado’s capital city is the second wealthiest in the state and 23rd wealthiest in the country. The typical household in Denver earns $71,926 a year compared to the median income of $65,685 in Colorado and the national median of $57,617.
The area’s high median income is partially attributable to a strong job market. As of March 2018, just 2.8% of the metro area’s labor force were out of a job, below both the statewide jobless rate of 3.0% and the national rate of 4.1%. Major employers in the Denver metro area include defense contractors Lockheed Martin and Raytheon, financial services company Charles Schwab, several hospitals and health care providers, as well as technology companies like Oracle and Level 3 Communications.

22. Kahului-Wailuku-Lahaina, HI
> Median household income: $72,268
> Households earning $200,000 or more: 9.1%
> Adults with at least a bachelor’s degree: 24.7%
> March unemployment rate: 1.9%
Kahului-Wailuku-Lahaina’s median household income of $72,268 a year is the second highest in Hawaii and the 22nd highest of all metro areas nationwide. The area’s median income is bolstered by one of the lowest jobless rates in the country. Just 1.9% of the area’s labor force are out of work, the second lowest unemployment rate of any metro area nationwide and well below the 4.1% U.S. unemployment rate.
The area’s high incomes may be necessary as a dollar spent there does not go as far as it does in the United States as a whole. Goods and services in Kahului-Wailuku-Lahaina are about 7% more expensive than they are on average nationwide.
[in-text-ad-2]
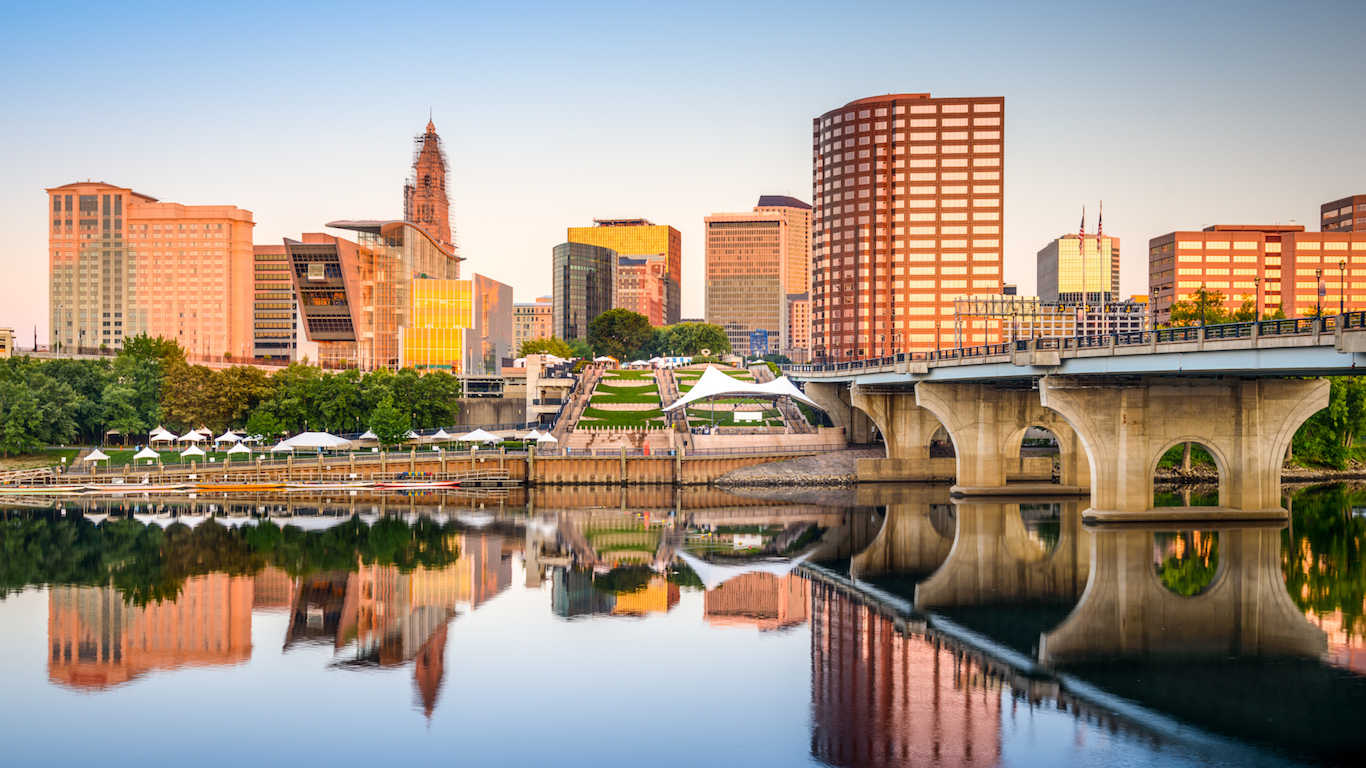
21. Hartford-West Hartford-East Hartford, CT
> Median household income: $72,559
> Households earning $200,000 or more: 9.3%
> Adults with at least a bachelor’s degree: 38.2%
> March unemployment rate: 4.7%
Hartford is one of two metro areas in Connecticut to rank among the highest earning in the nation. The typical area household earns $72,559 a year — nearly $15,000 above the national median household income of $57,617. Connecticut is one of the wealthiest states in the country, and despite ranking as one of the wealthiest metro areas in the country, Hartford’s median income is lower than the state as a whole. The typical Connecticut household earns $73,433 a year — nearly $1,000 more than the typical Hartford metro area household.
Hartford’s median income is bolstered by high paying industries. Some 10.9% of the metro area workforce are employed in finance, insurance, and real estate, nearly the highest concentration of any metro area. Nicknamed “The Insurance Capital of the World,” Hartford is home to some of the largest health insurance companies by revenue, including Aetna and Cigna.

20. Minneapolis-St. Paul-Bloomington, MN-WI
> Median household income: $73,231
> Households earning $200,000 or more: 8.2%
> Adults with at least a bachelor’s degree: 40.5%
> March unemployment rate: 3.3%
Minneapolis-St. Paul-Bloomington is the only metro area in Midwest to rank among the wealthiest in the country. The typical Twin Cities household earns $73,231 a year, well above the median income across Minnesota of $65,599 and the median across the United States of $57,617.
Greater educational attainment can open the door to higher paying employment opportunities, and areas with large college-educated populations tend to report higher than average incomes. In the Minneapolis metro area, 40.5% of adults have a bachelor’s degree or higher, well above the 31.3% of American adults and the 34.8% of adults across the state with comparable education.
[in-text-ad]

19. Vallejo-Fairfield, CA
> Median household income: $73,900
> Households earning $200,000 or more: 7.6%
> Adults with at least a bachelor’s degree: 25.4%
> March unemployment rate: 4.1%
Half of all households in Vallejo-Fairfield earn at least $73,900 a year. The metro area is one of seven in California to rank among the 25 wealthiest in the country. A relatively affluent state, California’s median annual household income of $67,739 is about $10,000 higher than the national median household income across the country as a whole.
In Vallejo-Fairfield — and the rest of California — high incomes are partially offset by a high cost of living. Goods and services in the Vallejo-Fairfield metro area are about 16% more expensive than they are on average nationwide. The cost of living across California as a whole is about 13% higher than average.

18. Santa Rosa, CA
> Median household income: $73,929
> Households earning $200,000 or more: 8.6%
> Adults with at least a bachelor’s degree: 33.9%
> March unemployment rate: 2.8%
The Santa Rosa metro area in northern California is one of the most expensive places to live in the country. Goods and services in the metro area are about 19% more expensive than they are nationwide on average. Additionally, the majority of homes in the area are worth over half a million dollars.
Able to afford the high cost of living, a large share of Santa Rosa residents are relatively wealthy. The typical household in the metro area earns $73,929 a year, well above the national median household income of $57,617.
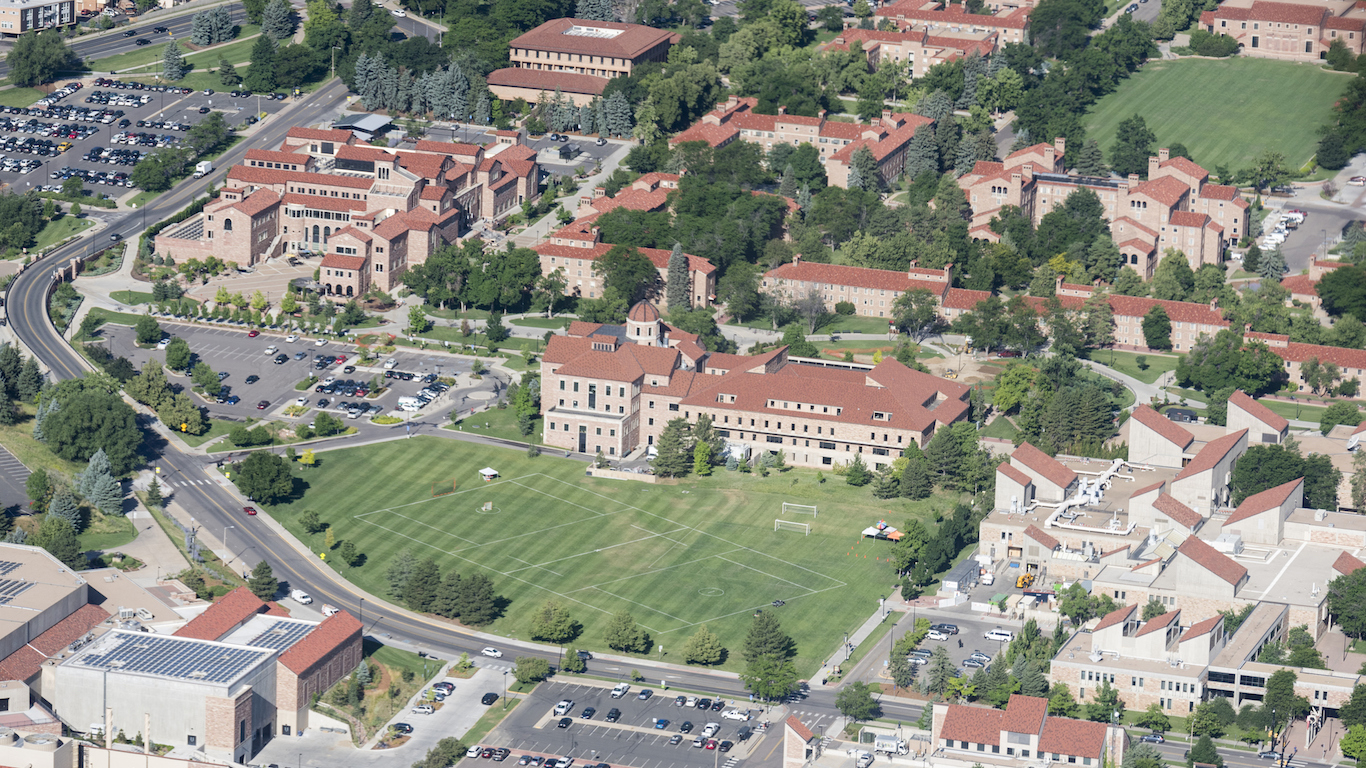
17. Boulder, CO
> Median household income: $74,615
> Households earning $200,000 or more: 12.2%
> Adults with at least a bachelor’s degree: 60.6%
> March unemployment rate: 2.5%
Higher education can open doors to higher paying jobs, and areas with more college-educated adults often have higher income levels. In Boulder, 60.6% of the adult population has a bachelor’s degree or higher, the largest share of any U.S. metro area. The area also ranks among the wealthiest in the nation. The typical Boulder household earns $74,615 a year compared to the $65,685 statewide median and the $57,617 median income nationwide.
High incomes are also reflected in the metro area’s property values. The typical home in Boulder is worth $467,600, more than double the median home value nationwide of $205,000.
[in-text-ad-2]

16. Napa, CA
> Median household income: $75,077
> Households earning $200,000 or more: 11.9%
> Adults with at least a bachelor’s degree: 35.1%
> March unemployment rate: 3.2%
With more than half of all households in the metro area earning at least $75,000 a year, Napa, California, is one of the wealthiest metro areas in the United States. Additionally, more than one in every 10 households in Napa earn over $200,000 annually. In comparison, just 6.4% of all American households earn $200,000 or more per year.
Napa’s wealth is underscored by the relative scarcity of serious financial hardship. Just 7.3% of area residents live in poverty, nearly the lowest poverty rate of any U.S. metro area and about half the U.S. poverty rate of 14.0% and the California rate of 14.3%.
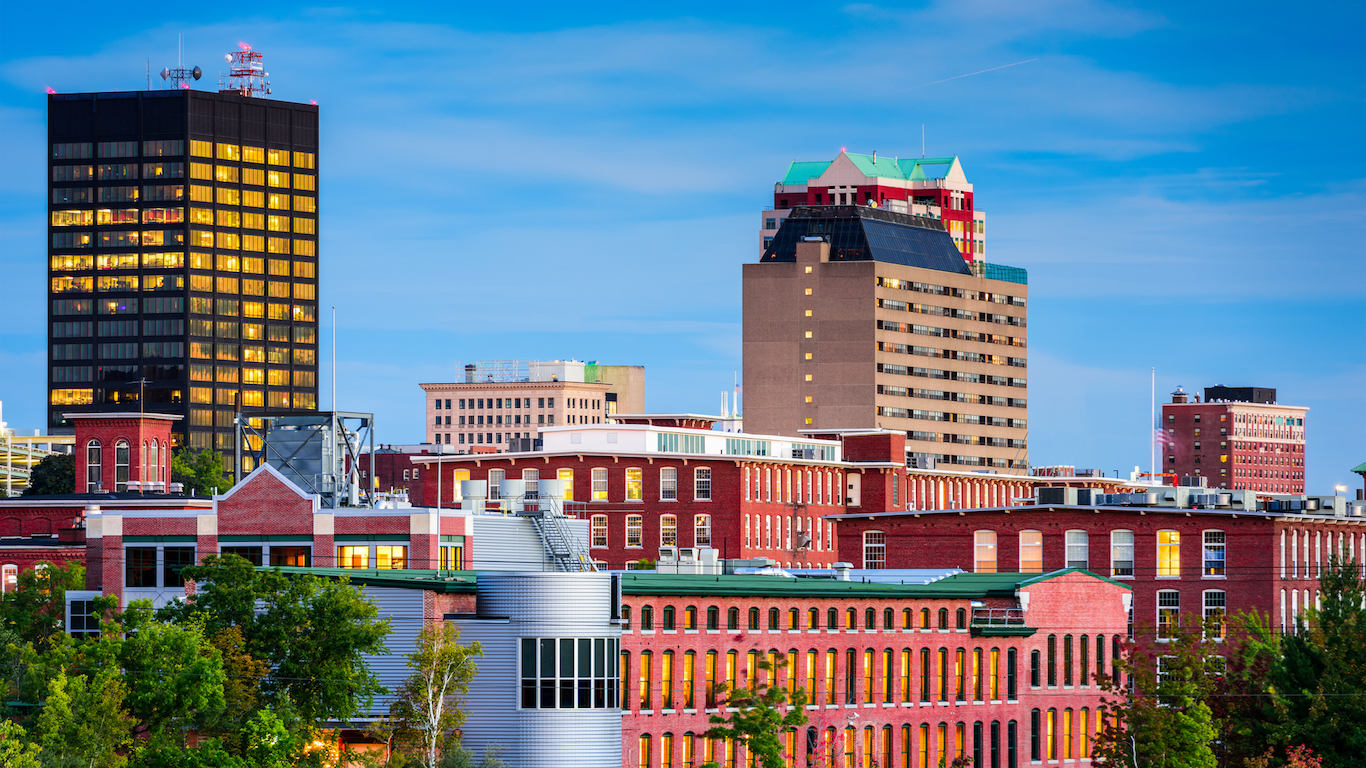
15. Manchester-Nashua, NH
> Median household income: $76,254
> Households earning $200,000 or more: 7.5%
> Adults with at least a bachelor’s degree: 37.3%
> March unemployment rate: 2.8%
Manchester-Nashua is one of four metro areas in the New England region to rank among the wealthiest in the country. The typical area household earns $76,254 a year, or about $18,600 more than the typical American household.
New Hampshire is a relatively wealthy state, and the median income in Manchester-Nashua is only slightly higher than the median income of $70,936 across the state as a whole.
[in-text-ad]

14. Baltimore-Columbia-Towson, MD
> Median household income: $76,788
> Households earning $200,000 or more: 9.9%
> Adults with at least a bachelor’s degree: 39.5%
> March unemployment rate: 4.6%
Maryland is the wealthiest state in the country. The typical Maryland household earns $78,945 a year, or $21,328 more than the typical American household. Even with a median annual household income of $76,788, the Baltimore metro area’s income — which is 14th highest of U.S. metro areas — falls below its home state median income.
Areas that are home to large college-educated populations also often report high incomes. In the Baltimore metro area, 39.5% of adults have a bachelor’s degree, in line with the 39.3% bachelor’s degree attainment rate across Maryland. Nationwide, 31.3% of American adults have a bachelor’s degree or higher.
13. Fairbanks, AK
> Median household income: $77,328
> Households earning $200,000 or more: 4.3%
> Adults with at least a bachelor’s degree: 31.5%
> March unemployment rate: 6.9%
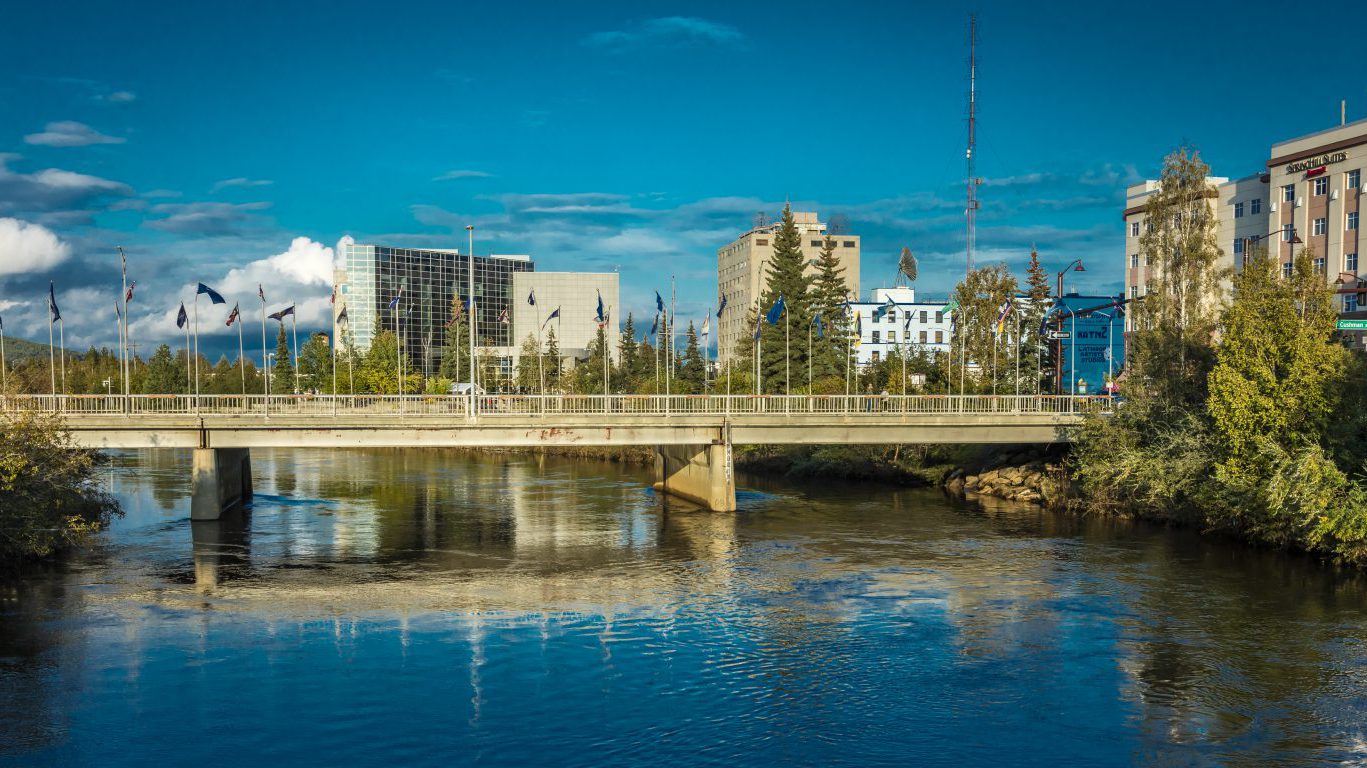
Fairbanks is the second wealthiest metro area in Alaska and the 13th wealthiest nationwide. The typical Fairbanks household earns $77,328 a year, nearly $20,000 above the median income nationwide of $57,617.
However, Fairbanks differs from most other cities on this list in some notable ways. First, the metro area has a near nation-leading 6.9% unemployment rate, well above the 4.1% U.S. jobless rate in March. Additionally, despite a high median income, relatively few area households are exceptionally wealthy. Just 4.3% of households in Fairbanks earn $200,000 or more per year compared to 6.4% of households nationwide.

12. Santa Cruz-Watsonville, CA
> Median household income: $77,613
> Households earning $200,000 or more: 12.2%
> Adults with at least a bachelor’s degree: 40.5%
> March unemployment rate: 6.3%
The median household income of $77,613 in Santa Cruz-Watsonville is the 12th highest of any metro area in the country and the fourth highest in California. High-income areas often have a high cost of living, and Santa Cruz-Watsonville is one of the most expensive places to live in the United States. Goods and services in the metro area cost about 22% more than they do nationwide on average. High housing costs drive up the overall cost of living. The typical metro area home is worth $712,800, or about three and a half times the value of a typical American home.
[in-text-ad-2]
11. Trenton, NJ
> Median household income: $77,650
> Households earning $200,000 or more: 13.4%
> Adults with at least a bachelor’s degree: 42.7%
> March unemployment rate: 4.0%
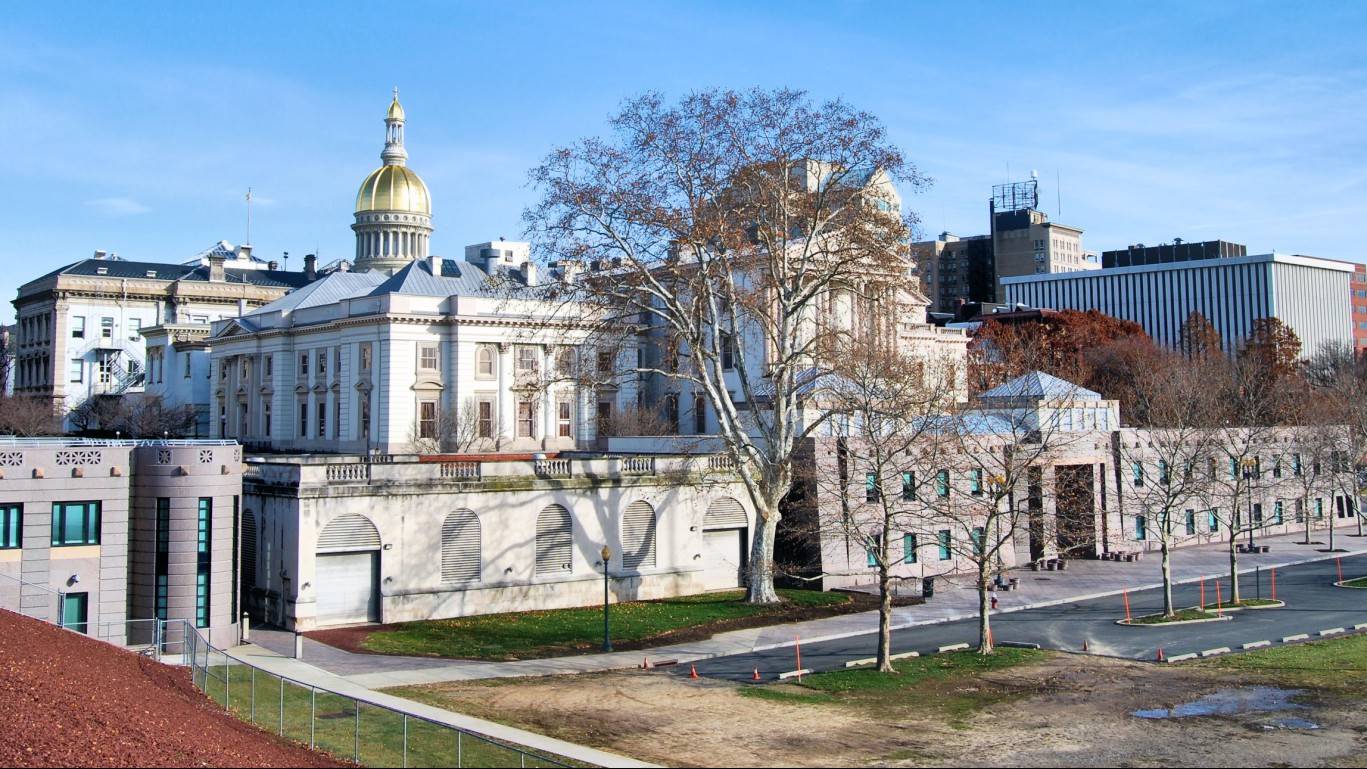
The typical household in New Jersey earns $76,126 a year, or about $18,500 more than the typical American household and the third highest state median household income after only Maryland and Alaska. While the state as a whole is relatively wealthy, Trenton is the only one of the four metro areas in New Jersey to rank among the wealthiest in the country. The median household income in Trenton of $77,650 a year is about $1,500 more than the statewide median and $20,000 more than the national median.
As is the case in most high income areas, Trenton is home to a large college-educated population. Some 42.7% of adults in Trenton have a bachelor’s degree or higher, compared to 31.3% of American adults nationwide.

10. California-Lexington Park, MD
> Median household income: $78,195
> Households earning $200,000 or more: 6.6%
> Adults with at least a bachelor’s degree: 26.1%
> March unemployment rate: 4.5%
California-Lexington Park is the wealthiest metro area in the wealthiest state. The typical metro area household earns $78,195 per year, in line with the $78,945 statewide median income — both of which are well above the national median household income of $57,617.
Most wealthy metro areas are home to a relatively large share of college educated residents, but not California-Lexington Park. Just 26.1% of area adults have a bachelor’s degree, below both the 31.3% college attainment rate nationwide and the 39.3% rate statewide.
[in-text-ad]

9. Seattle-Tacoma-Bellevue, WA
> Median household income: $78,612
> Households earning $200,000 or more: 11.0%
> Adults with at least a bachelor’s degree: 42.0%
> March unemployment rate: 3.9%
A number of the wealthiest metropolitan areas in the country can be found on the West Coast, and nearly all of these in California. The exception is the Seattle-Tacoma-Bellevue metropolitan area, which has a median household income of just under $80,000. Tech industry jobs tend to pay relatively well, and the greater Seattle area hosts the operations of some of the largest tech companies in the world. Amazon, Microsoft, Facebook, and Google all are major area employers.

8. Oxnard-Thousand Oaks-Ventura, CA
> Median household income: $80,135
> Households earning $200,000 or more: 11.4%
> Adults with at least a bachelor’s degree: 33.6%
> March unemployment rate: 3.6%
Oxnard-Thousand Oaks-Ventura is one of only eight U.S. metro areas where the majority of households earn over $80,000 per year. For most residents, high incomes are necessary to afford the area’s high cost of living. Goods and services in the metro area are about 16% more expensive than they are on average nationwide. Housing is a significant component of the area’s high cost of living. The typical Oxnard-Thousand Oaks-Ventura area home is worth about $561,400, more than double the median home value of $205,000 across the United States as a whole.
7. Urban Honolulu, HI
> Median household income: $80,513
> Households earning $200,000 or more: 10.1%
> Adults with at least a bachelor’s degree: 34.4%
> March unemployment rate: 1.9%
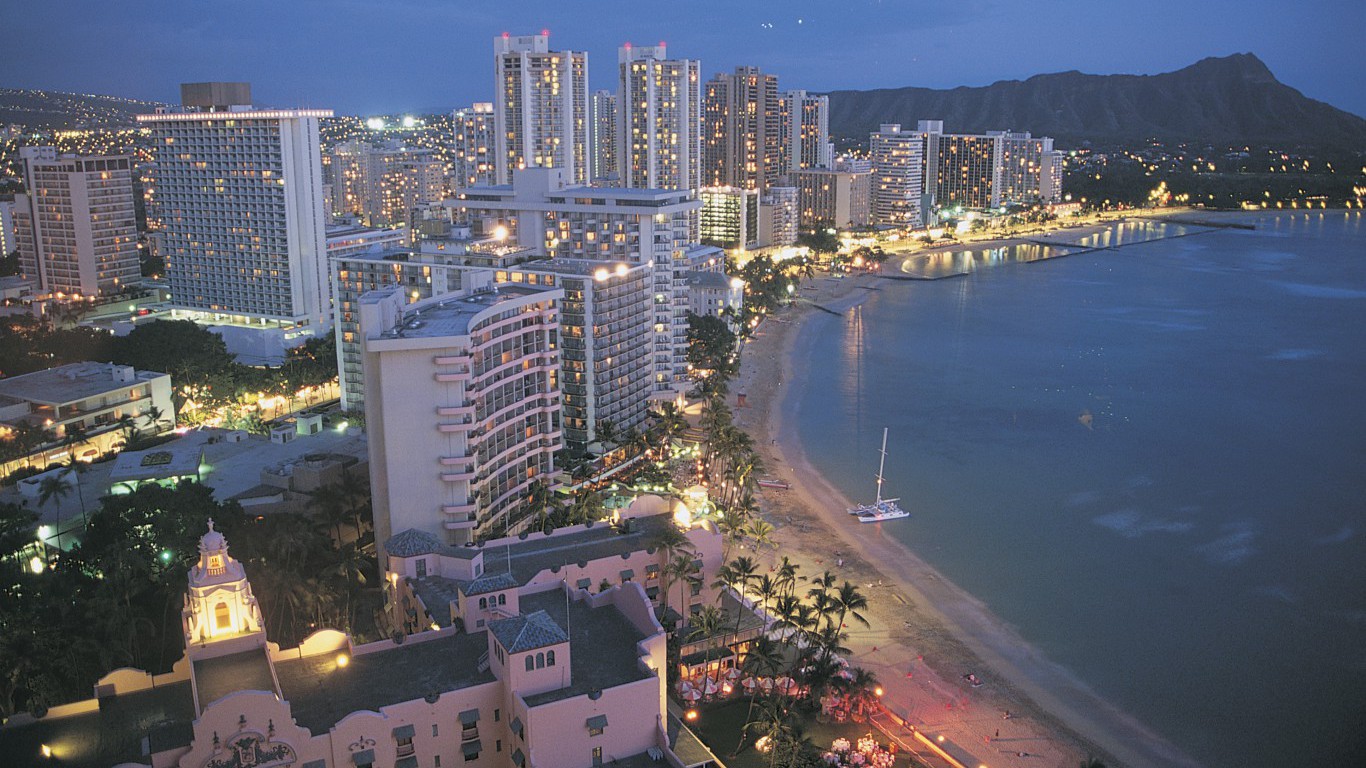
Urban Honolulu is the wealthiest of Hawaii’s two metro areas, and one of the wealthiest cities in the country. The typical area household earns $80,513 a year, more than the median income in all but six other U.S. cities. The high incomes are partially offset by a high cost of living — the highest of any U.S. metro area. Goods and services cost 25% more in Urban Honolulu than they do nationwide on average. Housing costs drive up the cost of living considerably. The typical metro area home is worth $658,900 — more than three times the value of the typical American home.
[in-text-ad-2]
6. Anchorage, AK
> Median household income: $82,203
> Households earning $200,000 or more: 9.4%
> Adults with at least a bachelor’s degree: 32.2%
> March unemployment rate: 7.2%
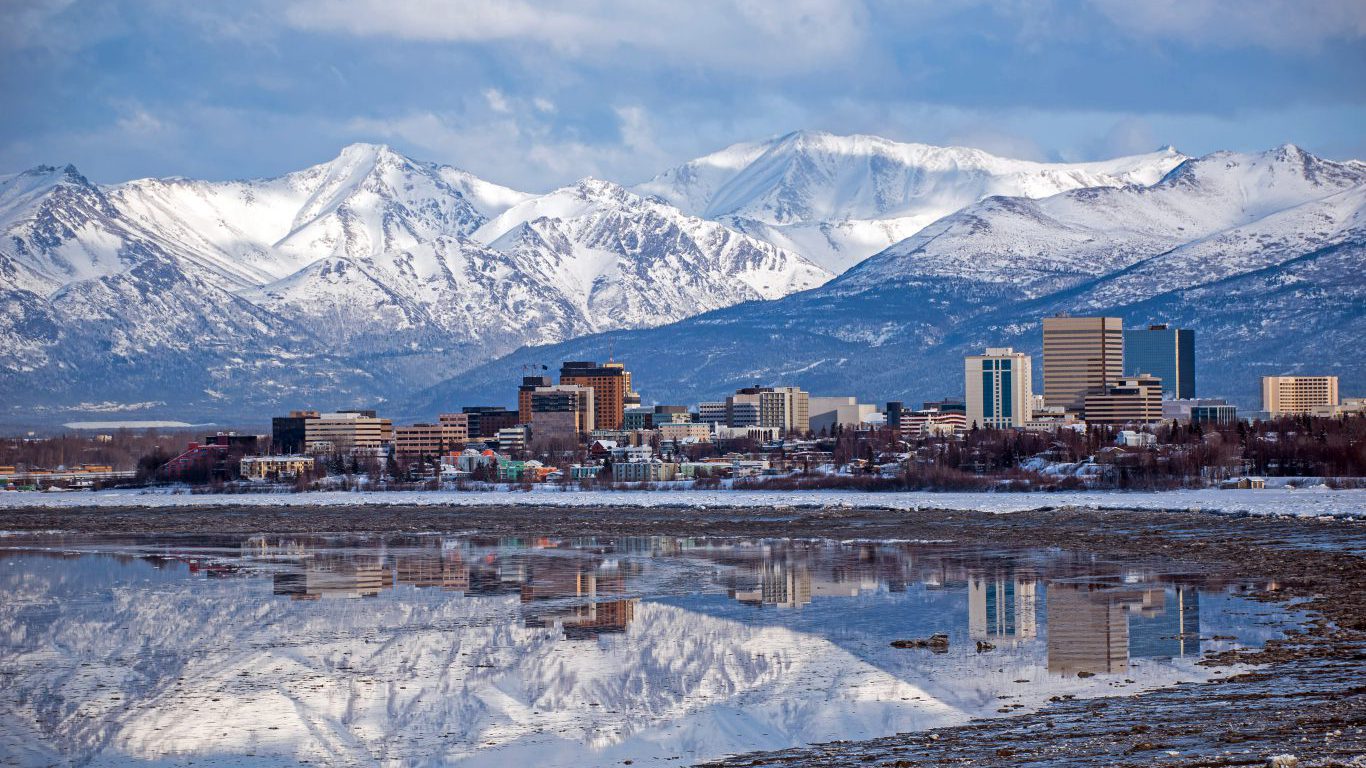
The climate of Alaska is not for everyone, with its frigid and dark winters and lukewarm summers. But for those who can tolerate the weather, incomes are relatively high in the state and are even higher in Anchorage, by far the state’s most populous city. The typical anchorage household earns about $25,000 more a year than the typical U.S. household income. However, the cost of living is relatively high in the state thanks, in part, to the cost of transporting goods across difficult terrain. But even adjusting for the cost of living, Anchorage residents are still some of the wealthiest in the country.

5. Boston-Cambridge-Newton, MA-NH
> Median household income: $82,380
> Households earning $200,000 or more: 13.1%
> Adults with at least a bachelor’s degree: 46.9%
> March unemployment rate: 3.4%
The metro area around the Massachusetts state capital is the fifth wealthiest in the United States and the second wealthiest in New England. The typical household in the Boston metro area earns $82,380 a year, or nearly $25,000 more than the typical U.S. household income of $57,617.
The Boston metro area is home to a number of higher education institutions — including Boston University, Harvard University, and Northeastern University — which awarded over 100,000 degrees in 2015 alone. Partially as a result, the metro area is one of the best educated in the United States. Some 46.9% of area adults have a bachelor’s degree or higher, compared to 31.3% of American adults.
[in-text-ad]
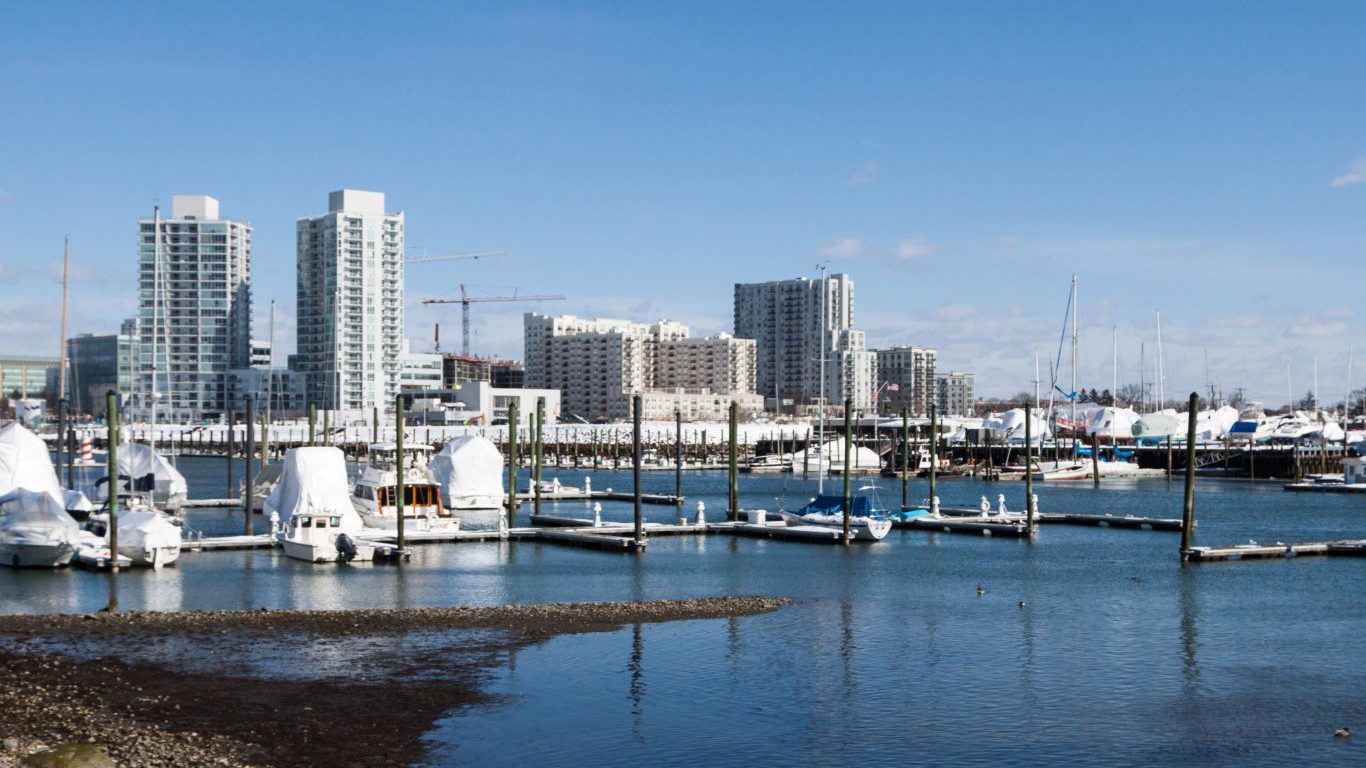
4. Bridgeport-Stamford-Norwalk, CT
> Median household income: $90,123
> Households earning $200,000 or more: 19.2%
> Adults with at least a bachelor’s degree: 46.6%
> March unemployment rate: 4.6%
The Bridgeport-Stamford-Norwalk, Connecticut metropolitan area, also known as Fairfield County, is home to many wealthy professionals who commute into New York City. Almost 20% of the county’s households earn at least $200,000 a year, the third highest share among metro areas and triple the U.S. share. However, the county is also home to Bridgeport, one of the poorest cities in the United States. Poverty in Bridgeport is not enough to keep the metropolitan area from ranking as the fourth most affluent in the United States.
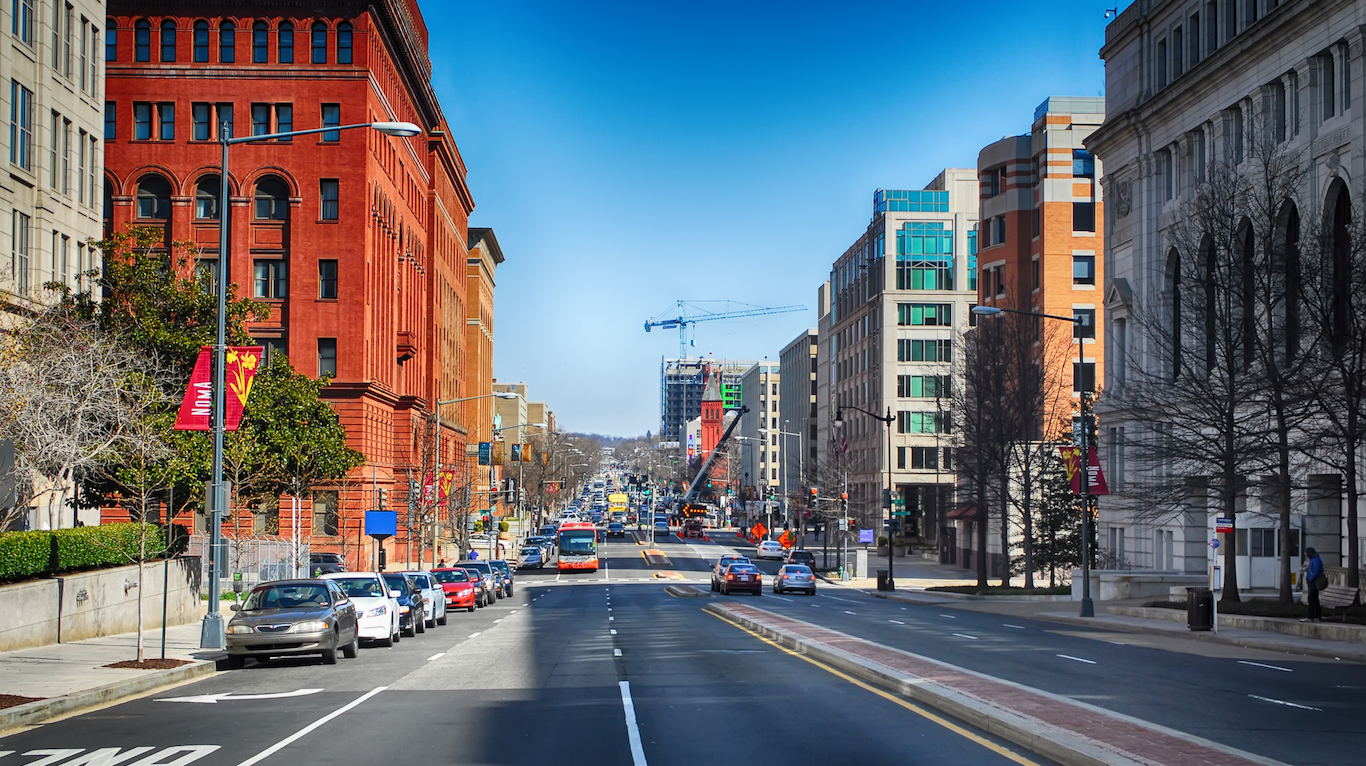
3. Washington-Arlington-Alexandria, DC-VA-MD-WV
> Median household income: $95,843
> Households earning $200,000 or more: 16.2%
> Adults with at least a bachelor’s degree: 50.2%
> March unemployment rate: 3.6%
No East Coast metro area has a more affluent population than the greater D.C. area. The metropolitan area serving the district, which includes parts of Virginia, Maryland, and West Virginia, has a median household income in excess of $95,000. As the nation’s capital, D.C. is home to many high paying legal, government, and other professional jobs. Over 20% of the metro area’s workforce are employed in the professional, scientific, and management industry, the second highest share of any metro area in the country. The D.C. area is one of just eight where over 50% of adults have at least a bachelor’s degree.

2. San Francisco-Oakland-Hayward, CA
> Median household income: $96,677
> Households earning $200,000 or more: 19.5%
> Adults with at least a bachelor’s degree: 48.5%
> March unemployment rate: 2.7%
The typical San Francisco area household earns $96,677 annually. It would take almost three households combined in the Laredo, Texas metropolitan area — the poorest in the country — to earn as much money. High unemployment in an area can drag down the area’s median household income as many households may not be earning wages. In San Francisco, just 2.7% of the labor force is unemployed, one of the lowest jobless rates in the country.
Areas with high incomes often also have high overall cost of living, and this is certainly the case in San Francisco. Housing expenses are notably high, as the typical home value of just under $800,000 is about four times the U.S. median home value. However, the Bay Area’s high incomes are more than enough to offset the high cost of living.
[in-text-ad-2]
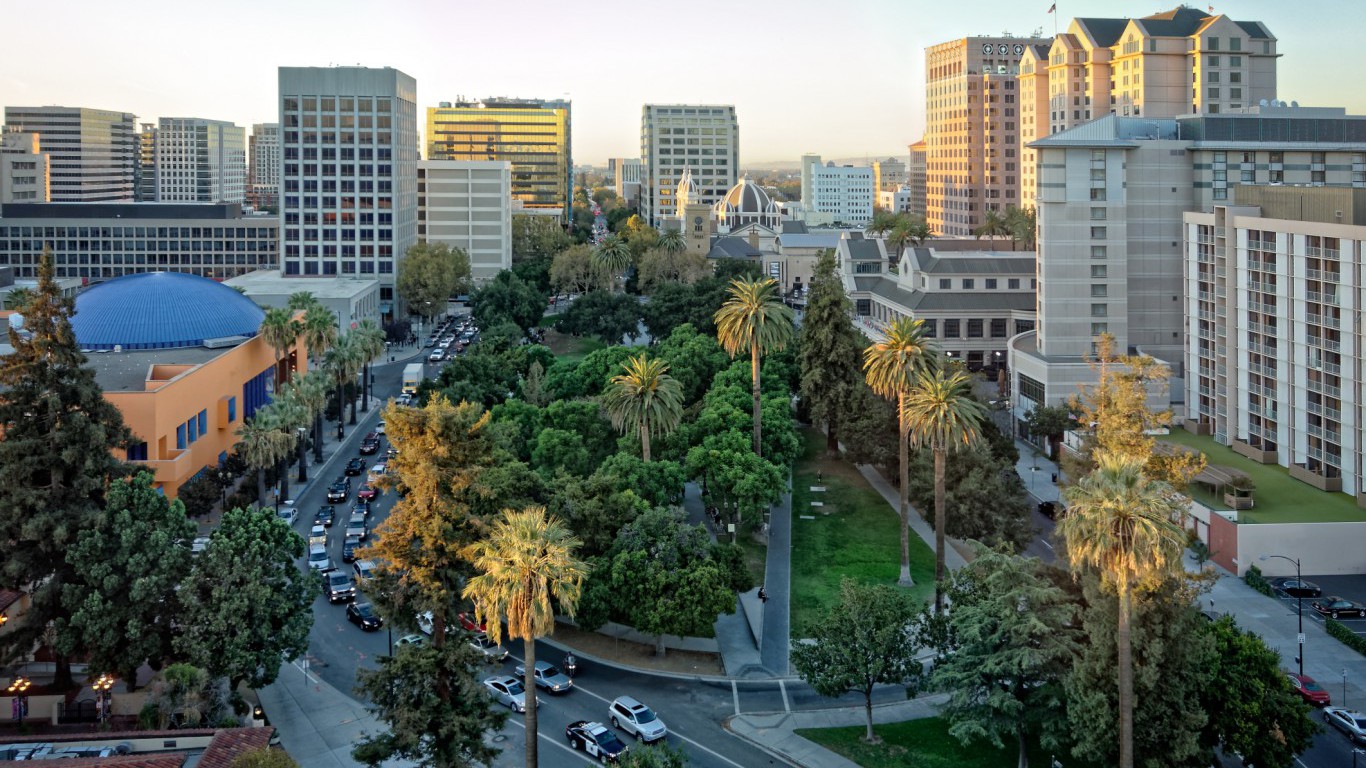
1. San Jose-Sunnyvale-Santa Clara, CA
> Median household income: $110,040
> Households earning $200,000 or more: 22.8%
> Adults with at least a bachelor’s degree: 50.1%
> March unemployment rate: 2.7%
The San Jose metro area is by far the wealthiest in the country. The area’s median income surpasses incomes in the next wealthiest metro area — nearby San Francisco — by over $13,000. San Jose covers much of Silicon Valley, a tech hub at the southern end of the San Francisco Bay Area. The area’s high incomes are attributable to the presence of some of the most recognizable and innovative companies in the world. Some of the region’s largest employers include Adobe Systems, Apple, Intel, Lockheed Martin, and NASA. Over one in four workers in the metro area are employed in either the information or the professional, scientific, and management industries. Nationwide, just 13.5% of all workers are employed in these sectors.
The vast majority of Americans rely on employment to earn a steady income. The most prosperous metro areas in the country often have relatively strong job markets, as evidenced by low unemployment. The March 2018 unemployment rate in the United States was 4.1%. In 17 of the 25 cities on this list, the March jobless rate was equal to or lower than the U.S. figure. In eight cities on this list, less than 3% of the labor force was out of work in March.
While a healthy job market is important for any metro area’s economy, the kinds of jobs available contribute significantly to income levels. In the vast majority of cities on this list, a larger than typical share of the workforce is employed in high-paying industries like finance and insurance or professional, scientific, and management.
Of course, such high-paying jobs often require higher education and skill levels. Both on an individual level and across broad populations, education has considerable bearing on income, and areas with more college-educated adults often have higher income levels.
In the United States, 31.3% of adults have a bachelor’s degree or higher. The share of college-educated adults exceeds the national share in all but three of the wealthiest cities. In 12 metro areas on this list, over 40% of adults have at least a bachelor’s degree. In three, over half of the adult population has a four-year college degree.
Income inequality is a growing problem in the United States. The disparities are often especially apparent in major cities, where great wealth can exist alongside abject poverty. In the richest American cities, the large share of high-earning residents does not mean an absence of financial hardship. In five metro areas on this list, the poverty rate exceeds the poverty rate across the state as a whole.
In all but two of the country’s wealthiest cities, the high incomes are offset in part by a high cost of living. Raleigh, North Carolina, and California-Lexington Park, Maryland, are the only metro areas to rank among the wealthiest in the country where goods and services are less expensive than they are nationwide on average. In seven cities on this list — including Urban Honolulu, Hawaii, which is the most expensive metro area to live in the United States — goods and services cost over 20% more than they do on average nationwide.
One of the most impactful components of cost of living is housing costs. In every metro area on this list, the typical home is worth more than $205,000 — the national median home value. In eight cities on this list, the typical home is worth over half a million dollars.
To identify the richest cities in America, 24/7 Wall St. reviewed data from the U.S. Census Bureau’s 2016 American Community Survey. We identified the 25 U.S. metropolitan statistical areas with the highest median household incomes. Poverty rates, median home values, and educational attainment rates also came from the ACS. Unemployment rates are from the Bureau of Labor Statistics and are as of March 2018, the most recent period for which data is available. Cost of living by metro area, or regional price parity, is for 2015 and came from the Bureau of Economic Analysis.
Retirement planning doesn’t have to feel overwhelming. The key is finding professional guidance—and we’ve made it easier than ever for you to connect with the right financial advisor for your unique needs.
Here’s how it works:
1️ Answer a Few Simple Questions
Tell us a bit about your goals and preferences—it only takes a few minutes!
2️ Get Your Top Advisor Matches
This tool matches you with qualified advisors who specialize in helping people like you achieve financial success.
3️ Choose Your Best Fit
Review their profiles, schedule an introductory meeting, and select the advisor who feels right for you.
Why wait? Start building the retirement you’ve always dreamed of. Click here to get started today!
Thank you for reading! Have some feedback for us?
Contact the 24/7 Wall St. editorial team.