
Consumer spending is the primary driver of economic growth in the United States. After climbing for eight consecutive years, U.S. consumer spending hit an all-time high of $13.4 trillion in 2017.
But it is where Americans choose to spend their money that is key to the success of many companies. For customer facing businesses — such as retail stores, banks, gyms, and restaurants — the ability to get people in the door means the difference between success and failure.
24/7 Wall St. reviewed foot traffic patterns provided by data service company Placed Insights, which calculated the percentage of Americans 13 and older who visited various stores in April 2018. We also reviewed U.S. sales and store count data from company financial documents.
The most popular stores in the country tend to share several common qualities. Notably, they all sell items that are practical, everyday necessities such as food, clothing, or medicine, and therefore are not limited to a singular target demographic.
Eight of the 25 most popular stores in the country are fast food restaurants. Several more, including Walmart, Kroger, and Target are grocery stores or department stores with grocery sections.
Not only do the most popular stores have broad appeal, but also they are nearly ubiquitous. Each of the companies on this list has hundreds, thousands, or even tens of thousands of stores in the United States.
The companies on this list often invest considerably in advertising to increase their brand’s visibility and build a reliable customer base. Multiple companies on this list have among the largest advertising budgets. For brands like Dunkin Donuts, Home Depot, and Walgreens, ad spending reached several hundred million dollars in 2016 alone. Target and Bank of America each spent more than $1 billion that year, while Walmart’s ad spending topped $2 billion — two-thirds of which went to television spots.
Click here to see the 25 most popular stores in America.
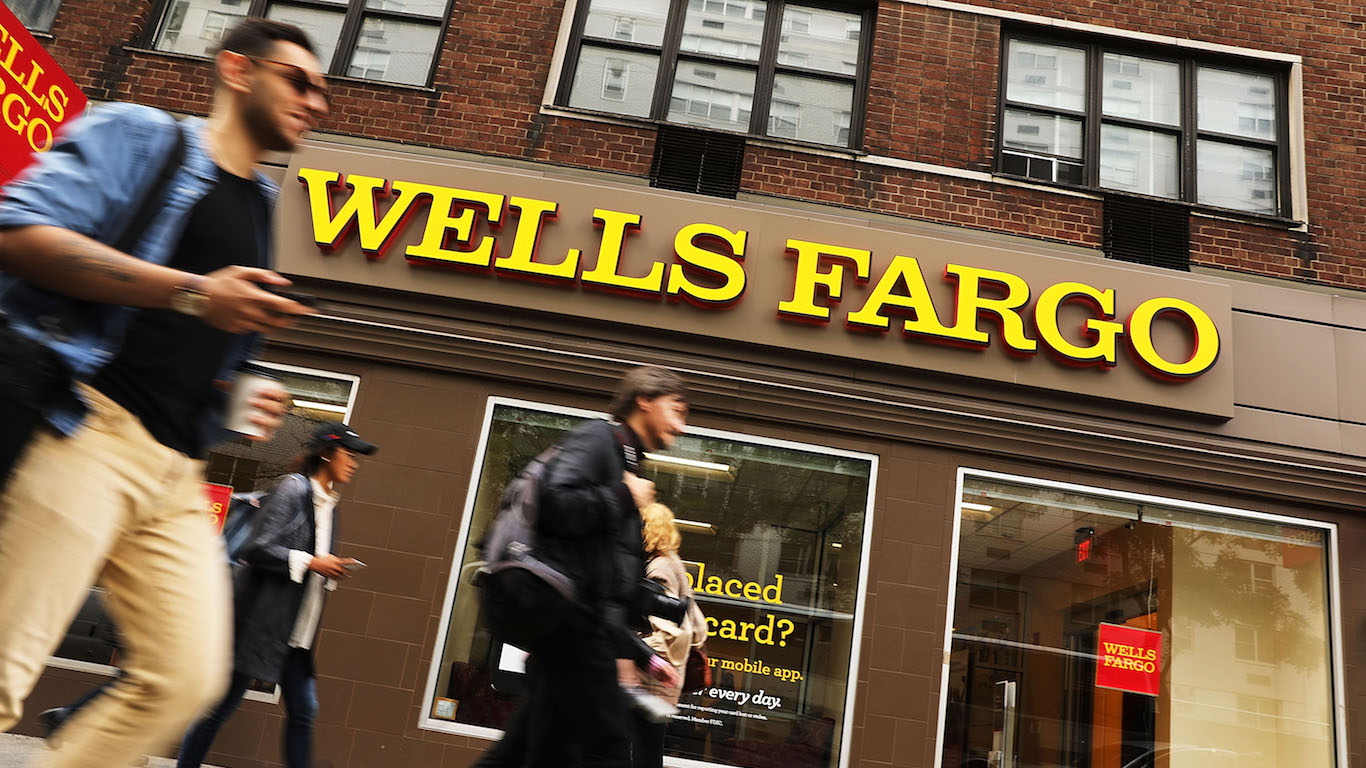
25. Wells Fargo
> % of shoppers visiting in April: 11.1%
> % of bank visitors in April: 19.0%
> # of U.S. stores: 8,300 (worldwide)
> Annual revenue: $88.4 billion
[in-text-ad]
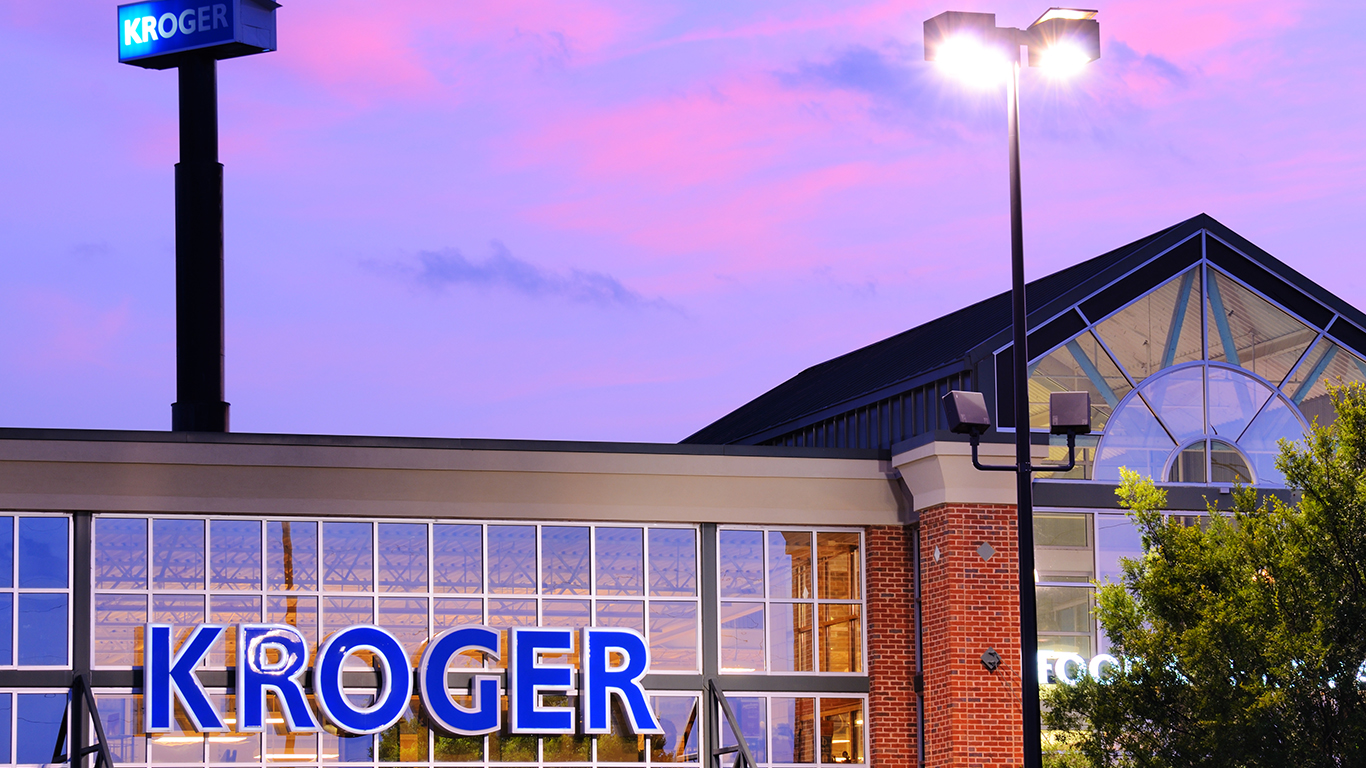
24. Kroger
> % of shoppers visiting in April: 11.1%
> % of grocery store shoppers: 14.4%
> # of U.S. stores: 2,782
> Annual revenue: $122.7 billion
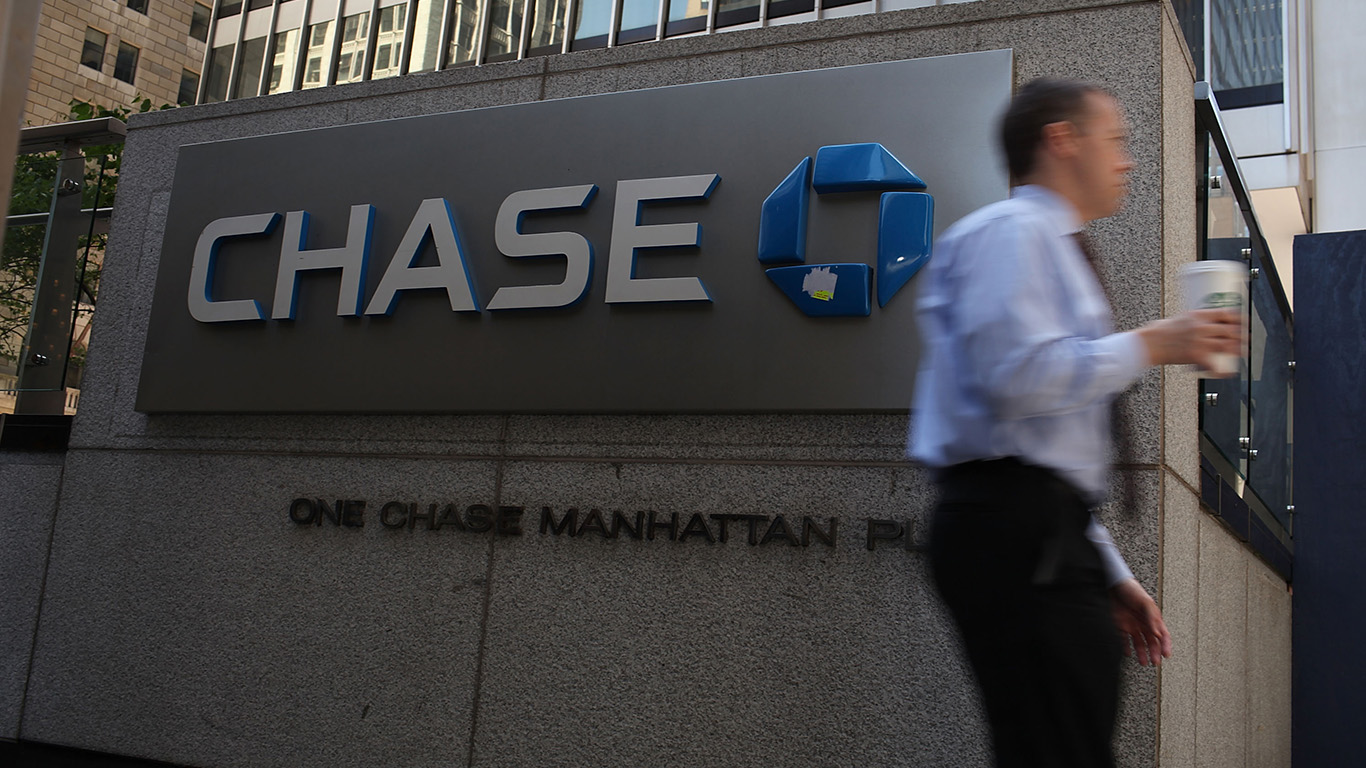
23. Chase
> % of shoppers visiting in April: 11.7%
> % of bank visitors in April: 19.9%
> # of U.S. stores: 5,130
> Annual revenue: $99.6 billion
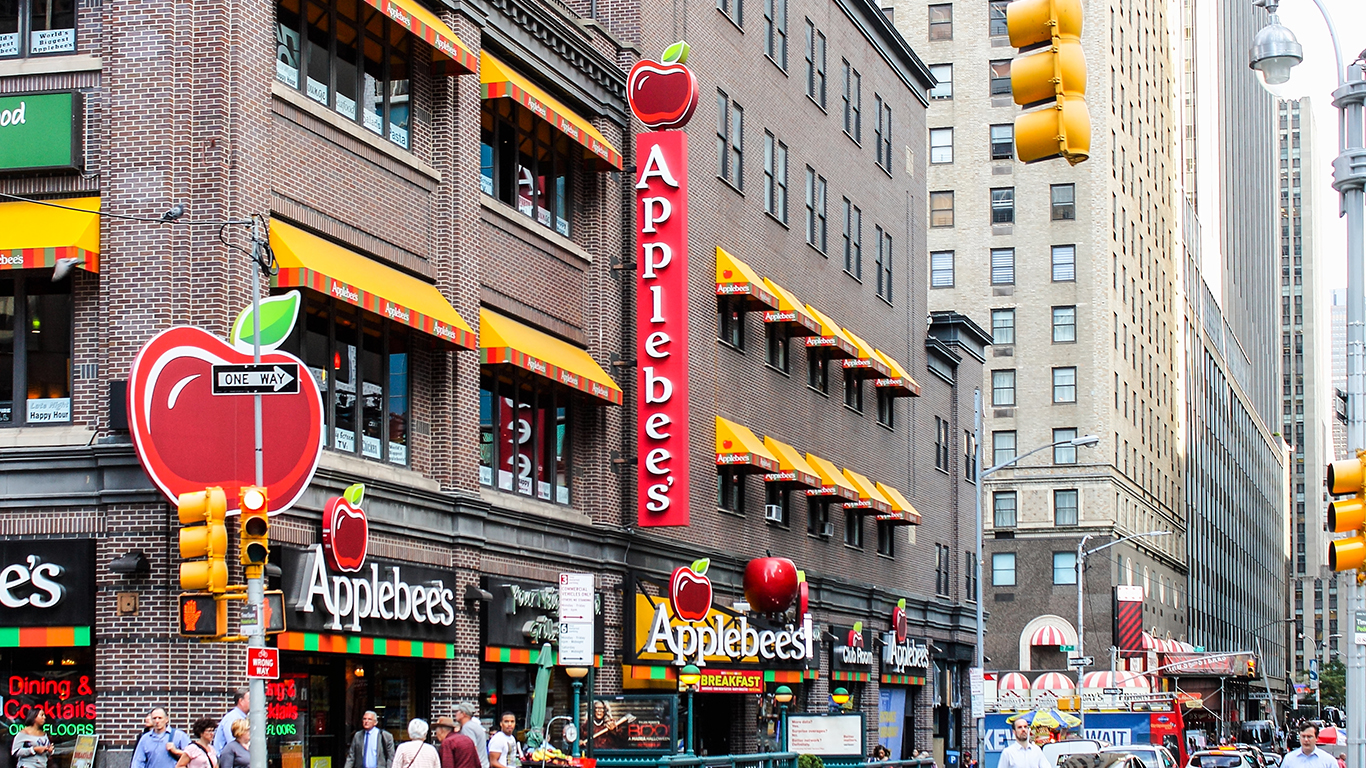
22. Applebee’s
> % of shoppers visiting in April: 11.7%
> % of restaurant visitors in April: 12.4%
> # of U.S. stores: 1,858
> Annual revenue: $634.0 million
[in-text-ad-2]
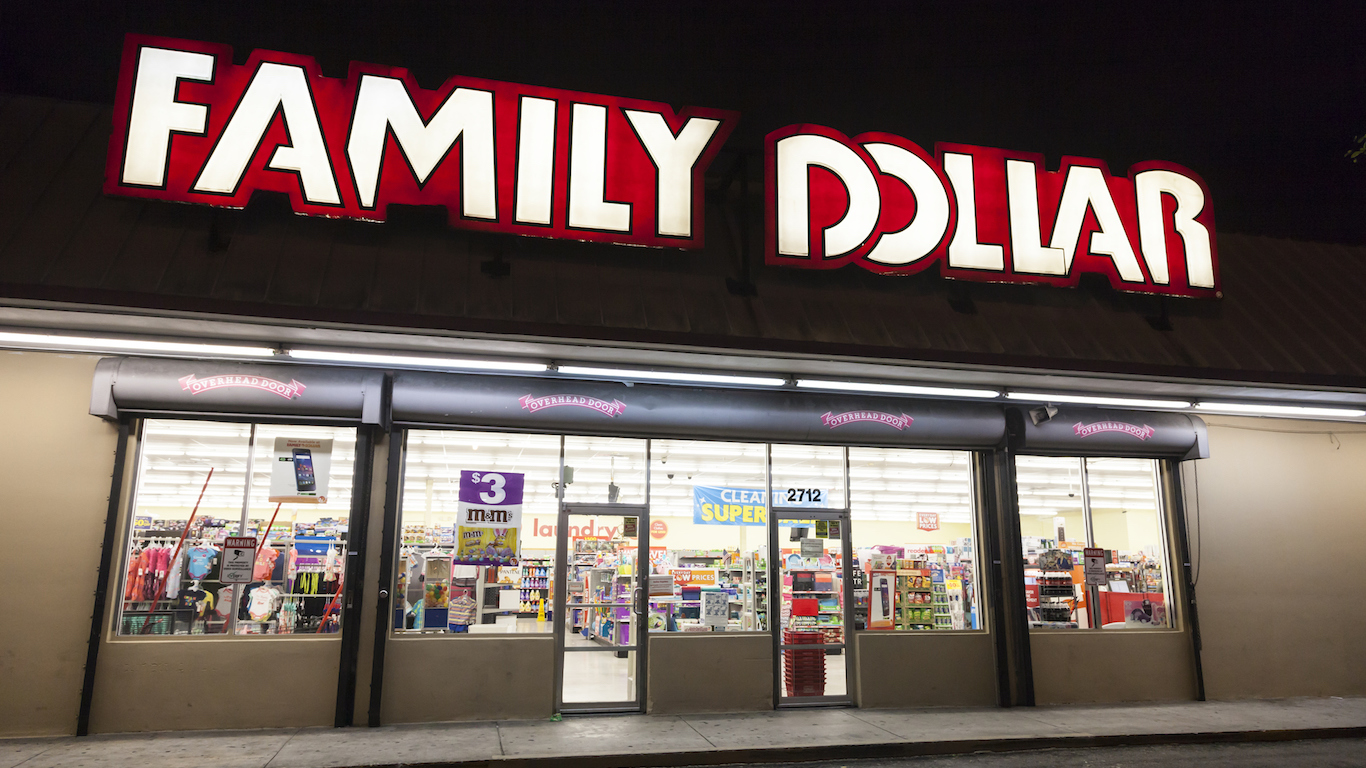
21. Family Dollar
> % of shoppers visiting in April: 12.0%
> % of discount store shoppers in April: 20.5%
> # of U.S. stores: 8,185
> Annual revenue: $22.3 billion (parent company)

20. Best Buy
> % of shoppers visiting in April: 14.0%
> % of computers & electronics store shoppers in April: 32.3%
> # of U.S. stores: 1,500 (worldwide)
> Annual revenue: $42.2 billion
[in-text-ad]
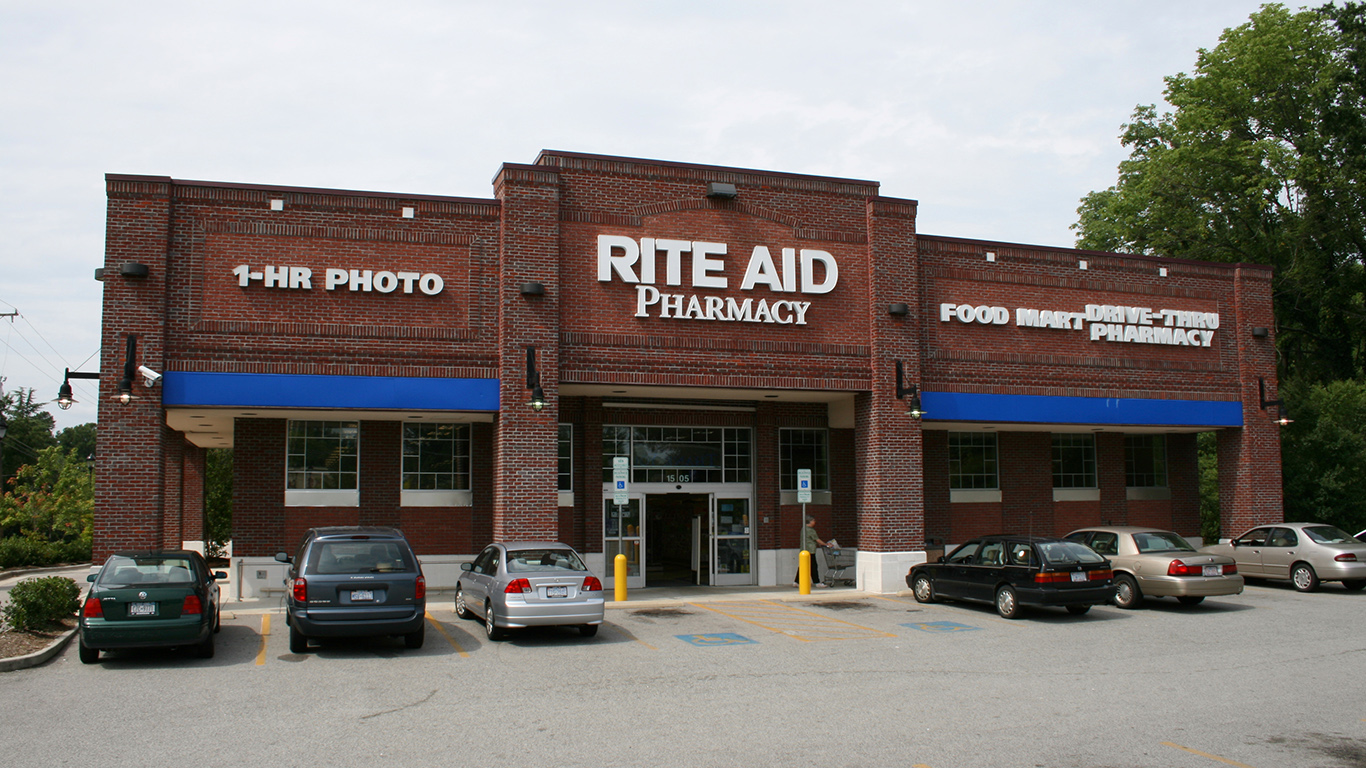
19. Rite Aid
> % of shoppers visiting in April: 14.2%
> % of pharmacy shoppers in April: 24.3%
> # of U.S. stores: 4,536
> Annual revenue: $32.8 billion
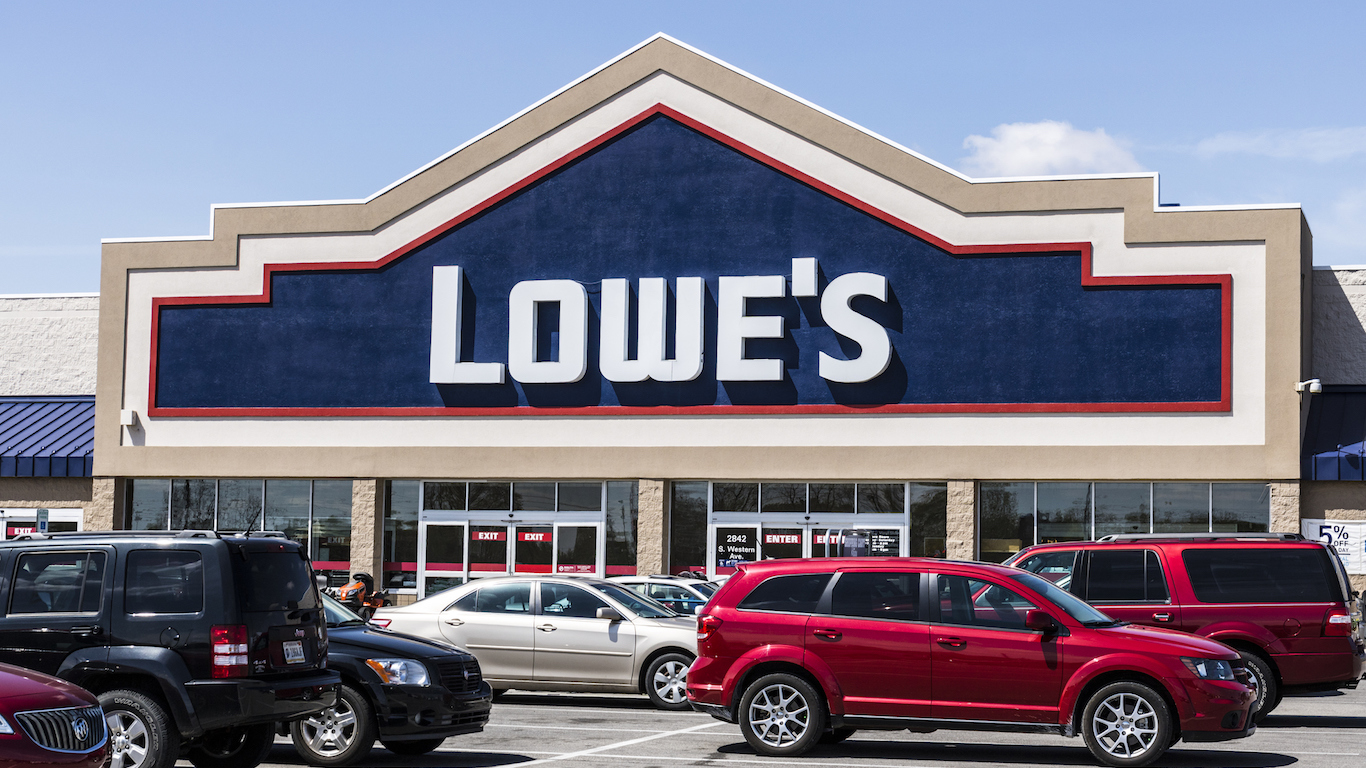
18. Lowe’s
> % of shoppers visiting in April: 14.2%
> % of hardware store shoppers in April: 30.3%
> # of U.S. stores: 1,839
> Annual revenue: $68.6 billion

17. Dollar General
> % of shoppers visiting in April: 14.6%
> % of discount store shoppers in April: 25.0%
> # of U.S. stores: 14,609
> Annual revenue: $23.5 billion
[in-text-ad-2]
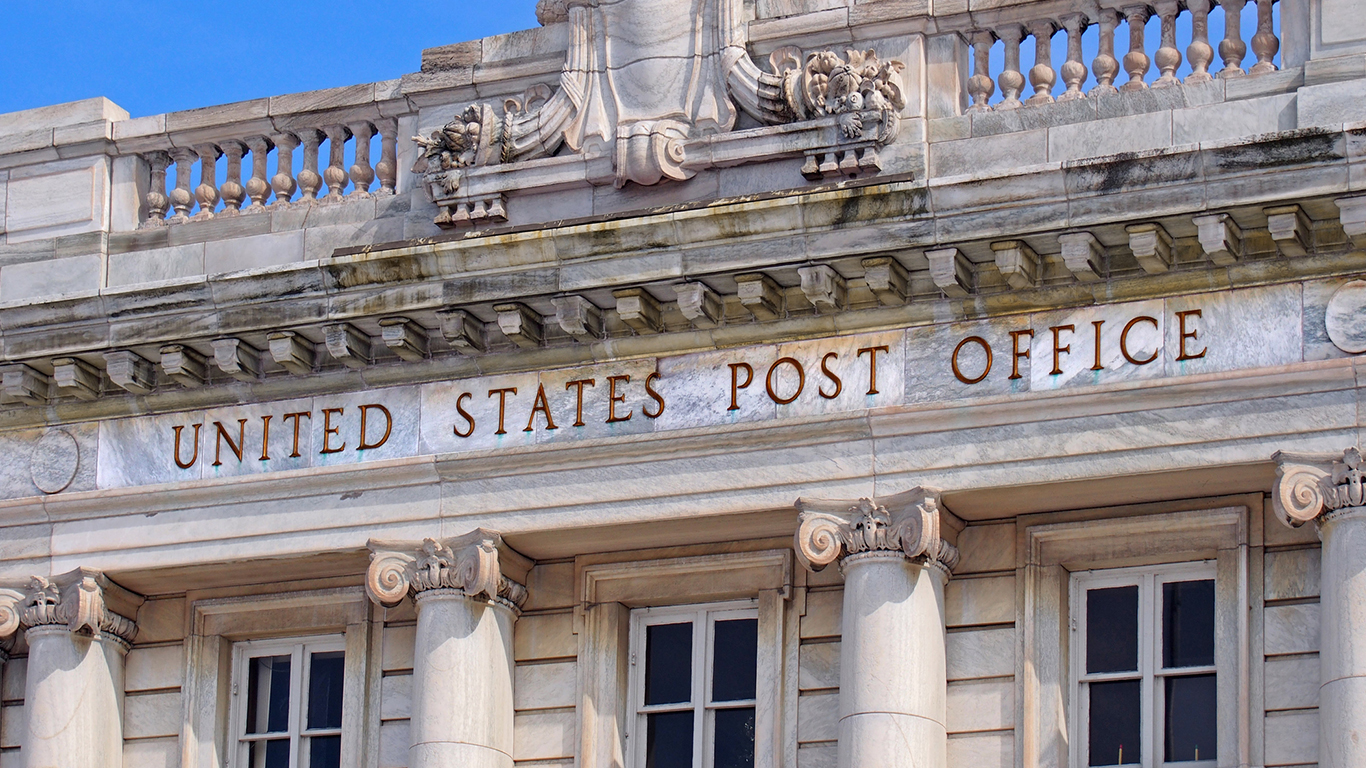
16. United States Postal Service
> % of shoppers visiting in April: 15.6%
> % of post office visitors in April: 93.4%
> # of U.S. stores: 30,825
> Annual revenue: $69.6 billion
15. 7-Eleven
> % of shoppers visiting in April: 16.1%
> % of gas station & convenience store shoppers in April: 23.4%
> # of U.S. stores: 7,925
> Annual revenue: $11.8 billion (parent company)
[in-text-ad]
14. Dunkin’ Donuts
> % of shoppers visiting in April: 16.2%
> % of bagel & doughnut store shoppers in April: 70.1%
> # of U.S. stores: 9,141
> Annual revenue: $860.5 million
13. The Home Depot
> % of shoppers visiting in April: 17.3%
> % of hardware store shoppers in April: 36.8%
> # of U.S. stores: 1,980
> Annual revenue: $100.9 billion
12. Shell
> % of shoppers visiting in April: 18.9%
> % of gas station & convenience store shoppers in April: 27.4%
> # of U.S. stores: 13,794
> Annual revenue: $305.2 billion (parent company)
[in-text-ad-2]
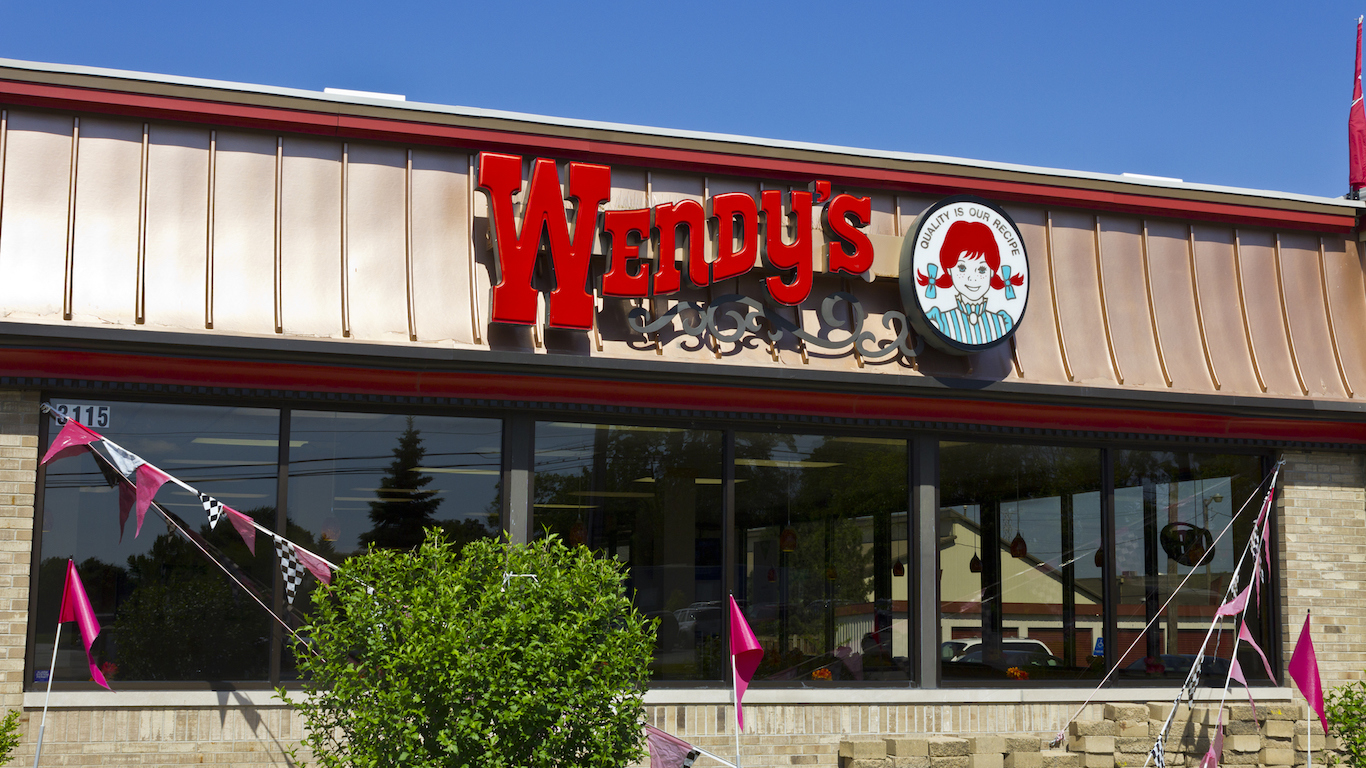
11. Wendy’s
> % of shoppers visiting in April: 19.2%
> % of restaurant visitors in April: 20.4%
> # of U.S. stores: 6,634
> Annual revenue: $1.2 billion (parent company)
10. Burger King
> % of shoppers visiting in April: 20.5%
> % of restaurant visitors in April: 21.8%
> # of U.S. stores: 7,212
> Annual revenue: $4.6 billion (parent company)
[in-text-ad]
9. Dollar Tree
> % of shoppers visiting in April: 21.2%
> % of discount store shoppers in April: 36.2%
> # of U.S. stores: 6,425
> Annual revenue: $22.2 billion
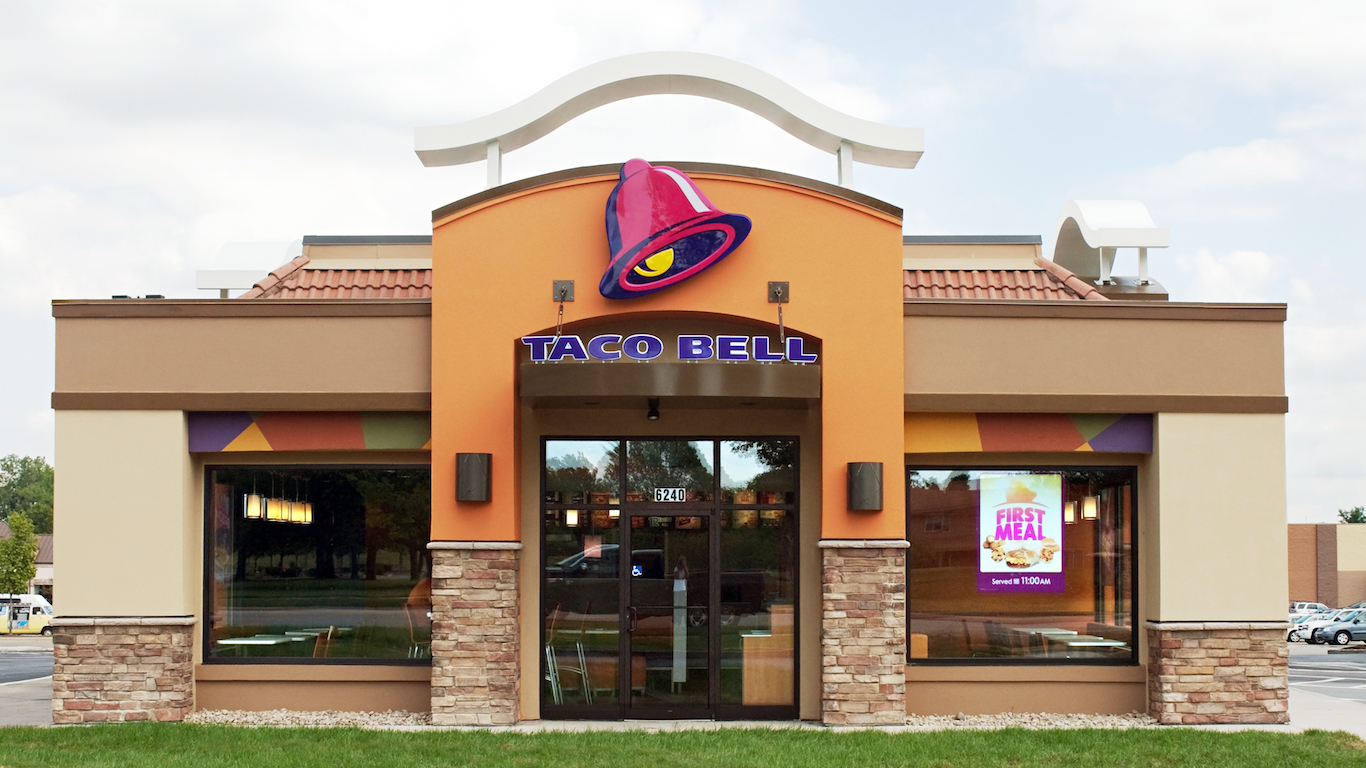
8. Taco Bell
> % of shoppers visiting in April: 21.5%
> % of restaurant visitors in April: 22.8%
> # of U.S. stores: 6,446
> Annual revenue: $1.8 billion

7. Target
> % of shoppers visiting in April: 24.3%
> % of department store shoppers in April: 33.3%
> # of U.S. stores: 1,829
> Annual revenue: $71.9 billion
[in-text-ad-2]
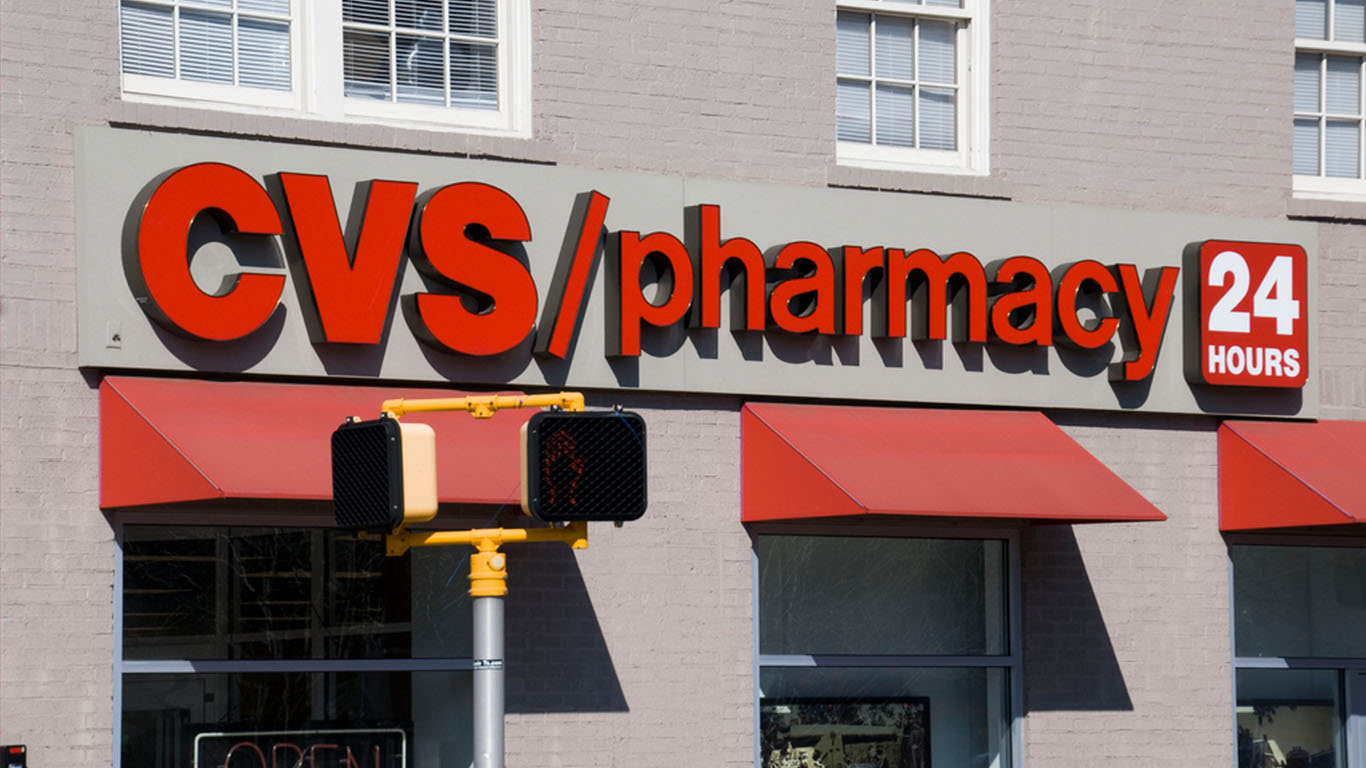
6. CVS
> % of shoppers visiting in April: 25.0%
> % of pharmacy shoppers in April: 42.7%
> # of U.S. stores: 9,800+ (Americas)
> Annual revenue: $184.8 billion

5. Starbucks
> % of shoppers visiting in April: 33.0%
> % of cafe, coffee houses & tea house visitors in April: 86.1%
> # of U.S. stores: 13,930
> Annual revenue: $22.4 billion
[in-text-ad]
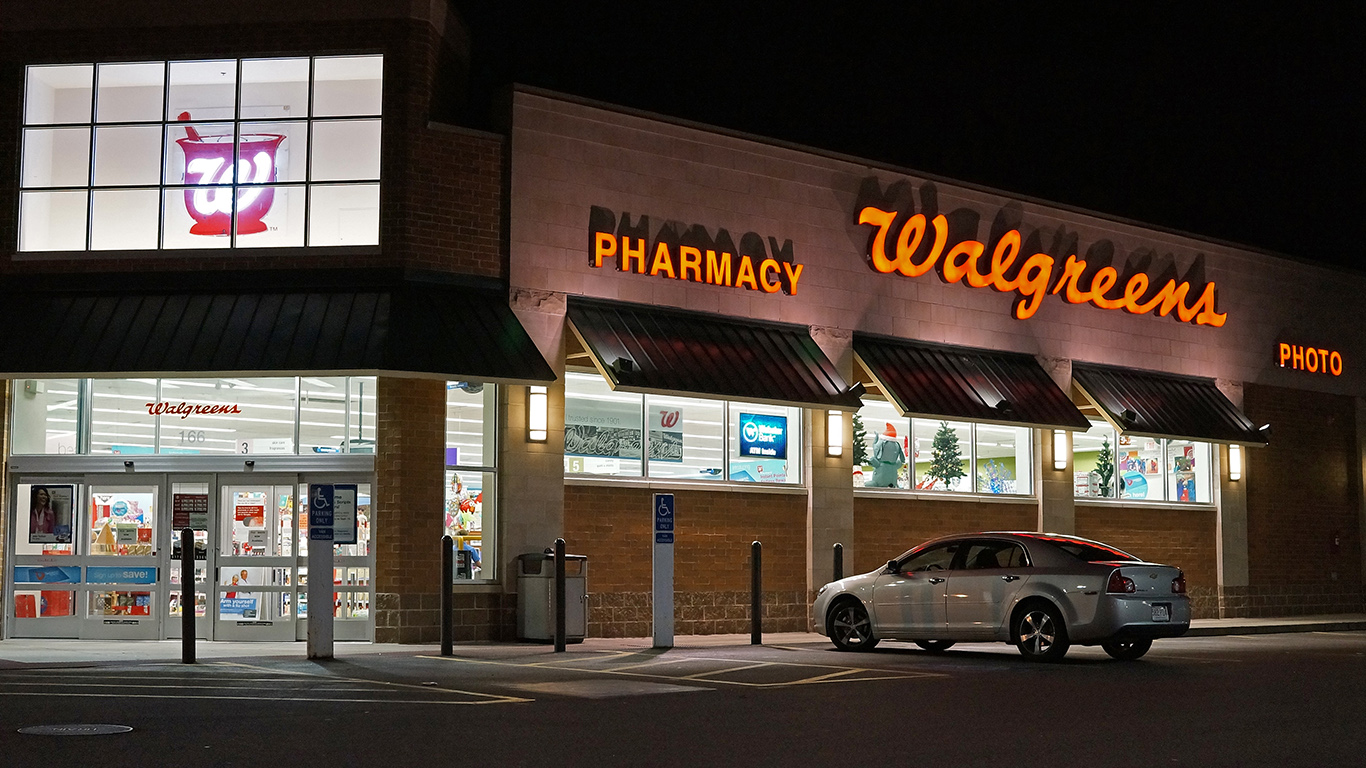
4. Walgreens
> % of shoppers visiting in April: 33.1%
> % of pharmacy shoppers in April: 56.5%
> # of U.S. stores: 7,979
> Annual revenue: $118.2 billion (parent company)
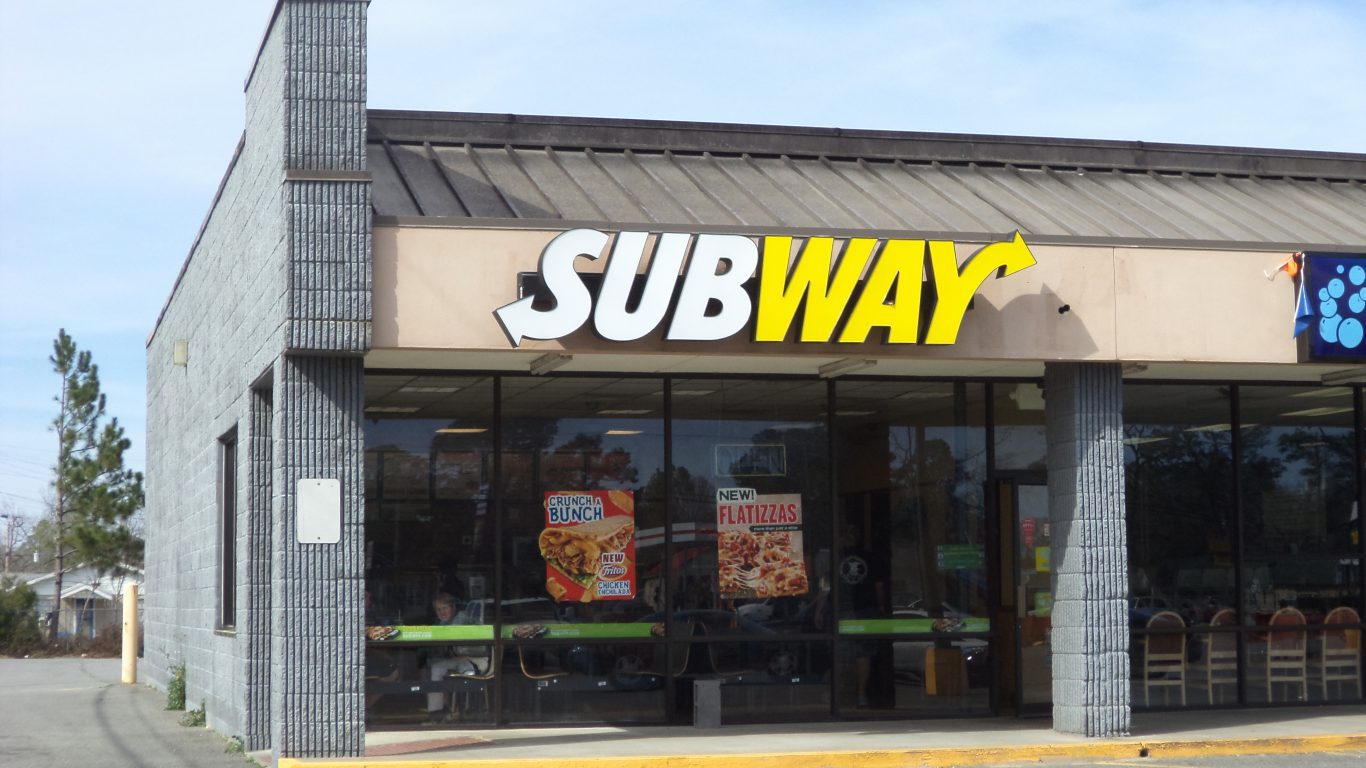
3. Subway
> % of shoppers visiting in April: 37.1%
> % of restaurant visitors in April: 39.4%
> # of U.S. stores: 25,393
> Annual revenue: N/A
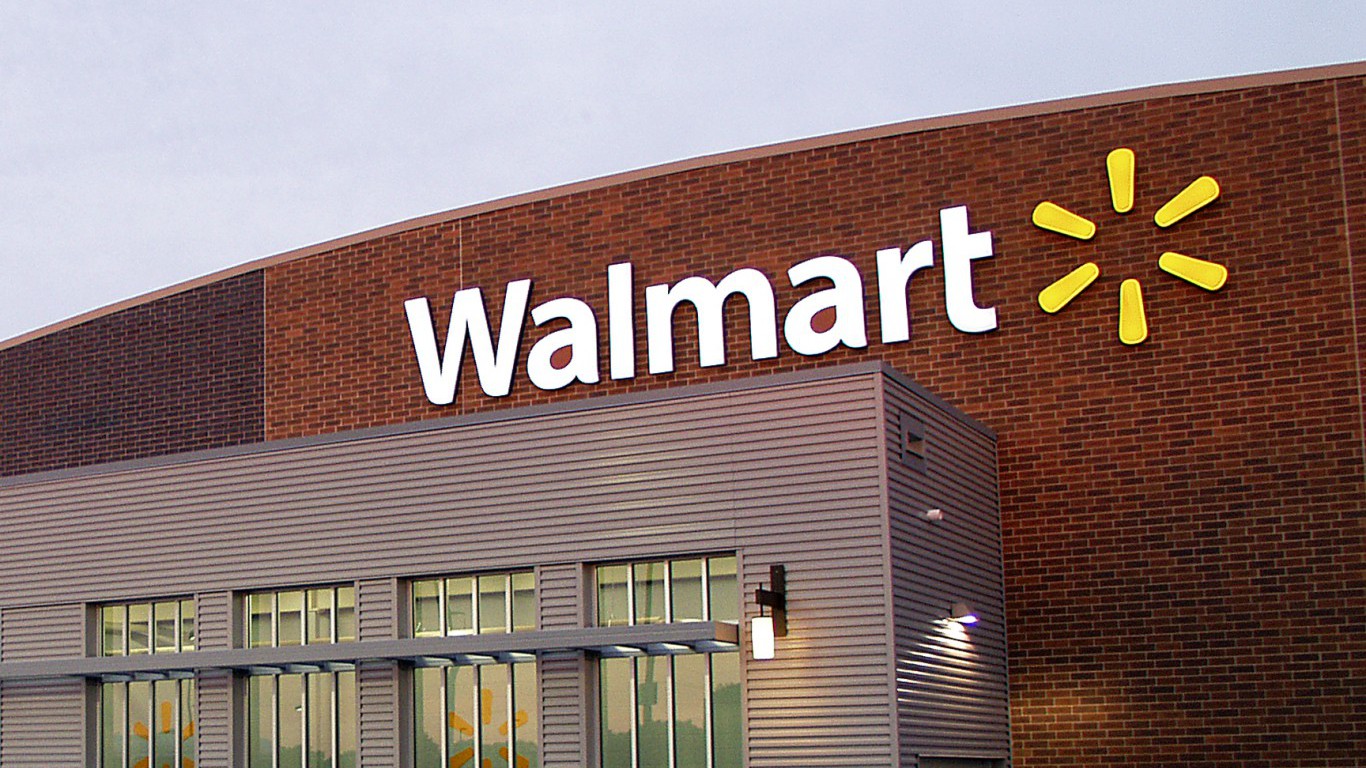
2. Walmart
> % of shoppers visiting in April: 51.4%
> % of department store shoppers in April: 70.4%
> # of U.S. stores: 4,761
> Annual revenue: $500.3 billion
[in-text-ad-2]
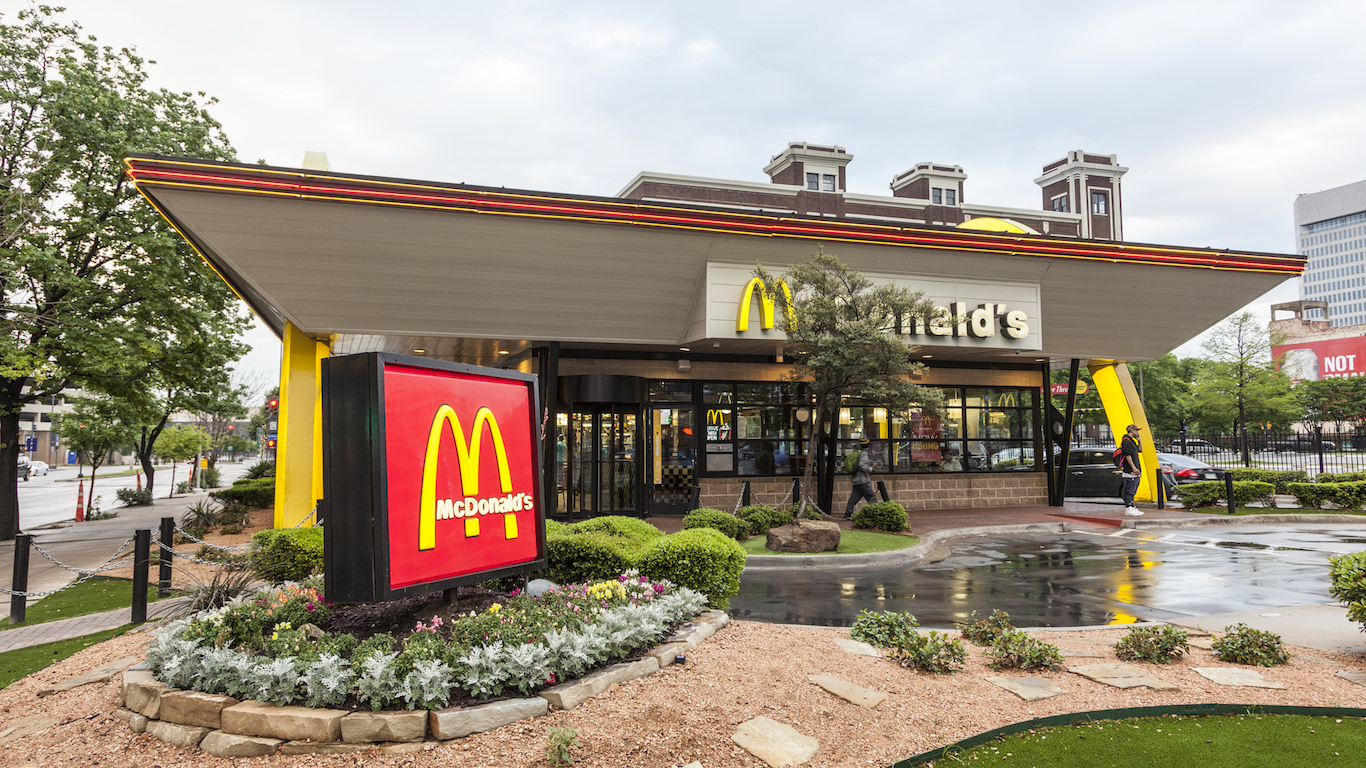
1. McDonald’s
> % of shoppers visiting in April: 52.8%
> % of restaurant visitors in April: 56.1%
> # of U.S. stores: 14,036
> Annual revenue: $22.8 billion
Want to Retire Early? Start Here (Sponsor)
Want retirement to come a few years earlier than you’d planned? Or are you ready to retire now, but want an extra set of eyes on your finances?
Now you can speak with up to 3 financial experts in your area for FREE. By simply clicking here you can begin to match with financial professionals who can help you build your plan to retire early. And the best part? The first conversation with them is free.
Click here to match with up to 3 financial pros who would be excited to help you make financial decisions.
Thank you for reading! Have some feedback for us?
Contact the 24/7 Wall St. editorial team.
 24/7 Wall St.


