Special Report
States With the Best and Worst Early Education

Published:
Last Updated:

The importance of proper nutrition, nurturing, and socialization during early childhood cannot be overstated. For many American families — single-parent and low-income families in particular — early childhood programs are only accessible through publicly-funded pre-K education. But the accessibility and quality of these programs varies considerably between states.
State spending on public pre-kindergarten programs totalled $7.3 billion in the 2016-2017 academic year, a 7% increase from the previous year. Bucking the national trend, six states reduced pre-K funding last year. North Dakota completely eliminated state funding for early childhood education, joining five other states that have no public pre-K budget.
State funding can affect both the quality and accessibility of pre-K programs, directly impacting enrollment rates in preschools. Generally, states that spend more on pre-K on a per child basis report higher enrollment rates. Nationwide, 47.7% of 3- and 4-year olds are enrolled in pre-K. Among states, pre-K enrollment ranges from 30.6% of eligible children in Idaho to 65.6% in Connecticut.
Quality early childhood education programs have been shown to improve education outcomes in later years, independent of the child’s social and economic status. Advocates argue that successful students are more likely to be contributing members of society, and as a result, investment in early childhood education could ultimately be a cost-saving measure for state governments.
Sterling Lloyd, assistant director at policy advocacy group Education Week Research Center, explained the benefits of early childhood education. “Studies have suggested that high quality preschool programs can help children enter elementary school more ready to learn and succeed,” Lloyd told 24/7 Wall St.
24/7 Wall St. created an index consisting of a state’s pre-K spending, enrollment rates, assistance for needy families, fourth grade reading proficiency, and certain quality standards, to rank the overall quality of early childhood education programs, from the worst to the best.
Click here to see the states with the best (and worst) childhood education programs.
Click here to see our detailed findings and methodology.

50. Idaho
> Share of 3-4 yr. olds enrolled in pre-K: 30.6% (the lowest)
> Total annual pre-K spending: $0 (the lowest)
> Pre-K spending per 3-4 yr. old: $0 (the lowest)
> 4th graders proficient in reading: 36% (25th lowest)
> Child poverty rate: 18.0% (22nd lowest)
[in-text-ad]
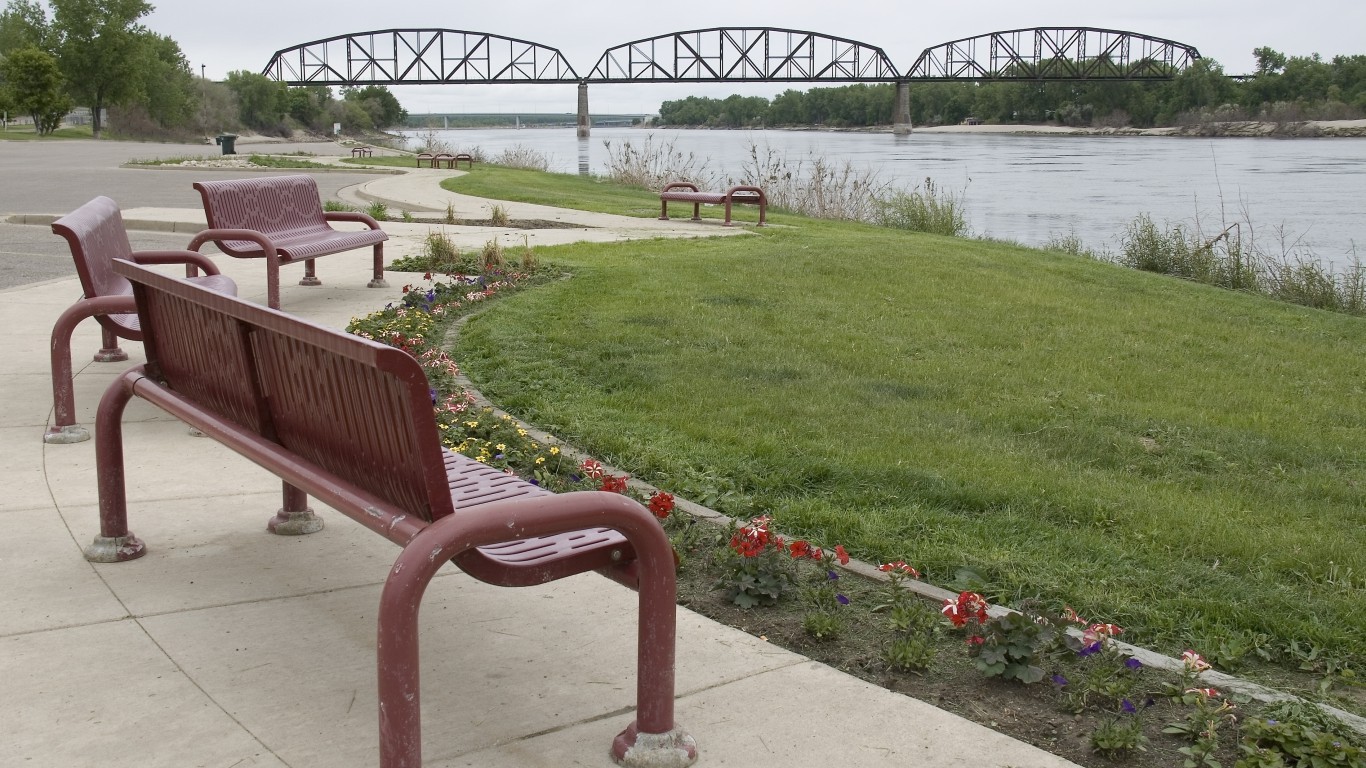
49. North Dakota
> Share of 3-4 yr. olds enrolled in pre-K: 31.1% (2nd lowest)
> Total annual pre-K spending: $0 (the lowest)
> Pre-K spending per 3-4 yr. old: $0 (the lowest)
> 4th graders proficient in reading: 37% (21st highest)
> Child poverty rate: 12.0% (2nd lowest)

48. Kentucky
> Share of 3-4 yr. olds enrolled in pre-K: 41.7% (13th lowest)
> Total annual pre-K spending: $90.1 million (21st highest)
> Pre-K spending per 3-4 yr. old: $808 (20th highest)
> 4th graders proficient in reading: 40% (9th highest)
> Child poverty rate: 26.0% (6th highest)

47. Montana
> Share of 3-4 yr. olds enrolled in pre-K: 42.5% (16th lowest)
> Total annual pre-K spending: $0 (the lowest)
> Pre-K spending per 3-4 yr. old: $0 (the lowest)
> 4th graders proficient in reading: 37% (21st highest)
> Child poverty rate: 19.0% (24th highest)
[in-text-ad-2]

46. Nevada
> Share of 3-4 yr. olds enrolled in pre-K: 36.7% (4th lowest)
> Total annual pre-K spending: $3.3 million (8th lowest)
> Pre-K spending per 3-4 yr. old: $43 (7th lowest)
> 4th graders proficient in reading: 29% (8th lowest)
> Child poverty rate: 21.0% (18th highest)
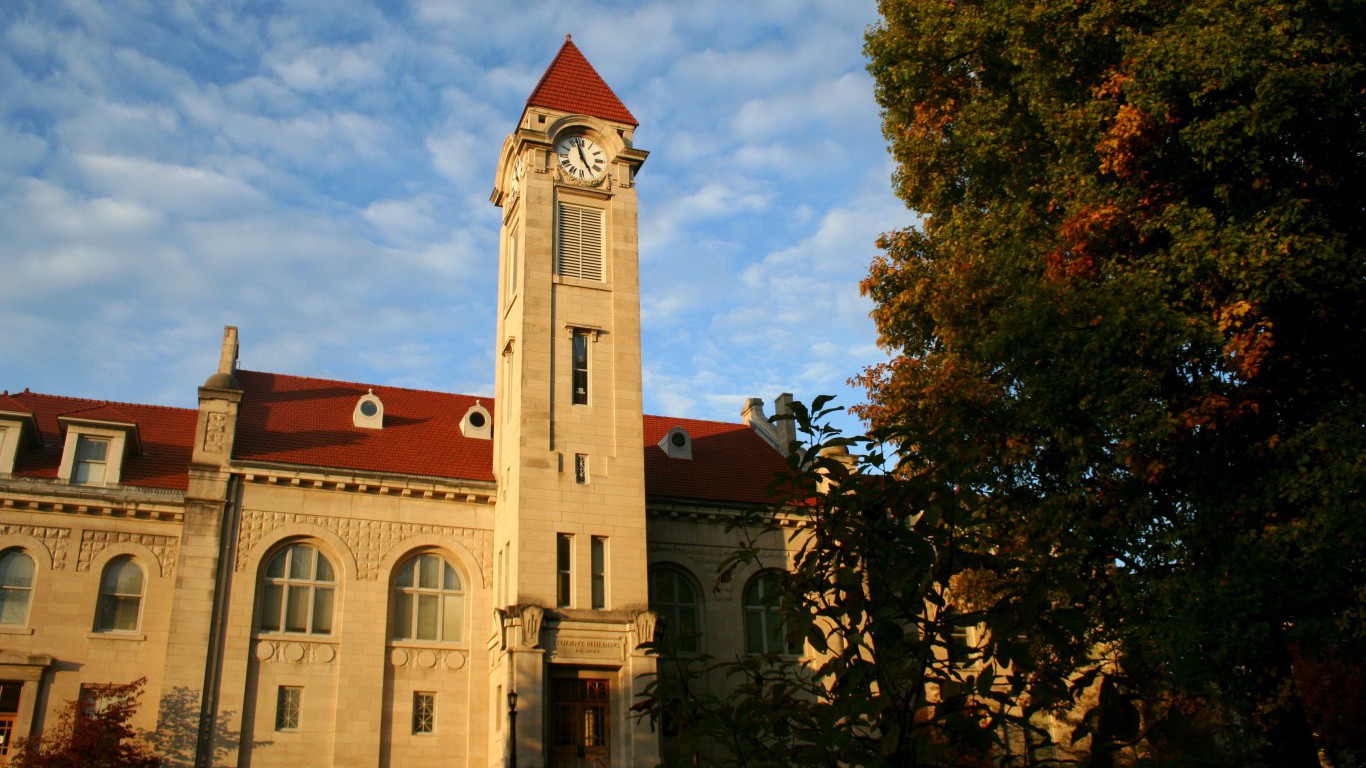
45. Indiana
> Share of 3-4 yr. olds enrolled in pre-K: 41.2% (10th lowest)
> Total annual pre-K spending: $12.0 million (14th lowest)
> Pre-K spending per 3-4 yr. old: $69 (9th lowest)
> 4th graders proficient in reading: 40% (9th highest)
> Child poverty rate: 21.0% (18th highest)
[in-text-ad]

44. Utah
> Share of 3-4 yr. olds enrolled in pre-K: 42.9% (20th lowest)
> Total annual pre-K spending: $9.3 million (13th lowest)
> Pre-K spending per 3-4 yr. old: $90 (11th lowest)
> 4th graders proficient in reading: 40% (9th highest)
> Child poverty rate: 13.0% (7th lowest)

43. Ohio
> Share of 3-4 yr. olds enrolled in pre-K: 44.4% (24th lowest)
> Total annual pre-K spending: $75.3 million (25th highest)
> Pre-K spending per 3-4 yr. old: $270 (16th lowest)
> 4th graders proficient in reading: 38% (18th highest)
> Child poverty rate: 21.0% (18th highest)

42. Virginia
> Share of 3-4 yr. olds enrolled in pre-K: 48.4% (18th highest)
> Total annual pre-K spending: $68.9 million (24th lowest)
> Pre-K spending per 3-4 yr. old: $330 (18th lowest)
> 4th graders proficient in reading: 43% (4th highest)
> Child poverty rate: 15.0% (14th lowest)
[in-text-ad-2]

41. Tennessee
> Share of 3-4 yr. olds enrolled in pre-K: 37.8% (6th lowest)
> Total annual pre-K spending: $86.6 million (22nd highest)
> Pre-K spending per 3-4 yr. old: $523 (23rd lowest)
> 4th graders proficient in reading: 33% (16th lowest)
> Child poverty rate: 24.0% (9th highest)
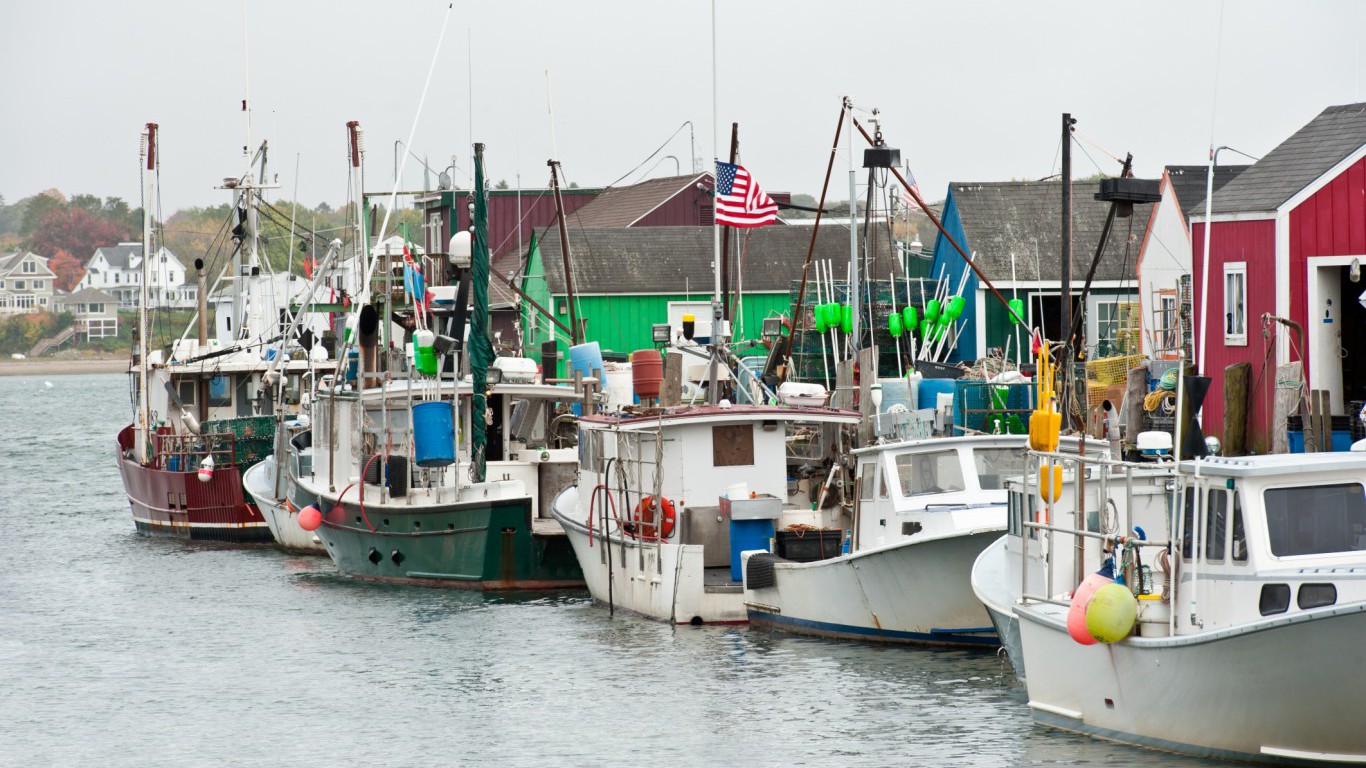
40. Maine
> Share of 3-4 yr. olds enrolled in pre-K: 40.7% (9th lowest)
> Total annual pre-K spending: $22.1 million (17th lowest)
> Pre-K spending per 3-4 yr. old: $780 (22nd highest)
> 4th graders proficient in reading: 36% (25th lowest)
> Child poverty rate: 17.0% (20th lowest)
[in-text-ad]

39. South Dakota
> Share of 3-4 yr. olds enrolled in pre-K: 41.7% (13th lowest)
> Total annual pre-K spending: $0 (the lowest)
> Pre-K spending per 3-4 yr. old: $0 (the lowest)
> 4th graders proficient in reading: 35% (21st lowest)
> Child poverty rate: 18.0% (22nd lowest)

38. Arizona
> Share of 3-4 yr. olds enrolled in pre-K: 38.3% (7th lowest)
> Total annual pre-K spending: $41.4 million (21st lowest)
> Pre-K spending per 3-4 yr. old: $223 (14th lowest)
> 4th graders proficient in reading: 30% (11th lowest)
> Child poverty rate: 25.0% (7th highest)

37. North Carolina
> Share of 3-4 yr. olds enrolled in pre-K: 42.6% (17th lowest)> Total annual pre-K spending: $145.5 million (11th highest)
> Pre-K spending per 3-4 yr. old: $611 (25th lowest)
> 4th graders proficient in reading: 38% (18th highest)
> Child poverty rate: 23.0% (12th highest)
[in-text-ad-2]
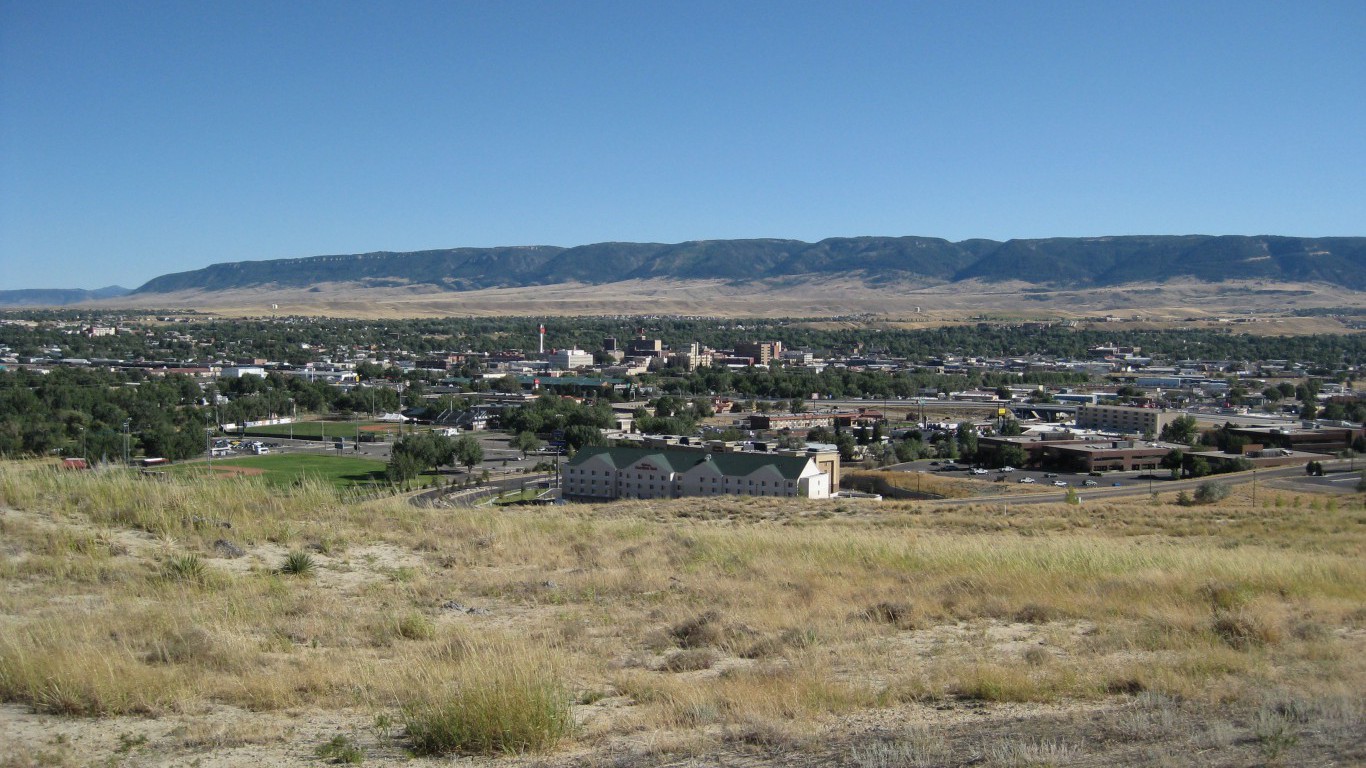
36. Wyoming
> Share of 3-4 yr. olds enrolled in pre-K: 40.7% (9th lowest)
> Total annual pre-K spending: $0 (the lowest)
> Pre-K spending per 3-4 yr. old: $0 (the lowest)
> 4th graders proficient in reading: 41% (7th highest)
> Child poverty rate: 13.0% (7th lowest)

35. South Carolina
> Share of 3-4 yr. olds enrolled in pre-K: 46.9% (21st highest)
> Total annual pre-K spending: $78.1 million (24th highest)
> Pre-K spending per 3-4 yr. old: $671 (25th highest)
> 4th graders proficient in reading: 33% (16th lowest)
> Child poverty rate: 24.0% (9th highest)
[in-text-ad]

34. Nebraska
> Share of 3-4 yr. olds enrolled in pre-K: 41.5% (11th lowest)
> Total annual pre-K spending: $24.9 million (18th lowest)
> Pre-K spending per 3-4 yr. old: $473 (20th lowest)
> 4th graders proficient in reading: 40% (9th highest)
> Child poverty rate: 17.0% (20th lowest)

33. Massachusetts
> Share of 3-4 yr. olds enrolled in pre-K: 58.0% (4th highest)
> Total annual pre-K spending: $26.7 million (19th lowest)
> Pre-K spending per 3-4 yr. old: $176 (13th lowest)
> 4th graders proficient in reading: 50% (the highest)
> Child poverty rate: 15.0% (14th lowest)

32. Oregon
> Share of 3-4 yr. olds enrolled in pre-K: 44.1% (22nd lowest)
> Total annual pre-K spending: $72.6 million (25th lowest)
> Pre-K spending per 3-4 yr. old: $750 (23rd highest)
> 4th graders proficient in reading: 34% (18th lowest)
> Child poverty rate: 20.0% (22nd highest)
[in-text-ad-2]

31. Missouri
> Share of 3-4 yr. olds enrolled in pre-K: 45.2% (25th highest)
> Total annual pre-K spending: $17.2 million (15th lowest)
> Pre-K spending per 3-4 yr. old: $113 (12th lowest)
> 4th graders proficient in reading: 36% (25th lowest)
> Child poverty rate: 20.0% (22nd highest)

30. New Hampshire
> Share of 3-4 yr. olds enrolled in pre-K: 50.5% (11th highest)
> Total annual pre-K spending: $0 (the lowest)
> Pre-K spending per 3-4 yr. old: $0 (the lowest)
> 4th graders proficient in reading: 46% (2nd highest)
> Child poverty rate: 11.0% (the lowest)
[in-text-ad]

29. Kansas
> Share of 3-4 yr. olds enrolled in pre-K: 44.4% (24th lowest)
> Total annual pre-K spending: $38.9 million (20th lowest)
> Pre-K spending per 3-4 yr. old: $491 (21st lowest)
> 4th graders proficient in reading: 35% (21st lowest)
> Child poverty rate: 17.0% (20th lowest)

28. Minnesota
> Share of 3-4 yr. olds enrolled in pre-K: 45.8% (23rd highest)
> Total annual pre-K spending: $118.7 million (14th highest)
> Pre-K spending per 3-4 yr. old: $816 (18th highest)
> 4th graders proficient in reading: 39% (15th highest)
> Child poverty rate: 13.0% (7th lowest)
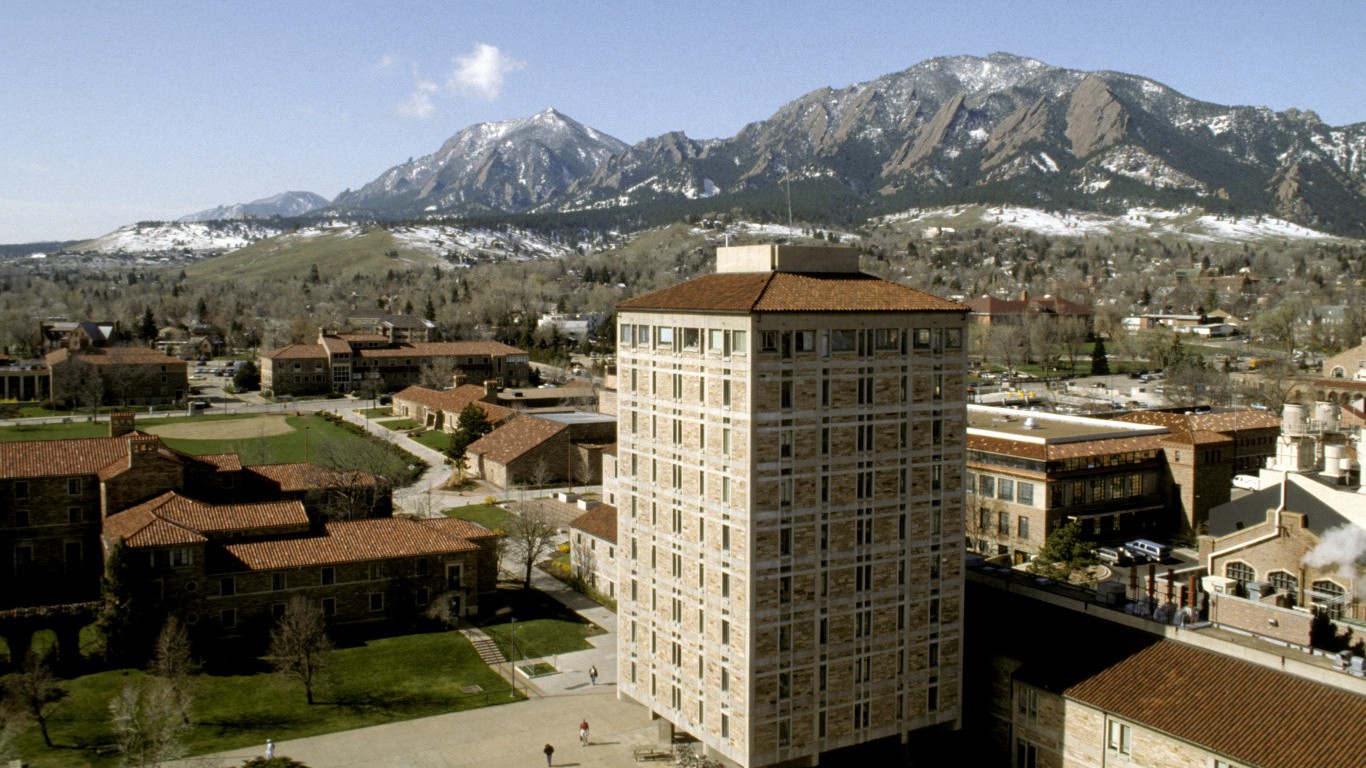
27. Colorado
> Share of 3-4 yr. olds enrolled in pre-K: 51.4% (8th highest)
> Total annual pre-K spending: $109.4 million (16th highest)
> Pre-K spending per 3-4 yr. old: $814 (19th highest)
> 4th graders proficient in reading: 39% (15th highest)
> Child poverty rate: 15.0% (14th lowest)
[in-text-ad-2]

26. Florida
> Share of 3-4 yr. olds enrolled in pre-K: 50.9% (10th highest)
> Total annual pre-K spending: $395.2 million (5th highest)
> Pre-K spending per 3-4 yr. old: $880 (16th highest)
> 4th graders proficient in reading: 39% (15th highest)
> Child poverty rate: 23.0% (12th highest)

25. Pennsylvania
> Share of 3-4 yr. olds enrolled in pre-K: 45.2% (25th highest)
> Total annual pre-K spending: $196.5 million (9th highest)
> Pre-K spending per 3-4 yr. old: $687 (24th highest)
> 4th graders proficient in reading: 41% (7th highest)
> Child poverty rate: 19.0% (24th highest)
[in-text-ad]

24. Maryland
> Share of 3-4 yr. olds enrolled in pre-K: 50.2% (13th highest)
> Total annual pre-K spending: $122.3 million (13th highest)
> Pre-K spending per 3-4 yr. old: $820 (17th highest)
> 4th graders proficient in reading: 37% (21st highest)
> Child poverty rate: 13.0% (7th lowest)

23. Texas
> Share of 3-4 yr. olds enrolled in pre-K: 42.7% (18th lowest)
> Total annual pre-K spending: $909.2 million (2nd highest)
> Pre-K spending per 3-4 yr. old: $1,128 (11th highest)
> 4th graders proficient in reading: 31% (12th lowest)
> Child poverty rate: 23.0% (12th highest)

22. Washington
> Share of 3-4 yr. olds enrolled in pre-K: 42.0% (14th lowest)
> Total annual pre-K spending: $97.0 million (18th highest)
> Pre-K spending per 3-4 yr. old: $519 (22nd lowest)
> 4th graders proficient in reading: 40% (9th highest)
> Child poverty rate: 16.0% (17th lowest)
[in-text-ad-2]

21. Rhode Island
> Share of 3-4 yr. olds enrolled in pre-K: 47.7% (20th highest)
> Total annual pre-K spending: $6.0 million (10th lowest)
> Pre-K spending per 3-4 yr. old: $260 (15th lowest)
> 4th graders proficient in reading: 40% (9th highest)
> Child poverty rate: 19.0% (24th highest)

20. Mississippi
> Share of 3-4 yr. olds enrolled in pre-K: 51.3% (9th highest)
> Total annual pre-K spending: $4.0 million (9th lowest)
> Pre-K spending per 3-4 yr. old: $56 (8th lowest)
> 4th graders proficient in reading: 26% (2nd lowest)
> Child poverty rate: 31.0% (the highest)
[in-text-ad]

19. Arkansas
> Share of 3-4 yr. olds enrolled in pre-K: 49.7% (14th highest)
> Total annual pre-K spending: $105.0 million (17th highest)
> Pre-K spending per 3-4 yr. old: $1,420 (7th highest)
> 4th graders proficient in reading: 32% (13th lowest)
> Child poverty rate: 27.0% (4th highest)

18. Iowa
> Share of 3-4 yr. olds enrolled in pre-K: 48.5% (17th highest)
> Total annual pre-K spending: $84.0 million (23rd highest)
> Pre-K spending per 3-4 yr. old: $1,050 (13th highest)
> 4th graders proficient in reading: 38% (18th highest)
> Child poverty rate: 15.0% (14th lowest)
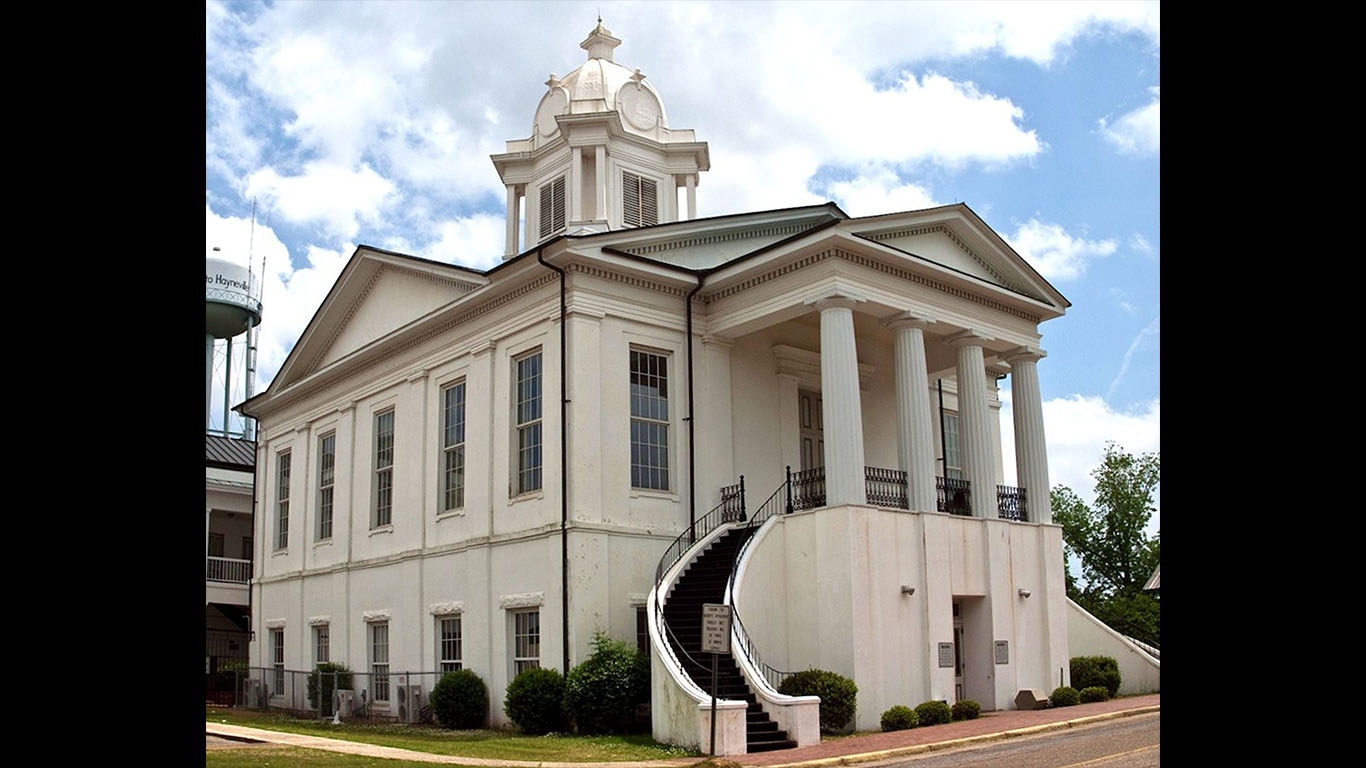
17. Alabama
> Share of 3-4 yr. olds enrolled in pre-K: 42.9% (20th lowest)
> Total annual pre-K spending: $64.5 million (23rd lowest)
> Pre-K spending per 3-4 yr. old: $563 (24th lowest)
> 4th graders proficient in reading: 29% (8th lowest)
> Child poverty rate: 27.0% (4th highest)
[in-text-ad-2]

16. Alaska
> Share of 3-4 yr. olds enrolled in pre-K: 37.2% (5th lowest)
> Total annual pre-K spending: $8.9 million (12th lowest)
> Pre-K spending per 3-4 yr. old: $433 (19th lowest)
> 4th graders proficient in reading: 30% (11th lowest)
> Child poverty rate: 15.0% (14th lowest)

15. Louisiana
> Share of 3-4 yr. olds enrolled in pre-K: 52.5% (7th highest)
> Total annual pre-K spending: $93.8 million (19th highest)
> Pre-K spending per 3-4 yr. old: $796 (21st highest)
> 4th graders proficient in reading: 29% (8th lowest)
> Child poverty rate: 28.0% (3rd highest)
[in-text-ad]

14. Wisconsin
> Share of 3-4 yr. olds enrolled in pre-K: 45.8% (23rd highest)
> Total annual pre-K spending: $190.8 million (10th highest)
> Pre-K spending per 3-4 yr. old: $1,443 (5th highest)
> 4th graders proficient in reading: 37% (21st highest)
> Child poverty rate: 16.0% (17th lowest)

13. Oklahoma
> Share of 3-4 yr. olds enrolled in pre-K: 43.9% (21st lowest)
> Total annual pre-K spending: $141.4 million (12th highest)
> Pre-K spending per 3-4 yr. old: $1,329 (9th highest)
> 4th graders proficient in reading: 33% (16th lowest)
> Child poverty rate: 22.0% (15th highest)

12. California
> Share of 3-4 yr. olds enrolled in pre-K: 48.7% (16th highest)
> Total annual pre-K spending: $1124.3 million (the highest)
> Pre-K spending per 3-4 yr. old: $1,096 (12th highest)
> 4th graders proficient in reading: 28% (3rd lowest)
> Child poverty rate: 21.0% (18th highest)
[in-text-ad-2]

11. Georgia
> Share of 3-4 yr. olds enrolled in pre-K: 49.6% (15th highest)
> Total annual pre-K spending: $357.8 million (7th highest)
> Pre-K spending per 3-4 yr. old: $1,340 (8th highest)
> 4th graders proficient in reading: 34% (18th lowest)
> Child poverty rate: 24.0% (9th highest)

10. Illinois
> Share of 3-4 yr. olds enrolled in pre-K: 55.8% (6th highest)
> Total annual pre-K spending: $393.7 million (6th highest)
> Pre-K spending per 3-4 yr. old: $1,266 (10th highest)
> 4th graders proficient in reading: 35% (21st lowest)
> Child poverty rate: 19.0% (24th highest)
[in-text-ad]

9. Michigan
> Share of 3-4 yr. olds enrolled in pre-K: 46.7% (22nd highest)
> Total annual pre-K spending: $243.6 million (8th highest)
> Pre-K spending per 3-4 yr. old: $1,045 (14th highest)
> 4th graders proficient in reading: 29% (8th lowest)
> Child poverty rate: 22.0% (15th highest)
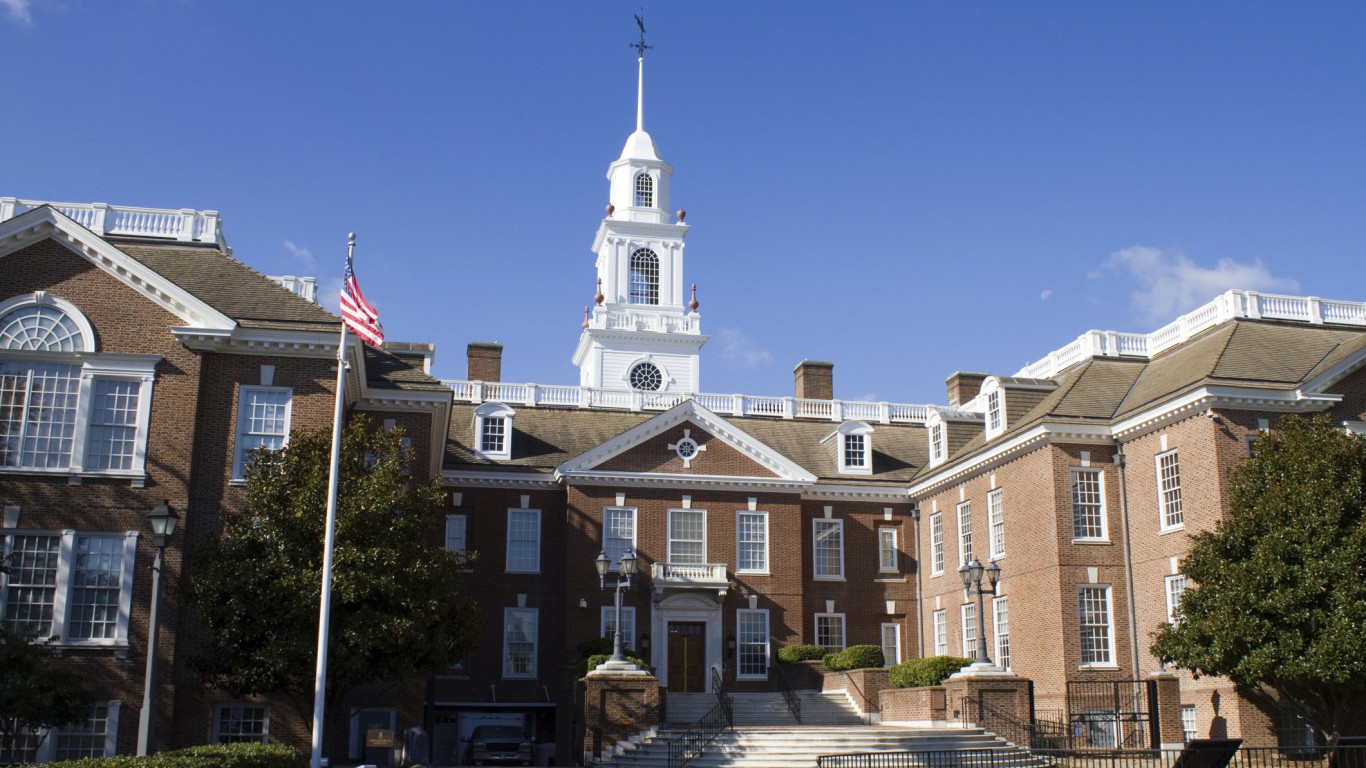
8. Delaware
> Share of 3-4 yr. olds enrolled in pre-K: 50.4% (12th highest)
> Total annual pre-K spending: $6.1 million (11th lowest)
> Pre-K spending per 3-4 yr. old: $275 (17th lowest)
> 4th graders proficient in reading: 37% (21st highest)
> Child poverty rate: 19.0% (24th highest)

7. Connecticut
> Share of 3-4 yr. olds enrolled in pre-K: 65.6% (the highest)
> Total annual pre-K spending: $111.5 million (15th highest)
> Pre-K spending per 3-4 yr. old: $1,436 (6th highest)
> 4th graders proficient in reading: 43% (4th highest)
> Child poverty rate: 15.0% (14th lowest)
[in-text-ad-2]
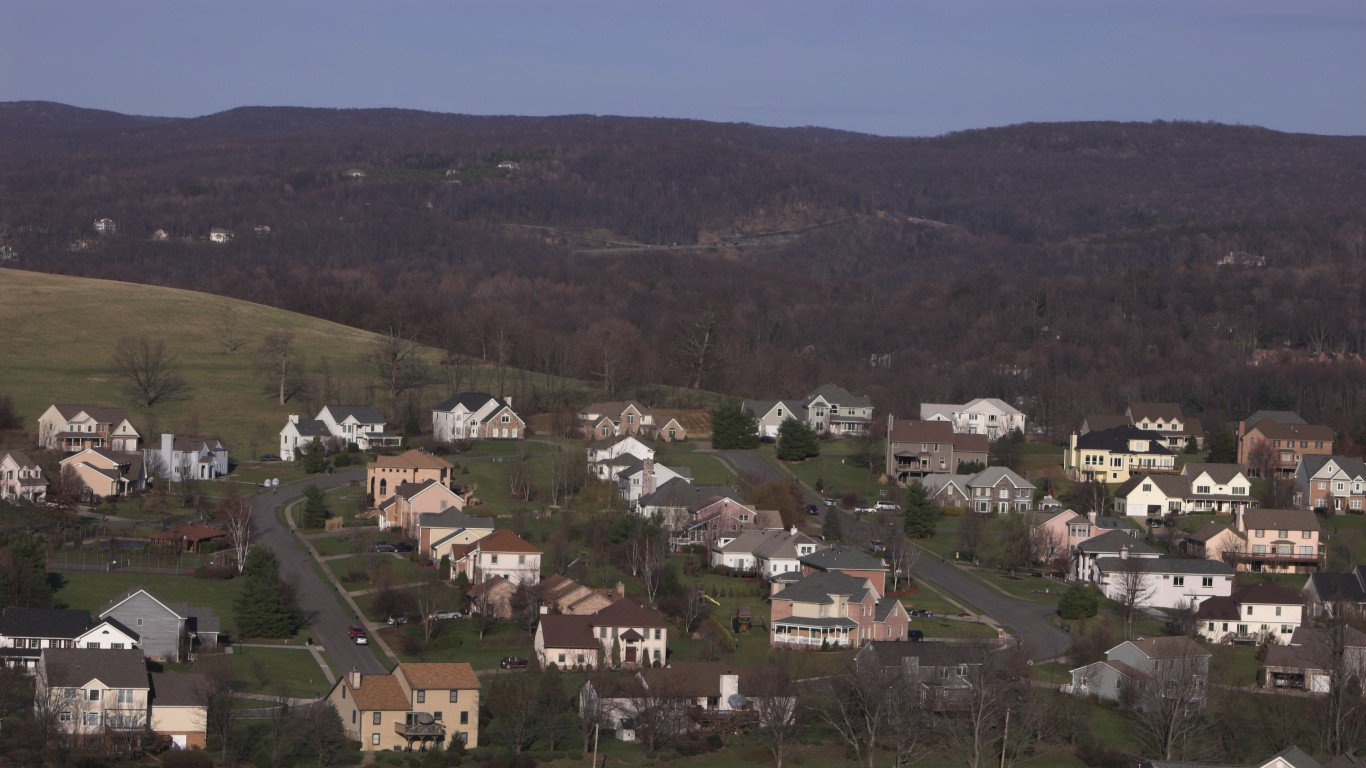
6. West Virginia
> Share of 3-4 yr. olds enrolled in pre-K: 32.9% (3rd lowest)
> Total annual pre-K spending: $93.4 million (20th highest)
> Pre-K spending per 3-4 yr. old: $2,321 (2nd highest)
> 4th graders proficient in reading: 30% (11th lowest)
> Child poverty rate: 25.0% (7th highest)
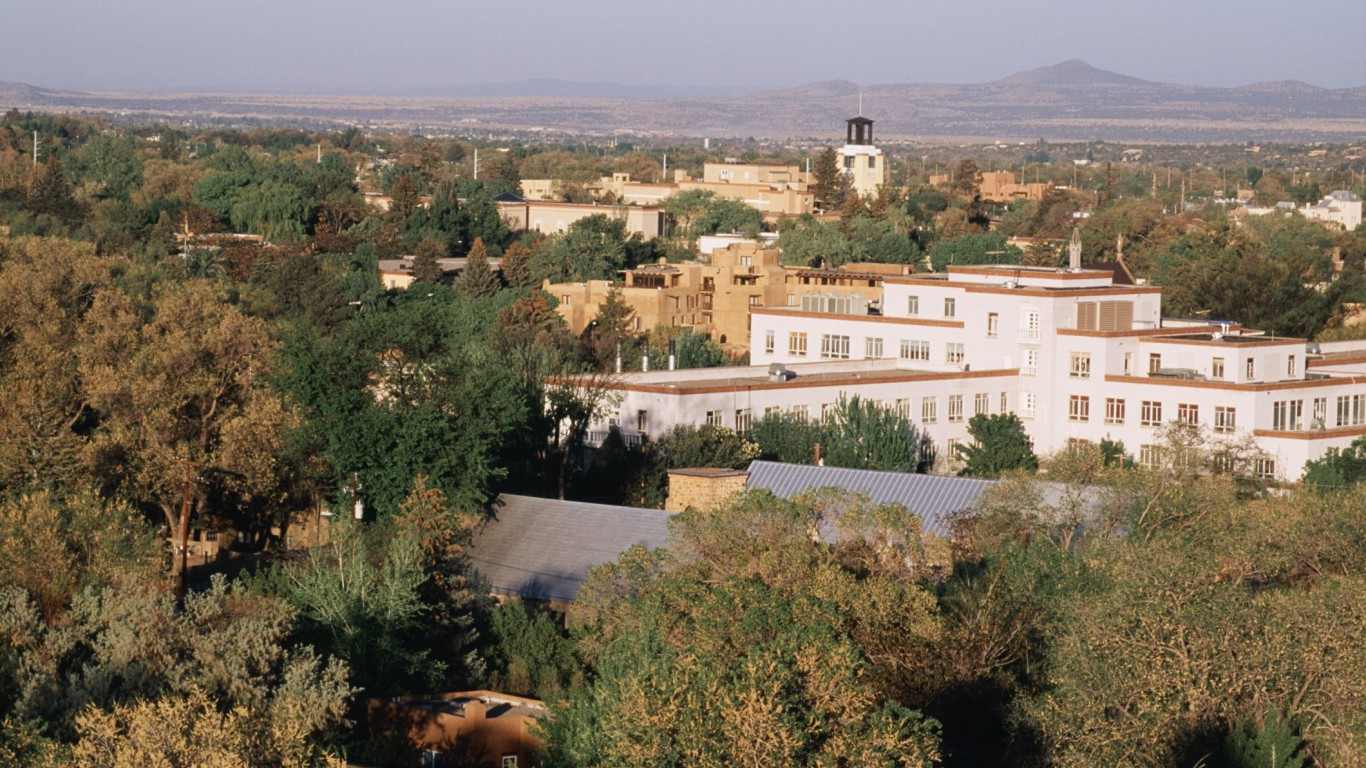
5. New Mexico
> Share of 3-4 yr. olds enrolled in pre-K: 42.4% (15th lowest)
> Total annual pre-K spending: $51.9 million (22nd lowest)
> Pre-K spending per 3-4 yr. old: $1,033 (15th highest)
> 4th graders proficient in reading: 23% (the lowest)
> Child poverty rate: 29.0% (2nd highest)
[in-text-ad]

4. Hawaii
> Share of 3-4 yr. olds enrolled in pre-K: 48.2% (19th highest)
> Total annual pre-K spending: $3.2 million (7th lowest)
> Pre-K spending per 3-4 yr. old: $86 (10th lowest)
> 4th graders proficient in reading: 29% (8th lowest)
> Child poverty rate: 14.0% (8th lowest)

3. New York
> Share of 3-4 yr. olds enrolled in pre-K: 58.2% (3rd highest)
> Total annual pre-K spending: $807.6 million (3rd highest)
> Pre-K spending per 3-4 yr. old: $1,705 (3rd highest)
> 4th graders proficient in reading: 36% (25th lowest)
> Child poverty rate: 22.0% (15th highest)

2. Vermont
> Share of 3-4 yr. olds enrolled in pre-K: 56.6% (5th highest)
> Total annual pre-K spending: $20.7 million (16th lowest)
> Pre-K spending per 3-4 yr. old: $1,546 (4th highest)
> 4th graders proficient in reading: 45% (3rd highest)
> Child poverty rate: 13.0% (7th lowest)
[in-text-ad-2]
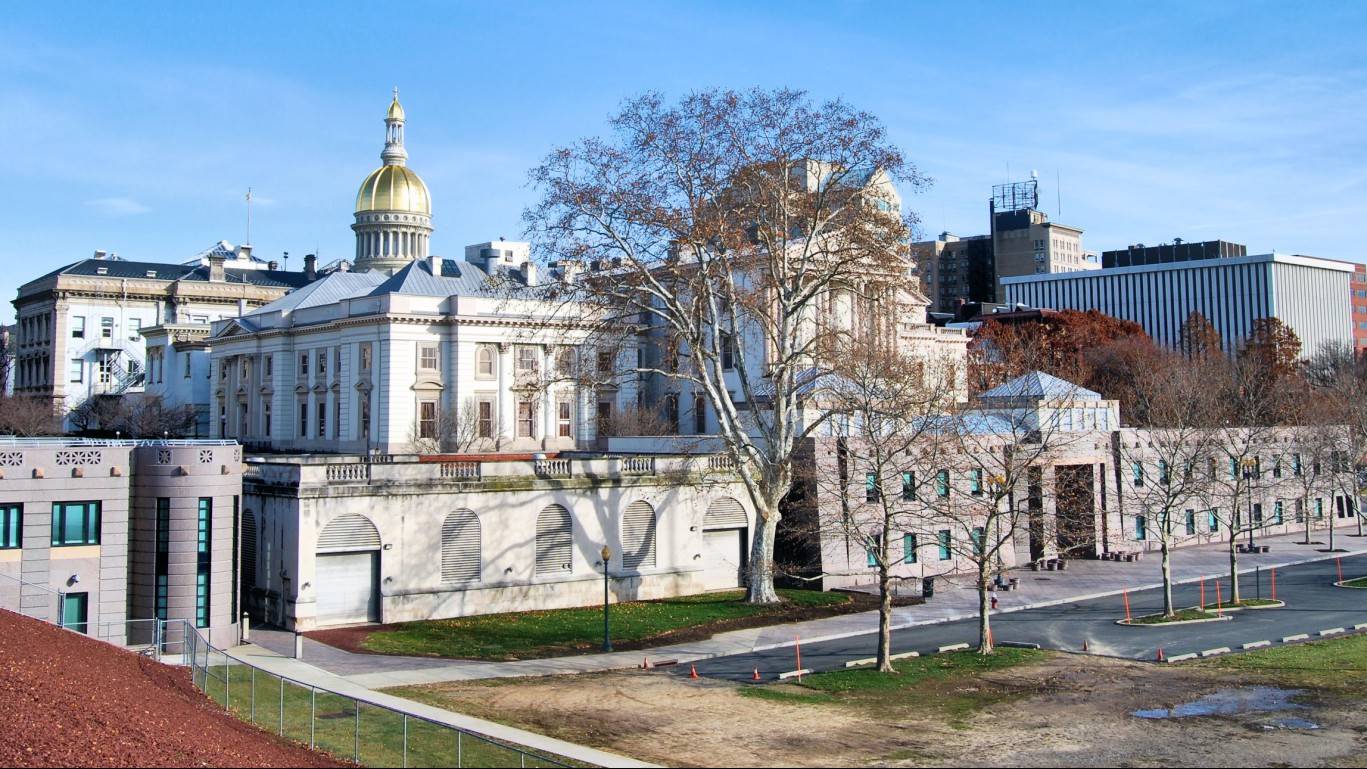
1. New Jersey
> Share of 3-4 yr. olds enrolled in pre-K: 64.1% (2nd highest)
> Total annual pre-K spending: $655.5 million (4th highest)
> Pre-K spending per 3-4 yr. old: $3,031 (the highest)
> 4th graders proficient in reading: 43% (4th highest)
> Child poverty rate: 16.0% (17th lowest)
Detailed Findings & Methodology
Some states are investing in the potential upside associated with accessible, high quality, pre-K programs. States like Michigan and West Virginia spend more on pre-K than the typical state, and partially as a result, hold their pre-K programs to higher standards. Both Michigan and West Virginia meet several quality benchmarks, including: child health screenings, minimum educational attainment requirements for teachers, limits on class sizes, and standards for student-teacher ratios.
Greater pre-K funding does not only improve quality, but can also improve accessibility. Nine of the 15 states with above-average pre-K spending per child also have above-average enrollment rates.
However, funding public pre-K for an entire state is no small investment, and as a result, such efforts are often met with considerable resistance. Six states — Idaho, Montana, New Hampshire, North Dakota, South Dakota, and Wyoming — have no publicly funded pre-K programs. Among them, only New Hampshire has higher than average pre-K enrollment.
Still, while spending can improve quality and accessibility of pre-K programs, monetary investment does not always guarantee better outcomes. In an interview with 24/7 Wall St., W. Steven Barnett, senior co-director of the National Institute for Early Education Research, explained that while both high standards and adequate funding are necessary, they are not sufficient. “You can have enough money, but not use it well, [and] you can have high standards but not enough money to do it well,” Barnett said.
While every child can potentially benefit from pre-K education, the potential upside of pre-K enrollment is far greater for certain demographics. “The benefits of the programs are considered to be especially important for low-income and disadvantaged kids who may not have strong preparation for elementary school otherwise,” Lloyd said.
Unfortunately, children who stand to gain the most from early childhood education are often the least likely be enrolled. “We see that children from low-income families are less likely to attend preschool. Children from the most affluent households have the highest rates of preschool participation,” Lloyd said.
To identify the best and worst states for early education, 24/7 Wall St. created an index using five different measures of early education quality: annual per-child pre-kindergarten spending for 3- to 4-years old, the percentage of fourth graders deemed not proficient in reading, the percentage of 3- to 4-year olds enrolled in preschool, the average monthly percentage of families with children under 18 receiving Child Care Development Fund Subsidies, and whether or not states met 10 policy benchmarks.
Per-pupil spending for children ages 3- to 4-years old was calculated using the state total population for those ages, from the U.S Census’ American Community Survey, and the total state spending figures for pre-kindergarten education came from the Education Commission of the States for 2016-2017. The percentage of fourth graders deemed non-proficient in reading, as well as the percentage of children ages 3- to 4-years old enrolled in pre-K, comes from the Annie E. Casey Foundation’s 2017 Kids Count Databook. The percentage of children ages 3- to 4-years old enrolled in pre-K, and the average monthly percentage of families with children under 18 receiving CCDF subsidies comes from the National Center for Children in Poverty for 2015, the most recent year of data available. The 10 policy standards we used in our index were identified by policy advocacy group The National Institute for Early Education Research’s “The State of Early Education 2017” report. States ranked better if they met all 10 quality standards, and worse if they met zero. At the request of NIEER, we did not factor in quality metrics for states that had met at least one quality standard, but less than 10.
Finding a qualified financial advisor doesn’t have to be hard. SmartAsset’s free tool matches you with up to 3 fiduciary financial advisors in your area in 5 minutes. Each advisor has been vetted by SmartAsset and is held to a fiduciary standard to act in your best interests. If you’re ready to be matched with local advisors that can help you achieve your financial goals, get started now.
Thank you for reading! Have some feedback for us?
Contact the 24/7 Wall St. editorial team.