
Ask anyone working in a restaurant, and they’ll tell you that waiting tables is a physically and emotionally demanding job. Yet, servers are often not compensated very well. In many cities, the average wage for a waiter, even after tips, barely surpasses the federal minimum wage of $7.25 an hour. Of course, some cities are better than others for members of the profession. In some cities, hourly wages for servers are more than double the federal minimum wage.
24/7 Wall St. identified the best cities for waiters by reviewing average hourly wages, including tips, for full and part time waiters in U.S. metropolitan areas. Legislation needed to have been enacted raising the minimum wage in each of the areas we considered.
Sixteen of the 25 best cities to be a server are located in California. Like six other states, California currently requires employers to pay tipped employees the full state minimum wage — before tips. But the state is not stopping there.
All of the California cities on the top 25 cities for waiters passed laws that will increase the minimum wage over the next several years. This is important in a state like California, where 1,769,100 people are employed in restaurant and foodservice jobs, or about 10% of all the jobs in the state.
Other states represented on this list include Washington and Oregon, both of which are also among the seven states that have made paying servers full state minimum wage before tips mandatory.
The New York-Newark-Jersey City metropolitan area is also among the top 25 best cities for waiters and waitresses, more than likely due to the abundance of high-end restaurants enjoyed by affluent customers. For perspective, there are 71 Michelin-starred restaurants in New York City alone, the most of any U.S. city to earn one of the most prestigious titles a restaurant can acquire.
Click here to see the best cities to be a waiter.
To determine the 25 best cities for servers, 24/7 Wall St. analyzed 2017 wage data for waiters and waitresses from the Bureau of Labor Statistics. Wages including tips for full and part time waiters are included. The number of waiters and waitresses employed in each metro area also came from the BLS. For cost of living, we considered regional price parity for 2016. We also reviewed GDP by industry for 2016 from the Bureau of Economic Analysis. Median household income was obtained from the U.S. Census Bureau’s 2016 American Community Survey. To be considered, legislation raising the minimum wage in the metropolitan area needed to have been enacted. The number of full service restaurants came from the U.S. Census Bureau’s Business Patterns for 2016 report.

25. Bellingham, WA
Avg. hourly wage, waiters: $13.56
No. of waiters: 1,550 (18.84 per 1,000 jobs)
Cost of living: 1% less than nat’l avg.
No. of full-service restaurants: 203
[in-text-ad]

24. Yuba City, CA
Avg. hourly wage, waiters: $13.56
No. of waiters: 600 (14.82 per 1,000 jobs)
Cost of living: 3% less than nat’l avg.
No. of full-service restaurants: 81 (bottom 25%)
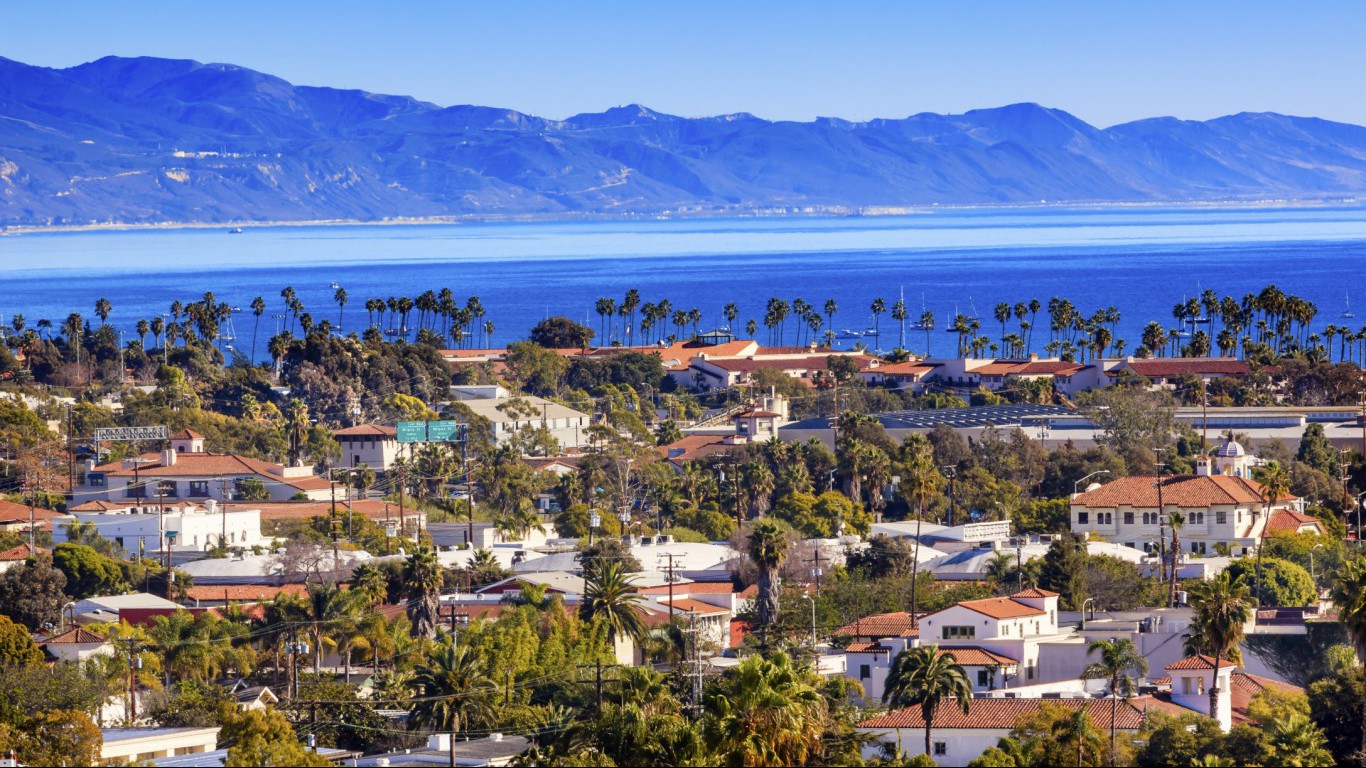
23. Santa Maria-Santa Barbara, CA
Avg. hourly wage, waiters: $13.66
No. of waiters: 4,800 (26.35 per 1,000 jobs)
Cost of living: 10% greater than nat’l avg.
No. of full-service restaurants: 408
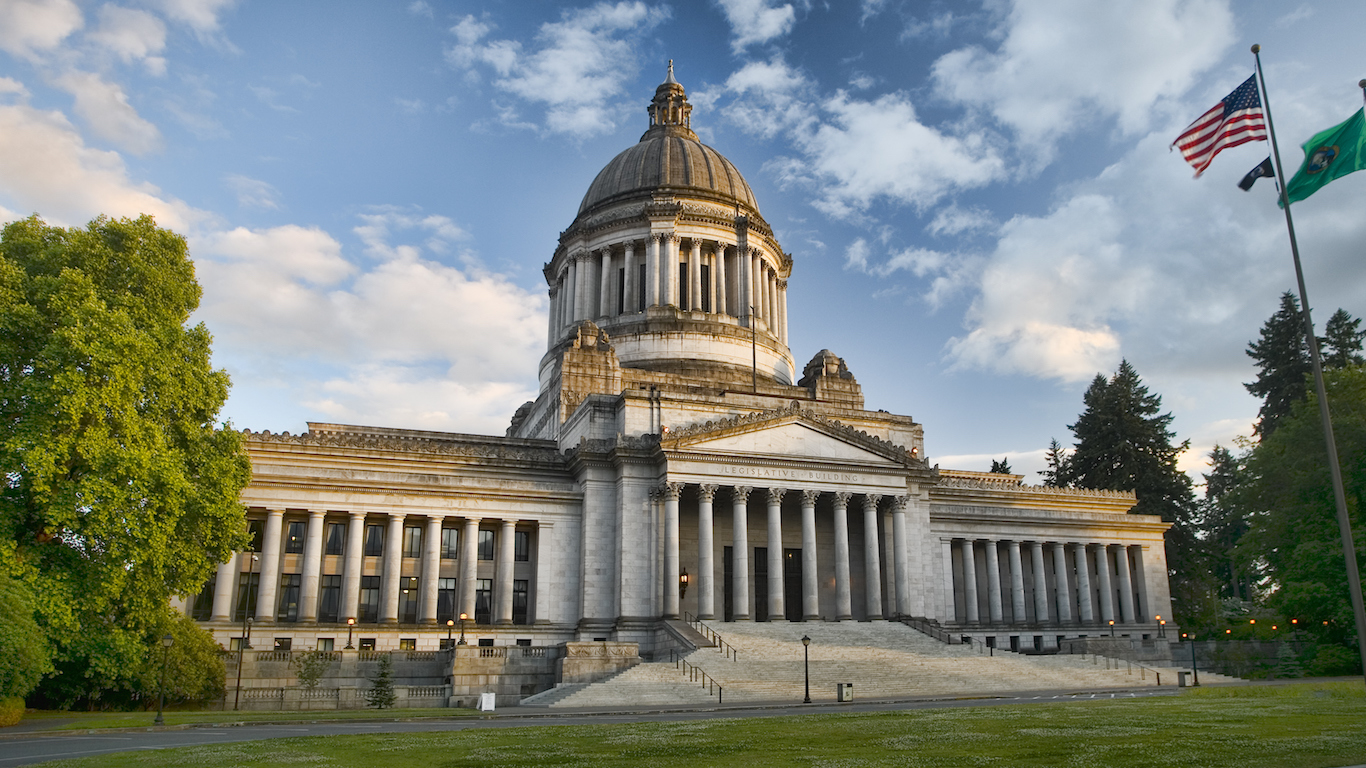
22. Olympia-Tumwater, WA
Avg. hourly wage, waiters: $13.86
No. of waiters: 1,680 (16.24 per 1,000 jobs)
Cost of living: 7% greater than nat’l avg.
No. of full-service restaurants: 185
[in-text-ad-2]

21. Wenatchee, WA
Avg. hourly wage, waiters: $13.91
No. of waiters: 870 (20.38 per 1,000 jobs)
Cost of living: 5% less than nat’l avg.
No. of full-service restaurants: 120
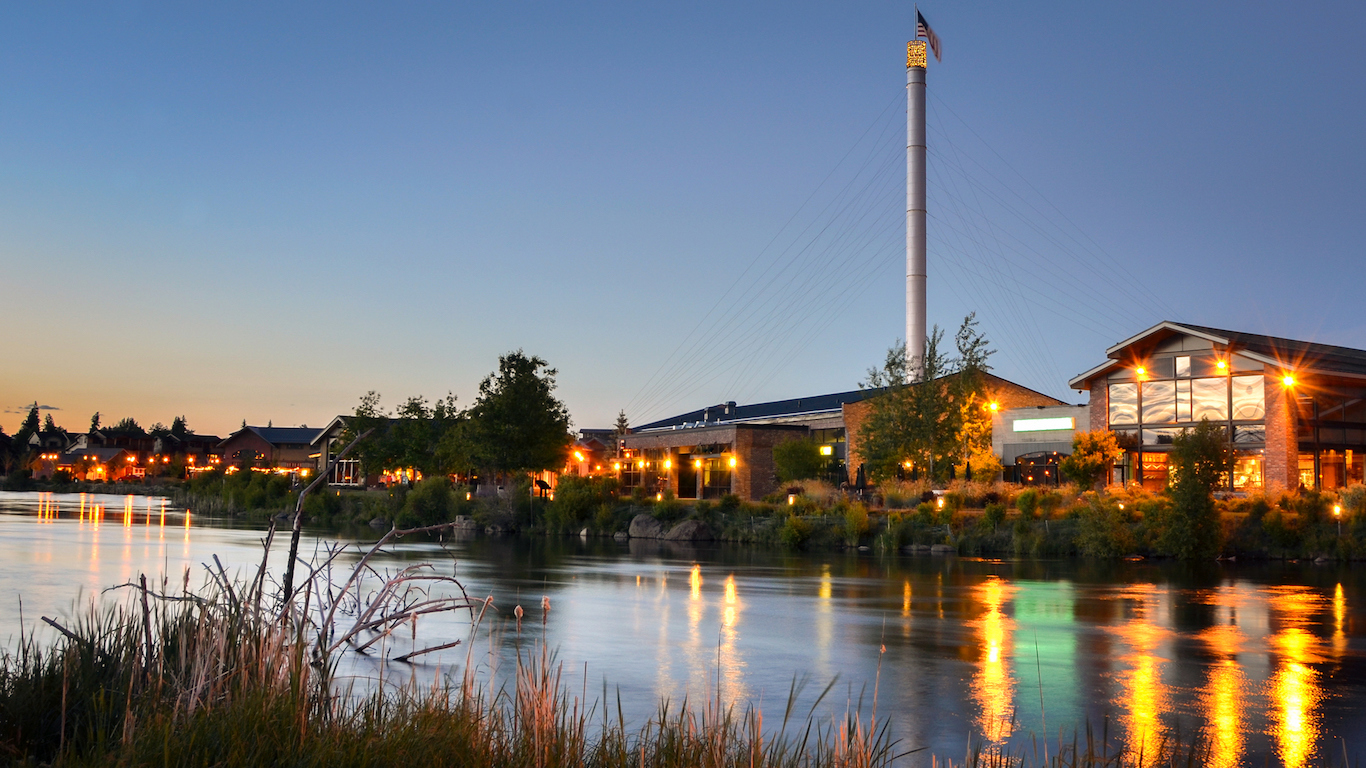
20. Bend-Redmond, OR
Avg. hourly wage, waiters: $14.2
No. of waiters: 2,170 (28.92 per 1,000 jobs)
Cost of living: 1% less than nat’l avg.
No. of full-service restaurants: 207
[in-text-ad]

19. Los Angeles-Long Beach-Anaheim, CA
Avg. hourly wage, waiters: $14.21
No. of waiters: 76,380 (17.24 per 1,000 jobs)
Cost of living: 18% greater than nat’l avg.
No. of full-service restaurants: 10,904 (top 10%)
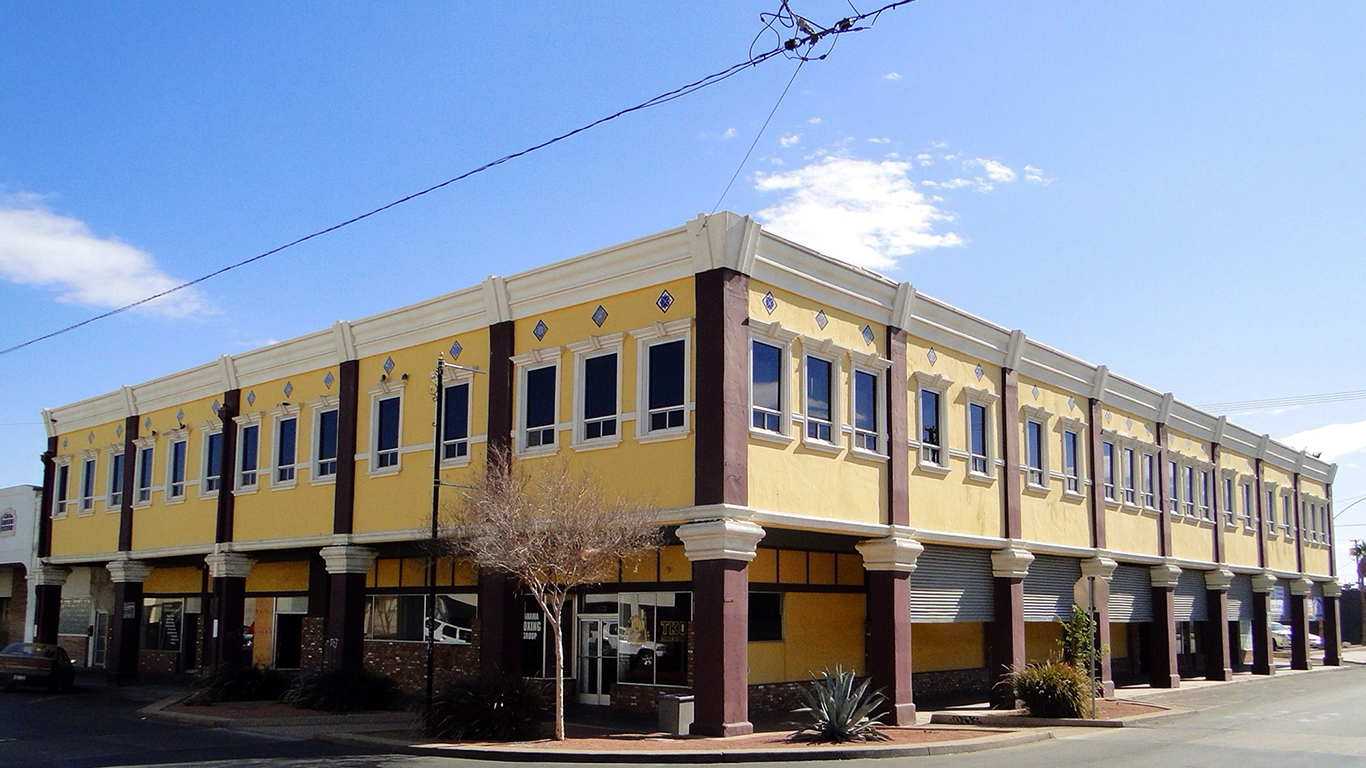
18. El Centro, CA
Avg. hourly wage, waiters: $14.46
No. of waiters: 620 (11.46 per 1,000 jobs)
Cost of living: 11% less than nat’l avg.
No. of full-service restaurants: 70 (bottom 25%)
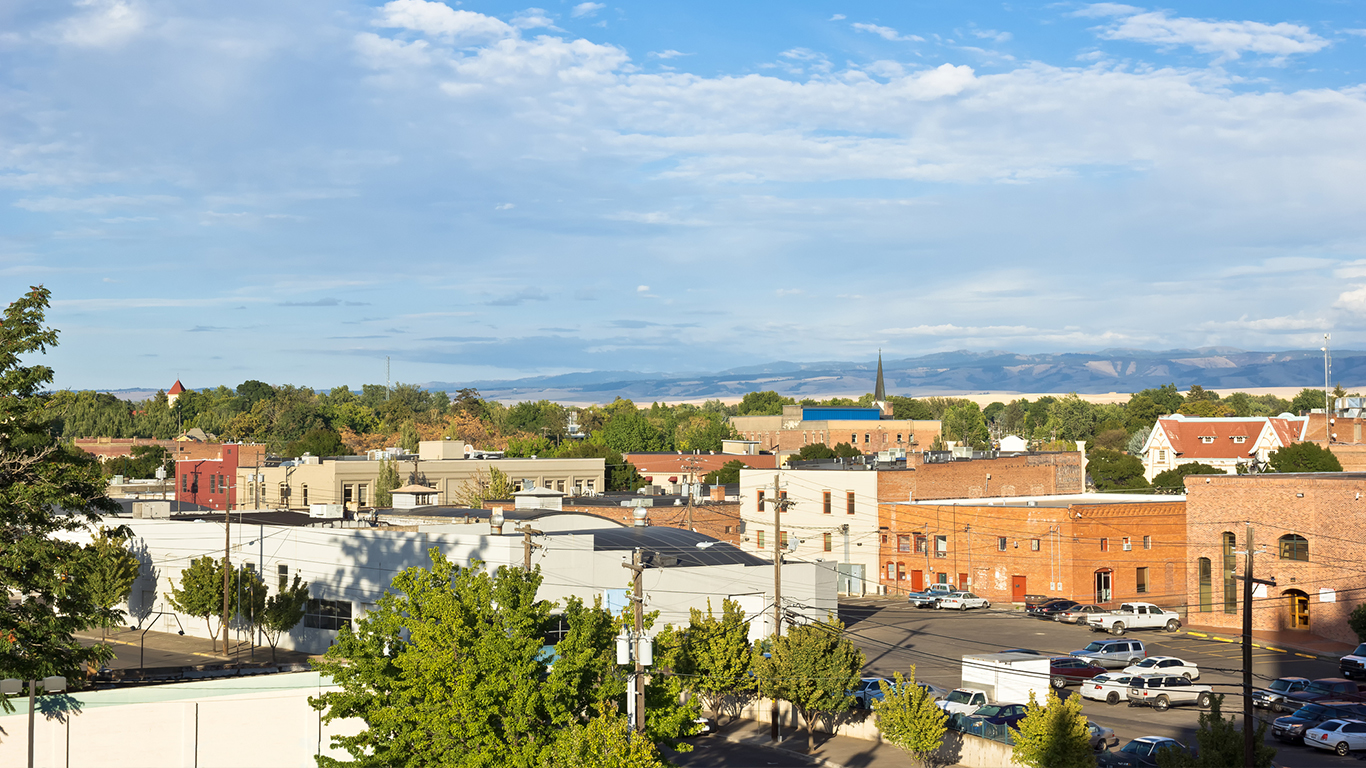
17. Walla Walla, WA
Avg. hourly wage, waiters: $14.64
No. of waiters: 220 (8.64 per 1,000 jobs)
Cost of living: 5% less than nat’l avg.
No. of full-service restaurants: 48 (bottom 10%)
[in-text-ad-2]
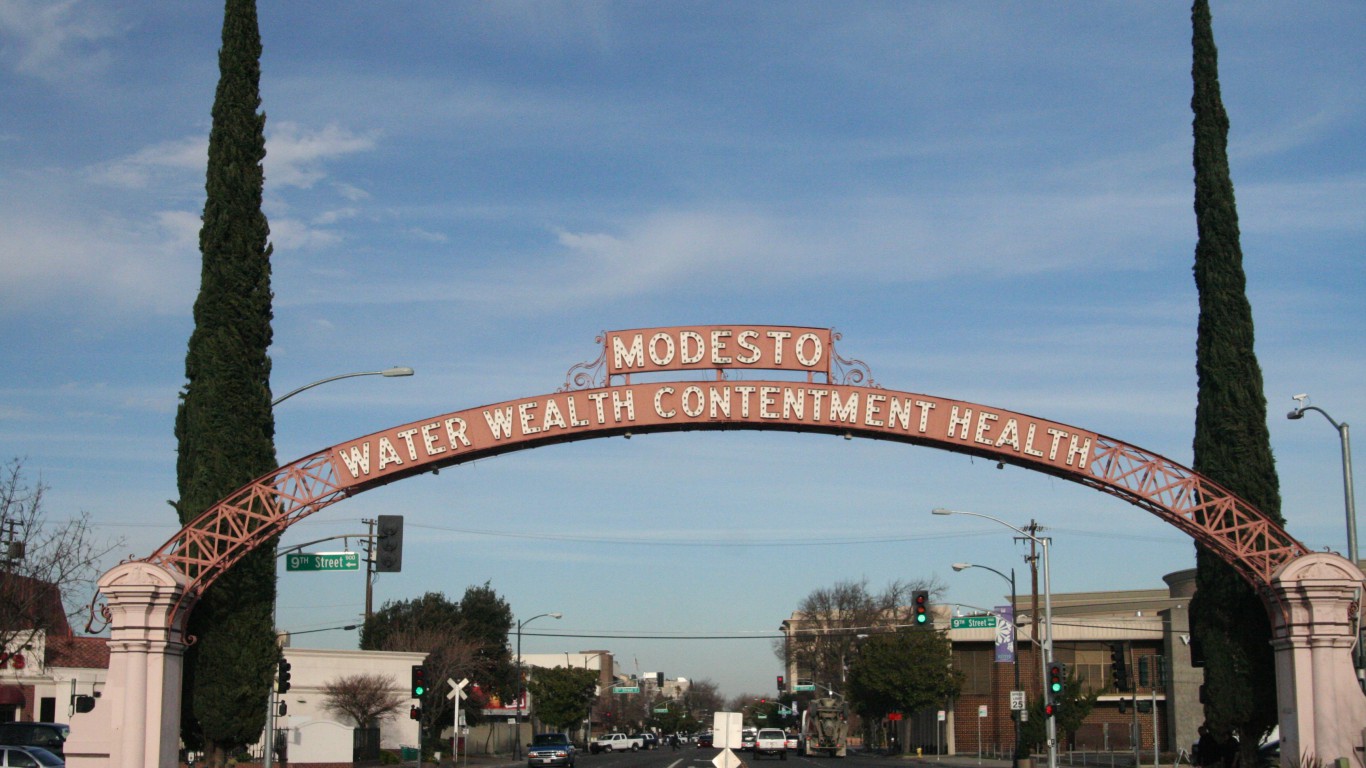
16. Modesto, CA
Avg. hourly wage, waiters: $14.65
No. of waiters: 2,710 (15.72 per 1,000 jobs)
Cost of living: 2% less than nat’l avg.
No. of full-service restaurants: 293
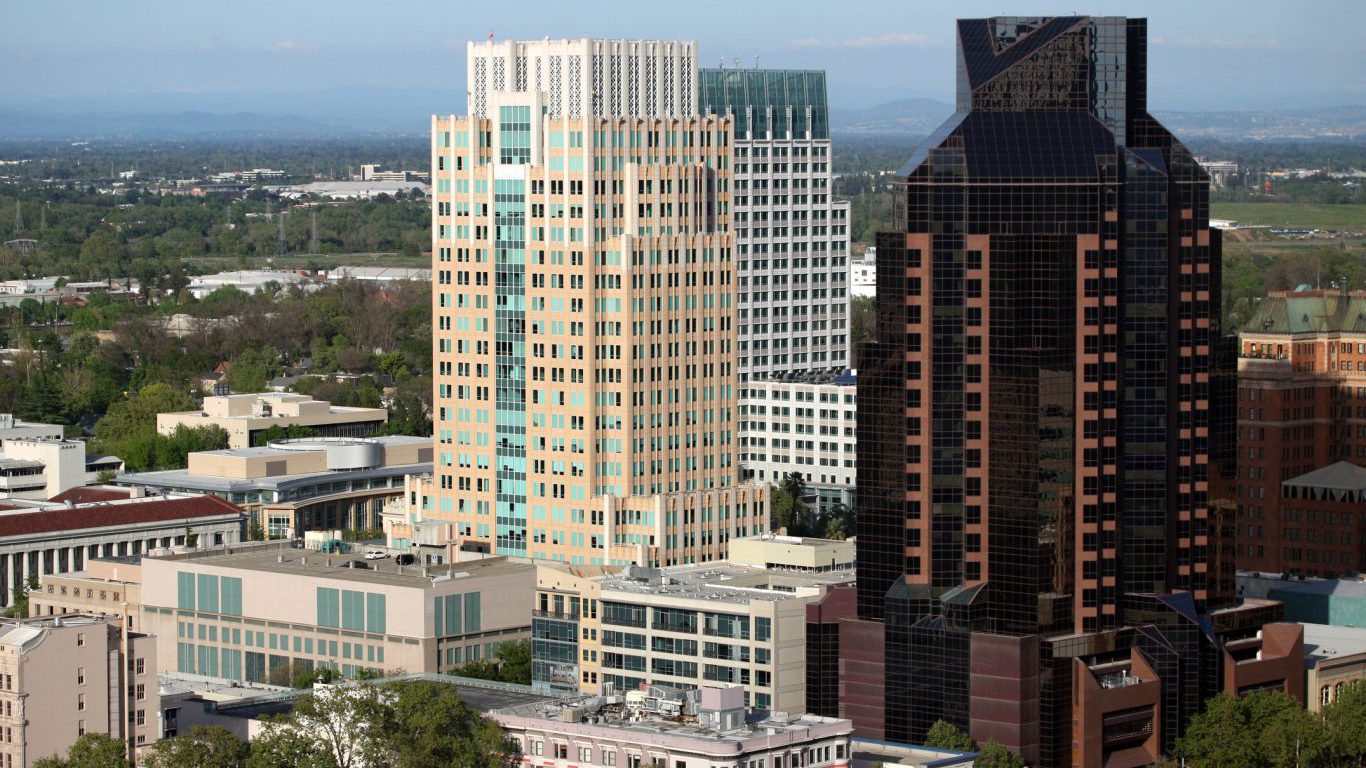
15. Sacramento–Roseville–Arden-Arcade, CA
Avg. hourly wage, waiters: $14.73
No. of waiters: 15,510 (16.99 per 1,000 jobs)
Cost of living: 2% greater than nat’l avg.
No. of full-service restaurants: 1,655 (top 10%)
[in-text-ad]
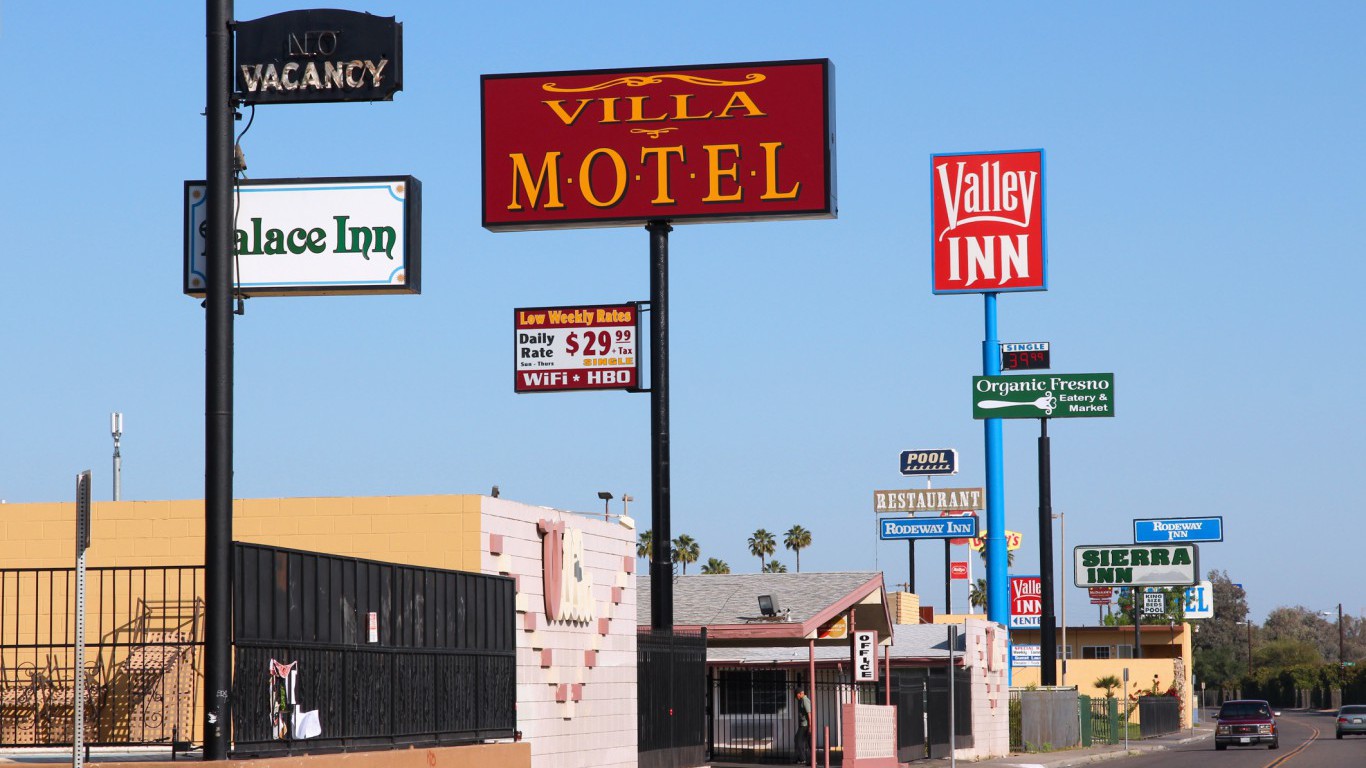
14. Fresno, CA
Avg. hourly wage, waiters: $14.85
No. of waiters: 4,140 (11.81 per 1,000 jobs)
Cost of living: 4% less than nat’l avg.
No. of full-service restaurants: 519 (top 25%)

13. Vallejo-Fairfield, CA
Avg. hourly wage, waiters: $15.02
No. of waiters: 2,100 (16.31 per 1,000 jobs)
Cost of living: 18% greater than nat’l avg.
No. of full-service restaurants: 265

12. New York-Newark-Jersey City, NY-NJ-PA
Avg. hourly wage, waiters: $15.27
No. of waiters: 112,820 (16.85 per 1,000 jobs)
Cost of living: 22 above average
No. of full-service restaurants: 20,286 (top 10%)
[in-text-ad-2]

11. Santa Cruz-Watsonville, CA
Avg. hourly wage, waiters: $15.48
No. of waiters: 1,890 (20.30 per 1,000 jobs)
Cost of living: 25% greater than nat’l avg.
No. of full-service restaurants: 278

10. San Jose-Sunnyvale-Santa Clara, CA
Avg. hourly wage, waiters: $15.52
No. of waiters: 14,770 (14.13 per 1,000 jobs)
Cost of living: 27% greater than nat’l avg.
No. of full-service restaurants: 1,748 (top 10%)
[in-text-ad]
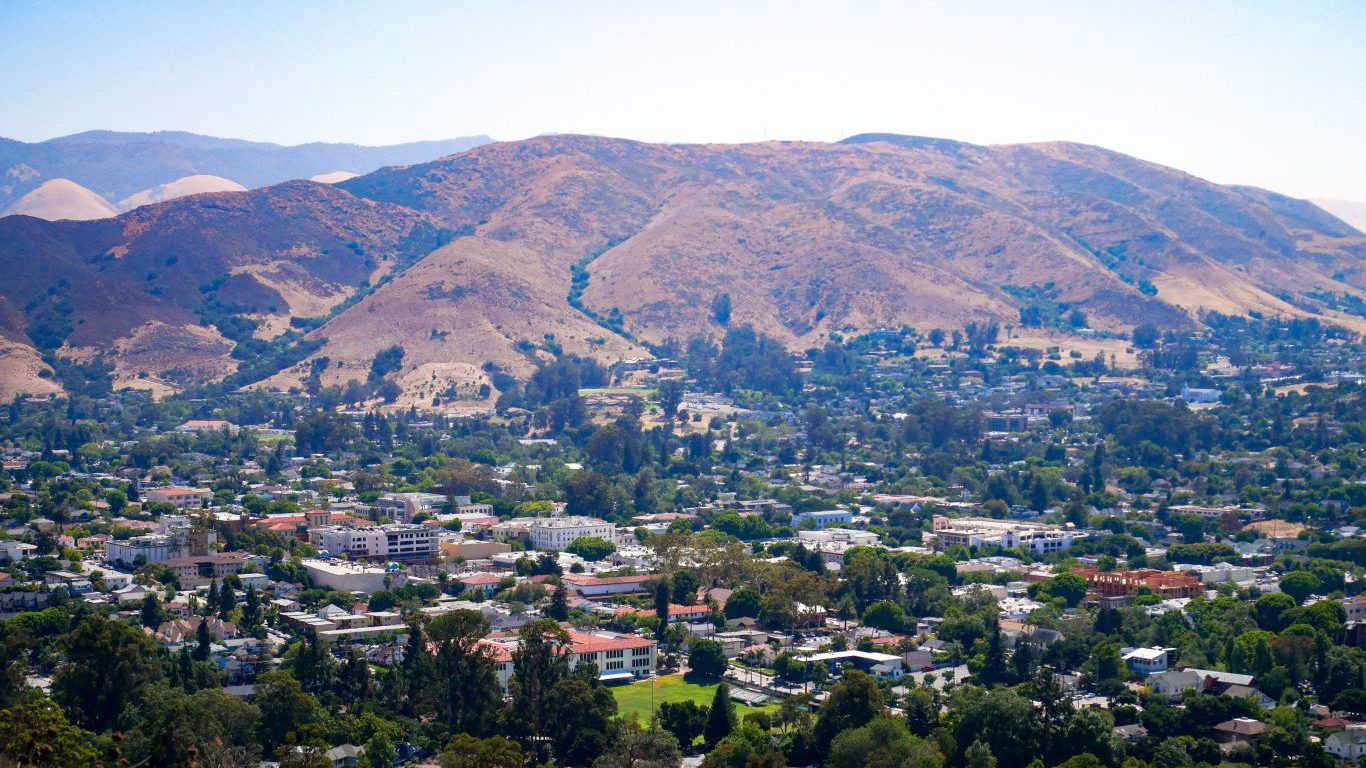
9. San Luis Obispo-Paso Robles-Arroyo Grande, CA
Avg. hourly wage, waiters: $15.55
No. of waiters: 2,470 (21.89 per 1,000 jobs)
Cost of living: 7% greater than nat’l avg.
No. of full-service restaurants: 340
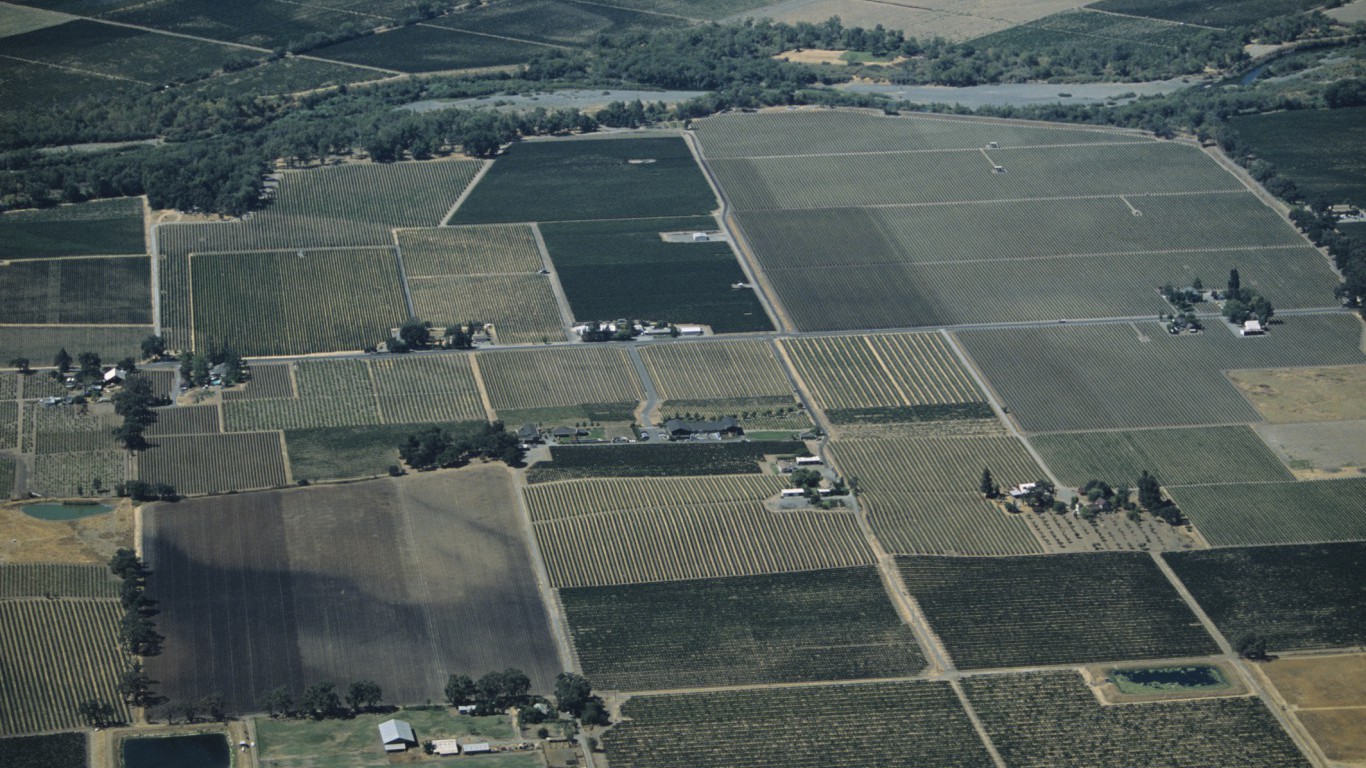
8. Santa Rosa, CA
Avg. hourly wage, waiters: $16.11
No. of waiters: 4,690 (24.24 per 1,000 jobs)
Cost of living: 21% greater than nat’l avg.
No. of full-service restaurants: 523 (top 25%)

7. Bremerton-Silverdale, WA
Avg. hourly wage, waiters: $16.16
No. of waiters: 1,310 (15.62 per 1,000 jobs)
Cost of living: 6% greater than nat’l avg.
No. of full-service restaurants: 191
[in-text-ad-2]

6. San Diego-Carlsbad, CA
Avg. hourly wage, waiters: $16.83
No. of waiters: 29,010 (20.91 per 1,000 jobs)
Cost of living: 16% greater than nat’l avg.
No. of full-service restaurants: 2,593 (top 10%)

5. Napa, CA
Avg. hourly wage, waiters: $16.97
No. of waiters: 2,190 (30.90 per 1,000 jobs)
Cost of living: 22% greater than nat’l avg.
No. of full-service restaurants: 150
[in-text-ad]

4. Mount Vernon-Anacortes, WA
Avg. hourly wage, waiters: $17.4
No. of waiters: 720 (16.21 per 1,000 jobs)
Cost of living: 2% less than nat’l avg.
No. of full-service restaurants: 119

3. Salinas, CA
Avg. hourly wage, waiters: $17.84
No. of waiters: 3,750 (22.74 per 1,000 jobs)
Cost of living: 8% greater than nat’l avg.
No. of full-service restaurants: 380
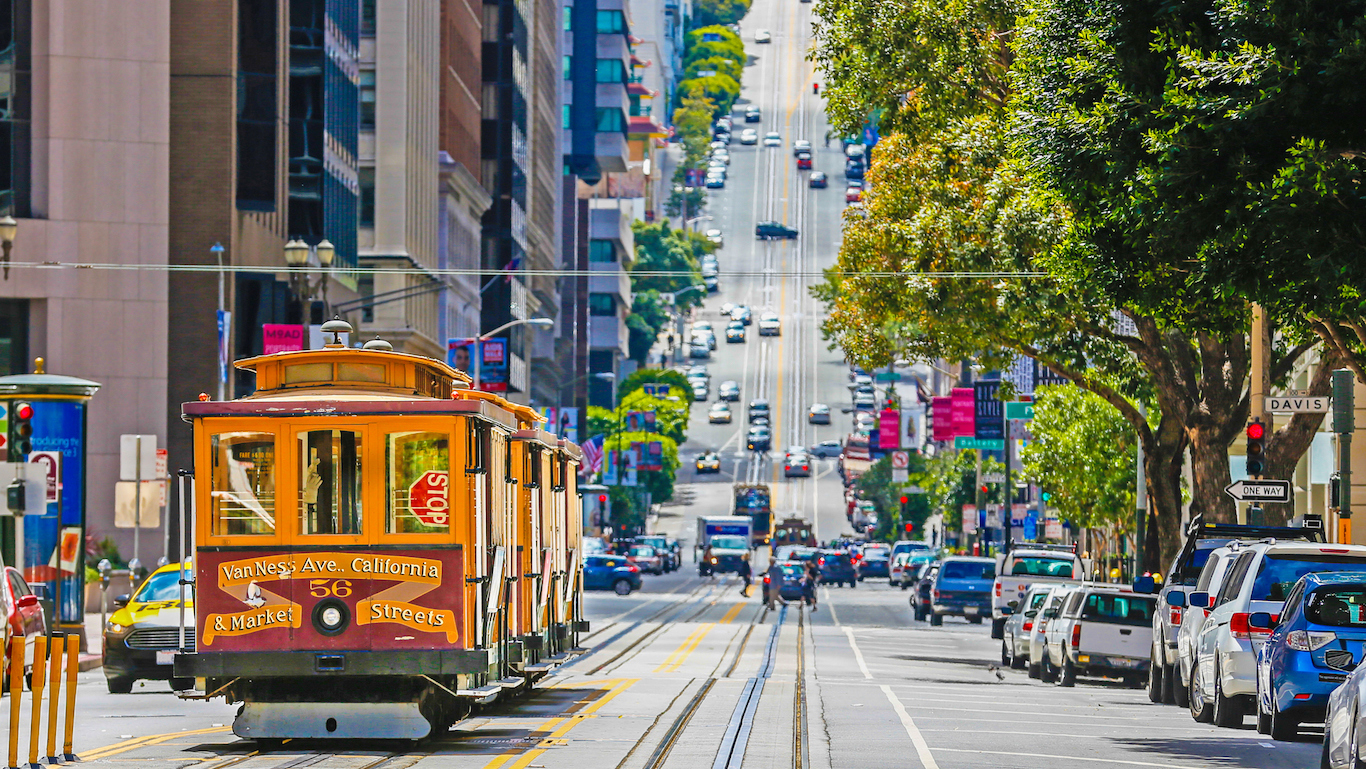
2. San Francisco-Oakland-Hayward, CA
Avg. hourly wage, waiters: $17.93
No. of waiters: 22,670 (20.30 per 1,000 jobs)
Cost of living: 25% greater than nat’l avg.
No. of full-service restaurants: 5,375 (top 10%)
[in-text-ad-2]
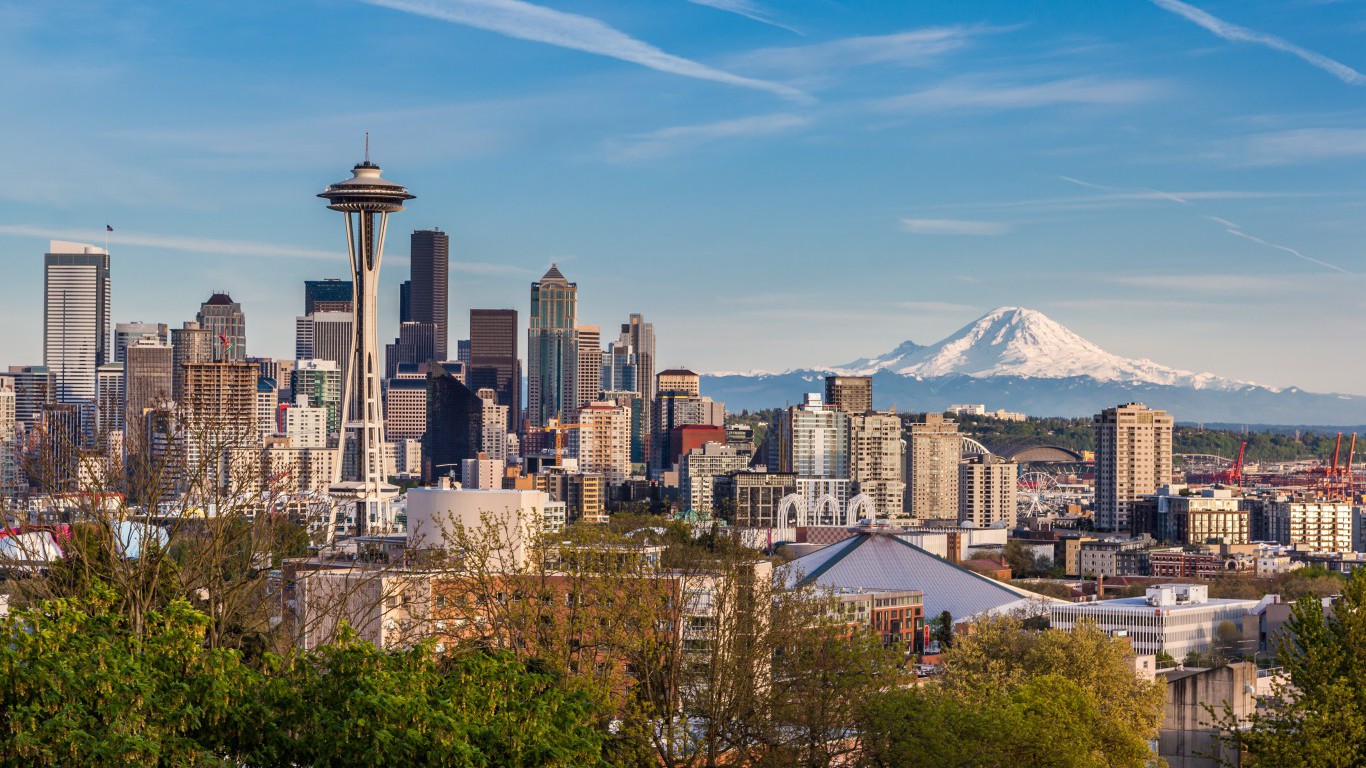
1. Seattle-Tacoma-Bellevue, WA
Avg. hourly wage, waiters: $18.07
No. of waiters: 28,500 (17.30 per 1,000 jobs)
Cost of living: 11% greater than nat’l avg.
No. of full-service restaurants: 3,559 (top 10%)
Thank you for reading! Have some feedback for us?
Contact the 24/7 Wall St. editorial team.
 24/7 Wall St.
 24/7 Wall St.

