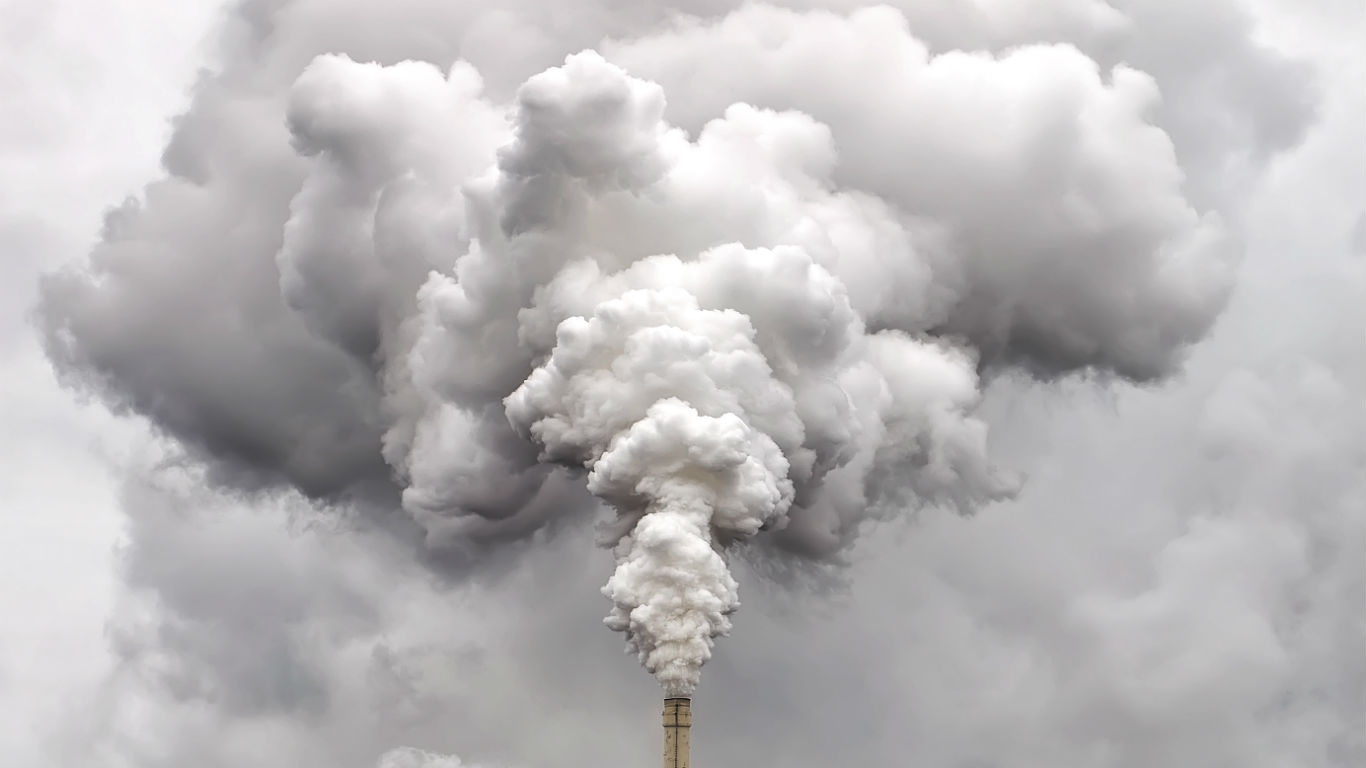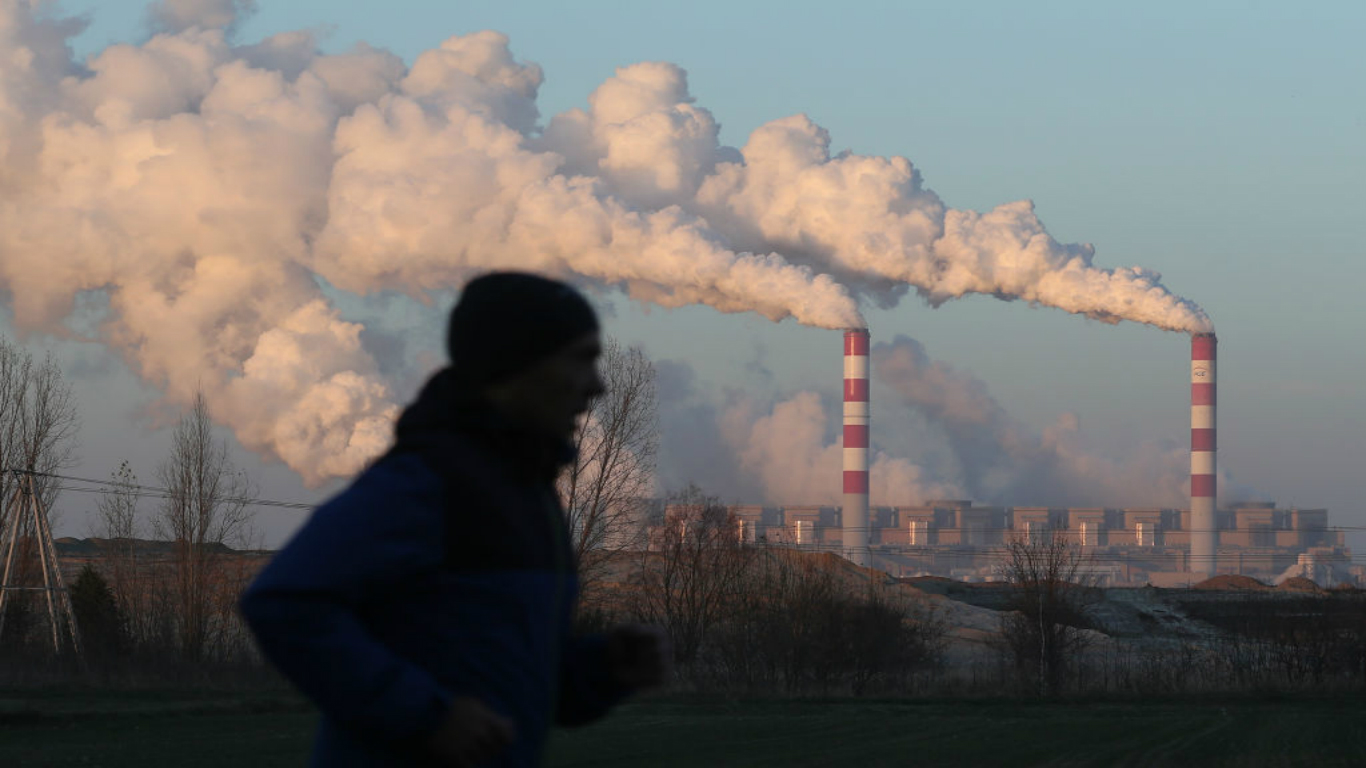
[cnxvideo id=”655413″ placement=”ros”]In 2017, the United States emitted over 6,200 metric tons of greenhouse gases, more than Russia and the entirety of Europe combined. The country is second only to China in emissions, but while China has a population more than quadrupling that of the United States, it less than doubles U.S. emissions.
And while the U.S. has stalled on clean power initiatives and withdrawn from the Paris climate accord, China and most other developed nations have made significant commitments to transform their energy infrastructures.
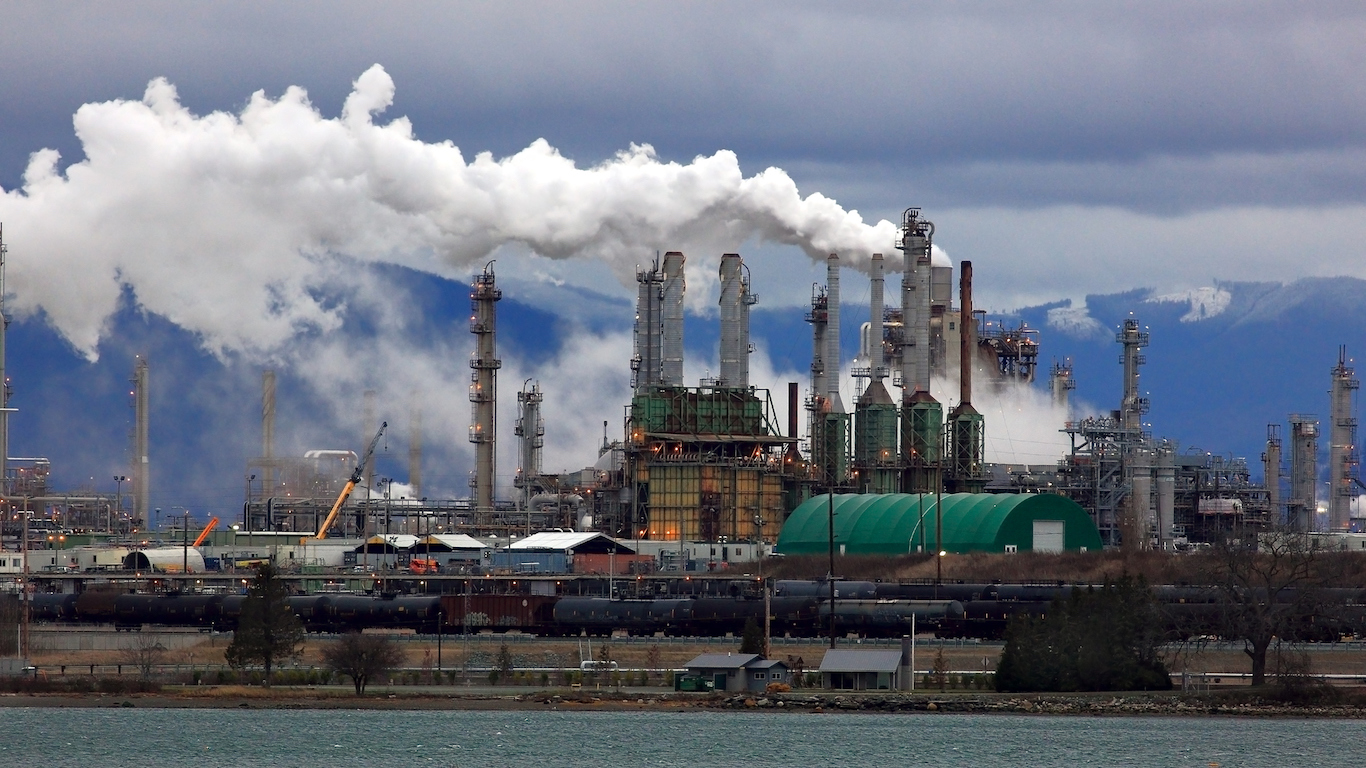
In the United States, environmental challenges are of course not limited to carbon emissions. The environment continues to face a range of threats, including under-regulated natural resource extraction, water pollution, and the destruction of natural habitats by industrial activities.
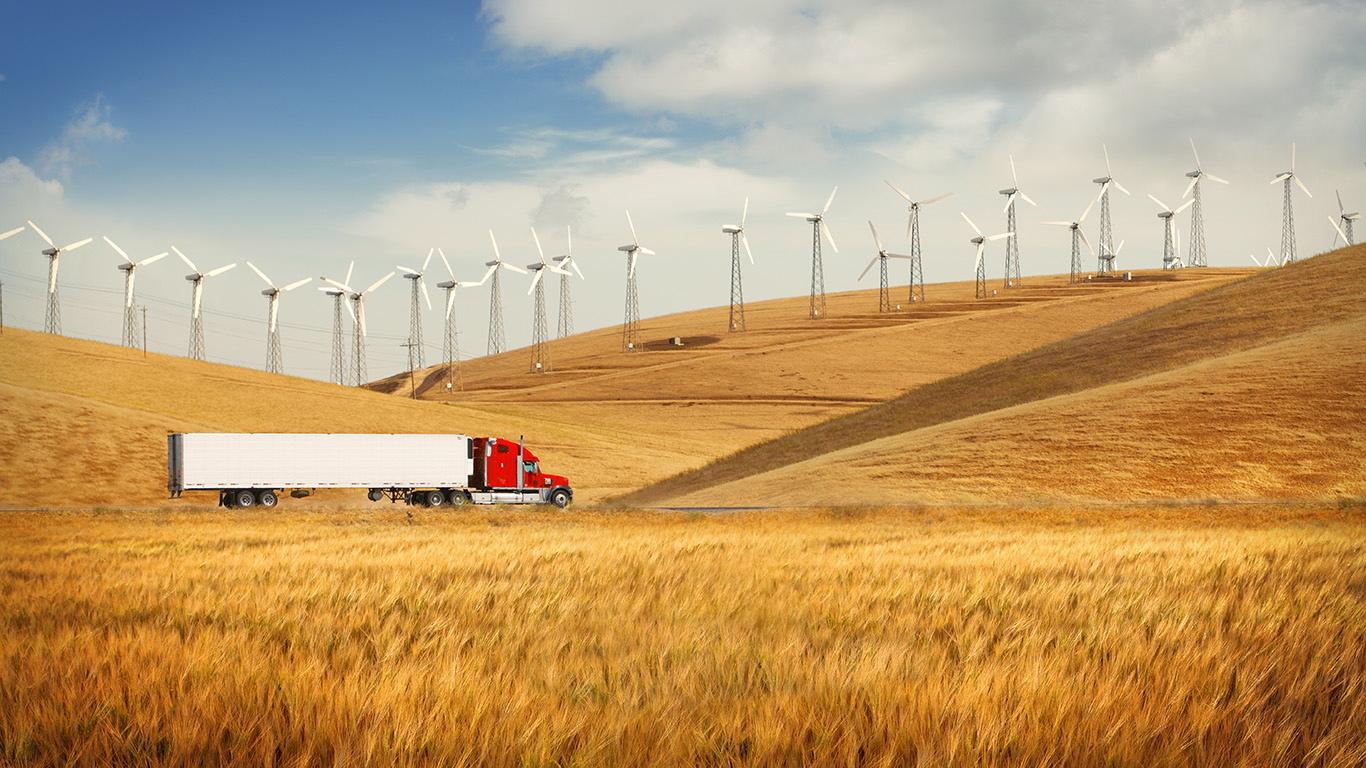
Even as the nation lags behind much of the world, and depressed gas prices have further reduced the sense of urgency felt by many businesses and regional governments, the country is slowly but surely making a transition to a renewable and emission-free power grid. Some states are much further along than others in this and other factors related to the environment.
24/7 Wall St. ranked all 50 states based on how environmentally friendly they are. The rank is based on an index consisting of a range of measures, including the share of residents who commute either by carpool, public transit, walking, or biking. We also considered air pollution levels across each state and the level of consumption of renewable energy. States are ranked from the most environmentally friendly to the least.
Click here to see the most and least environmentally-friendly states.
Click here to see our methodology.
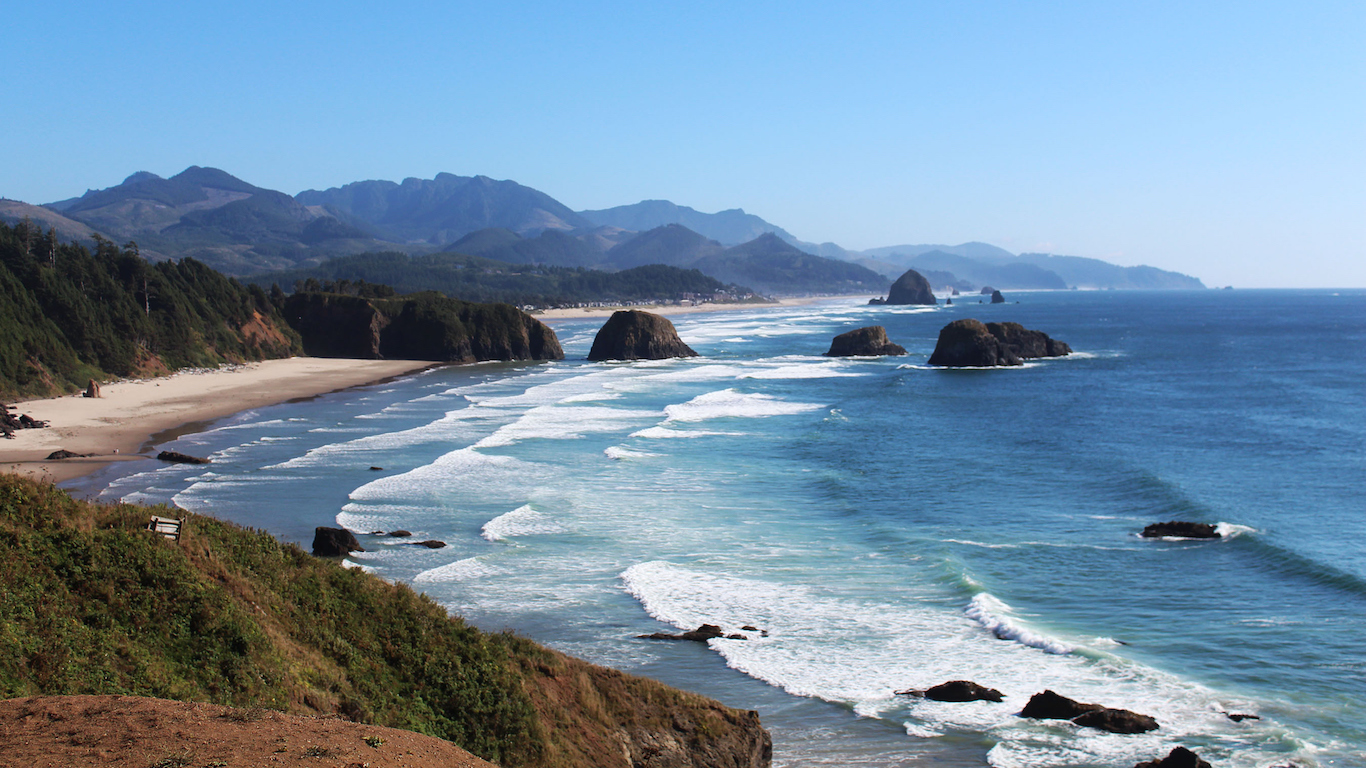
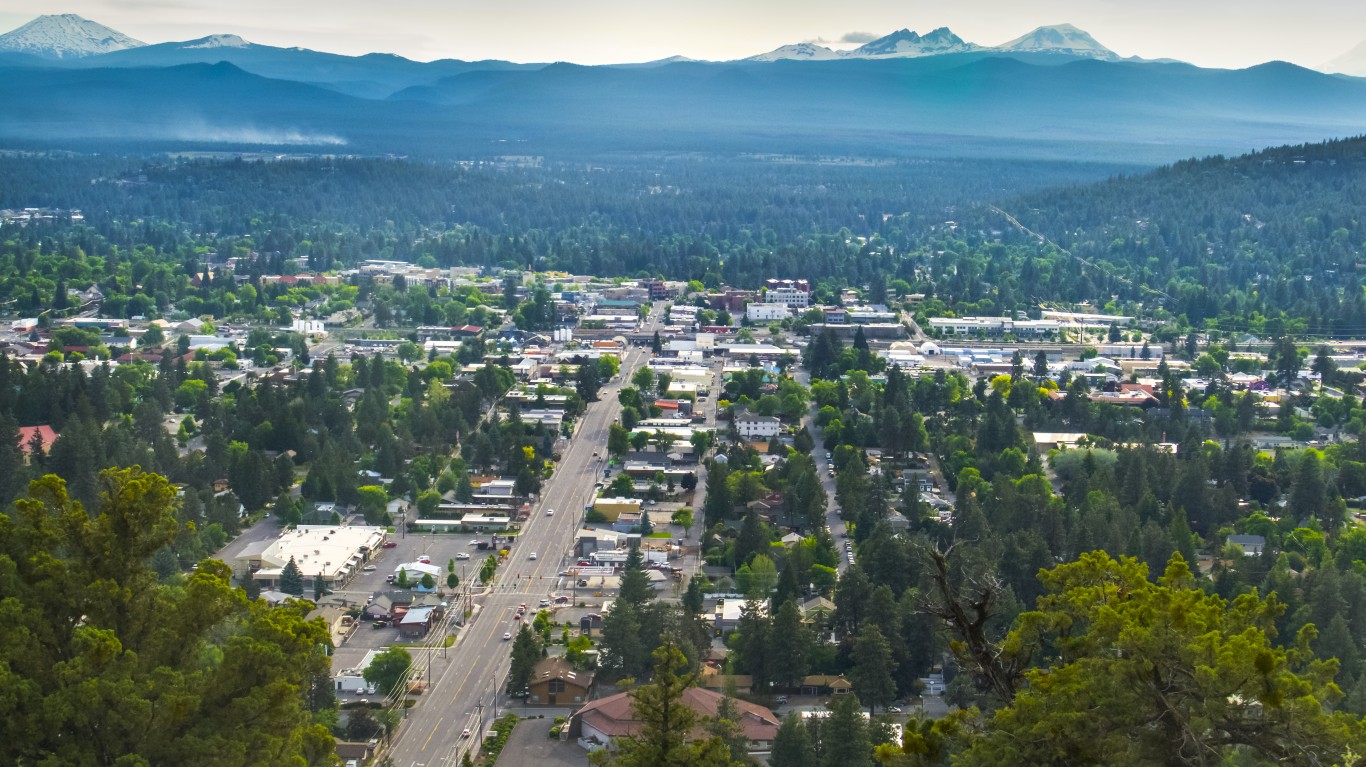
1. Oregon
> Pct. of commuters getting to work by bike, walking, or public transit: 21.0% (9th highest)
> Average Daily particle pollution: 7.0 micrograms
> Renewable Energy Consumption as a Share of State Total (%) 100.0% (the highest)
[in-text-ad]

2. Alaska
> Pct. of commuters getting to work by bike, walking, or public transit: 25.8% (3rd highest)
> Average Daily particle pollution: N/A
> Renewable Energy Consumption as a Share of State Total (%) 1.6% (3rd lowest)
[recirclink id=444492]

3. Washington
> Pct. of commuters getting to work by bike, walking, or public transit: 22.1% (6th highest)
> Average Daily particle pollution: 7.0 micrograms
> Renewable Energy Consumption as a Share of State Total (%) 96.5% (2nd highest)

4. Montana
> Pct. of commuters getting to work by bike, walking, or public transit: 17.8% (14th highest)
> Average Daily particle pollution: 6.2 micrograms
> Renewable Energy Consumption as a Share of State Total (%) 65.3% (5th highest)
[in-text-ad-2]

5. Hawaii
> Pct. of commuters getting to work by bike, walking, or public transit: 28.0% (2nd highest)
> Average Daily particle pollution: N/A micrograms
> Renewable Energy Consumption as a Share of State Total (%) 17.4% (21st highest)

6. Vermont
> Pct. of commuters getting to work by bike, walking, or public transit: 17.4% (15th highest)
> Average Daily particle pollution: 7.5 micrograms
> Renewable Energy Consumption as a Share of State Total (%) 51.9% (8th highest)
[in-text-ad]
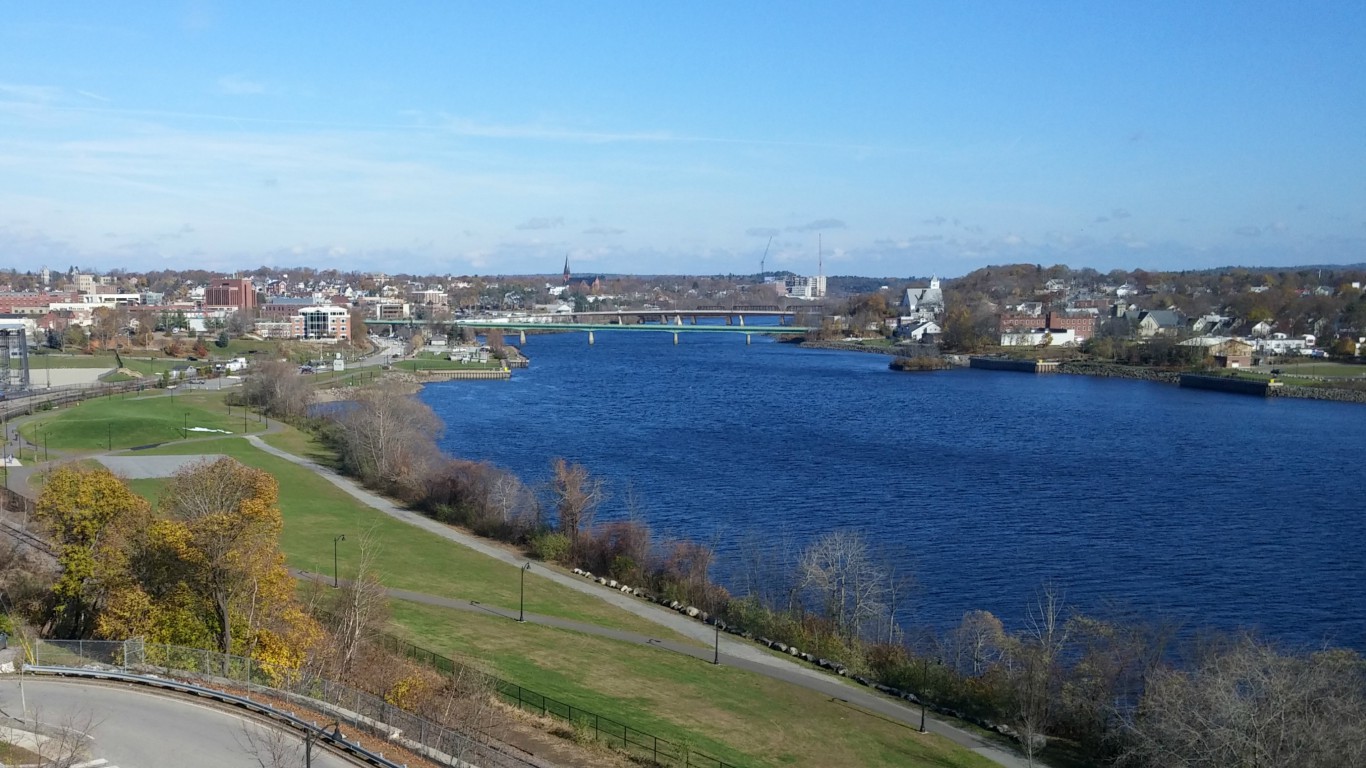
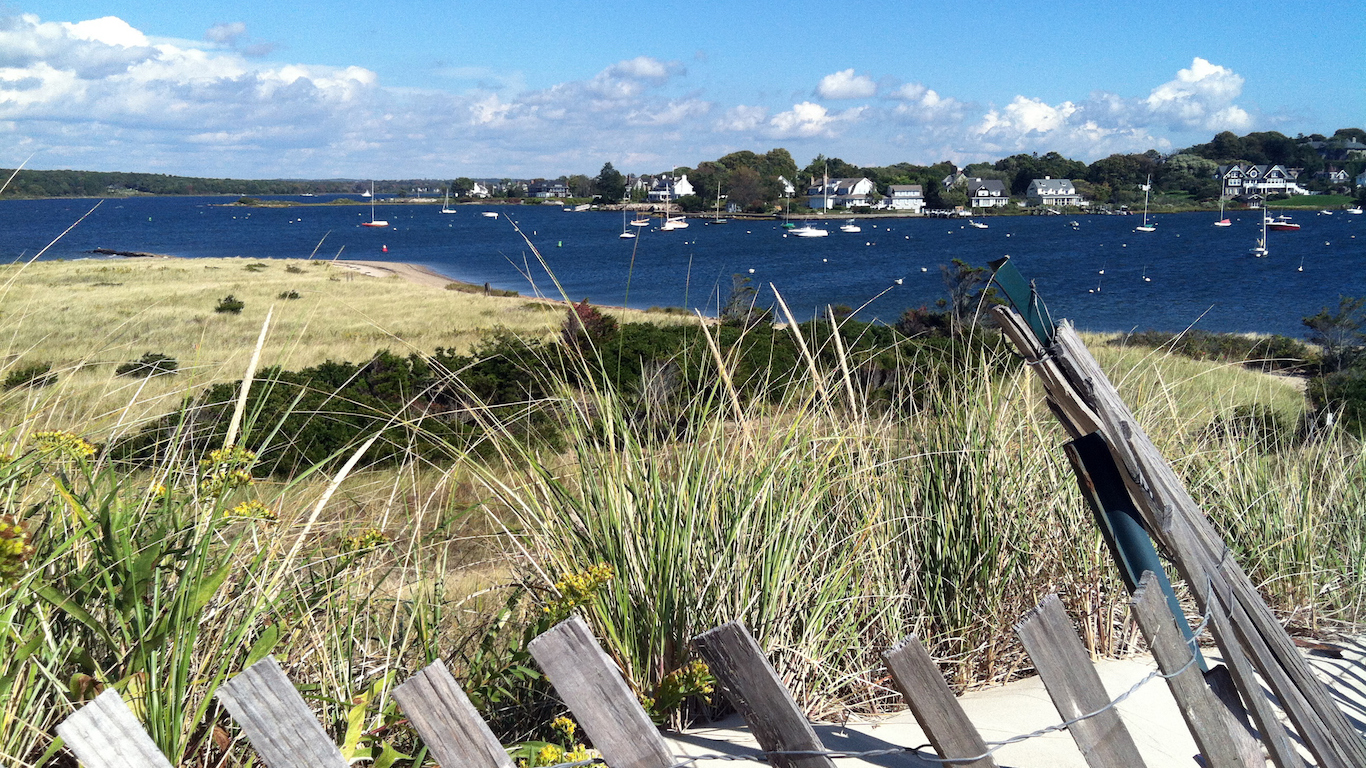
7. Maine
> Pct. of commuters getting to work by bike, walking, or public transit: 15.0% (23rd highest)
> Average Daily particle pollution: 7.4 micrograms
> Renewable Energy Consumption as a Share of State Total (%) 79.1% (3rd highest)
[recirclink id=444468]

8. Idaho
> Pct. of commuters getting to work by bike, walking, or public transit: 14.9% (25th lowest)
> Average Daily particle pollution: 7.2 micrograms
> Renewable Energy Consumption as a Share of State Total (%) 57.7% (7th highest)
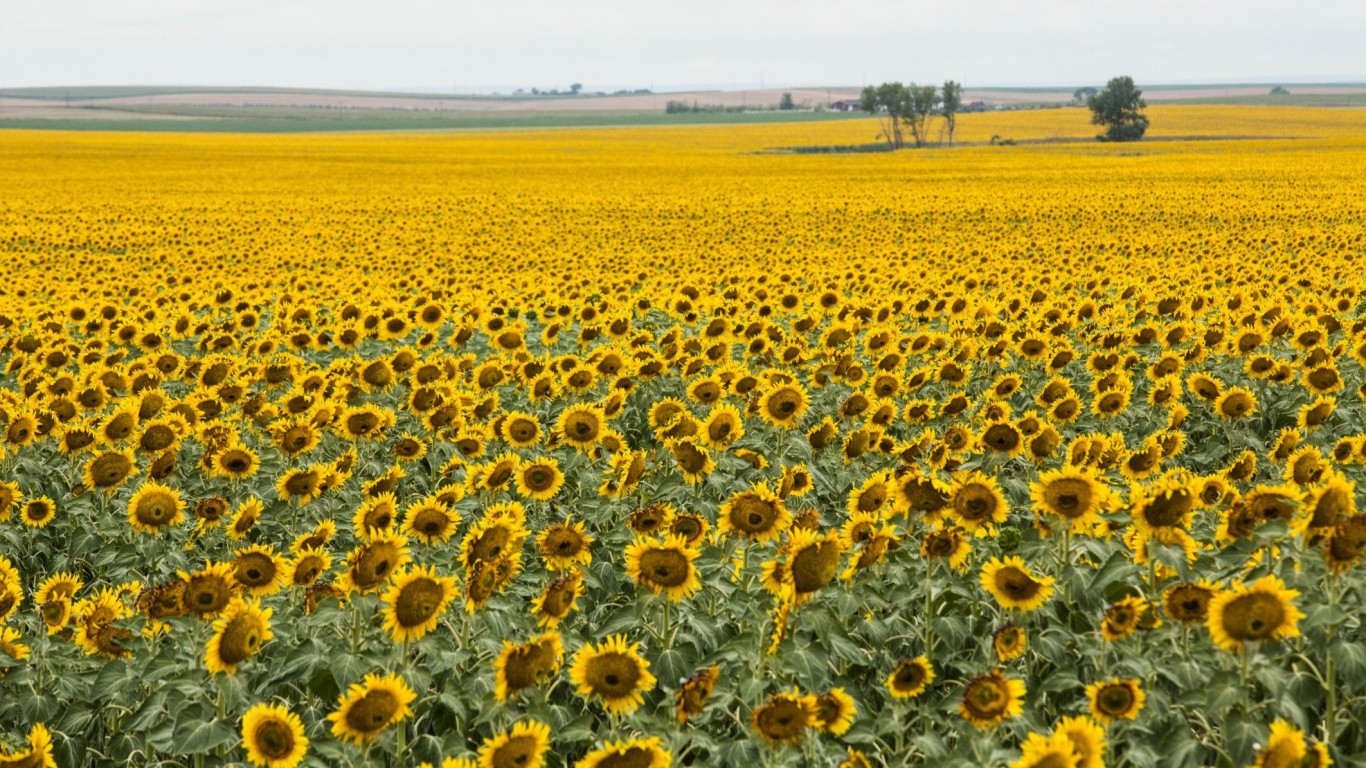
9. South Dakota
> Pct. of commuters getting to work by bike, walking, or public transit: 14.6% (23rd lowest)
> Average Daily particle pollution: 7.7 micrograms
> Renewable Energy Consumption as a Share of State Total (%) 74.6% (4th highest)
[in-text-ad-2]

10. Utah
> Pct. of commuters getting to work by bike, walking, or public transit: 18.0% (12th highest)
> Average Daily particle pollution: 6.1 micrograms
> Renewable Energy Consumption as a Share of State Total (%) 2.6% (7th lowest)
11. Wyoming
> Pct. of commuters getting to work by bike, walking, or public transit: 16.4% (20th highest)
> Average Daily particle pollution: 6.5 micrograms
> Renewable Energy Consumption as a Share of State Total (%) 15.3% (24th highest)
[in-text-ad]

12. Colorado
> Pct. of commuters getting to work by bike, walking, or public transit: 17.1% (18th highest)
> Average Daily particle pollution: 5.4 micrograms
> Renewable Energy Consumption as a Share of State Total (%) 13.6% (25th lowest)
[recirclink id=444391]

13. Nevada
> Pct. of commuters getting to work by bike, walking, or public transit: 17.1% (17th highest)
> Average Daily particle pollution: 5.9 micrograms
> Renewable Energy Consumption as a Share of State Total (%) 24.2% (15th highest)
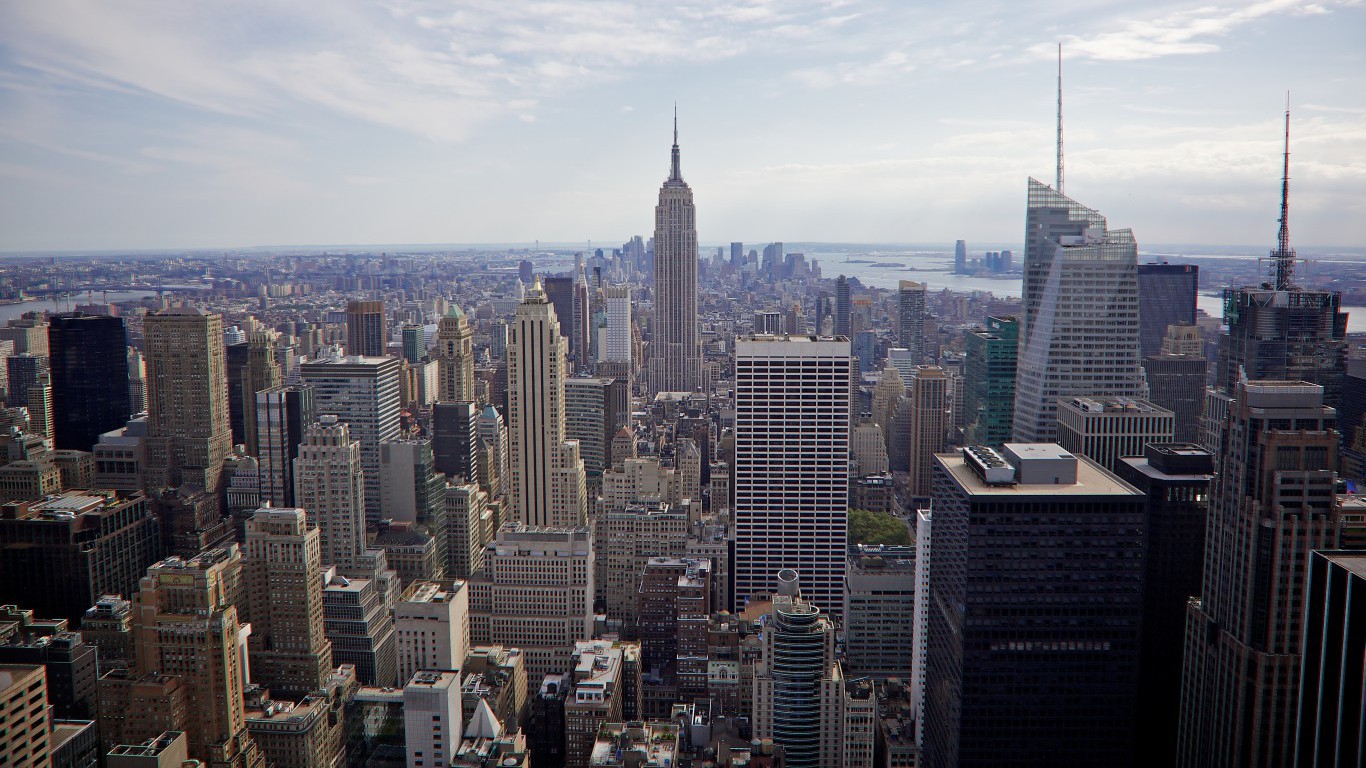
14. New York
> Pct. of commuters getting to work by bike, walking, or public transit: 43.1% (the highest)
> Average Daily particle pollution: 8.6 micrograms
> Renewable Energy Consumption as a Share of State Total (%) 19.5% (19th highest)
[in-text-ad-2]

15. Massachusetts
> Pct. of commuters getting to work by bike, walking, or public transit: 24.7% (5th highest)
> Average Daily particle pollution: 8.6 micrograms
> Renewable Energy Consumption as a Share of State Total (%) 6.8% (14th lowest)

16. North Dakota
> Pct. of commuters getting to work by bike, walking, or public transit: 14.6% (23rd lowest)
> Average Daily particle pollution: 7.5 micrograms
> Renewable Energy Consumption as a Share of State Total (%) 36.2% (11th highest)
[in-text-ad]

17. Arizona
> Pct. of commuters getting to work by bike, walking, or public transit: 17.2% (16th highest)
> Average Daily particle pollution: 6.0 micrograms
> Renewable Energy Consumption as a Share of State Total (%) 17.4% (21st highest)
[recirclink id=444326]
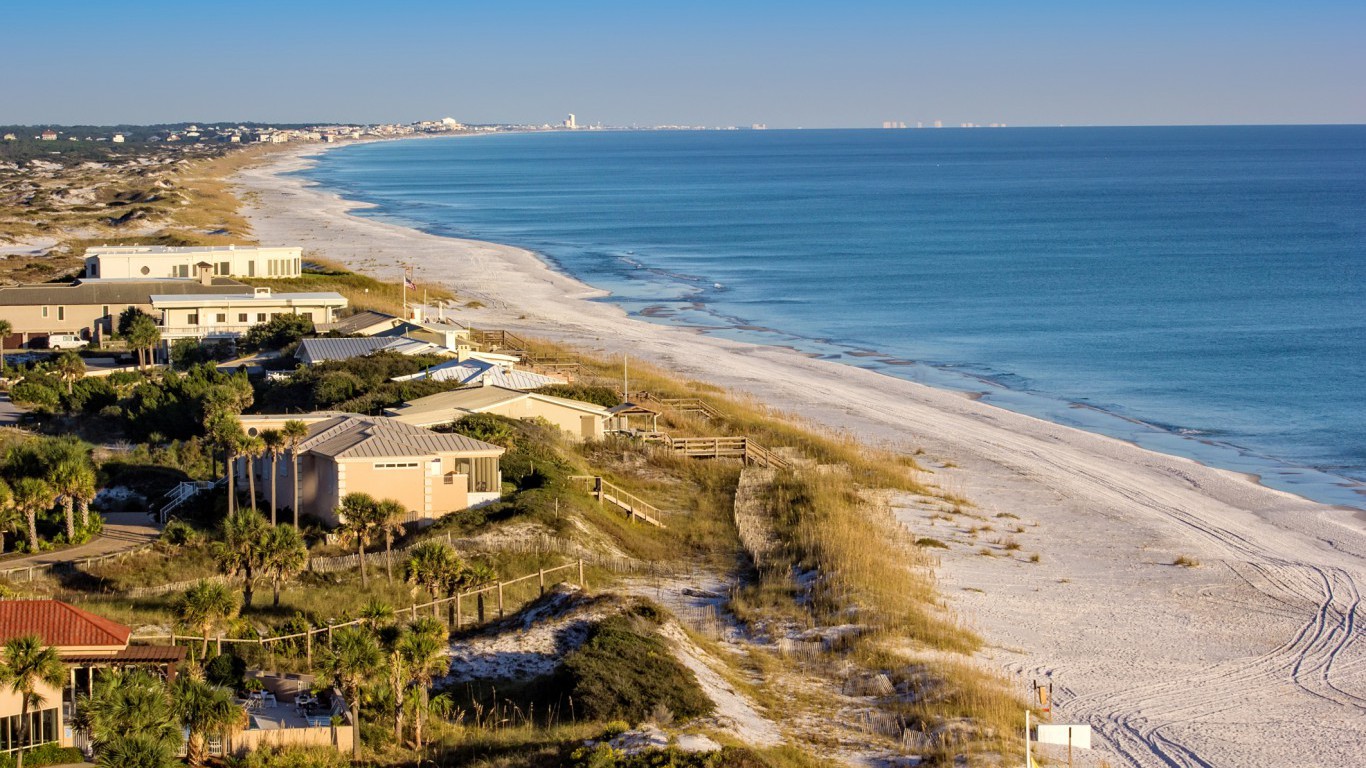
18. Florida
> Pct. of commuters getting to work by bike, walking, or public transit: 14.9% (25th lowest)
> Average Daily particle pollution: 7.4 micrograms
> Renewable Energy Consumption as a Share of State Total (%) 10.1% (21st lowest)

19. New Mexico
> Pct. of commuters getting to work by bike, walking, or public transit: 14.9% (25th highest)
> Average Daily particle pollution: 6.4 micrograms
> Renewable Energy Consumption as a Share of State Total (%) 8.7% (18th lowest)
[in-text-ad-2]

20. Minnesota
> Pct. of commuters getting to work by bike, walking, or public transit: 16.3% (21st highest)
> Average Daily particle pollution: 9.3 micrograms
> Renewable Energy Consumption as a Share of State Total (%) 27.5% (12th highest)
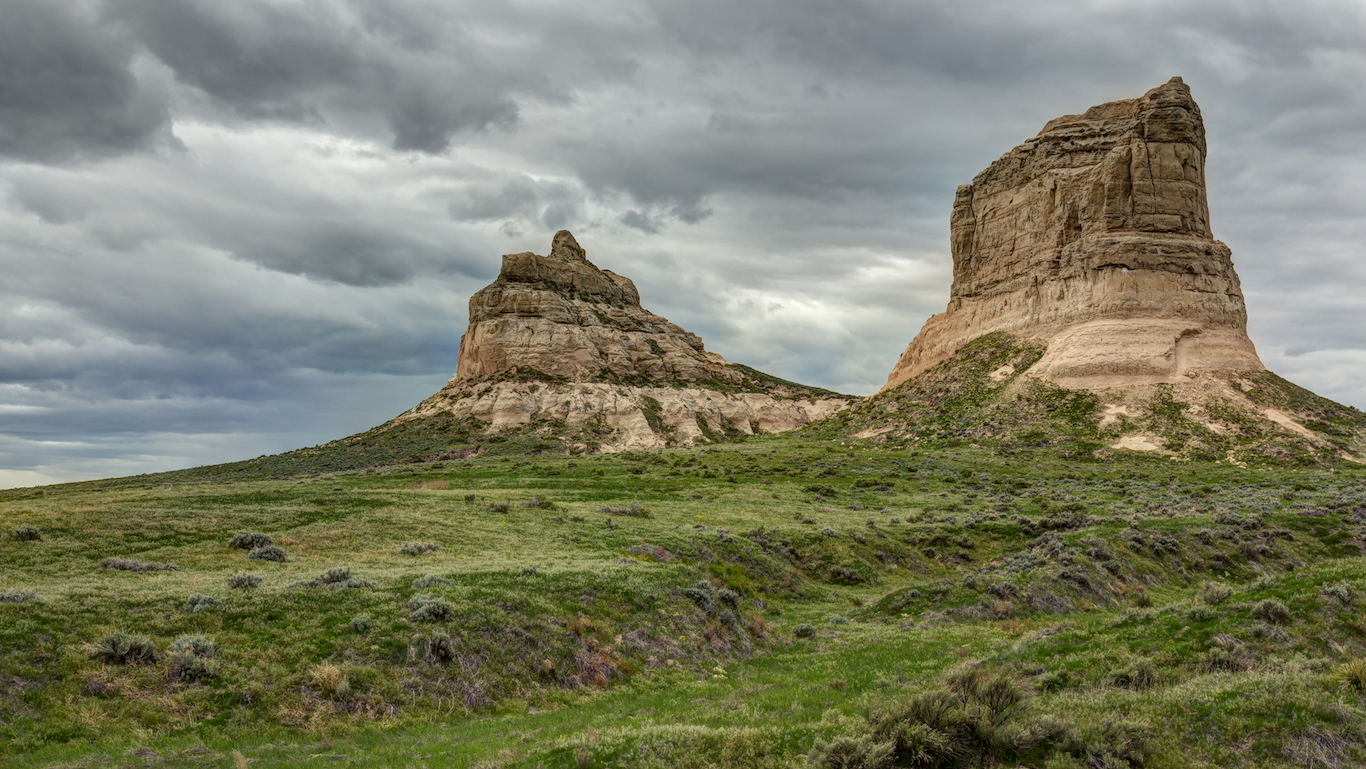
21. Nebraska
> Pct. of commuters getting to work by bike, walking, or public transit: 13.6% (12th lowest)
> Average Daily particle pollution: 8.2 micrograms
> Renewable Energy Consumption as a Share of State Total (%) 37.1% (10th highest)
[in-text-ad]

22. Iowa
> Pct. of commuters getting to work by bike, walking, or public transit: 14.0% (16th lowest)
> Average Daily particle pollution: 9.6 micrograms
> Renewable Energy Consumption as a Share of State Total (%) 58.5% (6th highest)
[recirclink id=444046]

23. New Hampshire
> Pct. of commuters getting to work by bike, walking, or public transit: 14.0% (16th lowest)
> Average Daily particle pollution: 7.8 micrograms
> Renewable Energy Consumption as a Share of State Total (%) 38.7% (9th highest)

24. Kansas
> Pct. of commuters getting to work by bike, walking, or public transit: 13.4% (10th lowest)
> Average Daily particle pollution: 8.5 micrograms
> Renewable Energy Consumption as a Share of State Total (%) 25.6% (14th highest)
[in-text-ad-2]
25. Rhode Island
> Pct. of commuters getting to work by bike, walking, or public transit: 15.5% (22nd highest)
> Average Daily particle pollution: 7.6 micrograms
> Renewable Energy Consumption as a Share of State Total (%) 1.9% (4th lowest)
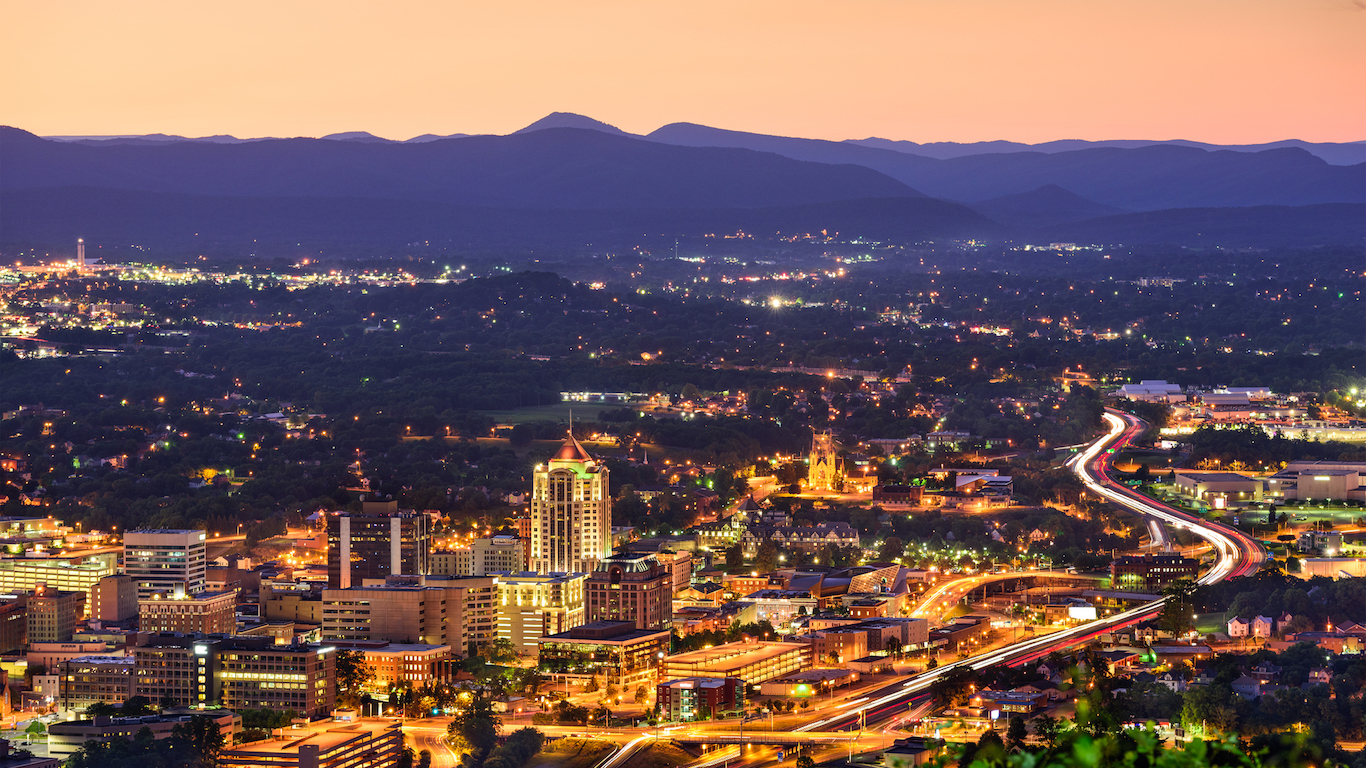
26. Virginia
> Pct. of commuters getting to work by bike, walking, or public transit: 18.0% (12th highest)
> Average Daily particle pollution: 8.7 micrograms
> Renewable Energy Consumption as a Share of State Total (%) 9.6% (20th lowest)
[in-text-ad]

27. Georgia
> Pct. of commuters getting to work by bike, walking, or public transit: 15.0% (23rd highest)
> Average Daily particle pollution: 10.1 micrograms
> Renewable Energy Consumption as a Share of State Total (%) 17.8% (20th highest)
[recirclink id=443940]

28. North Carolina
> Pct. of commuters getting to work by bike, walking, or public transit: 13.2% (8th lowest)
> Average Daily particle pollution: 9.1
> Renewable Energy Consumption as a Share of State Total (%) 12.2% (23rd lowest)

29. Wisconsin
> Pct. of commuters getting to work by bike, walking, or public transit: 14.5% (19th lowest)
> Average Daily particle pollution: 9.3 micrograms
> Renewable Energy Consumption as a Share of State Total (%) 15.5% (23rd highest)
[in-text-ad-2]
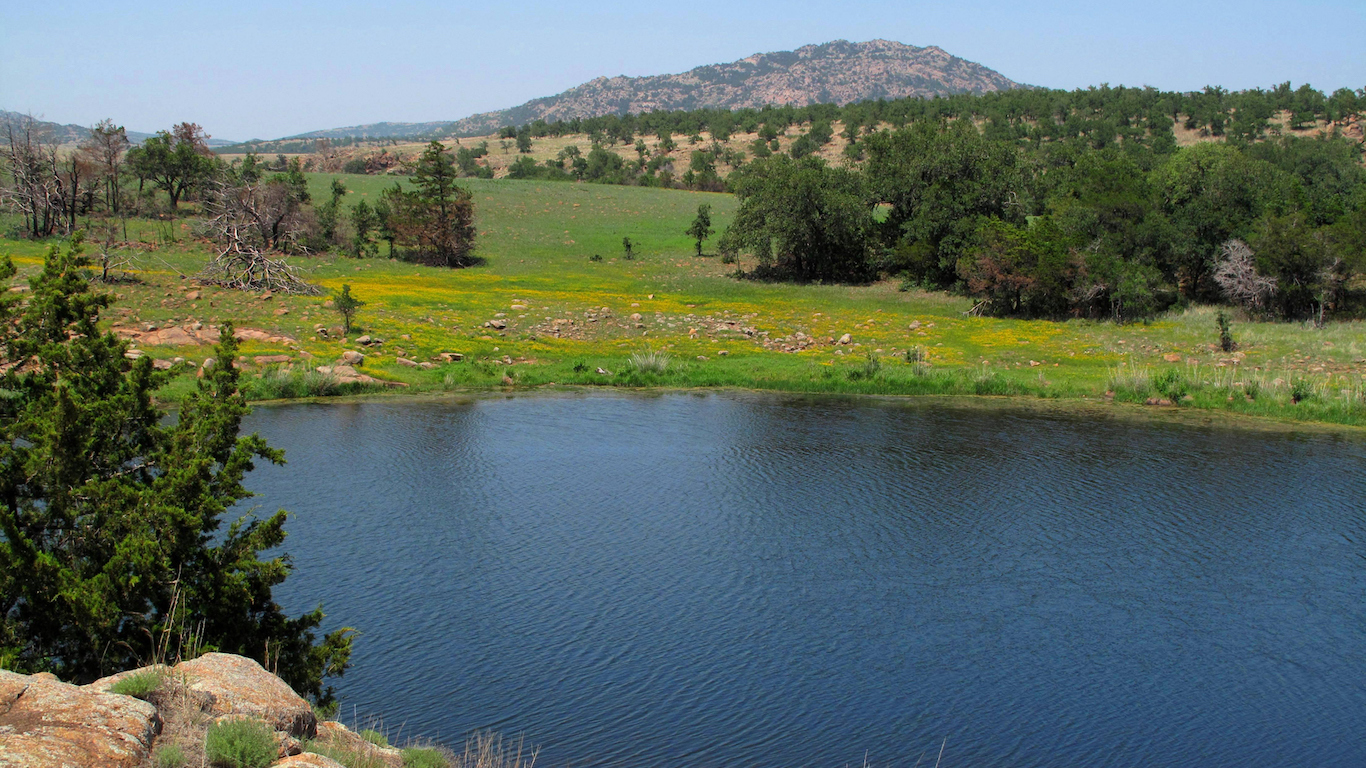
30. Oklahoma
> Pct. of commuters getting to work by bike, walking, or public transit: 13.1% (6th lowest)
> Average Daily particle pollution: 9.2 micrograms
> Renewable Energy Consumption as a Share of State Total (%) 21.8% (16th highest)
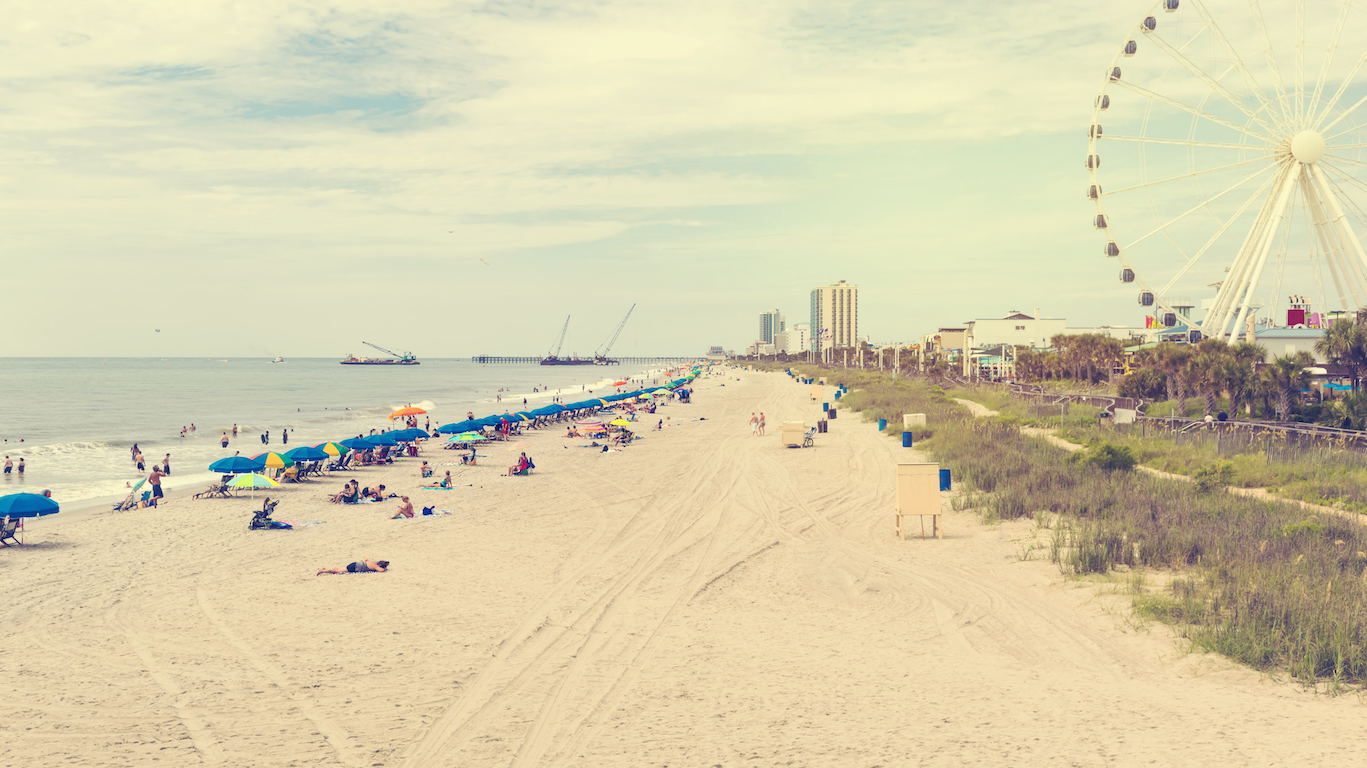
31. South Carolina
> Pct. of commuters getting to work by bike, walking, or public transit: 13.4% (10th lowest)
> Average Daily particle pollution: 9.7 micrograms
> Renewable Energy Consumption as a Share of State Total (%) 13.6% (25th lowest)
[in-text-ad]

32. Texas
> Pct. of commuters getting to work by bike, walking, or public transit: 14.6% (23rd lowest)
> Average Daily particle pollution: 8.0 micrograms
> Renewable Energy Consumption as a Share of State Total (%) 5.4% (9th lowest)
[recirclink id=443564]
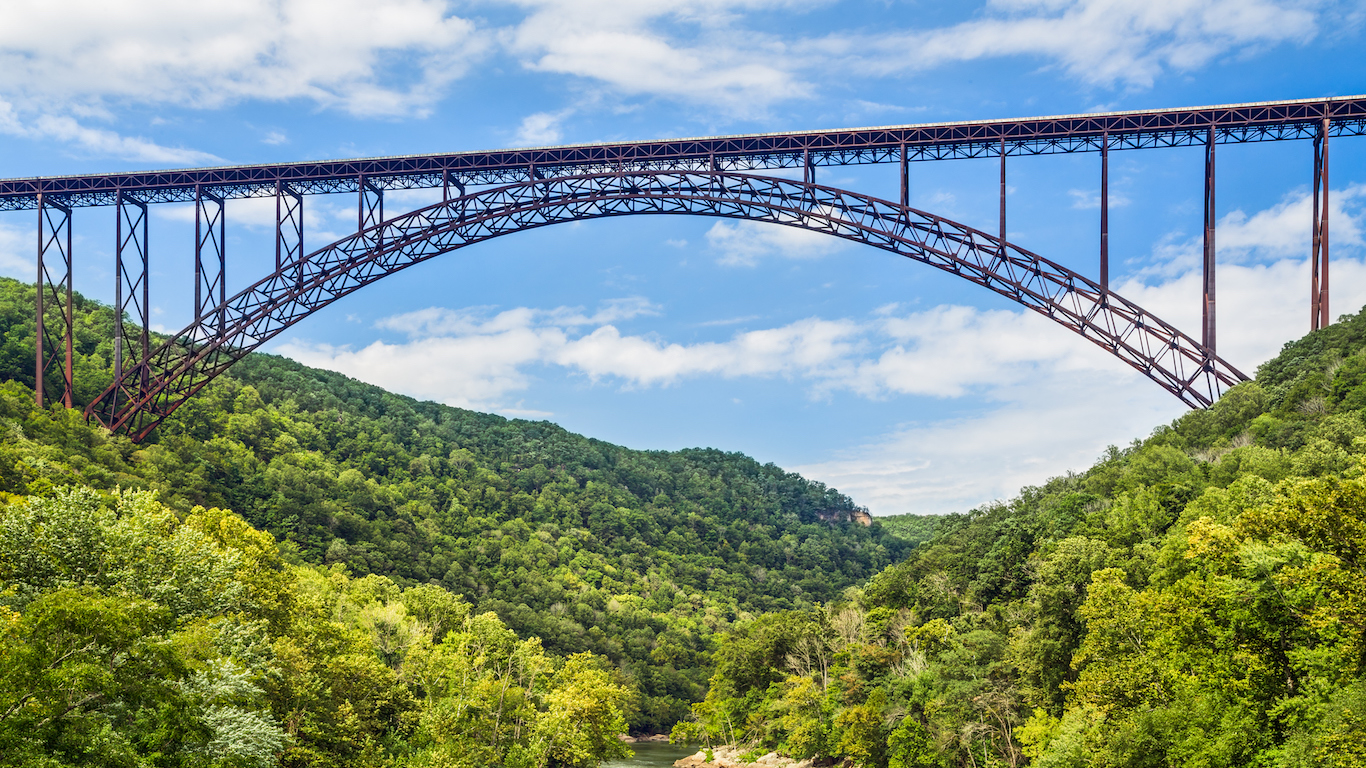
33. West Virginia
> Pct. of commuters getting to work by bike, walking, or public transit: 14.4% (18th lowest)
> Average Daily particle pollution: 9.5 micrograms
> Renewable Energy Consumption as a Share of State Total (%) 9.2% (19th lowest)

34. Michigan
> Pct. of commuters getting to work by bike, walking, or public transit: 13.6% (12th lowest)
> Average Daily particle pollution: 8.7 micrograms
> Renewable Energy Consumption as a Share of State Total (%) 10.6% (22nd lowest)
[in-text-ad-2]

35. Kentucky
> Pct. of commuters getting to work by bike, walking, or public transit: 14.0% (16th lowest)
> Average Daily particle pollution: 10.0 micrograms
> Renewable Energy Consumption as a Share of State Total (%) 5.4% (9th lowest)

36. Tennessee
> Pct. of commuters getting to work by bike, walking, or public transit: 11.8% (2nd lowest)
> Average Daily particle pollution: 9.7 micrograms
> Renewable Energy Consumption as a Share of State Total (%) 13.8% (25th highest)
[in-text-ad]

37. Louisiana
> Pct. of commuters getting to work by bike, walking, or public transit: 14.2% (17th lowest)
> Average Daily particle pollution: 9.5 micrograms
> Renewable Energy Consumption as a Share of State Total (%) 1.6% (3rd lowest)
[recirclink id=443882]
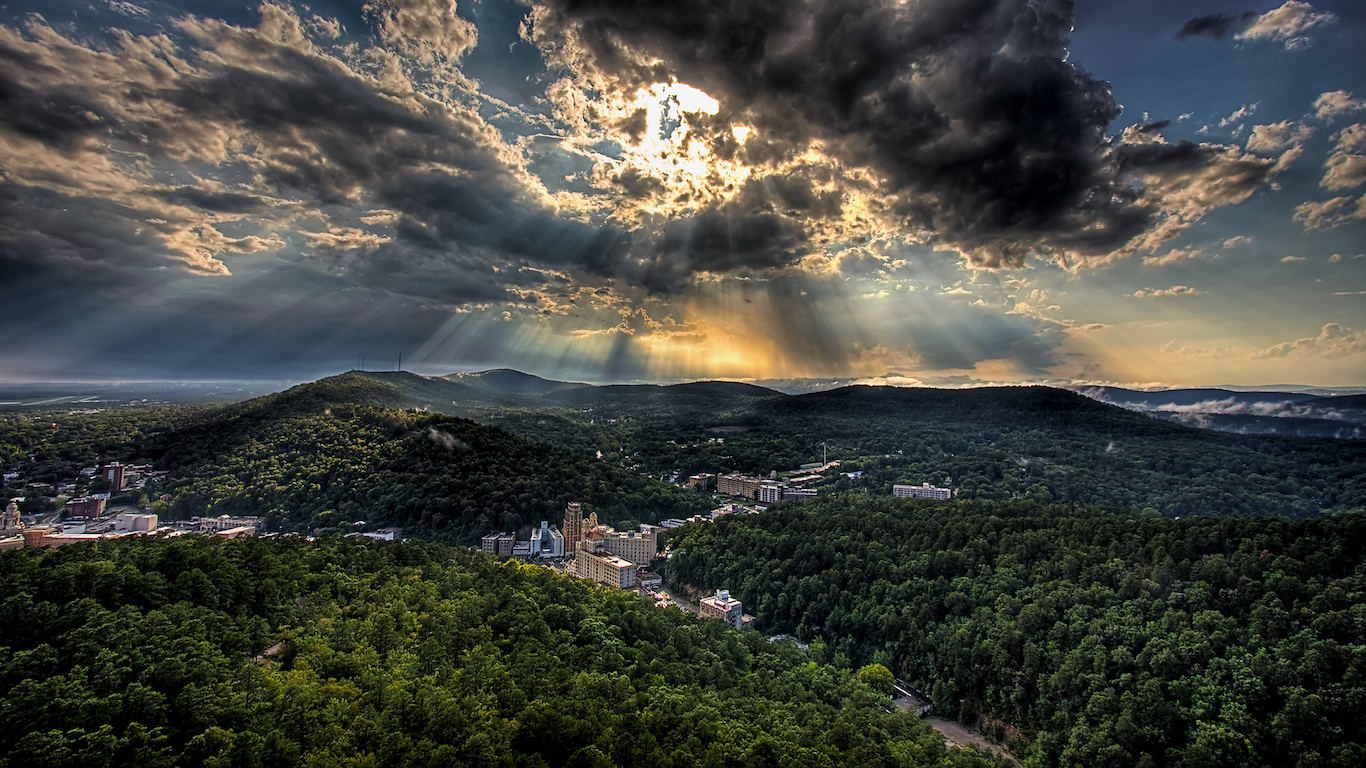
38. Arkansas
> Pct. of commuters getting to work by bike, walking, or public transit: 13.7% (13th lowest)
> Average Daily particle pollution: 10.1 micrograms
> Renewable Energy Consumption as a Share of State Total (%) 20.4% (17th highest)

39. Mississippi
> Pct. of commuters getting to work by bike, walking, or public transit: 13.2% (8th lowest)
> Average Daily particle pollution: 9.5 micrograms
> Renewable Energy Consumption as a Share of State Total (%) 8.5% (17th lowest)
[in-text-ad-2]
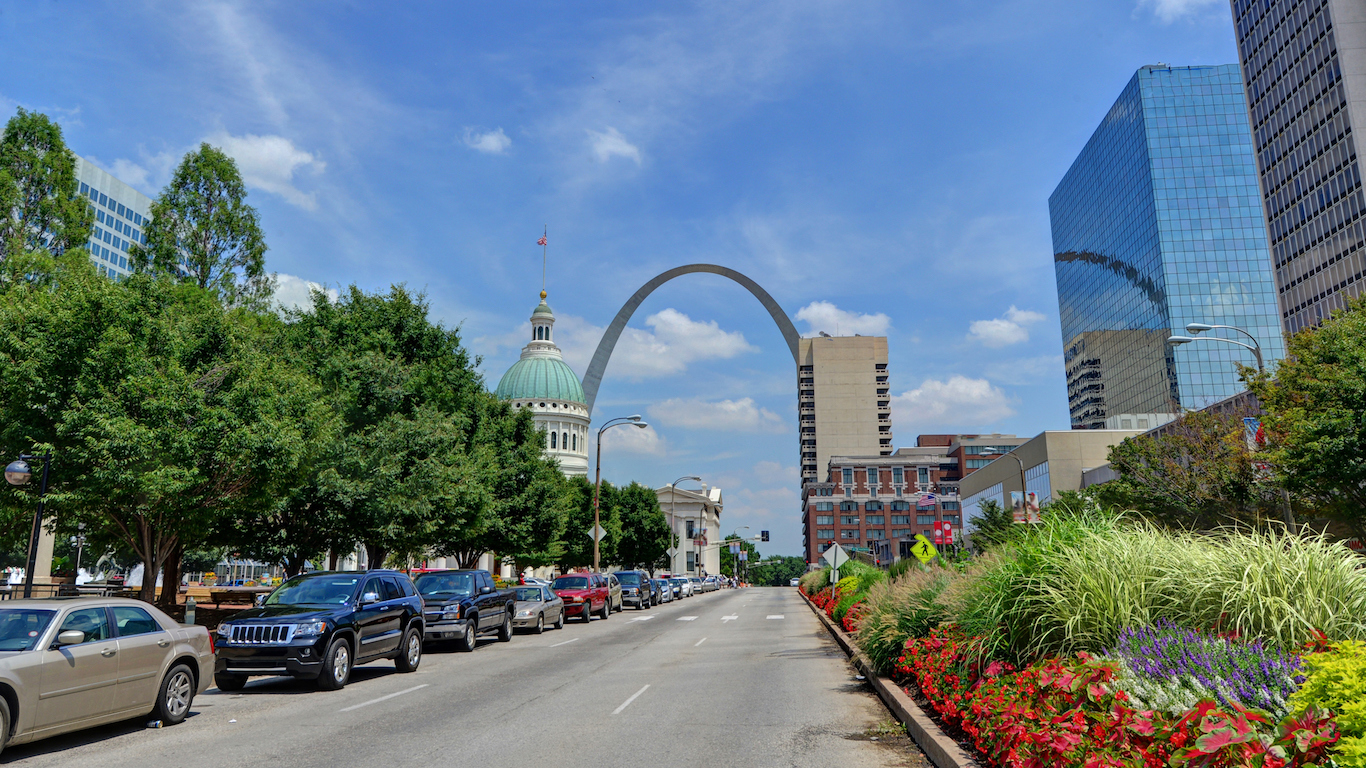
40. Missouri
> Pct. of commuters getting to work by bike, walking, or public transit: 13.1% (6th lowest)
> Average Daily particle pollution: 9.5 micrograms
> Renewable Energy Consumption as a Share of State Total (%) 5.9% (11th lowest)

41. New Jersey
> Pct. of commuters getting to work by bike, walking, or public transit: 24.9% (4th highest)
> Average Daily particle pollution: 9.8 micrograms
> Renewable Energy Consumption as a Share of State Total (%) 2.1% (5th lowest)
[in-text-ad]
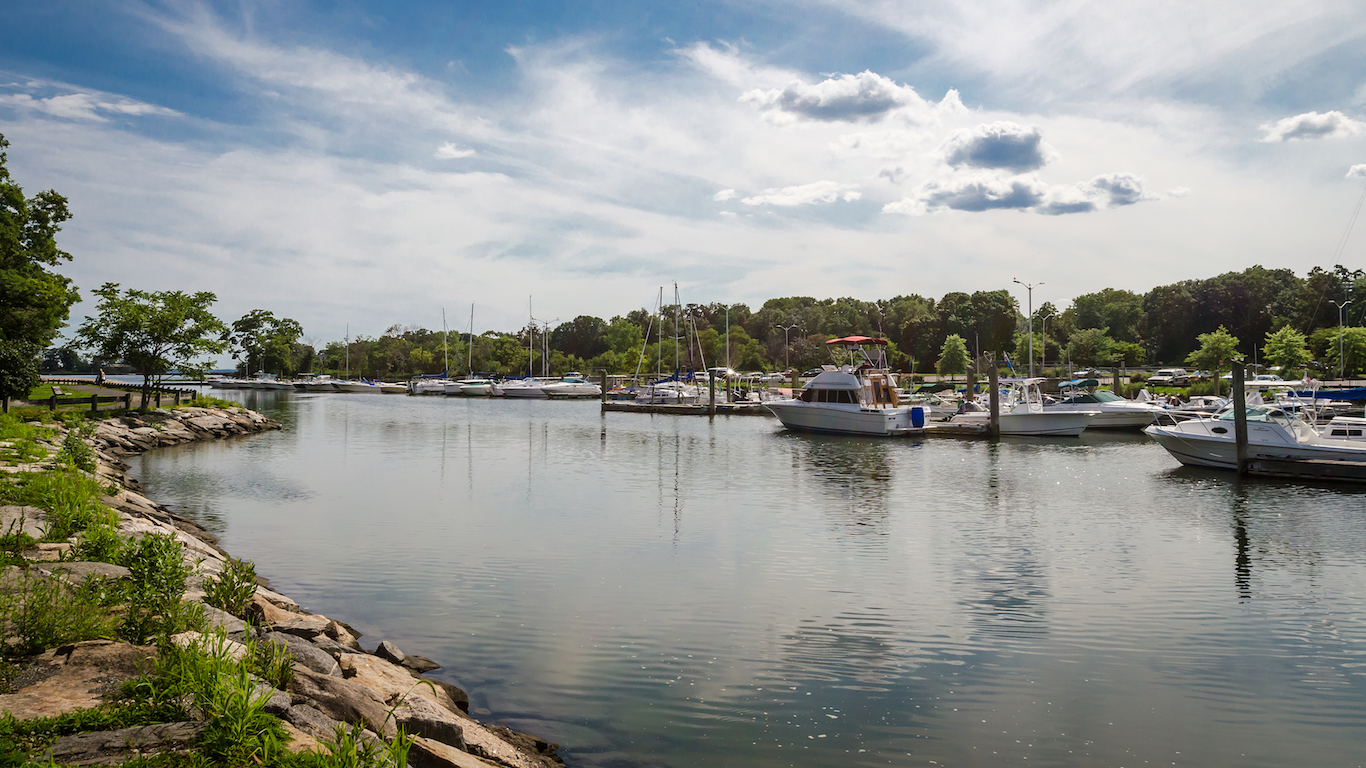
42. Connecticut
> Pct. of commuters getting to work by bike, walking, or public transit: 17.0% (19th highest)
> Average Daily particle pollution: 8.2 micrograms
> Renewable Energy Consumption as a Share of State Total (%) 6.1% (13th lowest)
[recirclink id=443620]
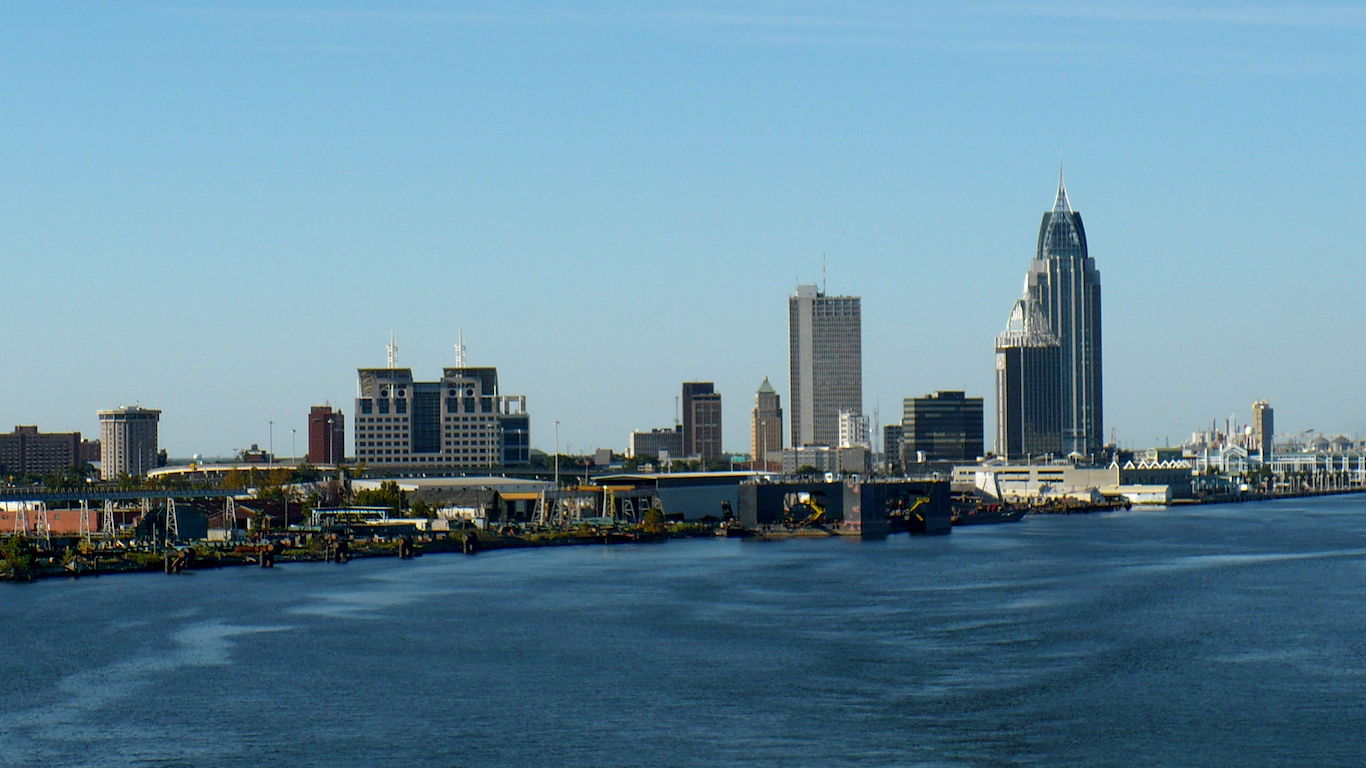
43. Alabama
> Pct. of commuters getting to work by bike, walking, or public transit: 10.5% (the lowest)
> Average Daily particle pollution: 10.1 micrograms
> Renewable Energy Consumption as a Share of State Total (%) 26.8% (13th highest)

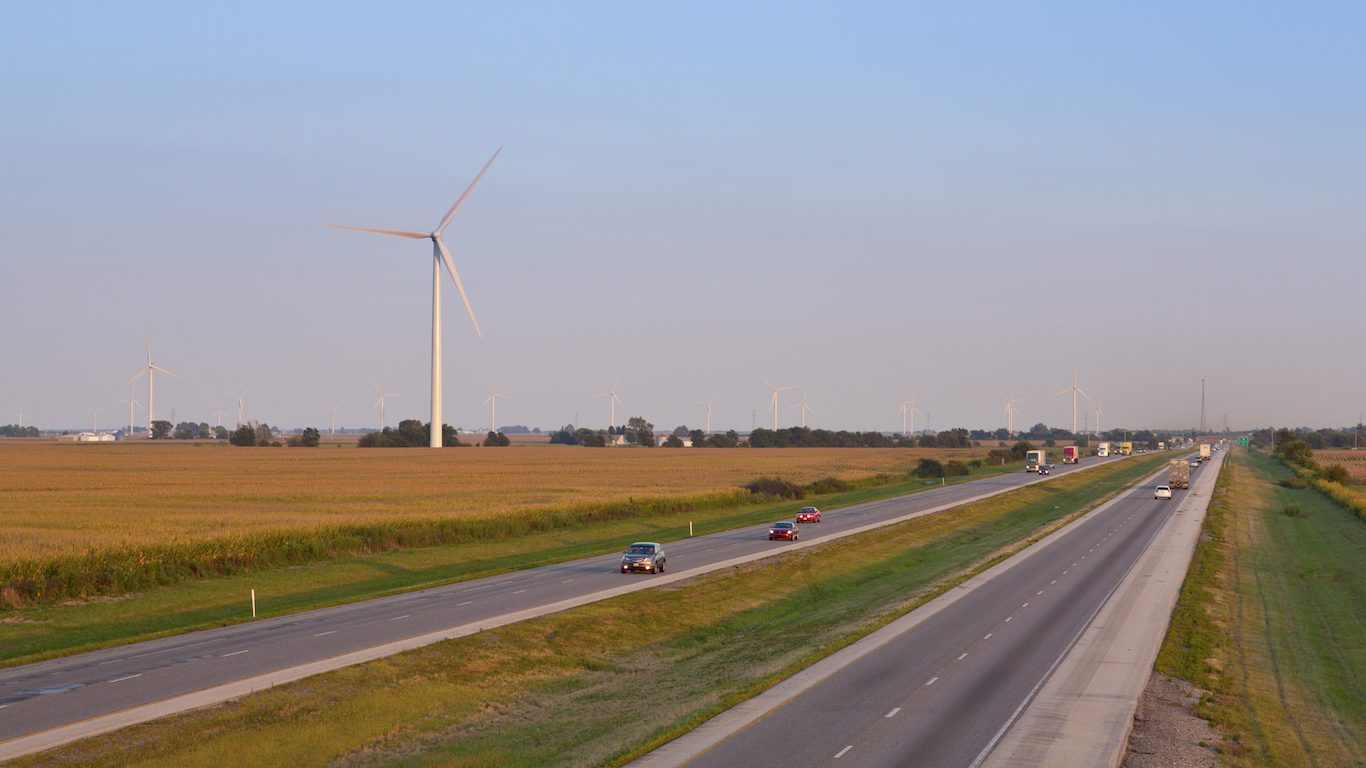
44. Illinois
> Pct. of commuters getting to work by bike, walking, or public transit: 22.0% (7th highest)
> Average Daily particle pollution: 10.5 micrograms
> Renewable Energy Consumption as a Share of State Total (%) 8.5% (17th lowest)
[in-text-ad-2]
45. Delaware
> Pct. of commuters getting to work by bike, walking, or public transit: 14.6% (20th lowest)
> Average Daily particle pollution: 9.0 micrograms
> Renewable Energy Consumption as a Share of State Total (%) 0.0% (the lowest)
46. Indiana
> Pct. of commuters getting to work by bike, walking, or public transit: 12.9% (4th lowest)
> Average Daily particle pollution: 11.1 micrograms
> Renewable Energy Consumption as a Share of State Total (%) 7.3% (15th lowest)
[in-text-ad]
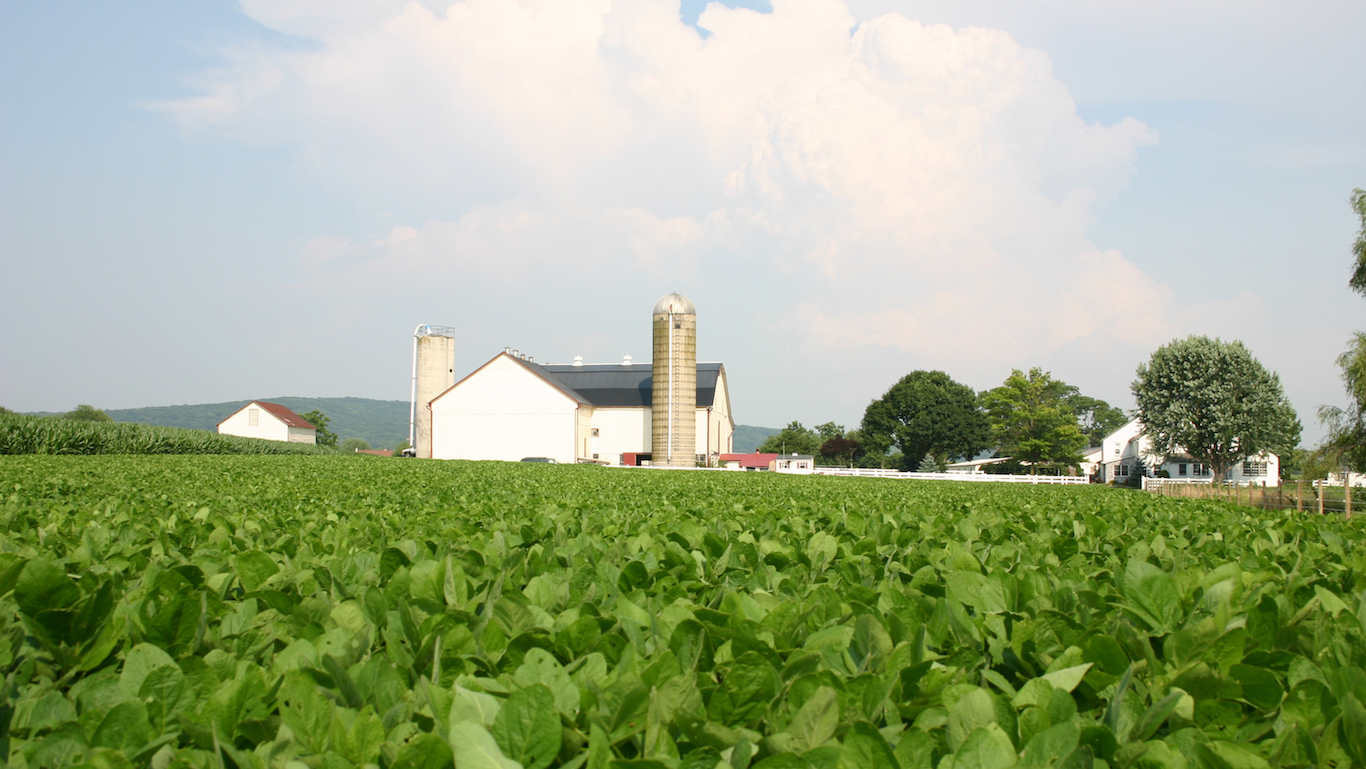
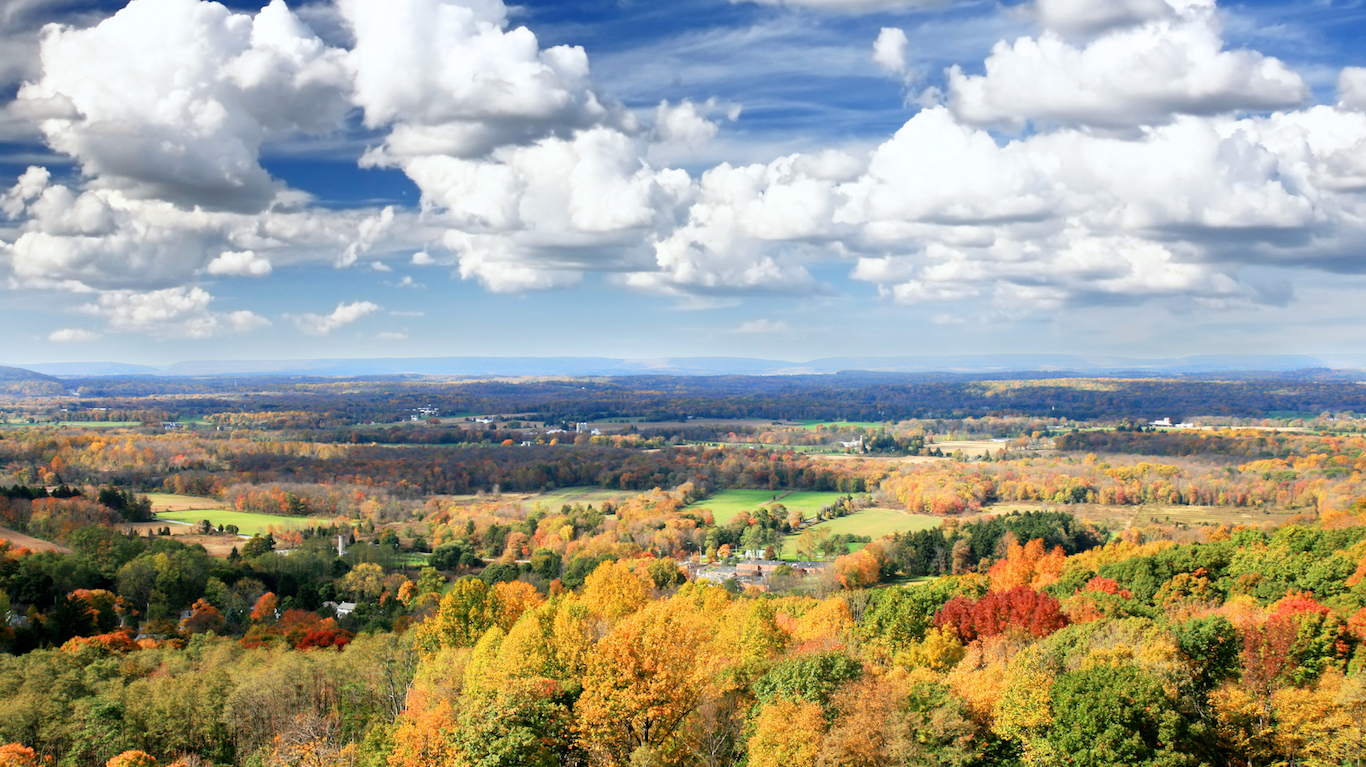
47. Pennsylvania
> Pct. of commuters getting to work by bike, walking, or public transit: 19.1% (11th highest)
> Average Daily particle pollution: 10.4 micrograms
> Renewable Energy Consumption as a Share of State Total (%) 5.6% (10th lowest)
[recirclink id=443575]
48. Maryland
> Pct. of commuters getting to work by bike, walking, or public transit: 21.5% (8th highest)
> Average Daily particle pollution: 9.5 micrograms
> Renewable Energy Consumption as a Share of State Total (%) 6.1% (13th lowest)

49. Ohio
> Pct. of commuters getting to work by bike, walking, or public transit: 12.6% (3rd lowest)
> Average Daily particle pollution: 11.3 micrograms
> Renewable Energy Consumption as a Share of State Total (%) 2.3% (6th lowest)
[in-text-ad-2]

50. California
> Pct. of commuters getting to work by bike, walking, or public transit: 20.6% (10th highest)
> Average Daily particle pollution: 8.0 micrograms
> Renewable Energy Consumption as a Share of State Total (%) 19.7% (18th highest)
Methodology
To identify the most and least environmentally friendly states, 24/7 Wall St. created an index based on the following measures: prevalence of “green” transportation in commuting to work, average daily PM 2.5 (presence of fine particulate matter less than or equal to 2.5 microns across), the percentage of counties within a state with an average daily PM 2.5 greater than 12, consumption of renewable energy, and the population living in non attainment zones for sulfur dioxide, lead, PM 2.5, and 8-hour ozone.
Green transportation is classified as carpooling, using public transportation, walking, biking, and those who work from home, and this data comes from the U.S Census Bureau’s American Community Survey for 2016. Average daily PM 2.5 and the percent of counties with an average PM 2.5 greater than 12 comes from the County Health Rankings. Renewable energy consumption as a percentage of total energy consumption comes from the Energy Information Administration (EIA) and is for 2015, the most recent year available.
Data on non attainment areas (an area that is not meeting the standards for air quality set forth by the Clean Air Act) comes from the Environmental Protection Agency (EPA)’s Greenbook, and is current as of March 31, 2018. It is worth noting that an area that is classified as “non-attainment” is required by the Clean Air Act to immediately take steps to improve the quality of the air. As such, updates to the attainment status of an area may have changed in the time since the Greenbook was last updated, or an area may be in the process of working with the EPA to have their attainment status formally changed, which takes around a year to complete. Population estimates for non attainment areas are from the 2010 census.