Special Report
States Investing the Most in Higher Education

Published:
Last Updated:

Last year, states spent over $83 billion on public higher education, or about $7,600 per student enrolled full-time in a public college or university.
Since the early 20th century, every state in the country has required public school systems to provide free K-12 education for its students. When it comes to higher education, states have different priorities. While some spend more than $15,000 per student to ensure in-state students can get a college education, others spend less than $3,000.
To fund higher education, states must include provisions in their tax policy and budgets to determine where the money is coming from and how it is spent — on financial aid, administrative support, and so on. The needs of the population and the political climate play a role in these decisions. Many states with high spending per student tend to spend more to fund public postsecondary institutions and charge less in tuition, while other states have adopted a model similar to private institutions — less public funding and higher tuition. To identify the states spending the most and least on higher education, 24/7 Wall St. reviewed per-student public higher education spending from The State Higher Education Executive Officers’ report, “State Higher Education Finance: FY 2017.”
Andy Carlson, vice president of finance policy and member services at SHEEO, the national governing body of state higher education bodies, told 24/7 Wall St. that states are increasingly taking spending on higher education seriously, largely because projected advances in technology make it increasingly important. “Having a high school diploma is not going to be sufficient in getting a middle-class existence and holding down a job that lets you support a family.”
Click here to see the states investing the most in higher education.
Click here to see our detailed findings and methodology.
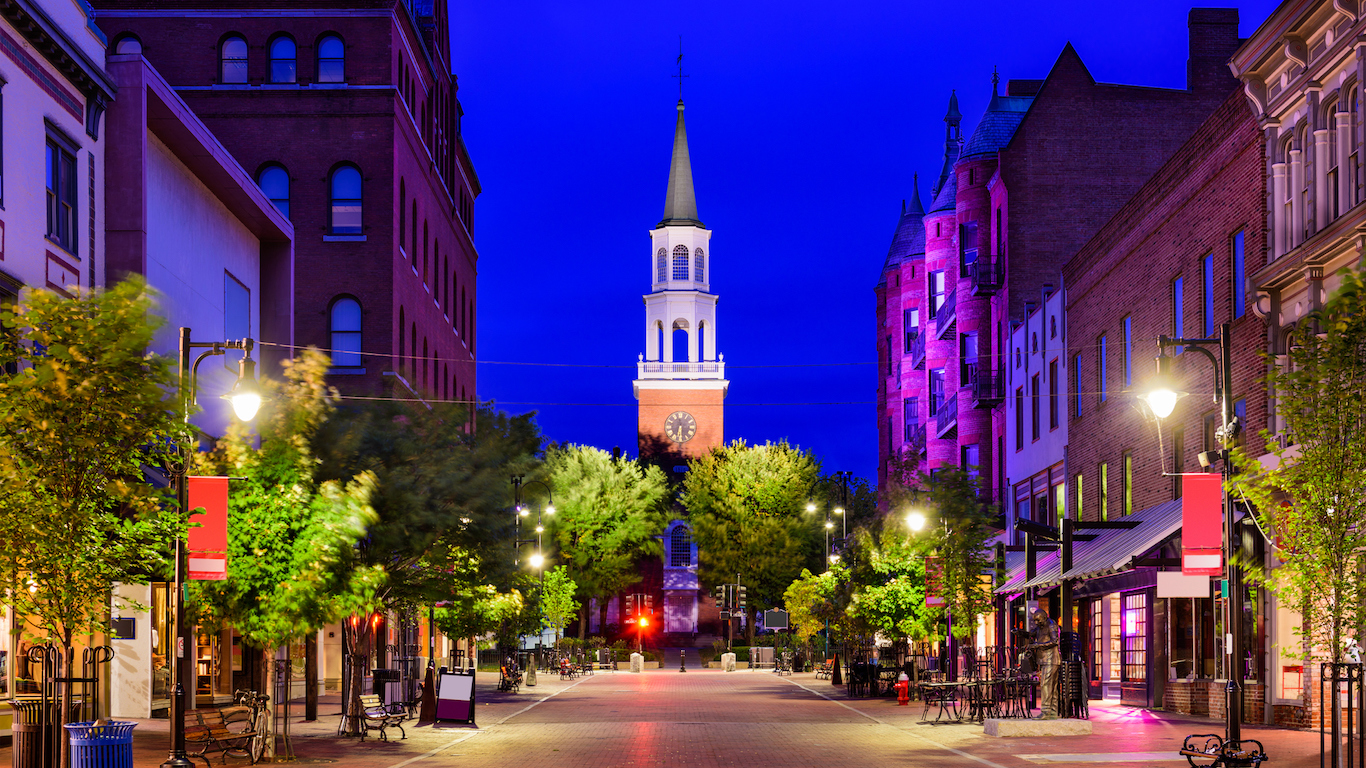
50. Vermont
> Annual public higher ed. spending per student: $2,695
> 2017 public college enrollment: 20,782
> # of state colleges + universities: 6 (4th fewest)
> Tuition revenue per student: $14,732 (2nd highest)
> Adults with at least a bachelor’s degree: 36.4% (8th highest)
[in-text-ad]
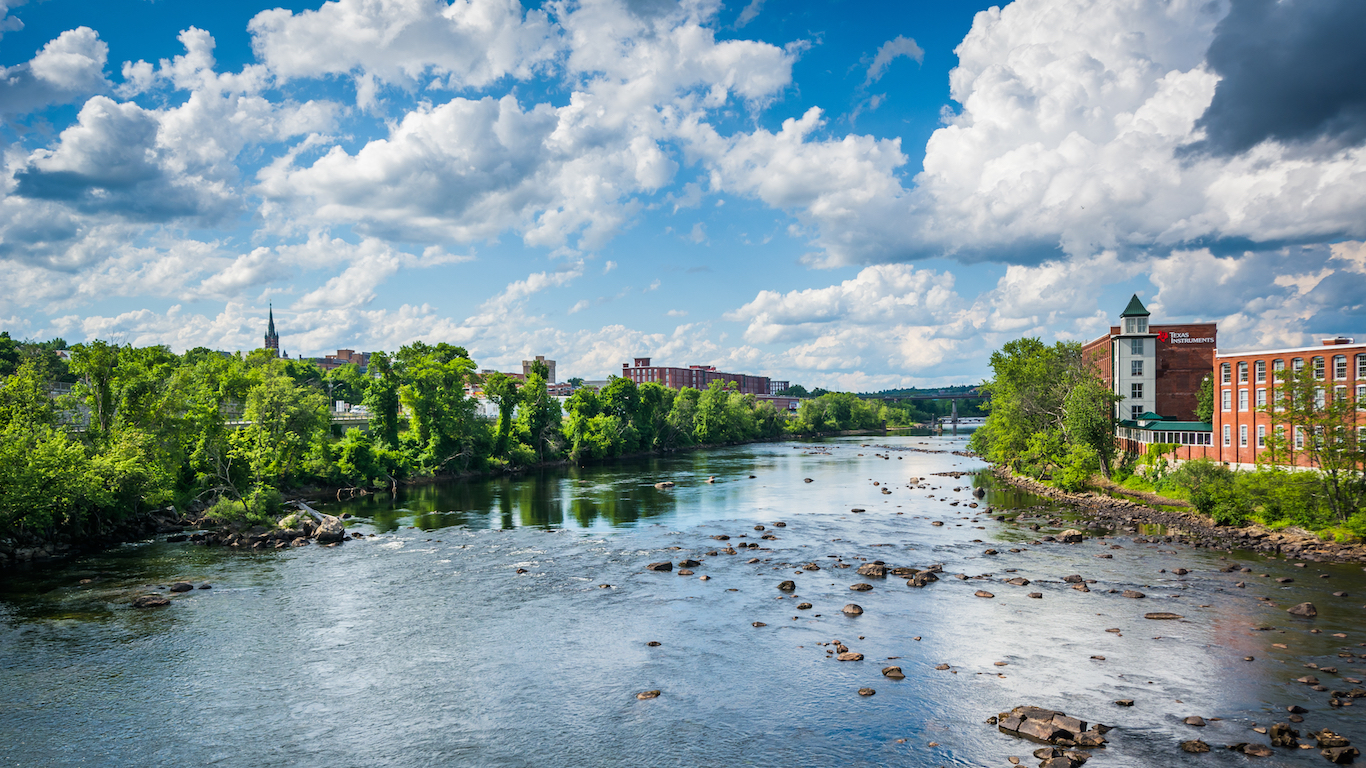
49. New Hampshire
> Annual public higher ed. spending per student: $2,701
> 2017 public college enrollment: 38,156
> # of state colleges + universities: 13 (10th fewest)
> Tuition revenue per student: $10,058 (7th highest)
> Adults with at least a bachelor’s degree: 36.6% (7th highest)

48. Pennsylvania
> Annual public higher ed. spending per student: $4,122
> 2017 public college enrollment: 348,838
> # of state colleges + universities: 94 (5th most)
> Tuition revenue per student: $11,014 (5th highest)
> Adults with at least a bachelor’s degree: 30.8% (22nd highest)

47. Colorado
> Annual public higher ed. spending per student: $4,194
> 2017 public college enrollment: 182,212
> # of state colleges + universities: 32 (25th most)
> Tuition revenue per student: $9,748 (9th highest)
> Adults with at least a bachelor’s degree: 39.9% (2nd highest)
[in-text-ad-2]
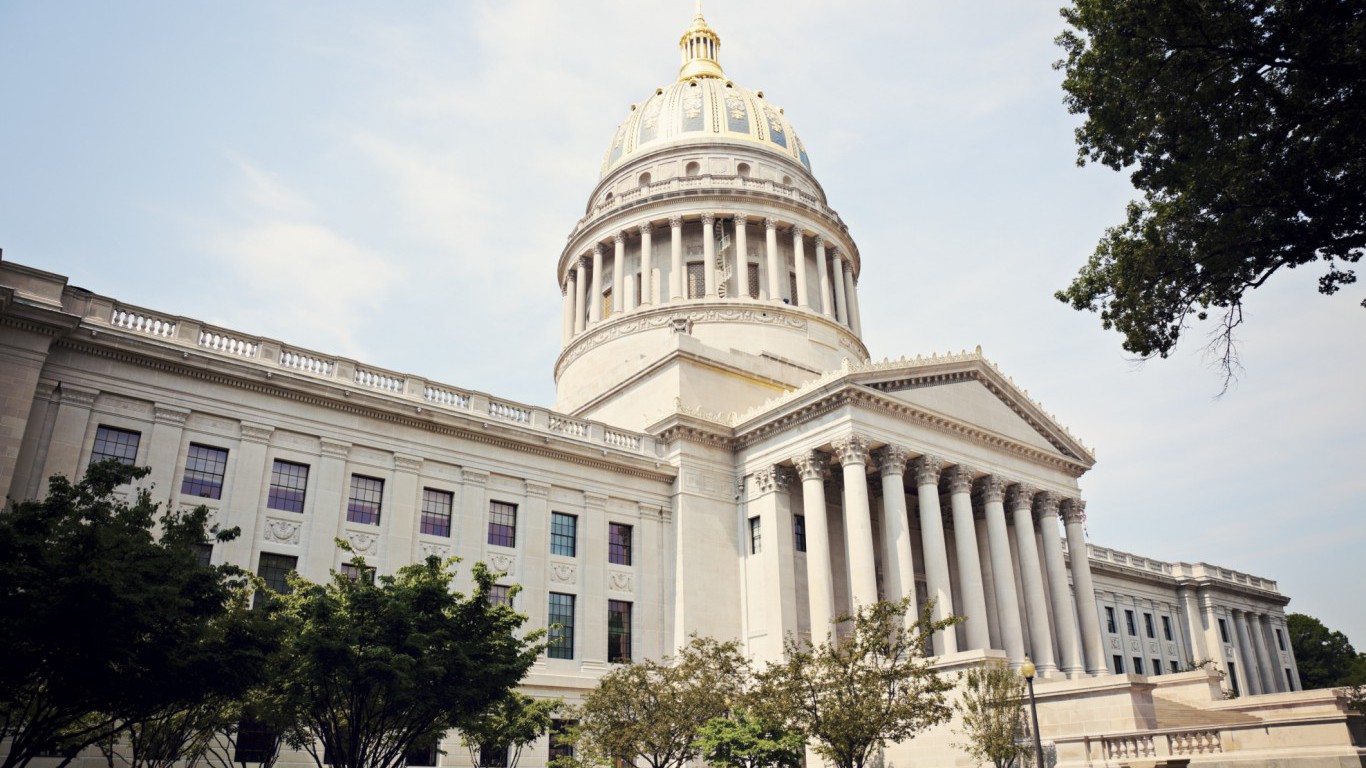
46. West Virginia
> Annual public higher ed. spending per student: $4,781
> 2017 public college enrollment: 69,939
> # of state colleges + universities: 40 (18th most)
> Tuition revenue per student: $7,191 (25th lowest)
> Adults with at least a bachelor’s degree: 20.8% (the lowest)
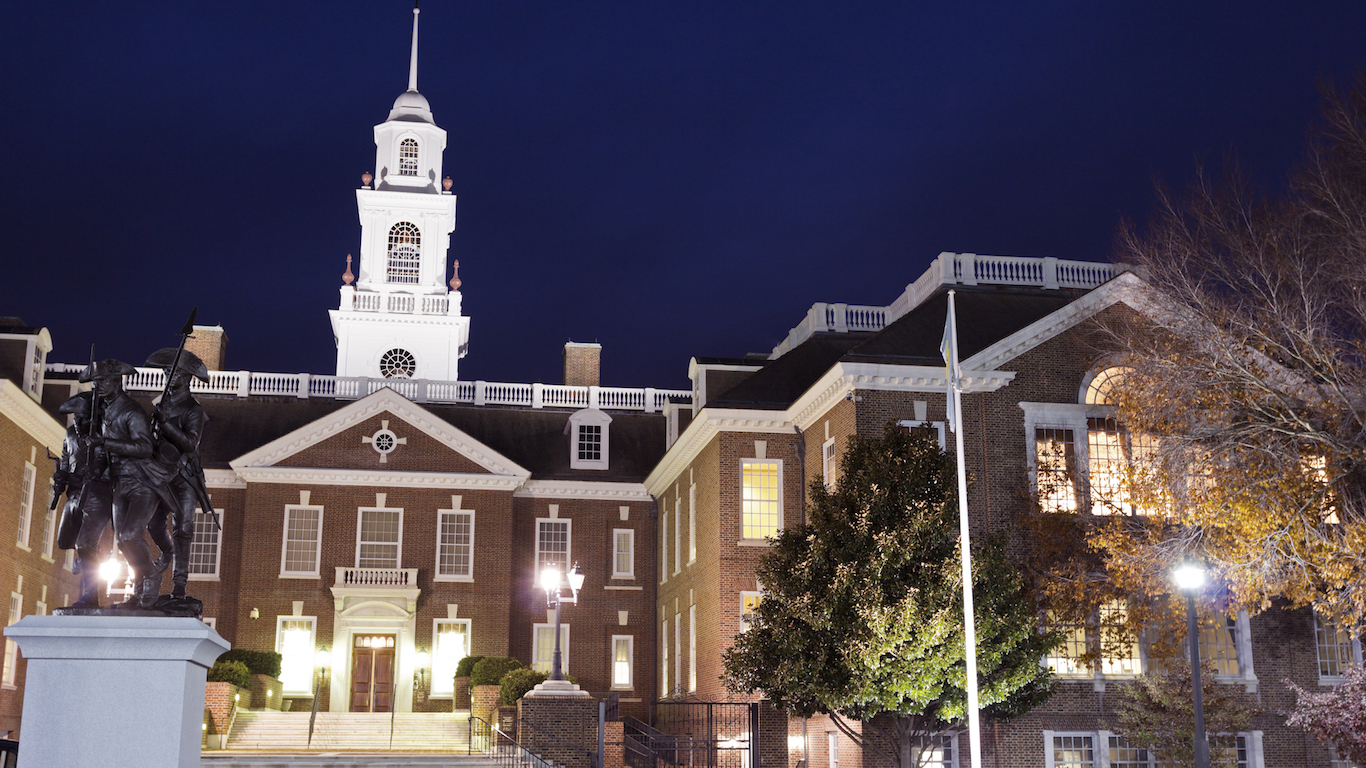
45. Delaware
> Annual public higher ed. spending per student: $4,880
> 2017 public college enrollment: 35,554
> # of state colleges + universities: 3 (2nd fewest)
> Tuition revenue per student: $13,714 (3rd highest)
> Adults with at least a bachelor’s degree: 31.0% (20th highest)
[in-text-ad]
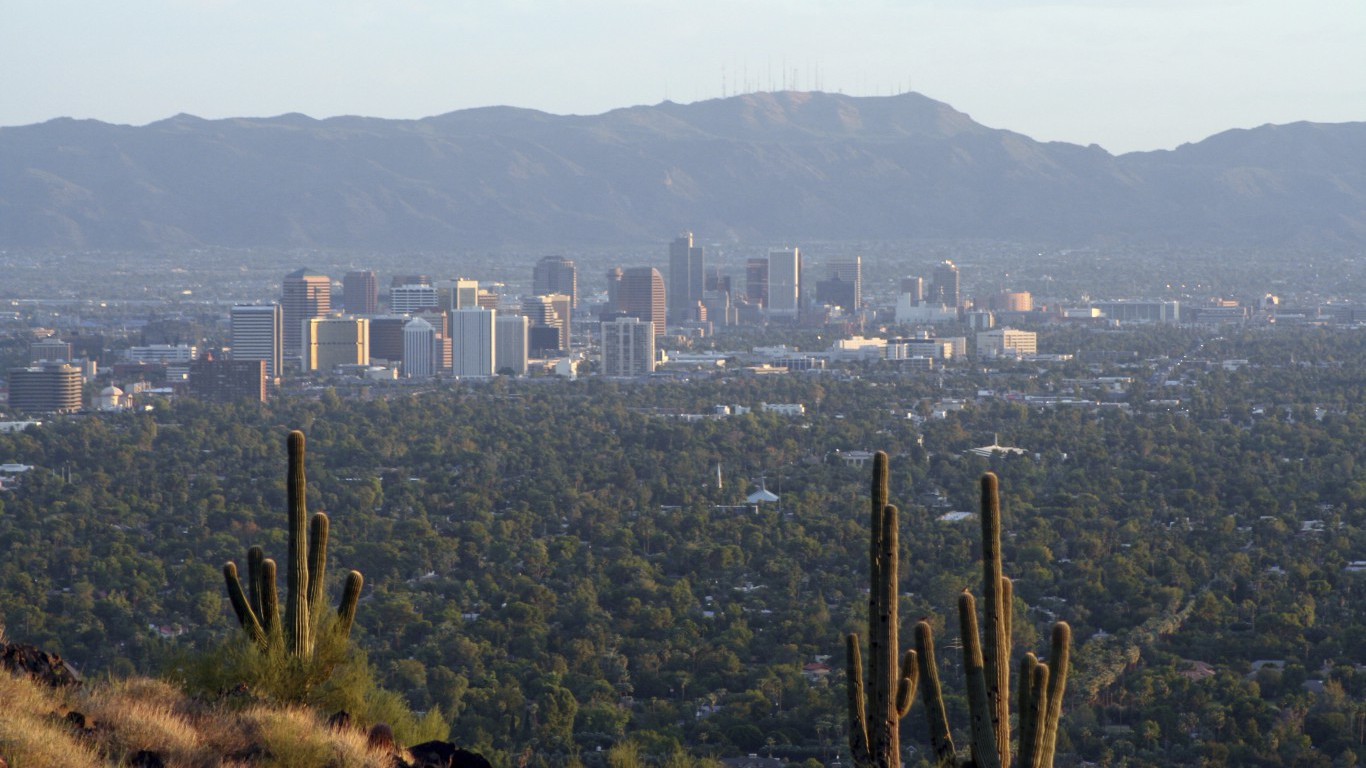
44. Arizona
> Annual public higher ed. spending per student: $4,920
> 2017 public college enrollment: 286,335
> # of state colleges + universities: 33 (24th most)
> Tuition revenue per student: $7,893 (20th highest)
> Adults with at least a bachelor’s degree: 28.9% (22nd lowest)

43. Louisiana
> Annual public higher ed. spending per student: $5,373
> 2017 public college enrollment: 160,057
> # of state colleges + universities: 32 (25th most)
> Tuition revenue per student: $5,660 (15th lowest)
> Adults with at least a bachelor’s degree: 23.4% (5th lowest)

42. Virginia
> Annual public higher ed. spending per student: $5,533
> 2017 public college enrollment: 305,307
> # of state colleges + universities: 45 (14th most)
> Tuition revenue per student: $8,854 (16th highest)
> Adults with at least a bachelor’s degree: 38.1% (6th highest)
[in-text-ad-2]

41. Rhode Island
> Annual public higher ed. spending per student: $5,606
> 2017 public college enrollment: 30,246
> # of state colleges + universities: 3 (2nd fewest)
> Tuition revenue per student: $8,313 (19th highest)
> Adults with at least a bachelor’s degree: 34.1% (12th highest)

40. South Carolina
> Annual public higher ed. spending per student: $5,716
> 2017 public college enrollment: 169,383
> # of state colleges + universities: 34 (22nd most)
> Tuition revenue per student: $9,585 (12th highest)
> Adults with at least a bachelor’s degree: 27.2% (13th lowest)
[in-text-ad]

39. Oregon
> Annual public higher ed. spending per student: $5,959
> 2017 public college enrollment: 142,669
> # of state colleges + universities: 26 (20th fewest)
> Tuition revenue per student: $7,887 (21st highest)
> Adults with at least a bachelor’s degree: 32.7% (16th highest)
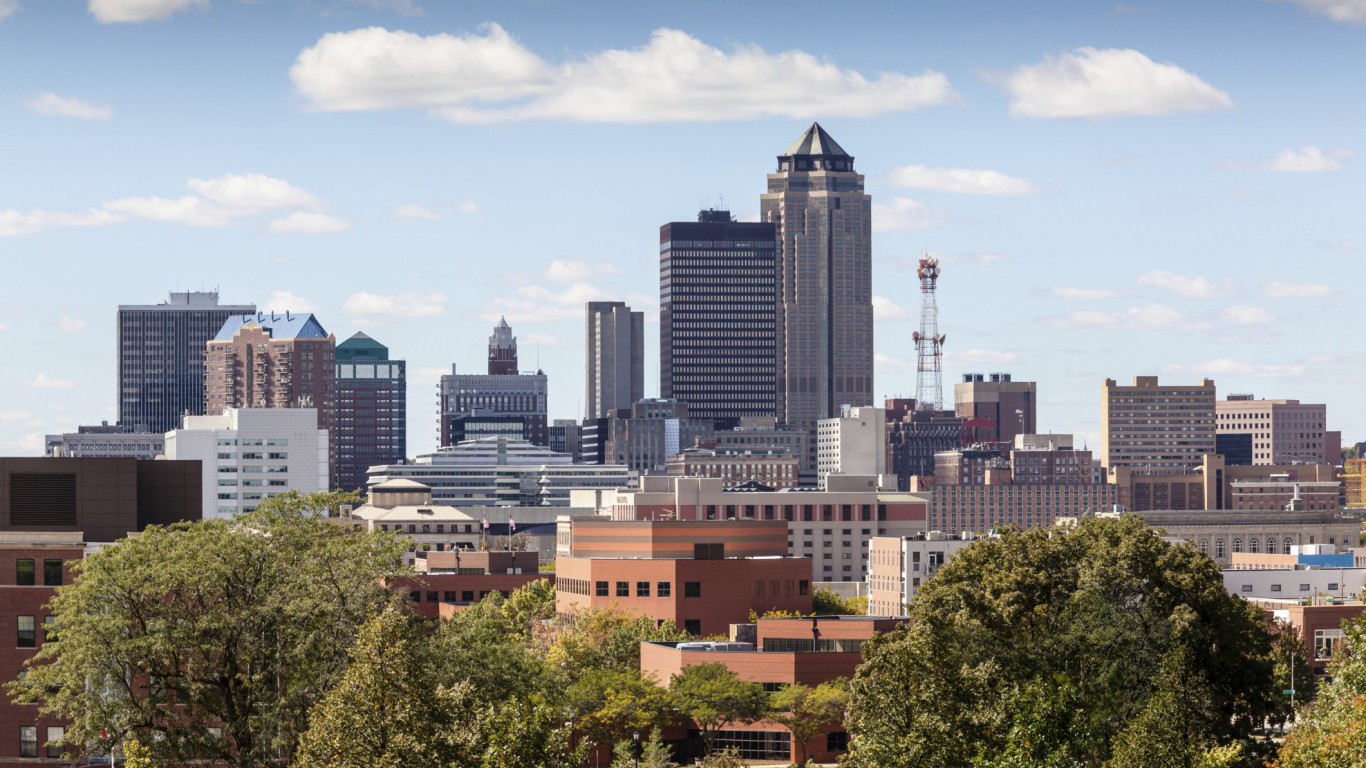
38. Iowa
> Annual public higher ed. spending per student: $5,997
> 2017 public college enrollment: 126,555
> # of state colleges + universities: 19 (17th fewest)
> Tuition revenue per student: $9,632 (10th highest)
> Adults with at least a bachelor’s degree: 28.4% (17th lowest)

37. Ohio
> Annual public higher ed. spending per student: $6,061
> 2017 public college enrollment: 390,840
> # of state colleges + universities: 110 (3rd most)
> Tuition revenue per student: $8,626 (18th highest)
> Adults with at least a bachelor’s degree: 27.5% (14th lowest)
[in-text-ad-2]

36. Kansas
> Annual public higher ed. spending per student: $6,112
> 2017 public college enrollment: 134,716
> # of state colleges + universities: 34 (22nd most)
> Tuition revenue per student: $6,980 (21st lowest)
> Adults with at least a bachelor’s degree: 32.8% (15th highest)
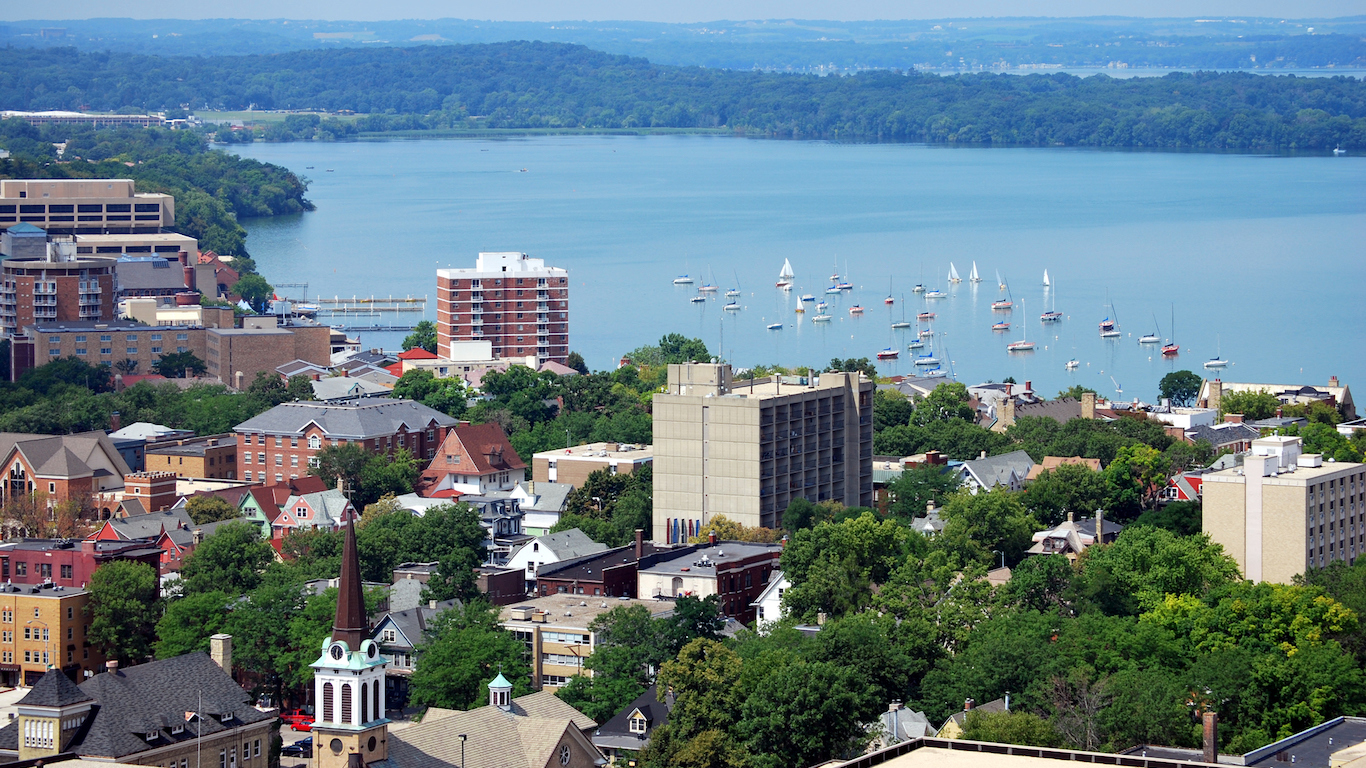
35. Wisconsin
> Annual public higher ed. spending per student: $6,156
> 2017 public college enrollment: 213,143
> # of state colleges + universities: 31 (24th fewest)
> Tuition revenue per student: $6,391 (18th lowest)
> Adults with at least a bachelor’s degree: 29.5% (23rd lowest)
[in-text-ad]

34. Montana
> Annual public higher ed. spending per student: $6,190
> 2017 public college enrollment: 38,076
> # of state colleges + universities: 17 (16th fewest)
> Tuition revenue per student: $7,093 (24th lowest)
> Adults with at least a bachelor’s degree: 31.0% (20th highest)

33. New Jersey
> Annual public higher ed. spending per student: $6,362
> 2017 public college enrollment: 266,194
> # of state colleges + universities: 37 (20th most)
> Tuition revenue per student: $9,601 (11th highest)
> Adults with at least a bachelor’s degree: 38.6% (4th highest)
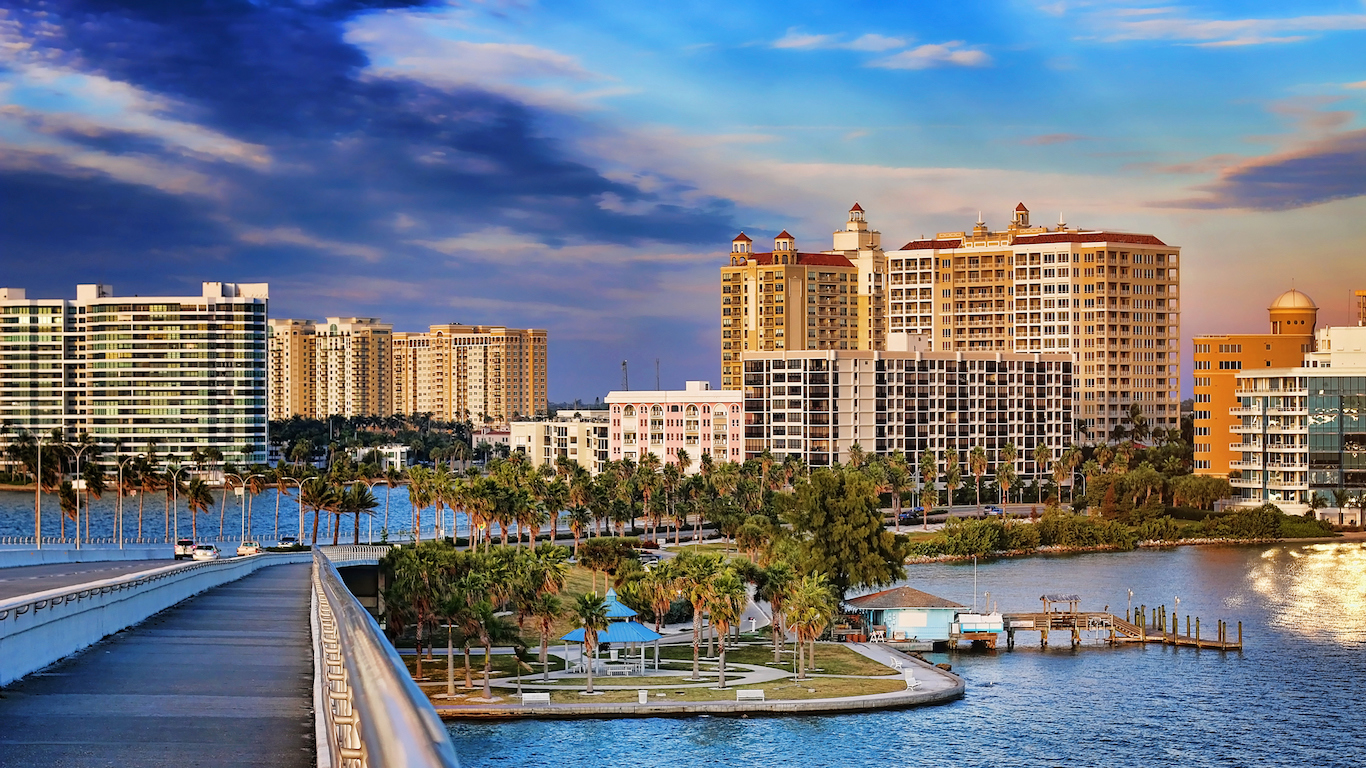
32. Florida
> Annual public higher ed. spending per student: $6,456
> 2017 public college enrollment: 597,293
> # of state colleges + universities: 90 (6th most)
> Tuition revenue per student: $3,257 (3rd lowest)
> Adults with at least a bachelor’s degree: 28.6% (19th lowest)
[in-text-ad-2]
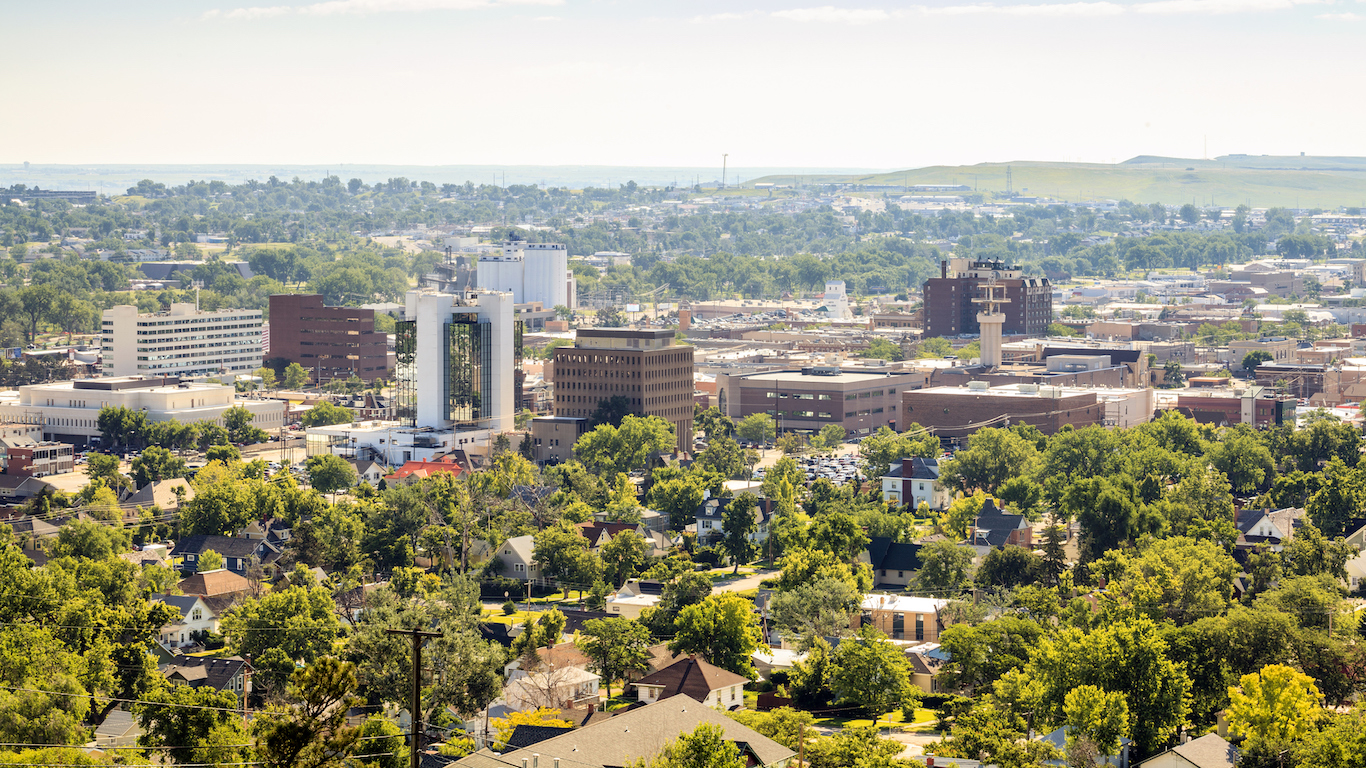
31. South Dakota
> Annual public higher ed. spending per student: $6,488
> 2017 public college enrollment: 31,387
> # of state colleges + universities: 12 (9th fewest)
> Tuition revenue per student: $9,943 (8th highest)
> Adults with at least a bachelor’s degree: 28.9% (22nd lowest)

30. Michigan
> Annual public higher ed. spending per student: $6,508
> 2017 public college enrollment: 378,495
> # of state colleges + universities: 47 (13th most)
> Tuition revenue per student: $14,999 (the highest)
> Adults with at least a bachelor’s degree: 28.3% (16th lowest)
[in-text-ad]

29. Missouri
> Annual public higher ed. spending per student: $6,534
> 2017 public college enrollment: 195,255
> # of state colleges + universities: 50 (11th most)
> Tuition revenue per student: $5,940 (16th lowest)
> Adults with at least a bachelor’s degree: 28.5% (18th lowest)

28. Utah
> Annual public higher ed. spending per student: $6,543
> 2017 public college enrollment: 135,531
> # of state colleges + universities: 16 (15th fewest)
> Tuition revenue per student: $5,615 (14th lowest)
> Adults with at least a bachelor’s degree: 32.6% (17th highest)

27. Oklahoma
> Annual public higher ed. spending per student: $6,585
> 2017 public college enrollment: 133,682
> # of state colleges + universities: 73 (8th most)
> Tuition revenue per student: $7,059 (23rd lowest)
> Adults with at least a bachelor’s degree: 25.2% (8th lowest)
[in-text-ad-2]

26. Alabama
> Annual public higher ed. spending per student: $6,666
> 2017 public college enrollment: 199,786
> # of state colleges + universities: 40 (18th most)
> Tuition revenue per student: $12,161 (4th highest)
> Adults with at least a bachelor’s degree: 24.7% (7th lowest)
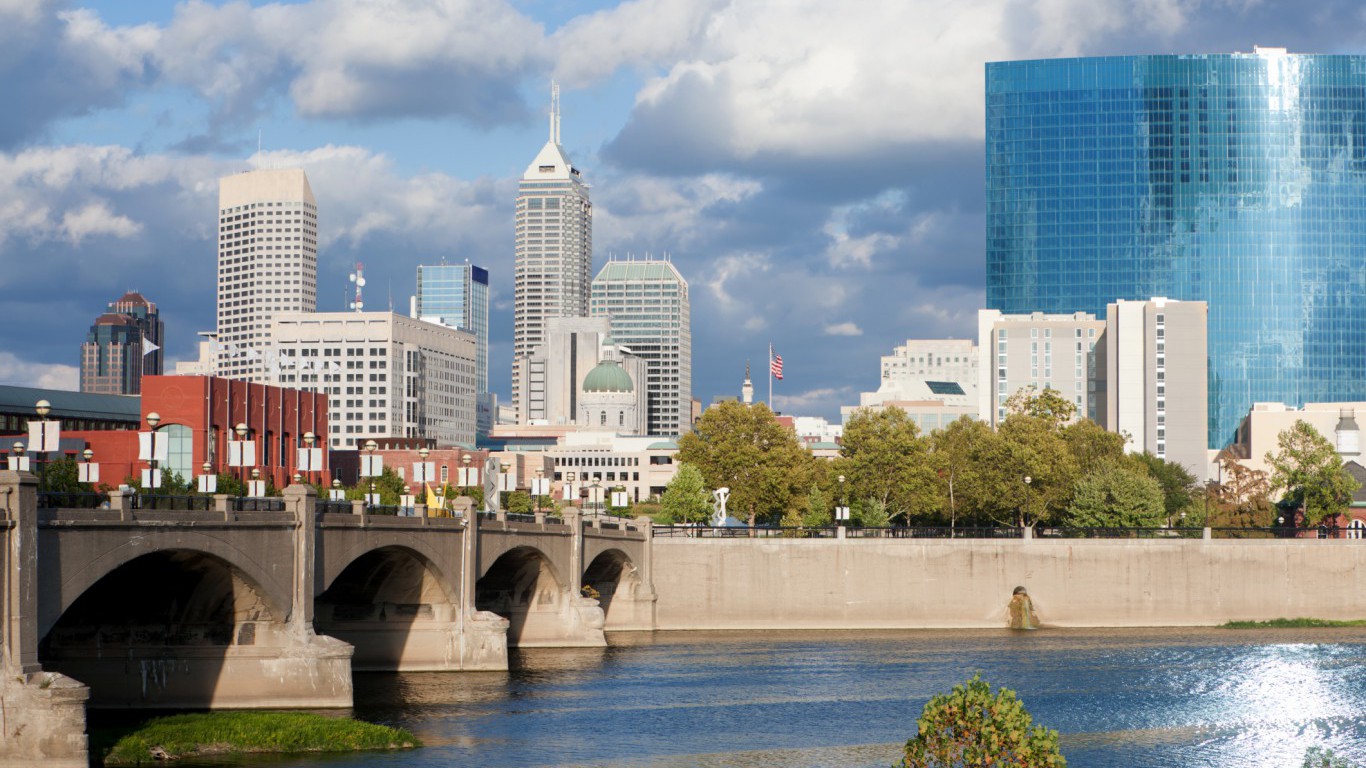
25. Indiana
> Annual public higher ed. spending per student: $6,899
> 2017 public college enrollment: 222,135
> # of state colleges + universities: 14 (12th fewest)
> Tuition revenue per student: $10,759 (6th highest)
> Adults with at least a bachelor’s degree: 25.6% (9th lowest)
[in-text-ad]

24. Washington
> Annual public higher ed. spending per student: $6,982
> 2017 public college enrollment: 239,481
> # of state colleges + universities: 44 (15th most)
> Tuition revenue per student: $5,266 (10th lowest)
> Adults with at least a bachelor’s degree: 35.1% (10th highest)

23. Minnesota
> Annual public higher ed. spending per student: $7,182
> 2017 public college enrollment: 189,951
> # of state colleges + universities: 43 (16th most)
> Tuition revenue per student: $9,142 (14th highest)
> Adults with at least a bachelor’s degree: 34.8% (11th highest)

22. Massachusetts
> Annual public higher ed. spending per student: $7,230
> 2017 public college enrollment: 165,736
> # of state colleges + universities: 43 (16th most)
> Tuition revenue per student: $5,585 (13th lowest)
> Adults with at least a bachelor’s degree: 42.7% (the highest)
[in-text-ad-2]
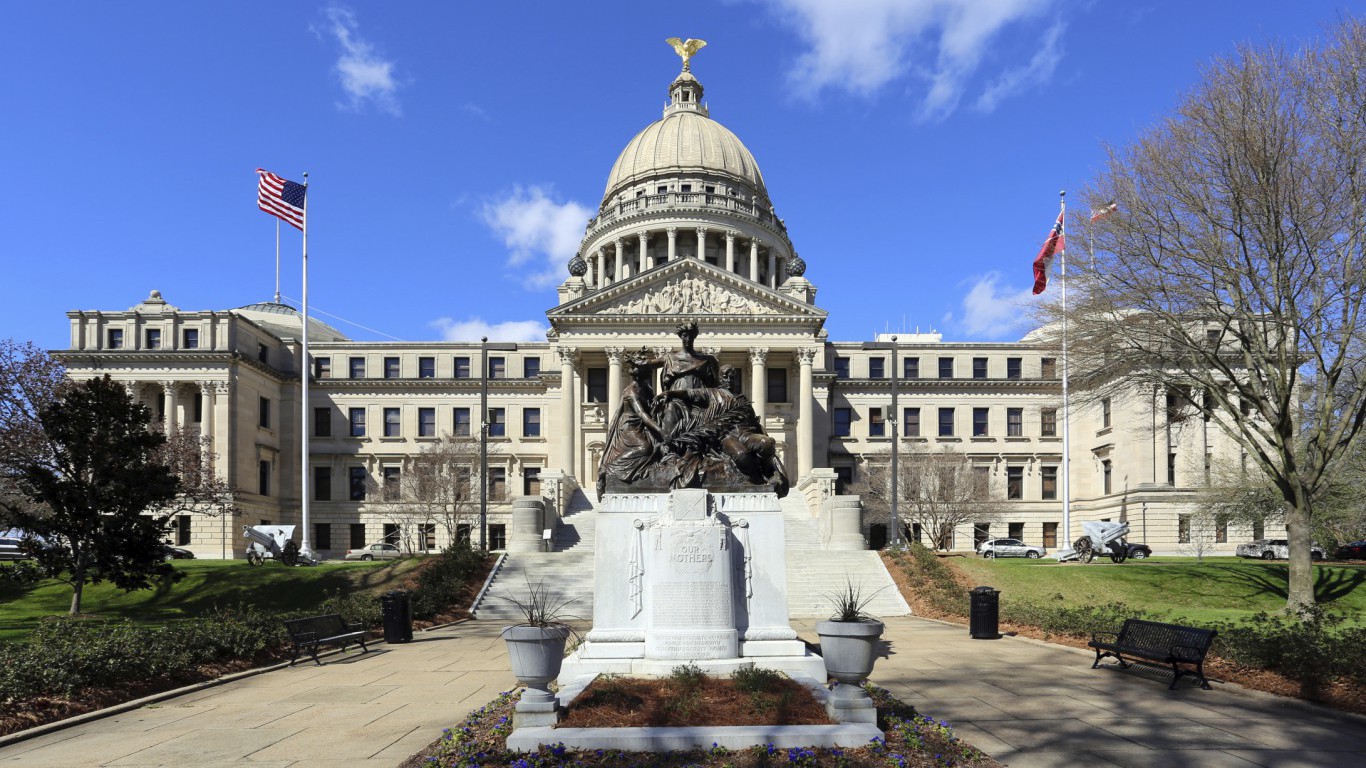
21. Mississippi
> Annual public higher ed. spending per student: $7,357
> 2017 public college enrollment: 130,623
> # of state colleges + universities: 23 (18th fewest)
> Tuition revenue per student: $7,503 (23rd highest)
> Adults with at least a bachelor’s degree: 21.8% (2nd lowest)

20. Nevada
> Annual public higher ed. spending per student: $7,496
> 2017 public college enrollment: 69,104
> # of state colleges + universities: 7 (5th fewest)
> Tuition revenue per student: $4,617 (6th lowest)
> Adults with at least a bachelor’s degree: 23.5% (6th lowest)
[in-text-ad]

19. Maine
> Annual public higher ed. spending per student: $7,559
> 2017 public college enrollment: 34,325
> # of state colleges + universities: 15 (13th fewest)
> Tuition revenue per student: $8,994 (15th highest)
> Adults with at least a bachelor’s degree: 30.1% (25th highest)

18. Kentucky
> Annual public higher ed. spending per student: $7,634
> 2017 public college enrollment: 147,167
> # of state colleges + universities: 24 (19th fewest)
> Tuition revenue per student: $7,719 (22nd highest)
> Adults with at least a bachelor’s degree: 23.4% (5th lowest)

17. Maryland
> Annual public higher ed. spending per student: $7,729
> 2017 public college enrollment: 232,908
> # of state colleges + universities: 30 (23rd fewest)
> Tuition revenue per student: $7,372 (25th highest)
> Adults with at least a bachelor’s degree: 39.3% (3rd highest)
[in-text-ad-2]

16. Texas
> Annual public higher ed. spending per student: $7,846
> 2017 public college enrollment: 1,034,453
> # of state colleges + universities: 108 (4th most)
> Tuition revenue per student: $5,379 (12th lowest)
> Adults with at least a bachelor’s degree: 28.9% (22nd lowest)

15. Arkansas
> Annual public higher ed. spending per student: $7,885
> 2017 public college enrollment: 114,976
> # of state colleges + universities: 35 (21st most)
> Tuition revenue per student: $6,549 (19th lowest)
> Adults with at least a bachelor’s degree: 22.4% (3rd lowest)
[in-text-ad]

14. Connecticut
> Annual public higher ed. spending per student: $8,103
> 2017 public college enrollment: 90,404
> # of state colleges + universities: 30 (23rd fewest)
> Tuition revenue per student: $9,176 (13th highest)
> Adults with at least a bachelor’s degree: 38.6% (4th highest)

13. Tennessee
> Annual public higher ed. spending per student: $8,242
> 2017 public college enrollment: 185,513
> # of state colleges + universities: 49 (12th most)
> Tuition revenue per student: $7,012 (22nd lowest)
> Adults with at least a bachelor’s degree: 26.1% (10th lowest)

12. California
> Annual public higher ed. spending per student: $8,447
> 2017 public college enrollment: 1,566,376
> # of state colleges + universities: 164 (the most)
> Tuition revenue per student: $2,109 (the lowest)
> Adults with at least a bachelor’s degree: 32.9% (14th highest)
[in-text-ad-2]

11. Georgia
> Annual public higher ed. spending per student: $8,550
> 2017 public college enrollment: 347,479
> # of state colleges + universities: 53 (10th most)
> Tuition revenue per student: $5,178 (9th lowest)
> Adults with at least a bachelor’s degree: 30.5% (23rd highest)

10. New York
> Annual public higher ed. spending per student: $8,640
> 2017 public college enrollment: 549,295
> # of state colleges + universities: 111 (2nd most)
> Tuition revenue per student: $4,977 (8th lowest)
> Adults with at least a bachelor’s degree: 35.7% (9th highest)
[in-text-ad]
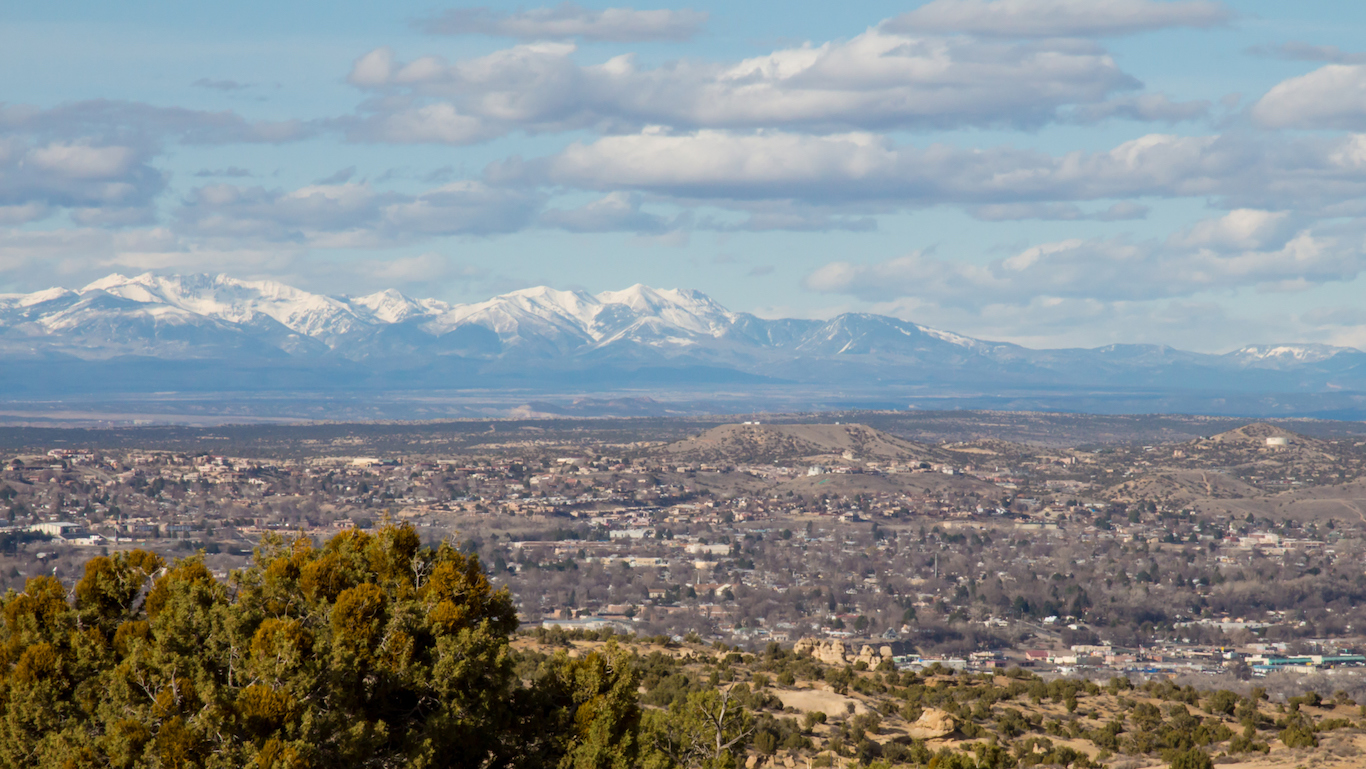
9. New Mexico
> Annual public higher ed. spending per student: $9,348
> 2017 public college enrollment: 89,020
> # of state colleges + universities: 28 (21st fewest)
> Tuition revenue per student: $3,770 (4th lowest)
> Adults with at least a bachelor’s degree: 27.2% (13th lowest)

8. North Dakota
> Annual public higher ed. spending per student: $9,552
> 2017 public college enrollment: 35,974
> # of state colleges + universities: 14 (12th fewest)
> Tuition revenue per student: $8,774 (17th highest)
> Adults with at least a bachelor’s degree: 29.6% (25th lowest)

7. Idaho
> Annual public higher ed. spending per student: $9,793
> 2017 public college enrollment: 53,116
> # of state colleges + universities: 9 (7th fewest)
> Tuition revenue per student: $4,774 (7th lowest)
> Adults with at least a bachelor’s degree: 27.6% (15th lowest)
[in-text-ad-2]

6. Nebraska
> Annual public higher ed. spending per student: $9,801
> 2017 public college enrollment: 76,899
> # of state colleges + universities: 16 (15th fewest)
> Tuition revenue per student: $6,753 (20th lowest)
> Adults with at least a bachelor’s degree: 31.4% (19th highest)

5. North Carolina
> Annual public higher ed. spending per student: $9,959
> 2017 public college enrollment: 389,604
> # of state colleges + universities: 75 (7th most)
> Tuition revenue per student: $5,306 (11th lowest)
> Adults with at least a bachelor’s degree: 30.4% (24th highest)
[in-text-ad]

4. Hawaii
> Annual public higher ed. spending per student: $10,810
> 2017 public college enrollment: 36,827
> # of state colleges + universities: 10 (8th fewest)
> Tuition revenue per student: $4,571 (5th lowest)
> Adults with at least a bachelor’s degree: 31.9% (18th highest)

3. Alaska
> Annual public higher ed. spending per student: $13,612
> 2017 public college enrollment: 18,456
> # of state colleges + universities: 5 (3rd fewest)
> Tuition revenue per student: $6,063 (17th lowest)
> Adults with at least a bachelor’s degree: 29.6% (25th lowest)

2. Illinois
> Annual public higher ed. spending per student: $16,055
> 2017 public college enrollment: 329,561
> # of state colleges + universities: 62 (9th most)
> Tuition revenue per student: $7,455 (24th highest)
> Adults with at least a bachelor’s degree: 34.0% (13th highest)
[in-text-ad-2]

1. Wyoming
> Annual public higher ed. spending per student: $18,237
> 2017 public college enrollment: 23,300
> # of state colleges + universities: 8 (6th fewest)
> Tuition revenue per student: $3,134 (2nd lowest)
> Adults with at least a bachelor’s degree: 27.1% (11th lowest)
The states that spend the most per student include Wyoming, Alaska, Idaho, and North Dakota — states with lower population density and much smaller public education systems compared to other states. There are roughly as many public colleges and universities in those four states combined as there are in the entirety of Arkansas.
“The outliers, Alaska, Wyoming are similar in two ways,” Carlson said. “One, they have a lot of tax revenue coming in from the extraction of natural resources, and two, they don’t have a lot of people to spend that money on. So on a per-student basis, they have a very well-funded public education system.”
The states with the lowest overall spending are Vermont and New Hampshire. The two New England states likely spend the least per student on public higher education because the region has a large and well-established network of private colleges and universities, Carlson explained.
“At some level, the public sector [in Vermont and New Hampshire] has fallen in line with the high tuition, high aid model that the private sector utilizes,” said Carlson. Indeed, while Vermont and New Hampshire spend relatively little to fund colleges and universities, the states’ higher education institutions have some of the highest net tuition revenues per student.
Vermont, in particular, had the highest tuition revenue per full-time enrolled student as recently as 2016. In 2017, it recorded tuition revenues of $14,732 per student, compared to a national average of $6,572 per student. That figure was second only to Michigan’s revenue of just under $15,000 per full-time enrolled student.
To identify the states spending the most on higher education, 24/7 Wall St. reviewed state higher education investments per full time student in the 2017 academic year. How states allocate money to public colleges and universities varies, but the majority of the money goes to general operations of the institutions with the rest going to various forms of student aid. These figures come from “State Higher Education Finance (SHEF): FY 2017,” a report by the State Higher Education Executive Officers Association (SHEEO). Net tuition, defined as out-of-pocket tuition payments excluding financial aid, room and board, and other fees, also came from SHEEO. Educational attainment rates came from the U.S. Census Bureau’s 2016 American Community Survey. The number of public higher education institutions came from the National Center for Education Statistics’ Integrated Postsecondary Education Data System and are for 2017. The number of state colleges and universities reflects public postsecondary institutions listed in the Integrated Postsecondary Education Data System, which is part of the National Center for Education Statistics.
Want retirement to come a few years earlier than you’d planned? Or are you ready to retire now, but want an extra set of eyes on your finances?
Now you can speak with up to 3 financial experts in your area for FREE. By simply clicking here you can begin to match with financial professionals who can help you build your plan to retire early. And the best part? The first conversation with them is free.
Click here to match with up to 3 financial pros who would be excited to help you make financial decisions.
Have questions about retirement or personal finance? Email us at [email protected]!
By emailing your questions to 24/7 Wall St., you agree to have them published anonymously on a673b.bigscoots-temp.com.
By submitting your story, you understand and agree that we may use your story, or versions of it, in all media and platforms, including via third parties.
Thank you for reading! Have some feedback for us?
Contact the 24/7 Wall St. editorial team.