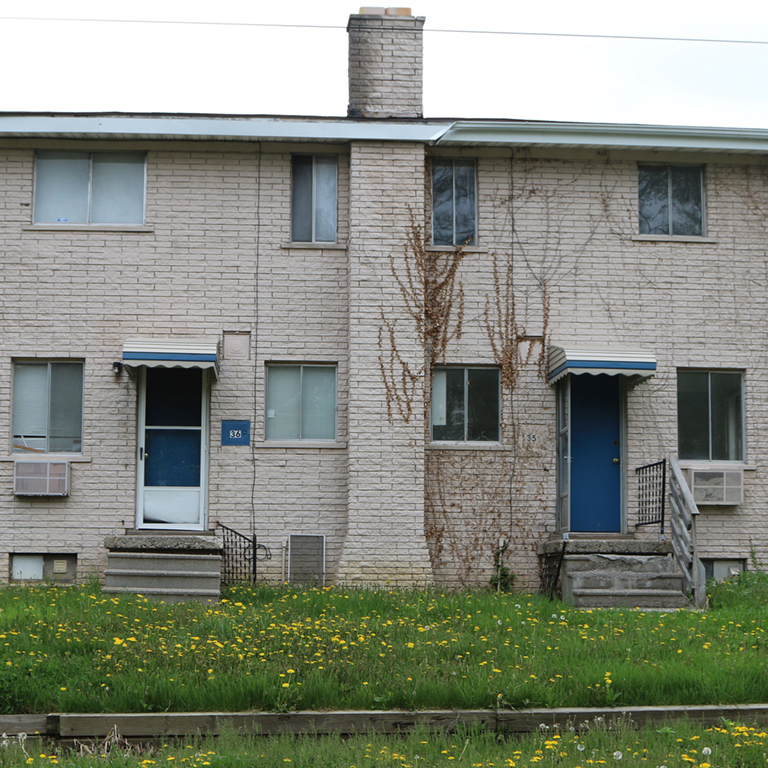
Where Americans live can have a considerable impact on their quality of life. In some U.S. cities, everyday comfort and happiness is much harder to attain than in others.
Quality of life is subjective, and difficult to measure. Still, there is a wide range of quantifiable factors that can impact quality of life in a given area. Affordability, safety, job market strength, quality of education, infrastructure, average commute times, air quality, and the presence of cultural attractions are just a few examples of factors that can influence overall quality of life.
24/7 Wall St. created an index with measures in eight categories — crime, economy, education, environment, health, housing, infrastructure, and leisure — to identify the 50 worst cities to live in. Not confined to a single region, the worst cities span the country from the South to the Midwest and from New England to the Pacific coast.
Correction: In a previous version of this piece, due to a data processing error, the Las Vegas crime rate was reported as 2,136 per 100,000 population. In fact, the metro area’s crime rate is 849.2 per 100,000 population. As a result, Las Vegas should not have been included as one of the worst cities to live in. Our list has changed order and a new metro area, Fort Smith, Arkansas has been added.
Click here to see the worst cities to live in.
Click here to see our detailed findings.
Click here to see our methodology.
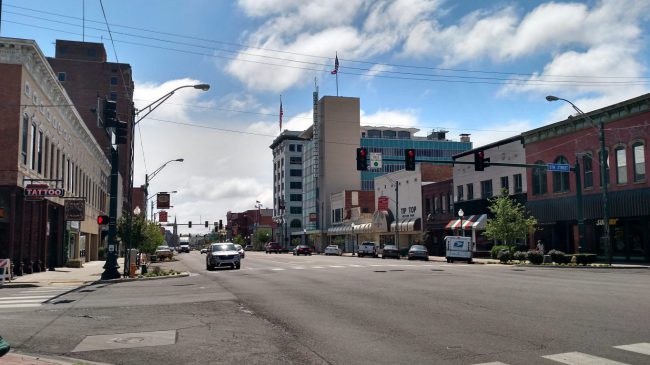
50. Fort Smith, Arkansas
> Population: 88,122
> Median home value: $115,400
> Poverty rate: 21.6%
> Pct. with at least a bachelor’s degree: 20.0%
By a number of measures assessing economic opportunity, education, crime, and public health, Fort Smith is one of the worst cities to live in. Just 20.0% of adults in the city have a bachelor’s degree, far less than the national college attainment rate of 31.3% and the smallest share of any major city in Arkansas. Low educational attainment can limit economic growth in an area and curb the earning potential of its residents. The typical Fort Smith household earns just $38,051 a year, far less than the national median income of $57,617.
Fort Smith also has the highest crime rate of any city in Arkansas other than Little Rock and one of the highest in the United States. There were 808 violent crimes reported in 2016 per 100,000 city residents, far more than the state violent crime rate of 551 incidents per 100,000 people and the national rate of 386 per 100,000.
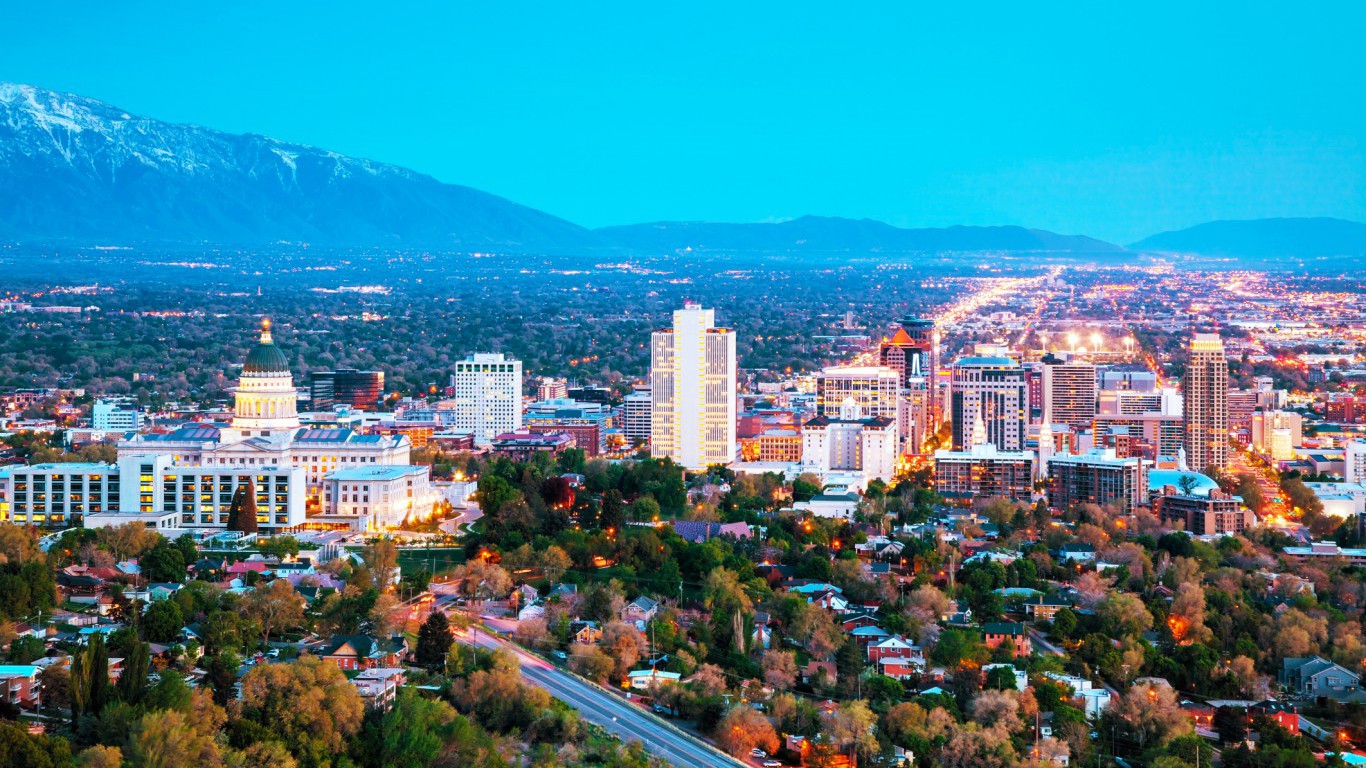
49. Salt Lake City, Utah
> Population: 193,776
> Median home value: $285,100
> Poverty rate: 16.1%
> Pct. with at least a bachelor’s degree: 45.6%
One factor detracting from quality of life in Salt Lake City is the area’s high violent crime rate. Some 937 violent crimes were reported in 2016 per 100,000 city residents, more than twice the national violent crime rate of 386 incidents per 100,000 Americans and nearly four times the state rate of 243 per 100,000 Utah residents. Housing prices in Salt Lake City also have been rising fast in recent years and have outpaced the area’s income growth, making housing unaffordable for many low-income residents.
Despite the high violent crime rate, Salt Lake City has experienced substantial economic growth in the last several years. The number of jobs in the city rose 5.1% from 2014 to 2016, a faster pace than the nation as a whole.
[in-text-ad]
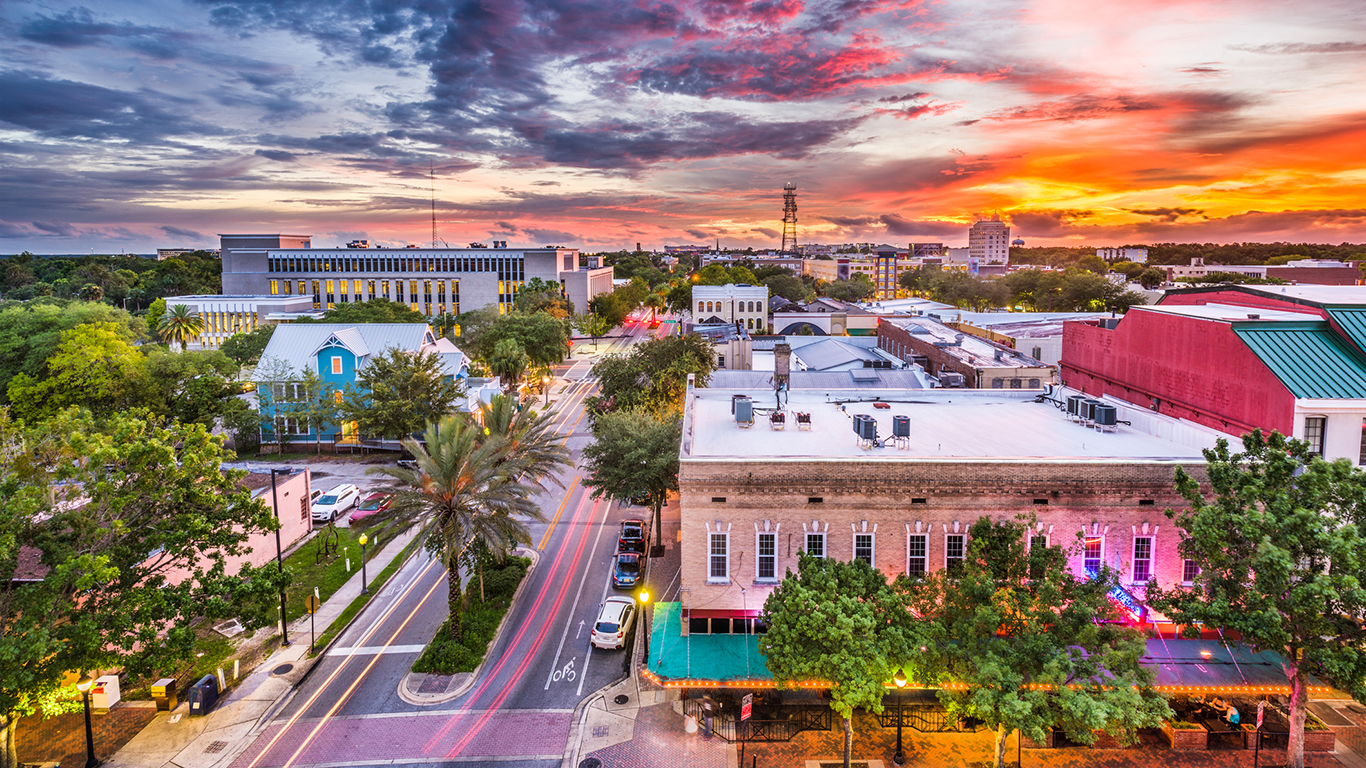
48. Gainesville, Florida
> Population: 131,593
> Median home value: $154,600
> Poverty rate: 33.4%
> Pct. with at least a bachelor’s degree: 42.7%
Gainesville is the home of the University of Florida, one of the top 50 national universities as ranked by U.S. News & World Report and the country’s fifth largest university by undergraduate enrollment. While the presence of a large research university likely has added depth to the area’s talent pool — some 41.7% of Gainesville adults have a bachelor’s degree compared to 31.3% of adults nationwide — quality of life in the city is poor overall.
The typical Gainesville household earns just $32,968 a year, roughly $25,000 less than the national median household income. Some 33.4% of city residents live in poverty, more than twice the U.S. poverty rate of 14.0% and the seventh highest rate of any major U.S. city.
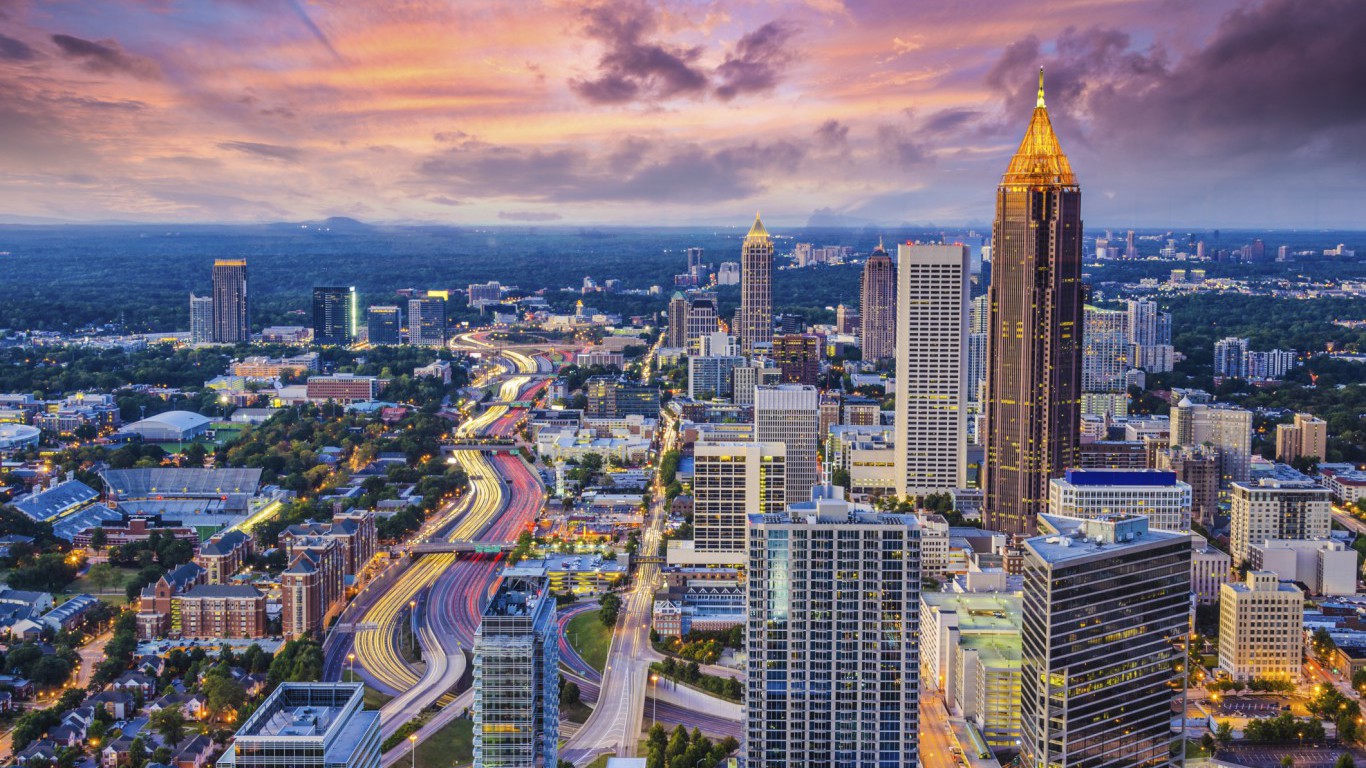
47. Atlanta, Georgia
> Population: 472,506
> Median home value: $262,600
> Poverty rate: 22.4%
> Pct. with at least a bachelor’s degree: 50.5%
While Atlanta has experienced substantial economic and population growth in recent years, the city’s high violent crime rate continues to hinder the area’s quality of life. There were 1,084 violent crimes reported in 2016 per 100,000 Atlanta residents, nearly three times the national violent crime rate of 386 incidents per 100,000 Americans.
Another factor detracting from quality of life in Atlanta is the city’s poor air quality. According to real estate data provider ATTOM Data Solutions, air quality in Atlanta and the surrounding Fulton County is considered non-hazardous just 89.5% of the year, one of the smallest shares of any major city. Air pollution in Atlanta may be partially exacerbated by the area’s record-setting heat in recent years. The temperature in Atlanta exceeded 85 degrees fahrenheit a total of 136 days in 2016, the city’s hottest year on record.

46. Tacoma, Washington
> Population: 211,304
> Median home value: $239,100
> Poverty rate: 16.3%
> Pct. with at least a bachelor’s degree: 27.7%
While Tacoma has experienced substantial economic growth in recent years — the number of employed workers in the city rose by 6.1% from 2014 to 2016, compared to a 3.5% growth nationwide — the area still struggles with high unemployment and violent crime. Some 6.6% of the Tacoma workforce is currently unemployed, a far higher jobless rate than the 4.9% national rate.
Although crime has declined in many of the more dangerous neighborhoods in the city over the last several decades, Tacoma’s violent crime rate remains the highest of any city in the state. There were 947 violent crimes reported in 2016 per 100,000 Tacoma residents, far more than the state violent crime rate of 302 incidents per 100,000 Washington residents and the national rate of 386 per 100,000.
[in-text-ad-2]
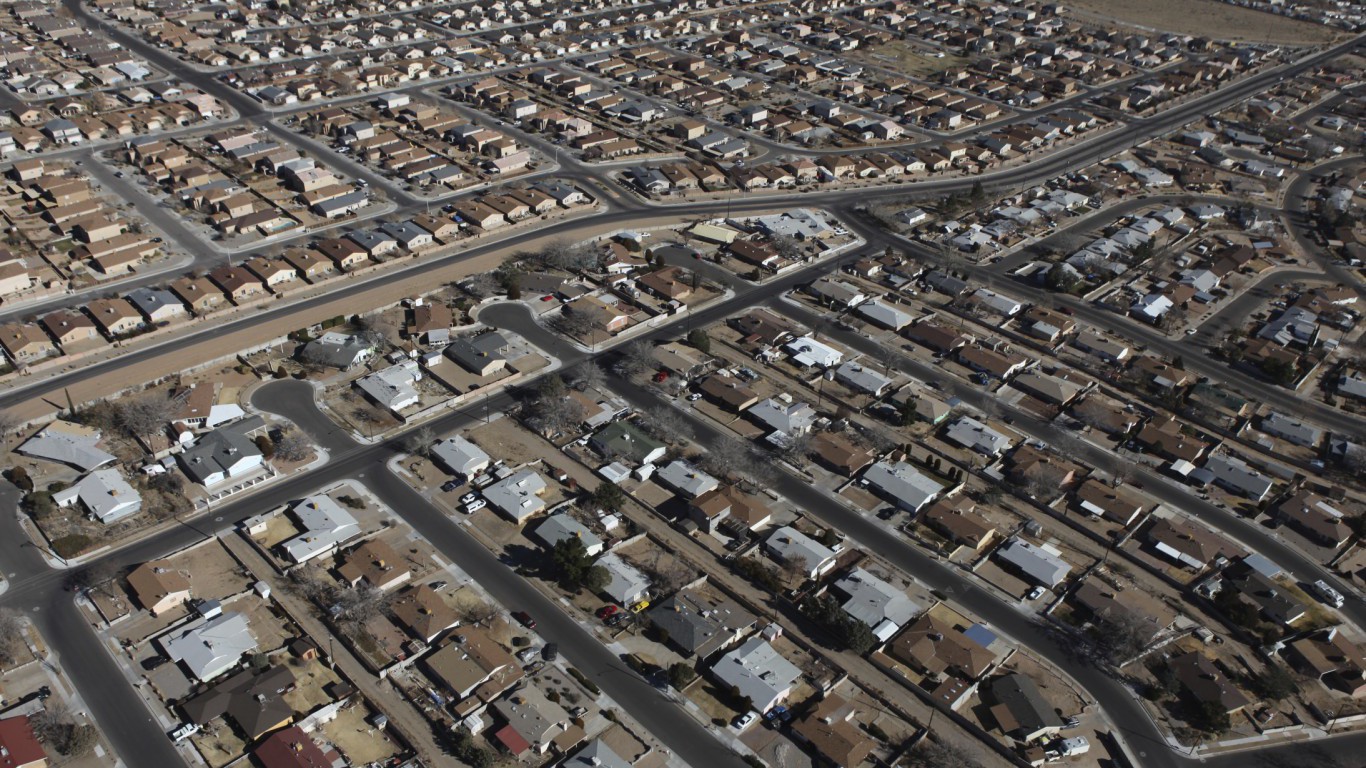
45. Albuquerque, New Mexico
> Population: 559,270
> Median home value: $191,600
> Poverty rate: 17.1%
> Pct. with at least a bachelor’s degree: 35.0%
While cheap land and low taxes have spurred rapid development in much of the area
surrounding Albuquerque, the city’s population growth has been relatively limited in recent years. Albuquerque’s population growth rate of just 1.2% from 2011 to 2016 is less than one-third the national population growth rate of 3.7% over that time. Similarly, the city’s employment growth rate of just 2.4% from 2014 to 2016 was slower growth than in a majority of large U.S. cities over the same period. Some 5.8% of Albuquerque’s workforce is unemployed, a higher jobless rate than the 4.9% national rate.
Albuquerque also struggles with one of the highest violent crime rates in the country. There were 1,117 violent crimes reported in 2016 per 100,000 city residents, the most of any major city in New Mexico and nearly three times the national rate of 386 incidents per 100,000 Americans.
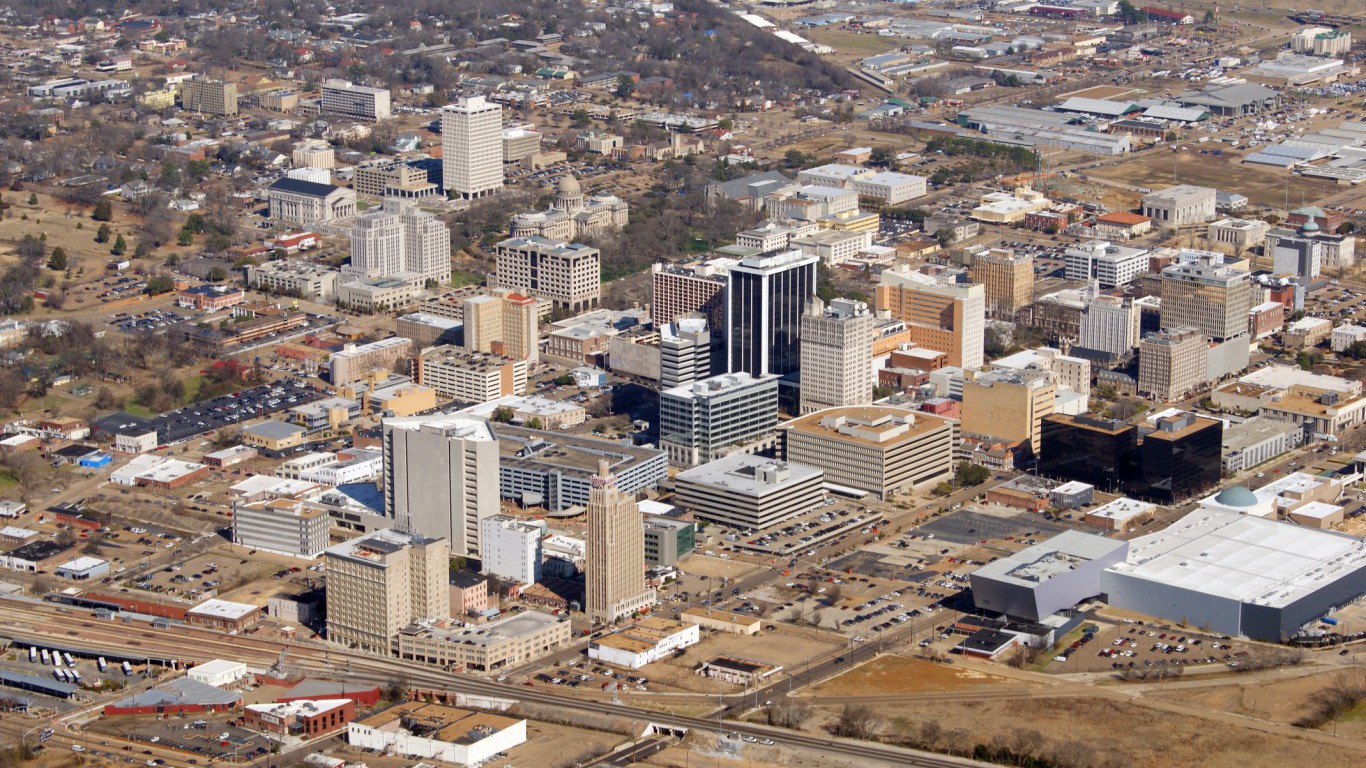
44. Jackson, Mississippi
> Population: 169,141
> Median home value: $88,500
> Poverty rate: 22.0%
> Pct. with at least a bachelor’s degree: 28.6%
By a number of metrics assessing economic opportunity, education, public safety, and infrastructure, Jackson is one of the worst cities to live in in the country. The typical Jackson household earns just $39,742 a year, far less than the national median household income of $57,617. Even adjusted for the area’s low cost of living — goods and services cost 13.9% less in Jackson and the surrounding Hinds County than they do nationwide — incomes in Jackson are still far below the U.S. median. Jackson is also one of the more dangerous Southern cities. There were 856 violent crimes reported per 100,000 residents in 2016, more than twice the national violent crime rate.
Like many areas with low incomes and high violent crime, Jackson has been losing residents. While the U.S. population grew 3.7% between 2011 and 2016, the number of Jackson residents declined by the same amount — the largest population decline in Mississippi and the 14th largest decrease of any major city in the country.
[in-text-ad]
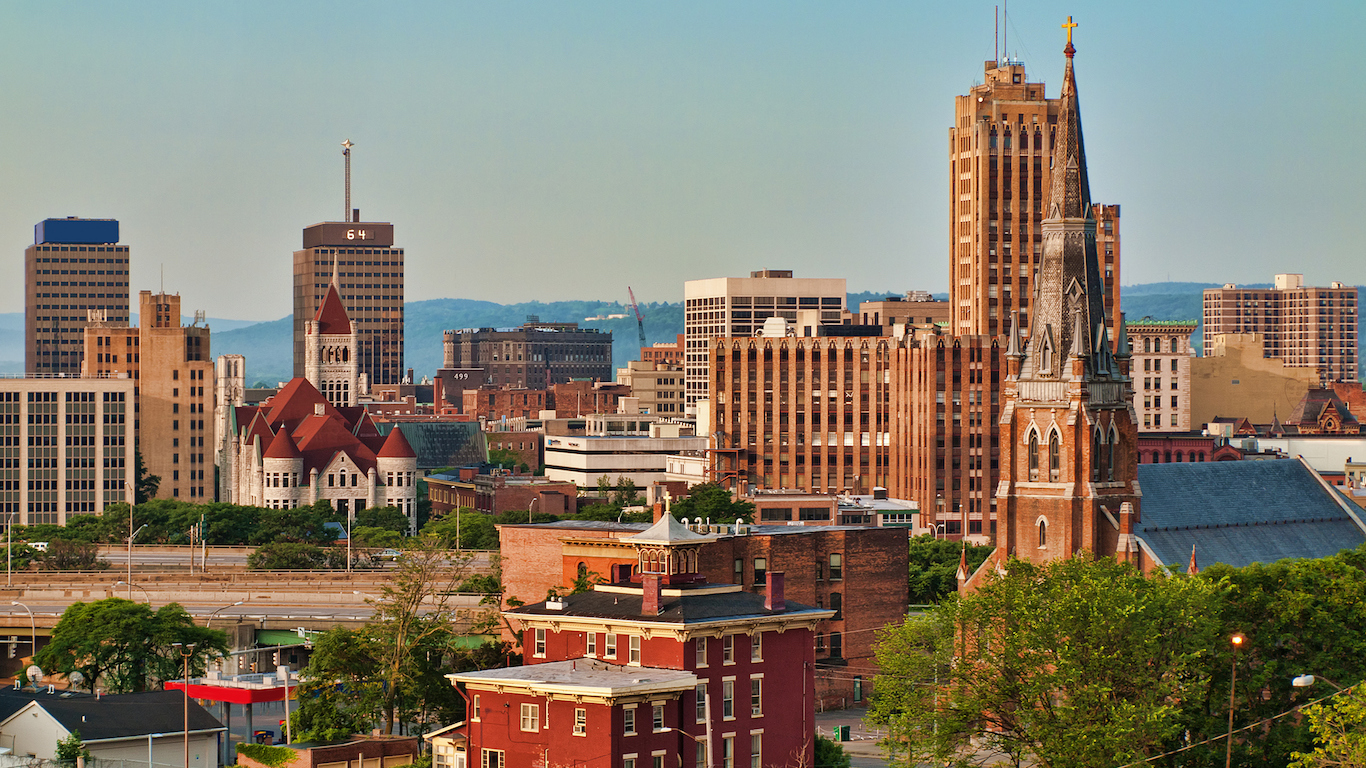
43. Syracuse, New York
> Population: 143,378
> Median home value: $92,900
> Poverty rate: 32.1%
> Pct. with at least a bachelor’s degree: 27.6%
Syracuse is one of two upstate New York cities to rank among the worst cities to live in nationwide. A third, Rochester, nearly made the list as well. A relatively poor city, the typical household in Syracuse earns $33,695 a year, only slightly more than half the median income of $62,909 statewide. Additionally, 32.1% of city residents live below the poverty line, well more than double the state poverty rate of 14.7%.
As is often the case in cities with similarly negative economic indicators, Syracuse is losing residents. In the last five years, the city’s population declined by 1.2%, even as the U.S. population climbed by 3.7%.
42. Miami, Florida
> Population: 453,584
> Median home value: $277,700
> Poverty rate: 24.9%
> Pct. with at least a bachelor’s degree: 26.6%
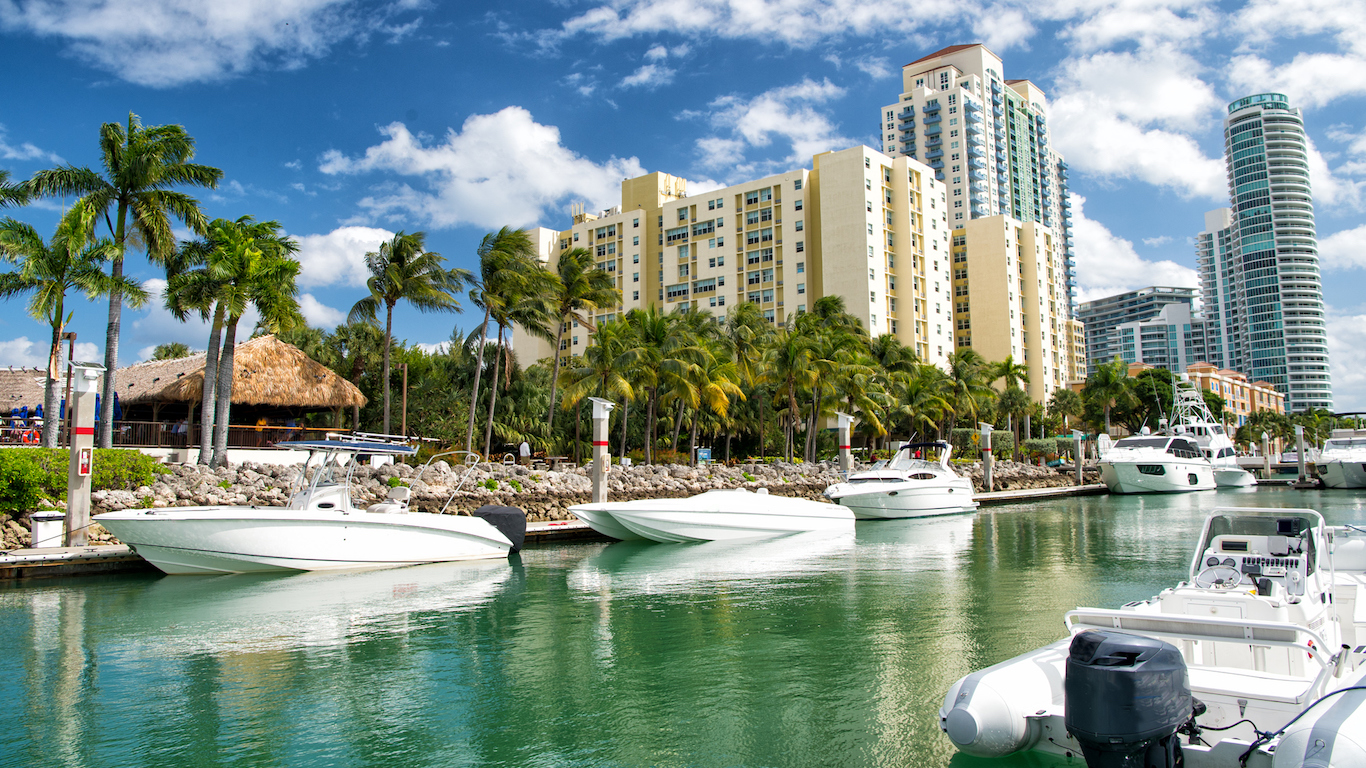
Miami is one of the most expensive cities in the country. Goods and services in Miami-Dade County are about 15% more expensive than they are on average nationwide. Housing is particularly expensive. The typical home in Miami is worth $277,700 compared to the median home value of $205,000 nationwide. Despite this, the typical household in the Miami area earns $34,901 a year, well below the median income of $57,617 nationwide.
The city is also relatively dangerous. Violent crime is about twice as common in Miami as it is nationwide as there were 879 violent crimes for every 100,000 people in 2016 compared to 386 per 100,000 nationwide.
41. North Charleston, South Carolina
> Population: 112,147
> Median home value: $152,000
> Poverty rate: 25.8%
> Pct. with at least a bachelor’s degree: 22.1%
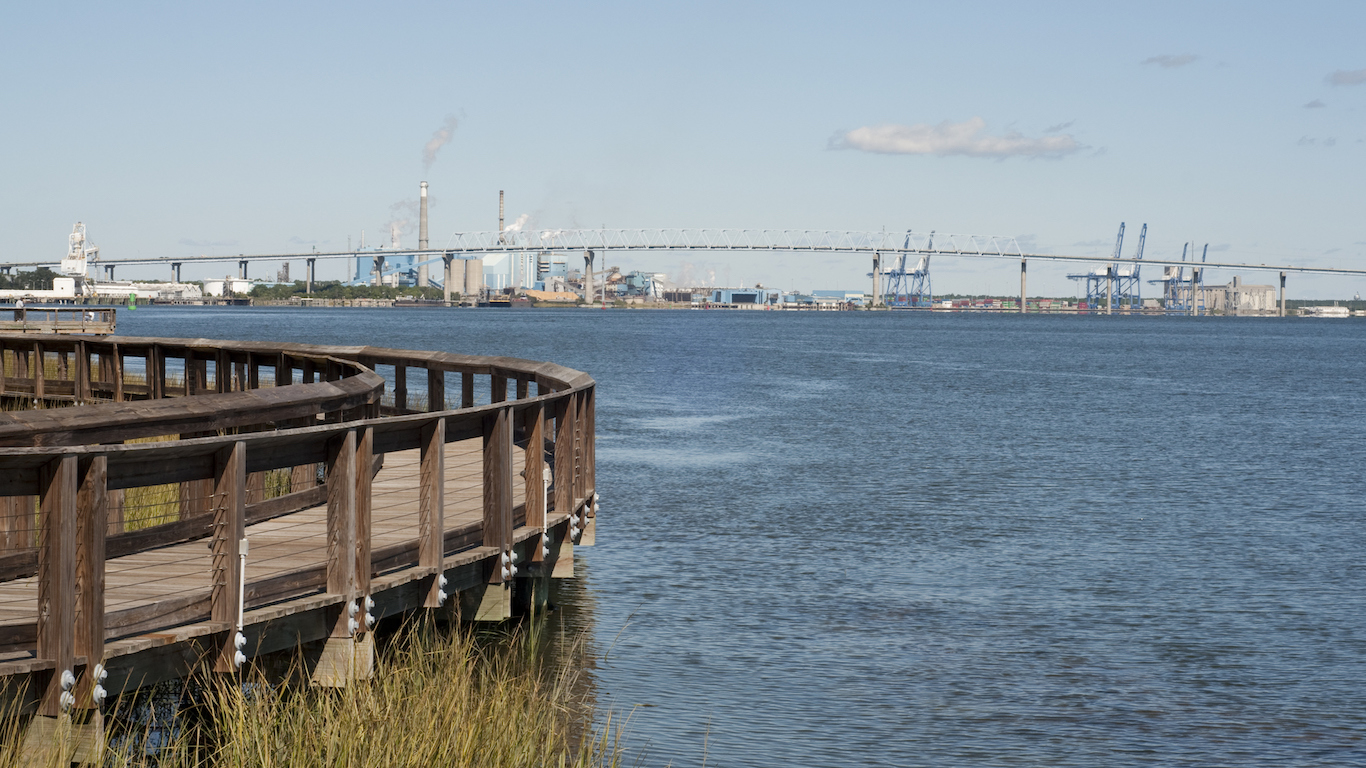
More than one in every four North Charleston residents live in poverty, compared to 15.3% of South Carolinians and 14.0% of Americans. Poorer cities are often relatively dangerous, and North Charleston is no exception. There were 885 violent crimes in North Charleston for every 100,000 residents in 2016, compared to state’s violent crime rate of 502 per 100,000 and the nationwide rate of 386 per 100,000.
While many cities on this list are losing residents, North Charleston is growing rapidly. In the past decade, the city’s population expanded by 34.4%, more than all but a dozen other U.S. cities over the same period.
[in-text-ad-2]

40. South Bend, Indiana
> Population: 102,442
> Median home value: $77,400
> Poverty rate: 24.7%
> Pct. with at least a bachelor’s degree: 24.1%
South Bend, Indiana is one of the most dangerous cities in the United States. There were 1,012 violent crimes in South Bend for every 100,000 residents in 2016, more than double both the state and national violent crime rates of 405 incidents and 386 incidents per 100,000 people, respectively. As is often the case in high crime areas, property values in South Bend are depressed. The typical home in the city is worth just $77,400, less than half the national median home value of $205,000.
39. New Haven, Connecticut
> Population: 129,939
> Median home value: $191,000
> Poverty rate: 24.5%
> Pct. with at least a bachelor’s degree: 32.4%
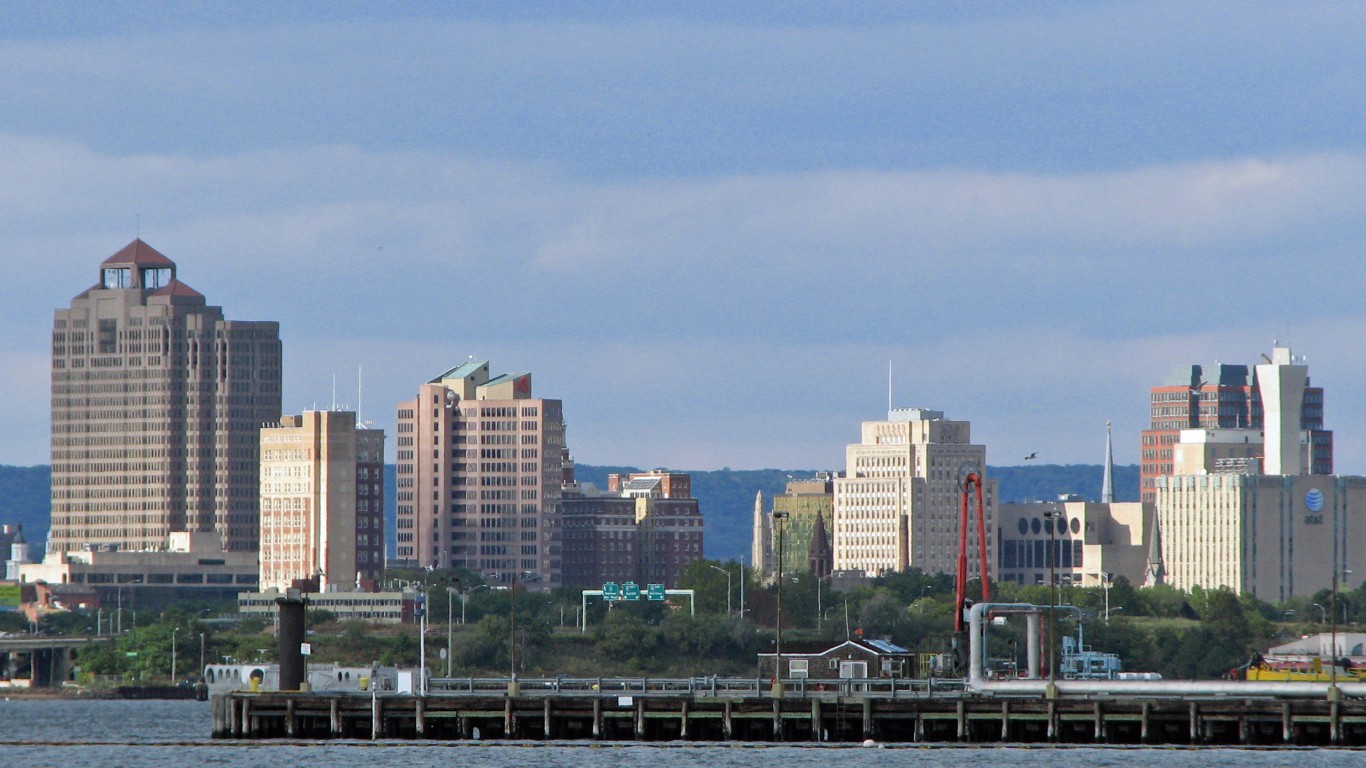
New Haven is one of two Connecticut cities to rank among the worst cities to live in nationwide. The city’s 6.6% unemployment rate is higher than both the state jobless rate of 5.1% and the national rate of 4.9%. The weak job market likely only increases financial hardship for some city residents as it is not a particularly inexpensive place to live. Goods and services in New Haven County are about 16.5% more expensive than they are on average nationwide.
New Haven is not an especially safe city. There were 938 violent crimes for every 100,000 city residents in 2016, more than double the national violent crime rate of 386 per 100,000.
[in-text-ad]
38. Tallahassee, Florida
> Population: 190,895
> Median home value: $196,700
> Poverty rate: 26.1%
> Pct. with at least a bachelor’s degree: 49.6%
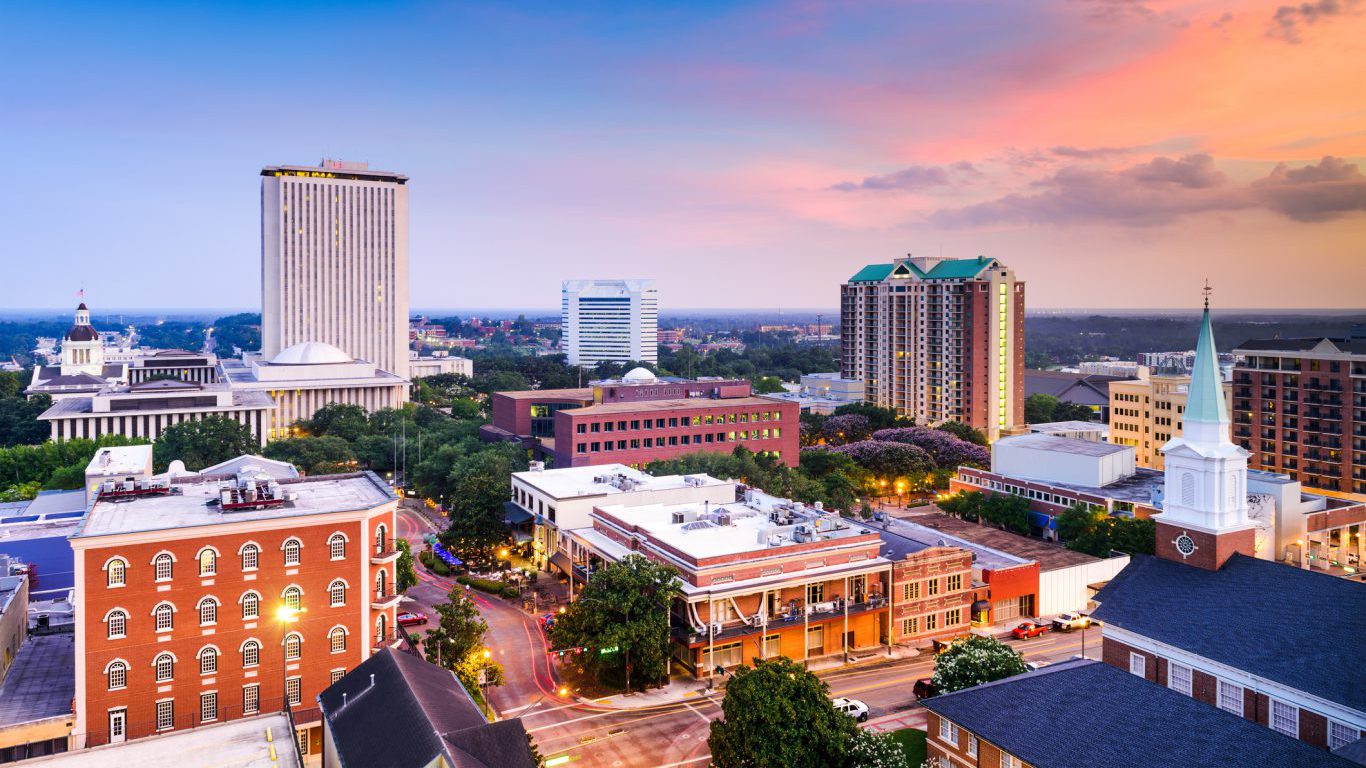
Tallahassee is one of six cities in the Sunshine State to rank among the least liveable in the country. As is the case with most other Florida cities on this list, Tallahassee has a relatively high poverty rate. More than one in every four city residents live below the poverty line compared to 14% of Americans nationwide. Additionally, both property and violent crimes are more than twice as common in Tallahassee than they are nationwide.
Unlike most cities on this list, Tallahassee has a large college-educated population. About half of all adults in the city have a bachelor’s degree or higher. In comparison, fewer than one in three adults nationwide have similar educational attainment.
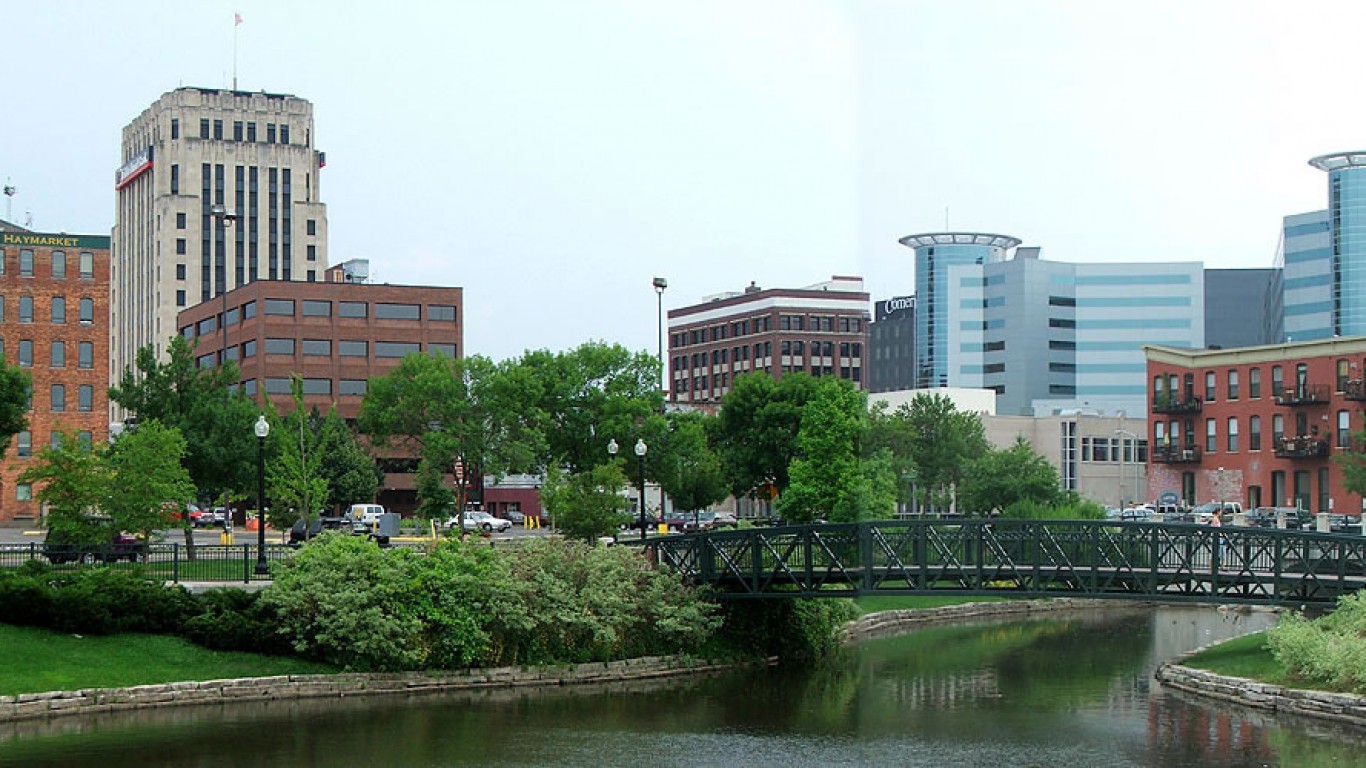
37. Kalamazoo, Michigan
> Population: 75,988
> Median home value: $98,000
> Poverty rate: 30.9%
> Pct. with at least a bachelor’s degree: 31.3%
Air quality in Kalamazoo is nearly the worst of any U.S. city. The city’s air is considered hazardous for about 15% of days in a given year, a far larger share than the 6% average nationwide. The city is also among the most dangerous nationwide. There were 1,217 violent crimes in 2016 for every 100,000 residents, more than triple the U.S. violent crime rate of 386 per 100,000.
As is often the case among cities on this list, Kalamazoo is poor. Over 30% of the population lives in poverty, more than double the U.S. poverty rate of 14%.
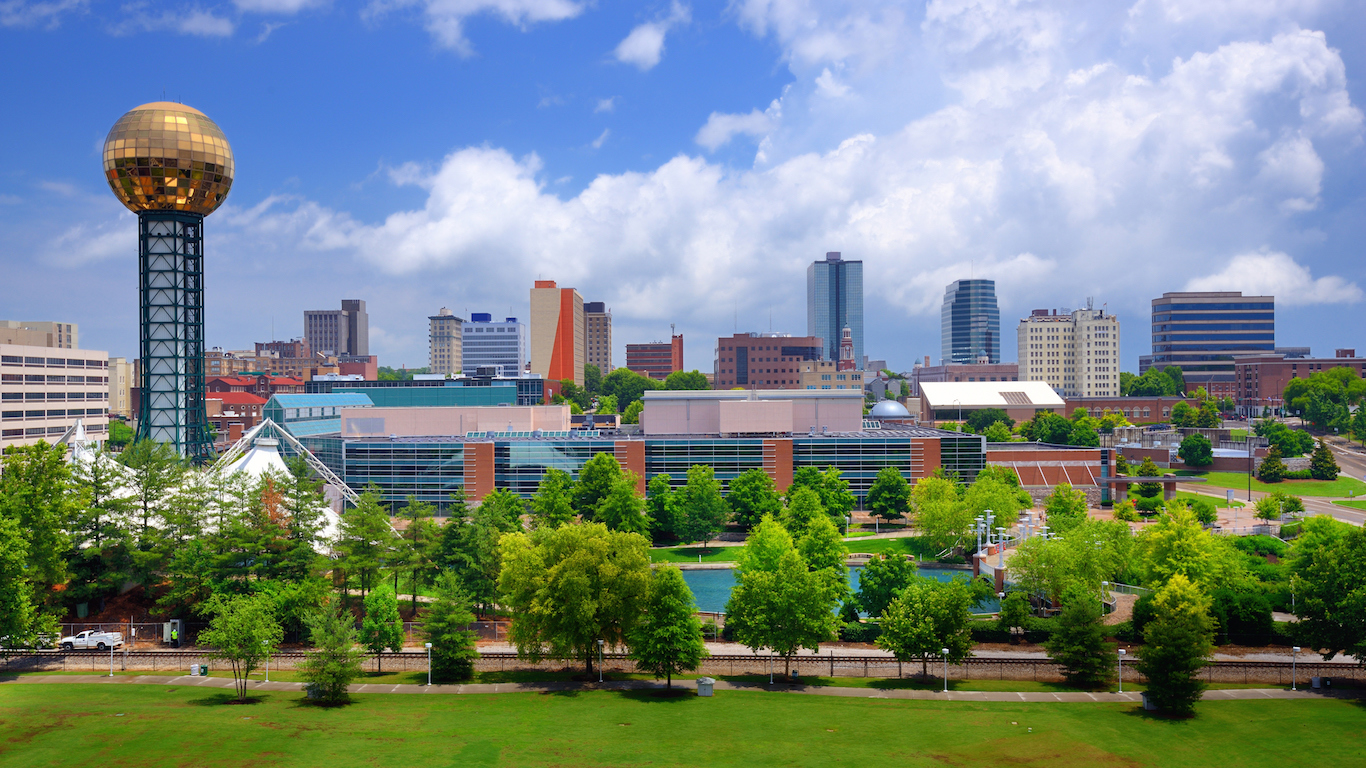
36. Knoxville, Tennessee
> Population: 186,238
> Median home value: $128,000
> Poverty rate: 25.4%
> Pct. with at least a bachelor’s degree: 35.1%
About one in every four Knoxville residents live in poverty, well above the 14% share of Americans and the second highest poverty rate of any large city in the state. Poorer areas often struggle with crime, and in Knoxville, both violent and property crimes are more than twice as common as they are nationwide.
While the city struggles with low incomes and higher crime rates, the home of the University of Tennessee, Knoxville also has some positive attributes common in college towns. For example, 35.1% of residents have a bachelor’s degree, a larger share than is typical nationwide. Additionally, the city has a greater than average concentration of bars and restaurants than the United States as a whole.
[in-text-ad-2]
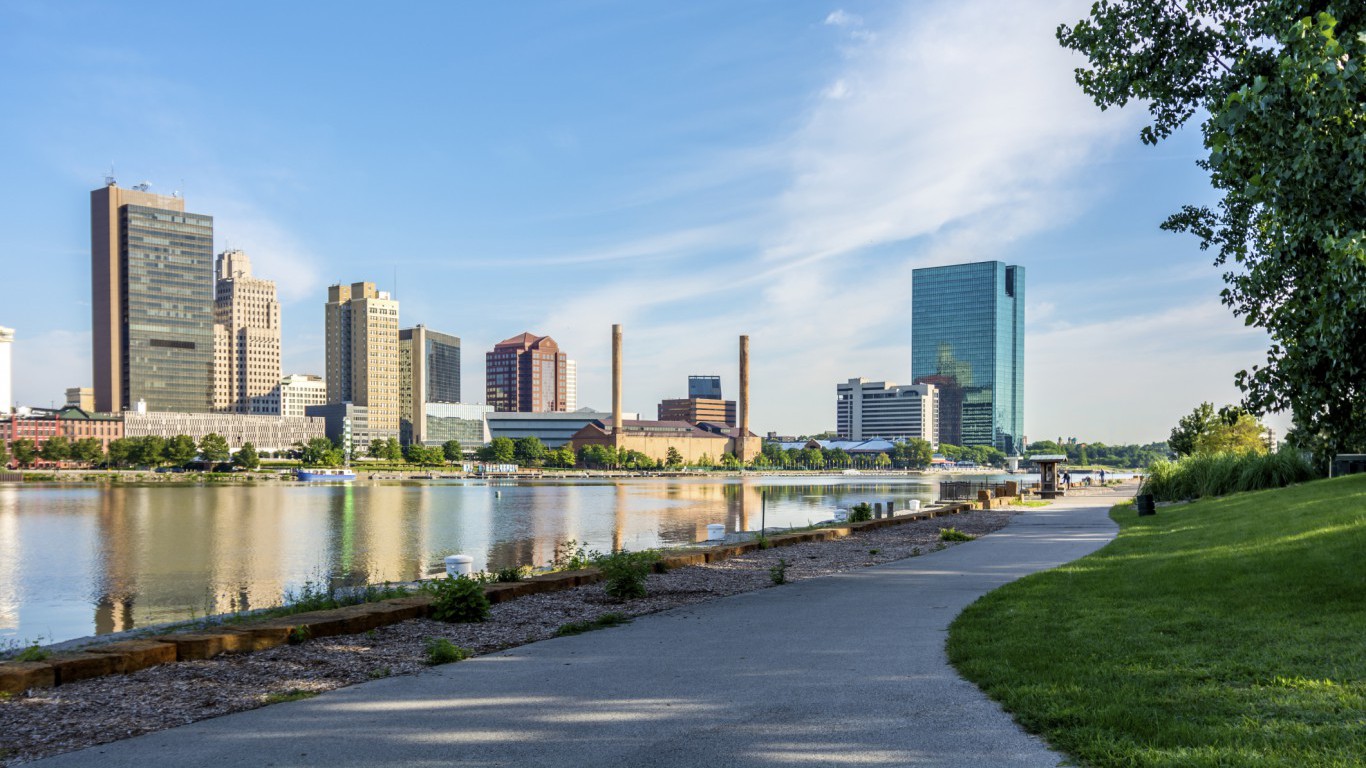
35. Toledo, Ohio
> Population: 278,512
> Median home value: $79,100
> Poverty rate: 26.3%
> Pct. with at least a bachelor’s degree: 18.7%
Toledo, Ohio, is one of the most dangerous cities in the country. There were 1,192 violent crimes for every 100,000 Toledo residents in 2016, more than three times the statewide violent crime rate and nearly triple the U.S. violent crime rate. A high crime rate can depress home values, and real estate in Toledo ranks among the least expensive in the country. The typical home in the city is worth just $79,100 compared to the value of $205,000 of the typical American home. It is also lower than in all but 13 other U.S. cities
As is the case with nearly every other Midwestern city on this list, Toledo’s population is shrinking. In the last five years, the number of people living in the city fell by 2.6%.
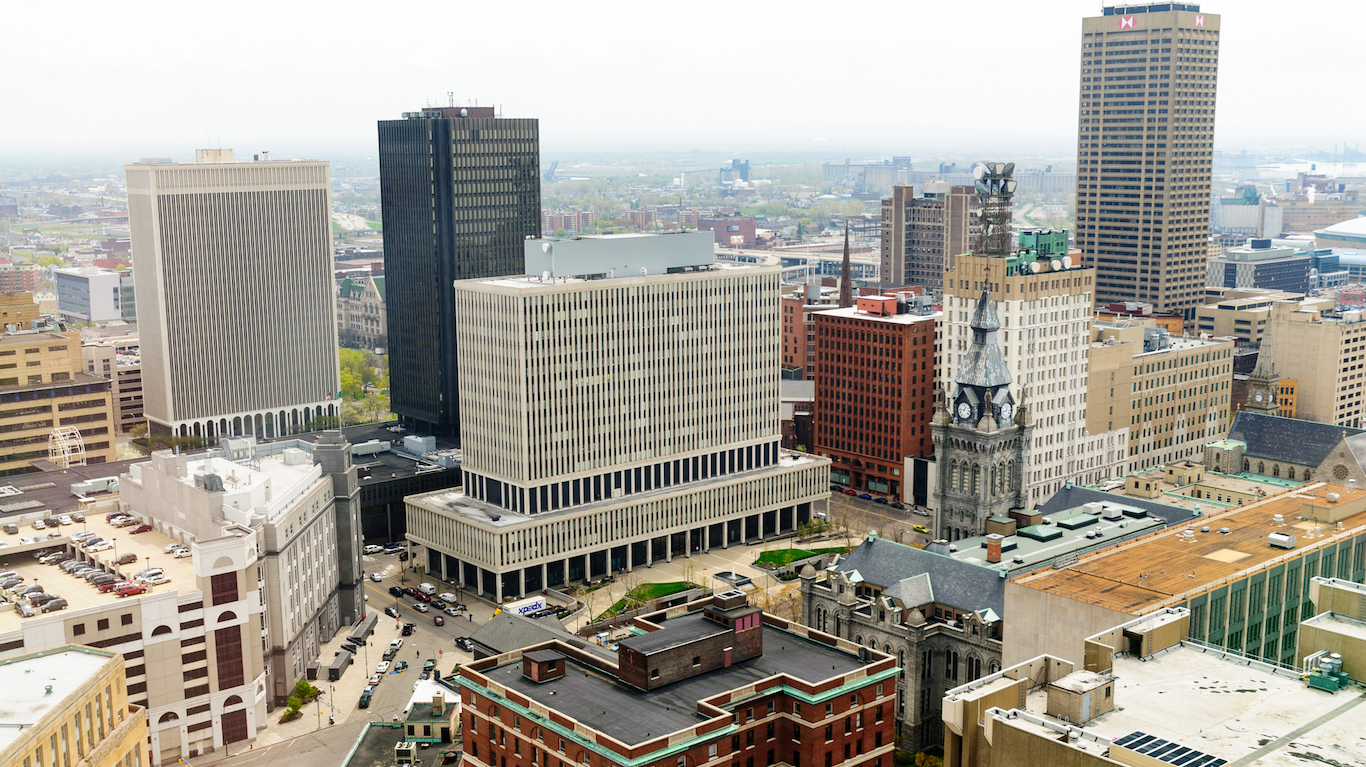
34. Buffalo, New York
> Population: 256,908
> Median home value: $83,500
> Poverty rate: 30.5%
> Pct. with at least a bachelor’s degree: 26.7%
Based on a number of socioeconomic indicators, Buffalo is the worst city to live in in New York state and one of the worst in the country. Buffalo is one of just a handful of cities nationwide where the typical household earns less than $33,000 a year. The low median income is due in part to the high jobless rate. Some 6.3% of Buffalo’s labor force is out of a job, above both the state unemployment rate of 4.8% and the national rate of 4.9%. The jobs market has not improved meaningfully in the western New York city in recent years. Between 2014 and 2016, city employment grew by only 0.1% compared to 3.5% total employment growth nationwide over the same period.
As is the case with most Northeastern cities on this list, Buffalo has lost residents in recent years. In the past half decade, the city’s population count declined by 1.6%, even as the U.S. population expanded by 3.7% over the same period.
[in-text-ad]
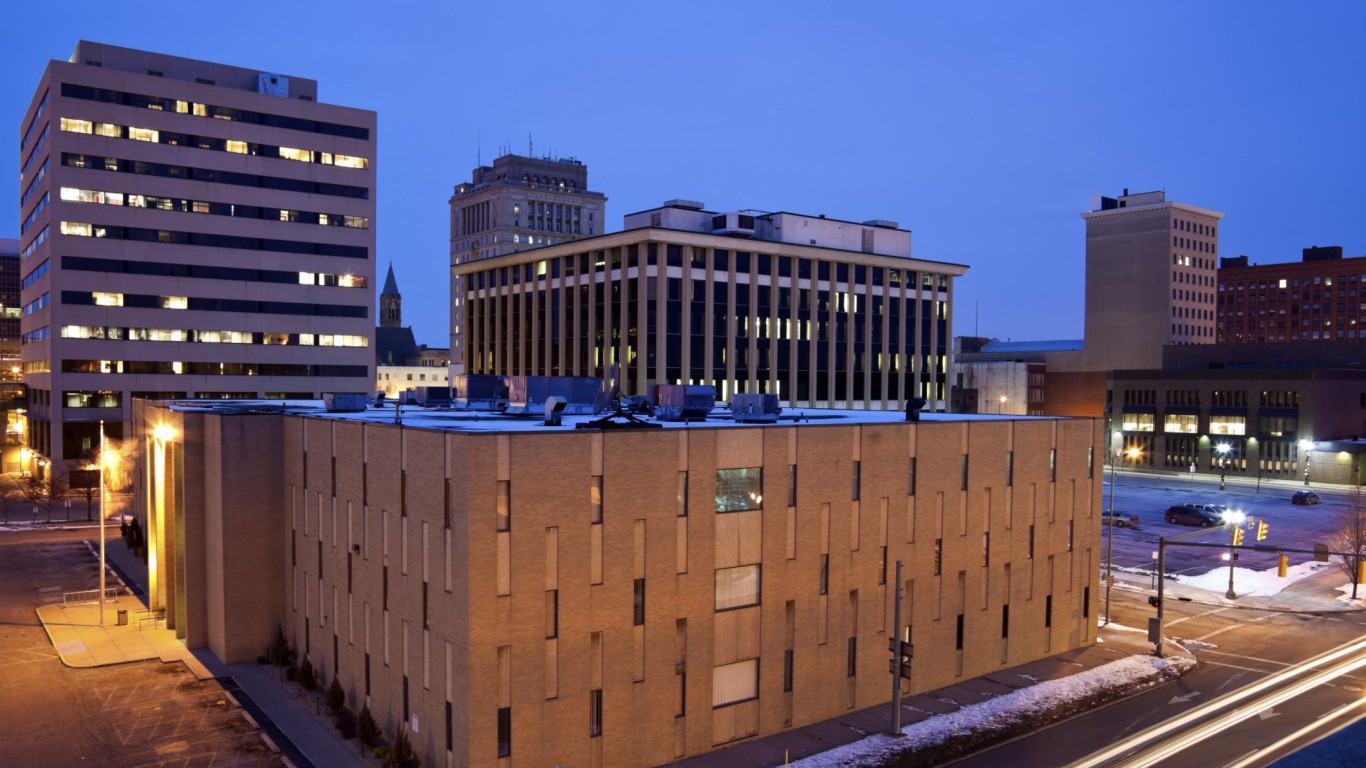
33. Canton, Ohio
> Population: 71,329
> Median home value: $73,400
> Poverty rate: 31.5%
> Pct. with at least a bachelor’s degree: 15.0%
Only 15 cities nationwide have a higher poverty rate than Canton, Ohio, where 31.5% of the population lives below the poverty line. The high poverty rate is likely due in part to the bleak jobs picture. The number of people working in the city fell by 1.3% from 2014 to 2016, and the annual unemployment rate stands at 6.4%. In comparison, employment climbed 3.5% nationwide over the same period and the annual U.S. unemployment rate stands at 4.9%.
Low-income areas often also have low property values, and Canton has some of the cheapest real estate in the country. The typical area home is worth just $73,400 compared to the national median home value of $205,000.
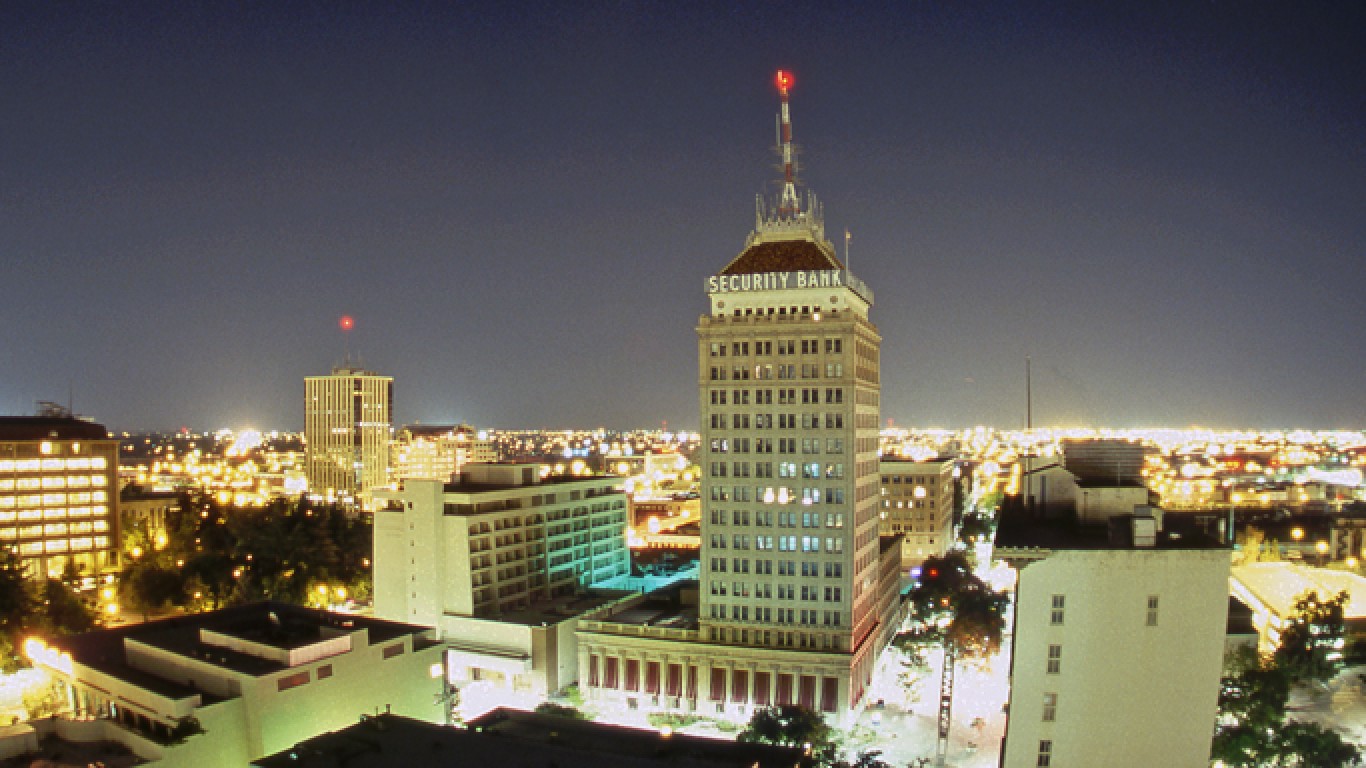
32. Fresno, California
> Population: 522,021
> Median home value: $227,500
> Poverty rate: 28.1%
> Pct. with at least a bachelor’s degree: 21.6%
Fresno is one of half a dozen cities in California to rank among the worst cities to live in nationwide. Like most California cities, Fresno is an expensive place to live. The typical area home is worth $227,500, or about five times the median income of $44,905 in the city. In comparison, the typical American home value of $205,000 is only about 3.6 times the national median income of $57,617.
Fresno is situated in California’s San Joaquin Valley, a region with some of the nation’s worst air quality. In the Fresno area, about 14% of days in a given year have hazardous air quality, compared to only 6% of days nationwide on average.
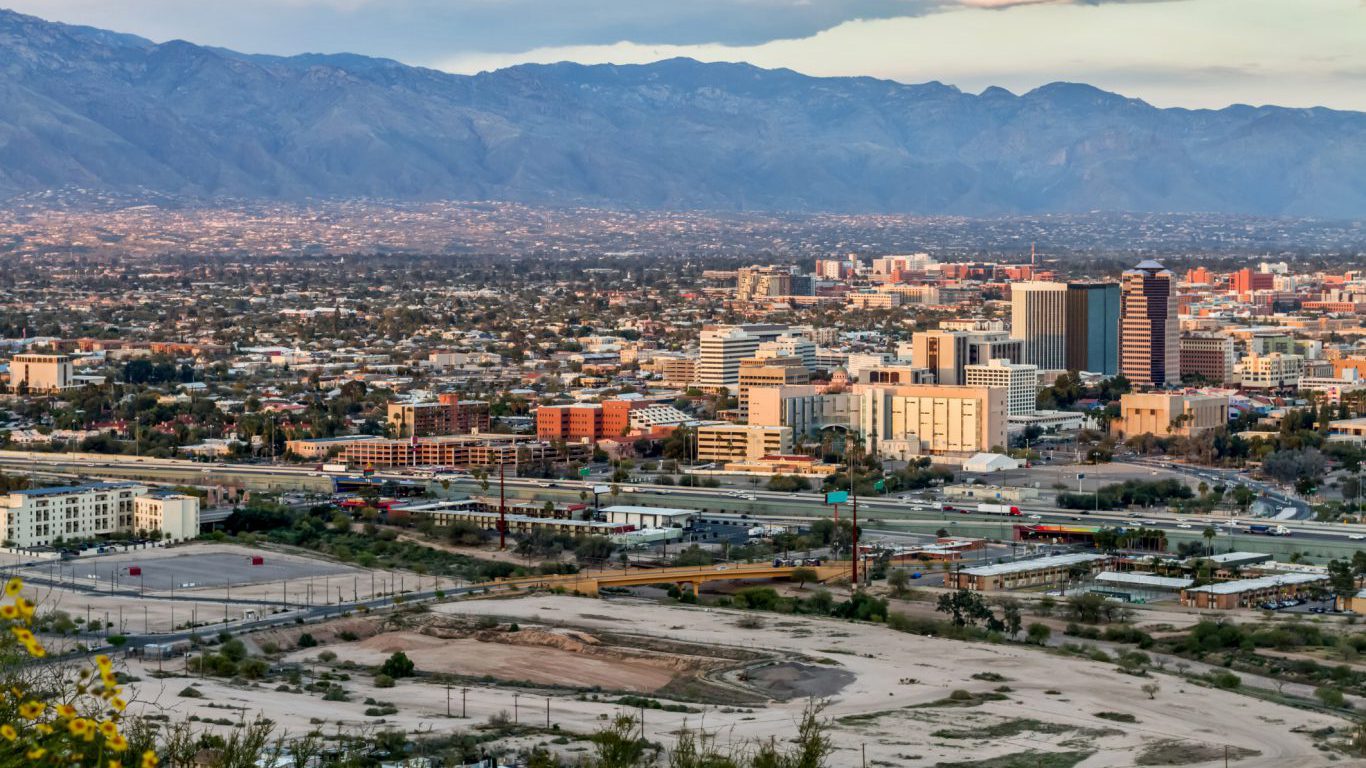
31. Tucson, Arizona
> Population: 530,690
> Median home value: $144,000
> Poverty rate: 24.1%
> Pct. with at least a bachelor’s degree: 26.1%
Tucson is the second most populous city in Arizona and the only city in the state to rank among the worst U.S. cities to live in. The typical Tucson household earns $40,021 a year, only about three-quarters of the median annual household income in Arizona. Additionally, nearly one in every four city residents live in poverty, compared to 14.0% of Americans and 16.4% of people in Arizona. Crime is also relatively common in Tucson. There were 799 violent crimes and 5,891 property crimes in the city in 2016 per 100,000 people, more than double the comparable crime rates on a national scale.
[in-text-ad-2]
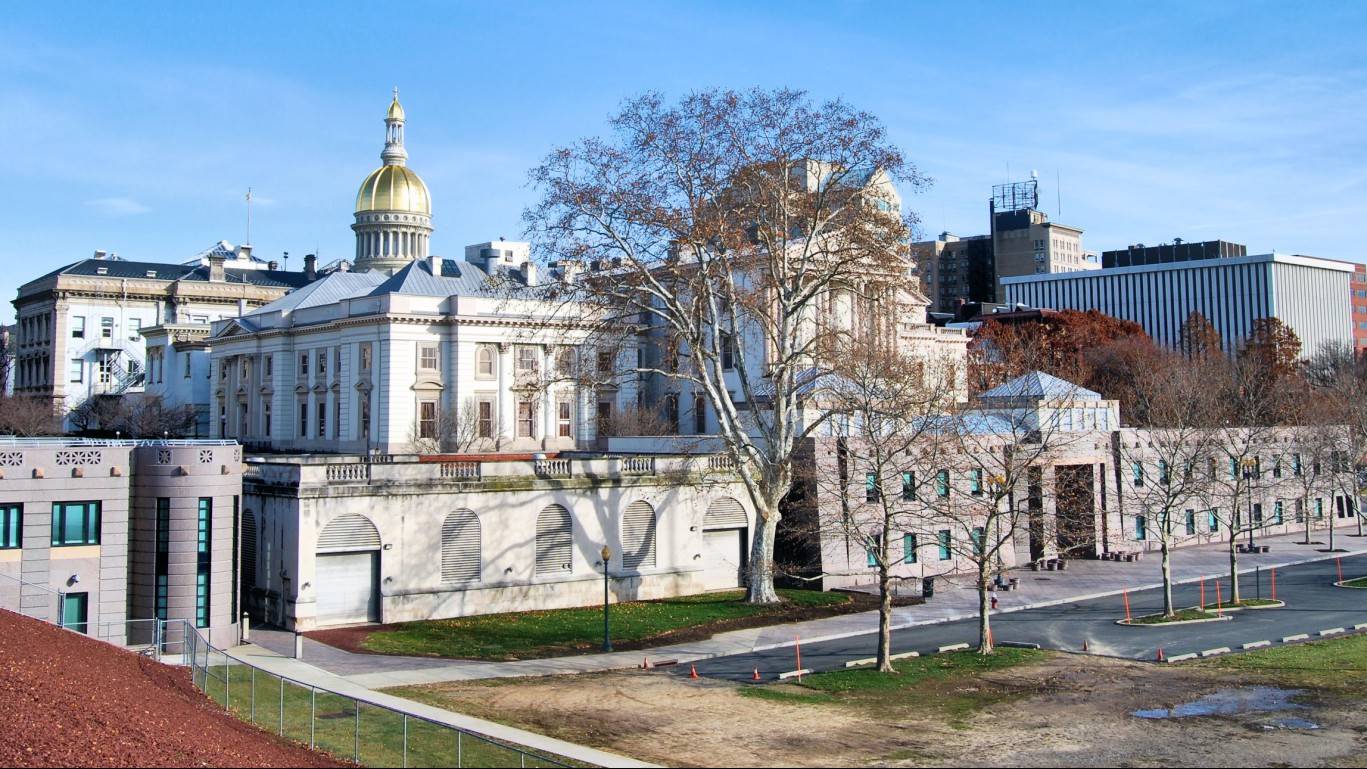
30. Trenton, New Jersey
> Population: 84,065
> Median home value: $86,500
> Poverty rate: 27.8%
> Pct. with at least a bachelor’s degree: 14.8%
In Trenton, one of the poorest cities in the country, more than one in four residents live in poverty, and the typical household earns just $31,592 a year. Low-income Trenton residents live with additional financial stress as goods and services in the county around the New Jersey state capital are about 18% more expensive than they are on average nationwide.
Crime is often more common in poor cities, and Trenton is no exception. There were 1,341 violent crimes for every 100,000 Trenton residents in 2016, a crime rate more than five times that of New Jersey.
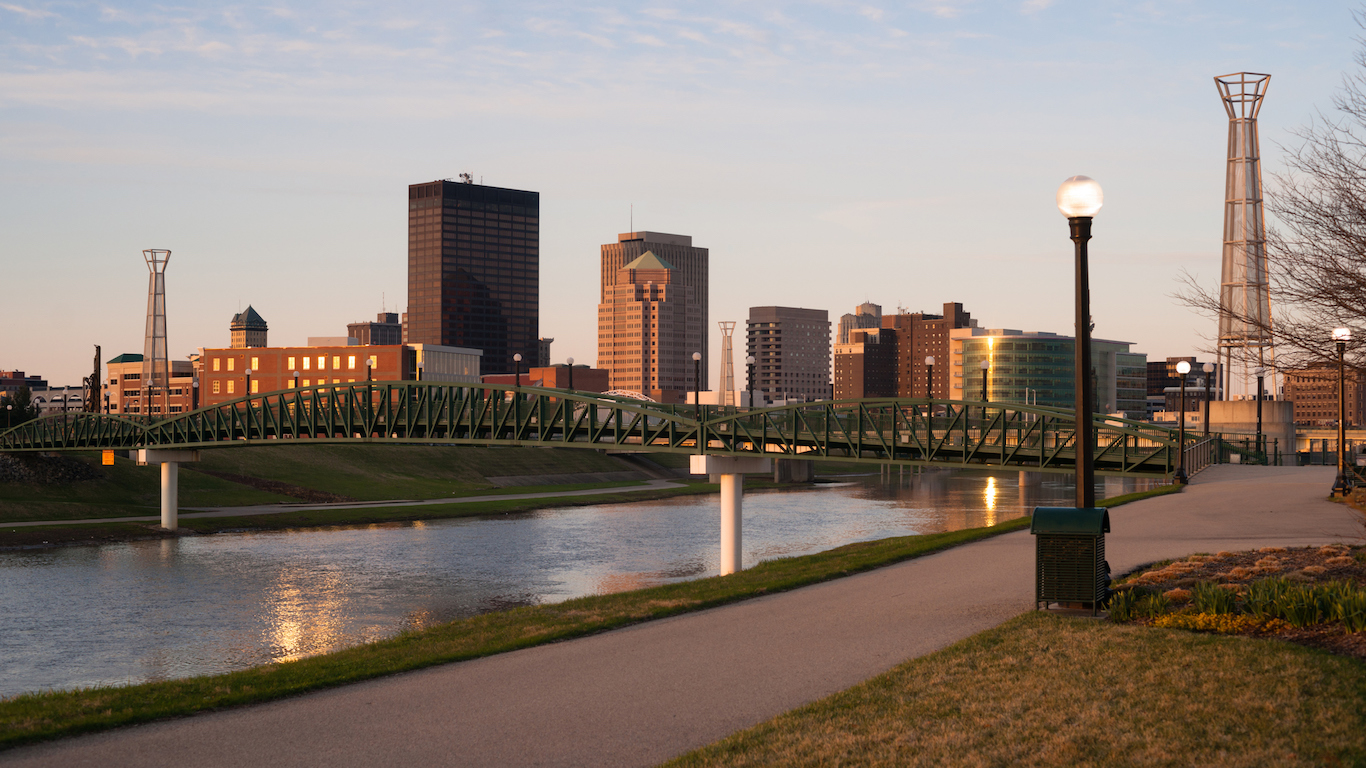
29. Dayton, Ohio
> Population: 140,478
> Median home value: $66,900
> Poverty rate: 32.0%
> Pct. with at least a bachelor’s degree: 16.3%
The median annual household income in Dayton, Ohio, of $28,894 is the sixth lowest among all large U.S. cities. Low-income areas often also have low property values, and Dayton is no exception. The typical home in the city is worth $66,900, also the sixth lowest median home value of any similarly sized city in the United States.
Dayton may be an especially bad place for families with school-aged children. Standardized test scores in Dayton’s public schools are well below the comparable results across Ohio as a whole.

28. Springfield, Massachusetts
> Population: 154,079
> Median home value: $154,300
> Poverty rate: 24.7%
> Pct. with at least a bachelor’s degree: 18.0%
Springfield is the only city in Massachusetts, and one of only three in the broader New England region, to rank among the worst cities to live in. Springfield’s 6.9% unemployment rate is the highest of any Massachusetts city and well above the 4.9% U.S. unemployment rate. The high jobless rate exacerbates financial hardship in the city. About one in every four Springfield residents live below the poverty line, the highest poverty rate of any city in the state.
As is the case with most cities on this list, real estate is relatively inexpensive in Springfield. The typical home is worth $154,300, the lowest median home value of any city in the state and less than half the median home value of $366,900 across Massachusetts.
[in-text-ad]

27. Oakland, California
> Population: 419,987
> Median home value: $649,700
> Poverty rate: 18.9%
> Pct. with at least a bachelor’s degree: 41.1%
Oakland’s median household income of $68,060 a year is the highest of any city on this list and higher even than the median income nationwide of $57,617. However, the city’s high incomes are largely offset by a high cost of living, as goods and services are about 27% more expensive in Oakland than they are nationwide, on average. Housing is particularly expensive. The typical home in Oakland is worth nearly $650,000, or about 10 times the city’s median income. Nationwide, the median home value is worth only about 3.6 times the median income.
A high violent crime rate can often drive down property value, but this has not been the case in Oakland. The city has the highest violent crime rate of any California city at 1,443 incidents per 100,000 residents in 2016.
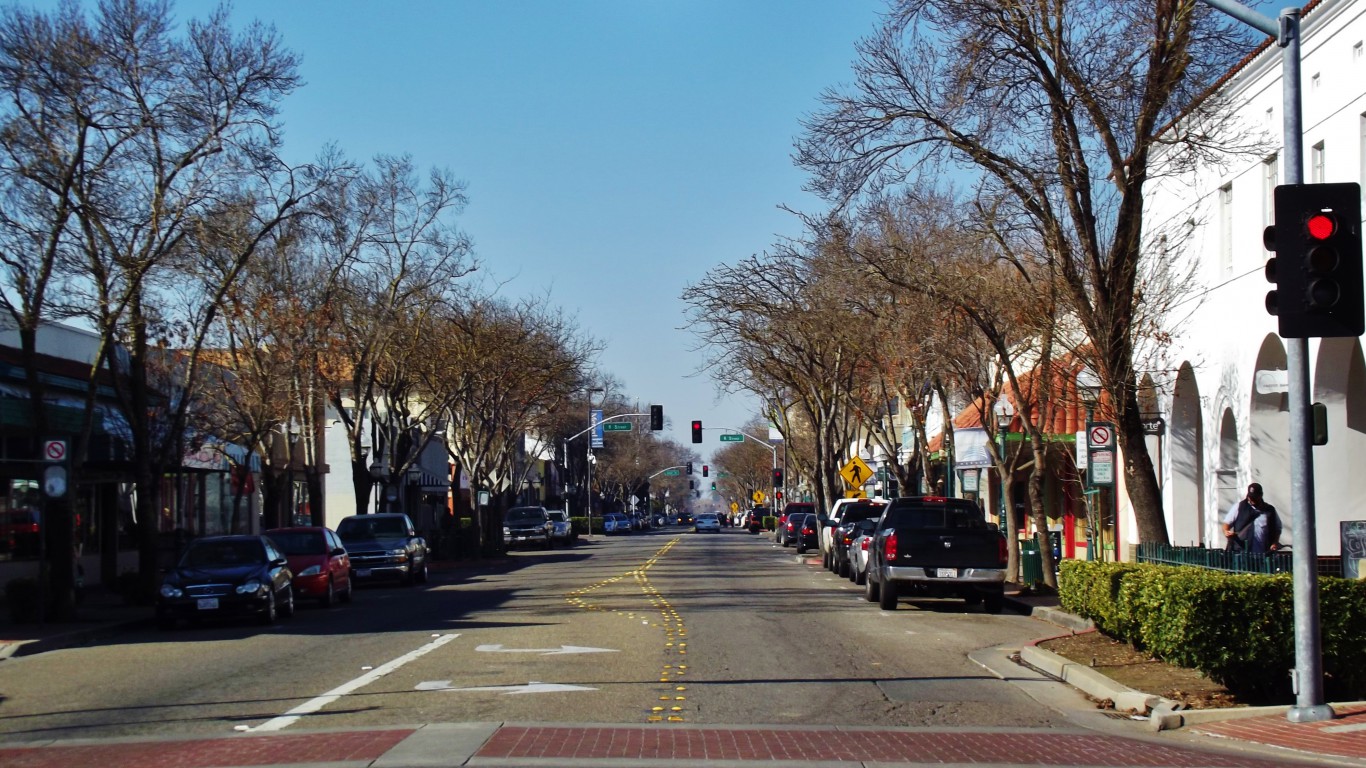
26. Merced, California
> Population: 82,573
> Median home value: $215,400
> Poverty rate: 28.2%
> Pct. with at least a bachelor’s degree: 16.4%
Merced is one of several California cities on this list struggling with high unemployment. About one in every 10 workers in the city are out of a job, the sixth highest unemployment rate of any American city. The high jobless rate may contribute to the city’s high poverty rate. More than one in every four Merced residents live in poverty, well above the 14.0% U.S. poverty rate.
Most American cities have a relatively high concentration of restaurants and bars and places for entertainment, but Merced is an exception. There is a slightly lower than typical concentration of restaurants and eateries in the city, and the concentration of bars is about half the average concentration nationwide.
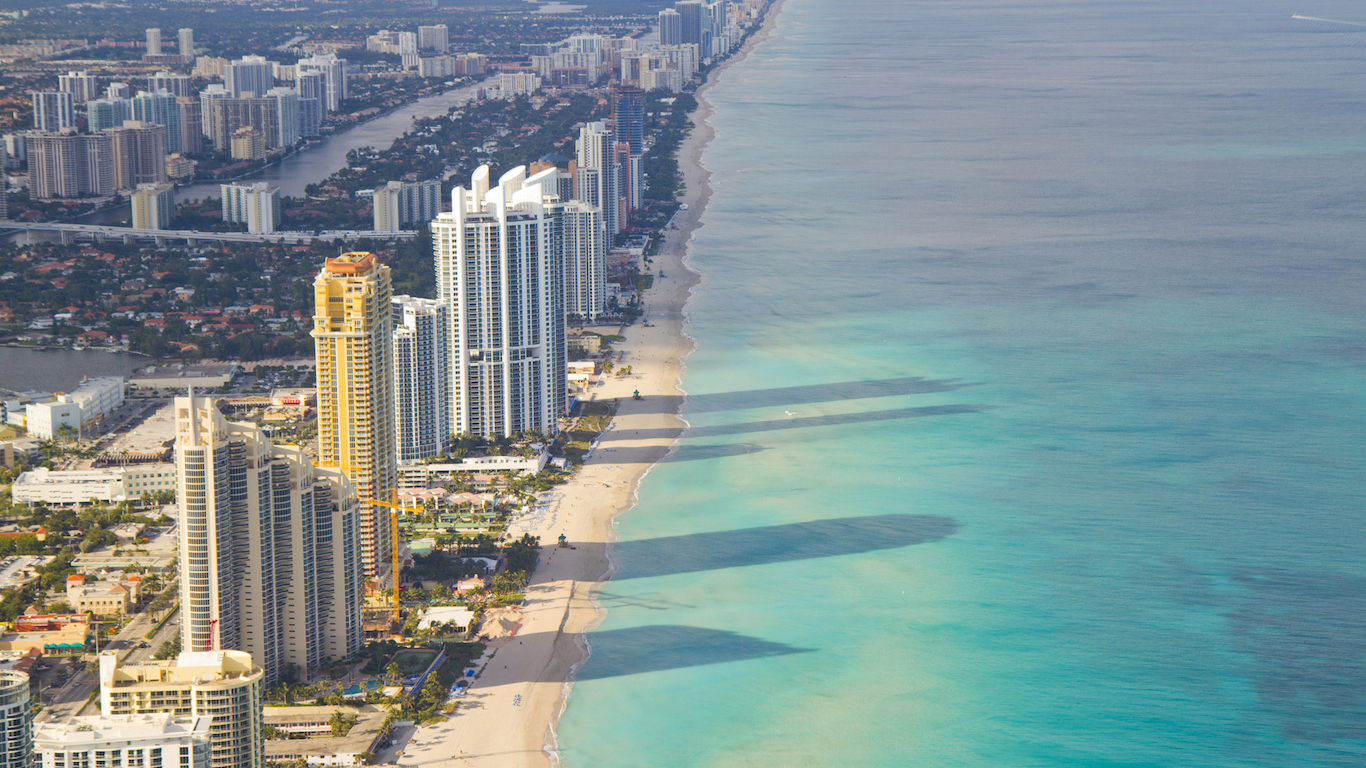
25. Miami Beach, Florida
> Population: 91,905
> Median home value: $479,400
> Poverty rate: 13.5%
> Pct. with at least a bachelor’s degree: 46.2%
Miami Beach — one of three cities on this list in Miami-Dade County — is one of the least affordable cities in the United States. The median home value is just under half a million dollars, about nine times the median household income in the city of $53,685. In comparison, the typical home nationwide is worth just 3.6 times the median household income. High crime rates often drive down property values, but not in Miami Beach. There were 1,023 violent crimes in the city for every 100,000 residents in 2016, nearly triple the national violent crime rate.
Unlike most cities on this list, Miami Beach’s population is well educated. More than 46% of adults in the city have a bachelor’s degree or higher compared to just 31.3% of American adults.
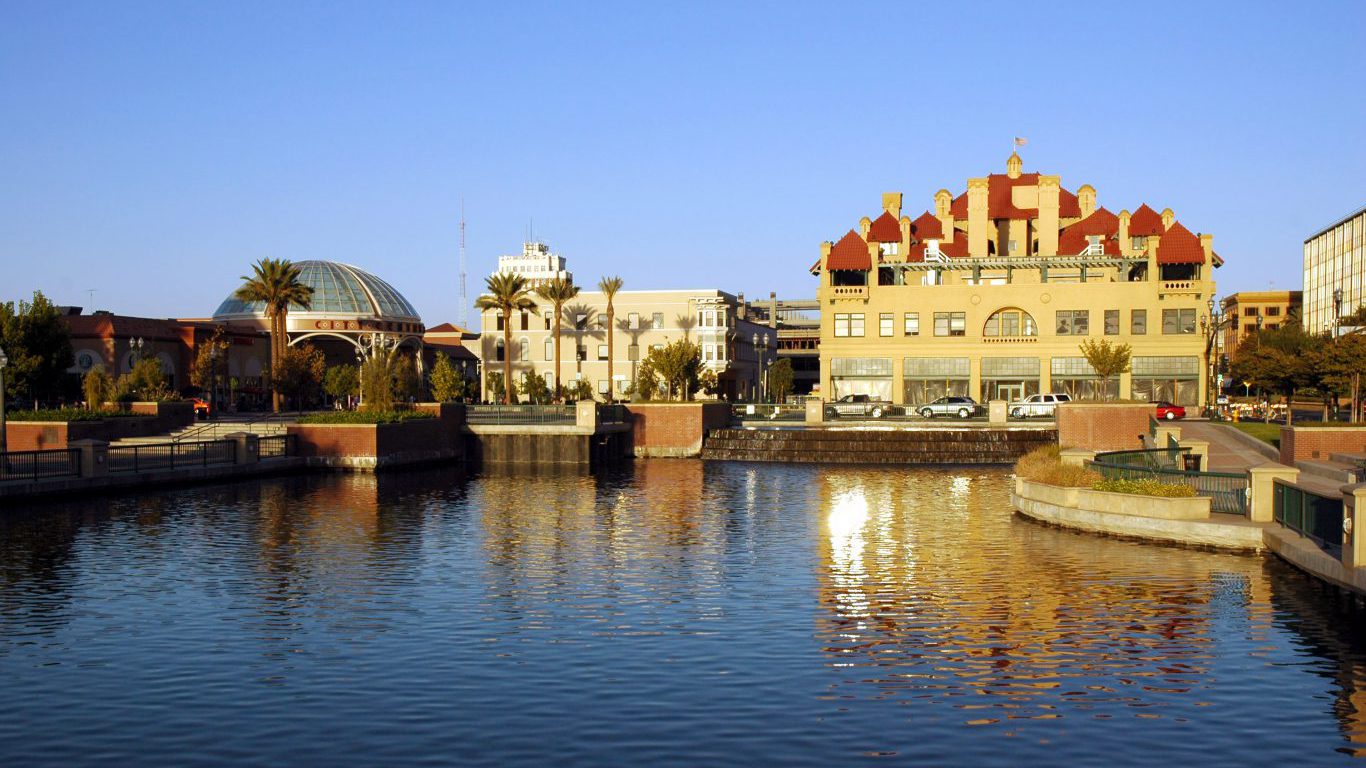
24. Stockton, California
> Population: 307,057
> Median home value: $243,700
> Poverty rate: 17.7%
> Pct. with at least a bachelor’s degree: 16.7%
Stockton has one of the highest unemployment rates of any American city. Some 8.7% of the city’s workforce is out of a job, far higher than the 4.9% U.S. annual unemployment rate. The high jobless rate contributes to the city’s relatively low median income. The typical household in the city earns just $49,271 a year — less than three-quarters of the median income of $67,739 across the state. Low-income residents face further financial strain as the cost of living is relatively high in Stockton. Goods and services are about 7% more expensive in the city than they are on average nationwide.
23. Daytona Beach, Florida
> Population: 66,649
> Median home value: $132,300
> Poverty rate: 20.1%
> Pct. with at least a bachelor’s degree: 21.6%
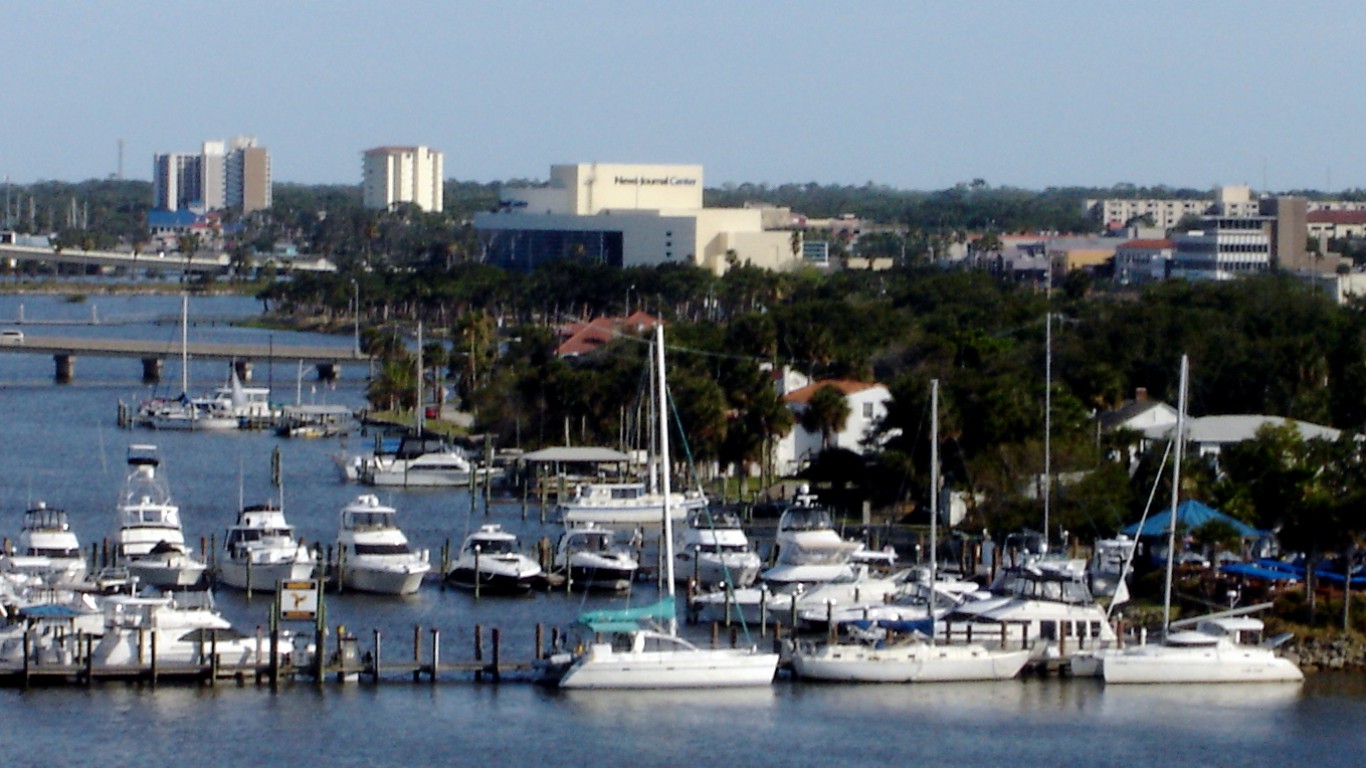
Daytona Beach is one of the poorest cities in the country, with a median annual household income of just $31,273. The city’s low median income is likely due in part to a lack of jobs. Some 6.3% of the Daytona Beach workforce is out of a job, well above the 4.9% annual U.S. unemployment rate.
The lack of jobs may be partly due to the city’s high crime rate, which may drive potential employers and small business owners away. There were 1,221 violent crimes and 6,297 property crimes for every 100,000 Daytona Beach residents in 2016, each nearly triple the comparable national crime rates.
[in-text-ad-2]
22. Charleston, West Virginia
> Population: 50,210
> Median home value: $150,300
> Poverty rate: 20.0%
> Pct. with at least a bachelor’s degree: 38.7%
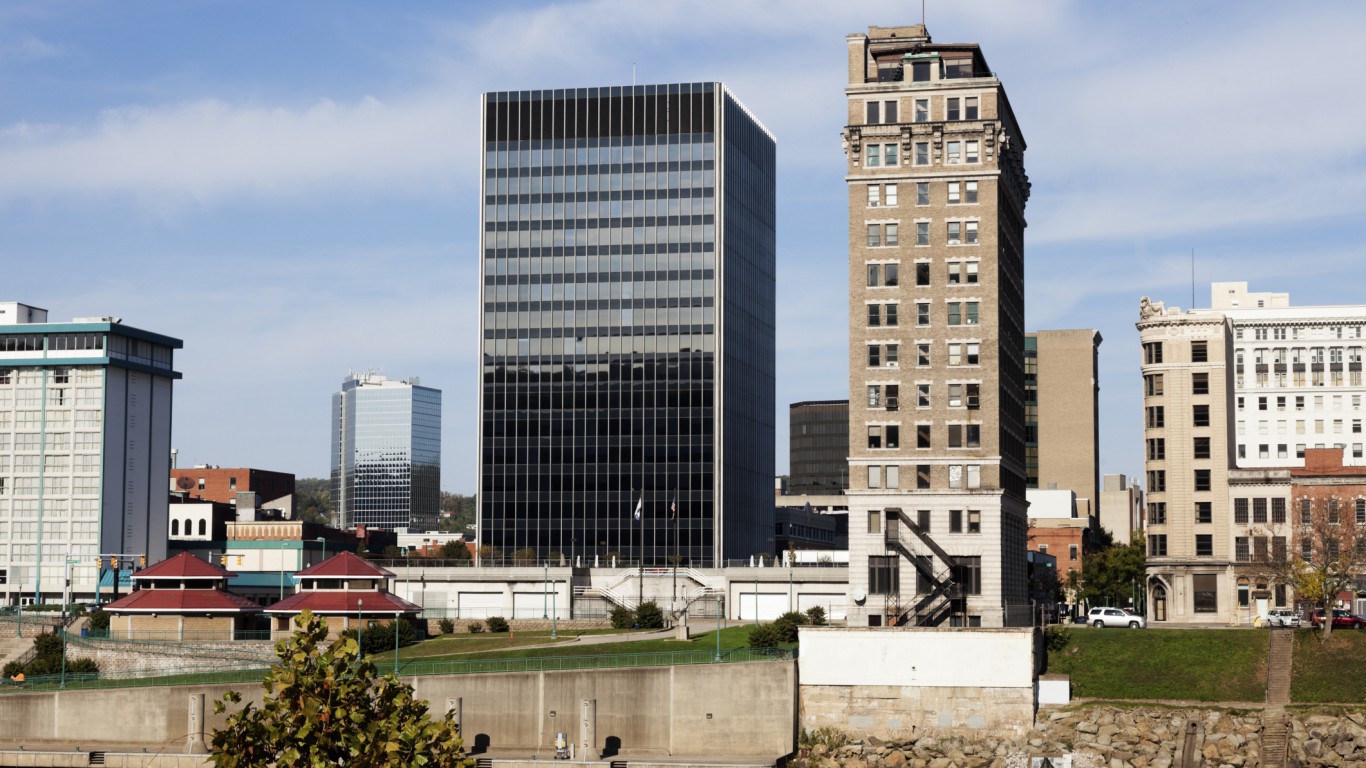
Though the median household income in Charleston of $46,720 a year is considerably lower than the national median of $57,617, a dollar goes further in West Virginia’s capital city. Goods and services are 17% less expensive in Charleston than they are on average nationwide.
However, the city’s low cost of living is likely indicative of its low desirability as a place to live. The city has high crime rates with both violent and property crimes more than three times more common in Charleston than they are nationwide. The city’s air quality is also among the worst in the country. Hazardous air quality is reported on about 18% of days per year, compared to just 6% of days on average nationwide.
[in-text-ad]
21. Shreveport, Louisiana
> Population: 194,472
> Median home value: $150,000
> Poverty rate: 30.8%
> Pct. with at least a bachelor’s degree: 23.3%
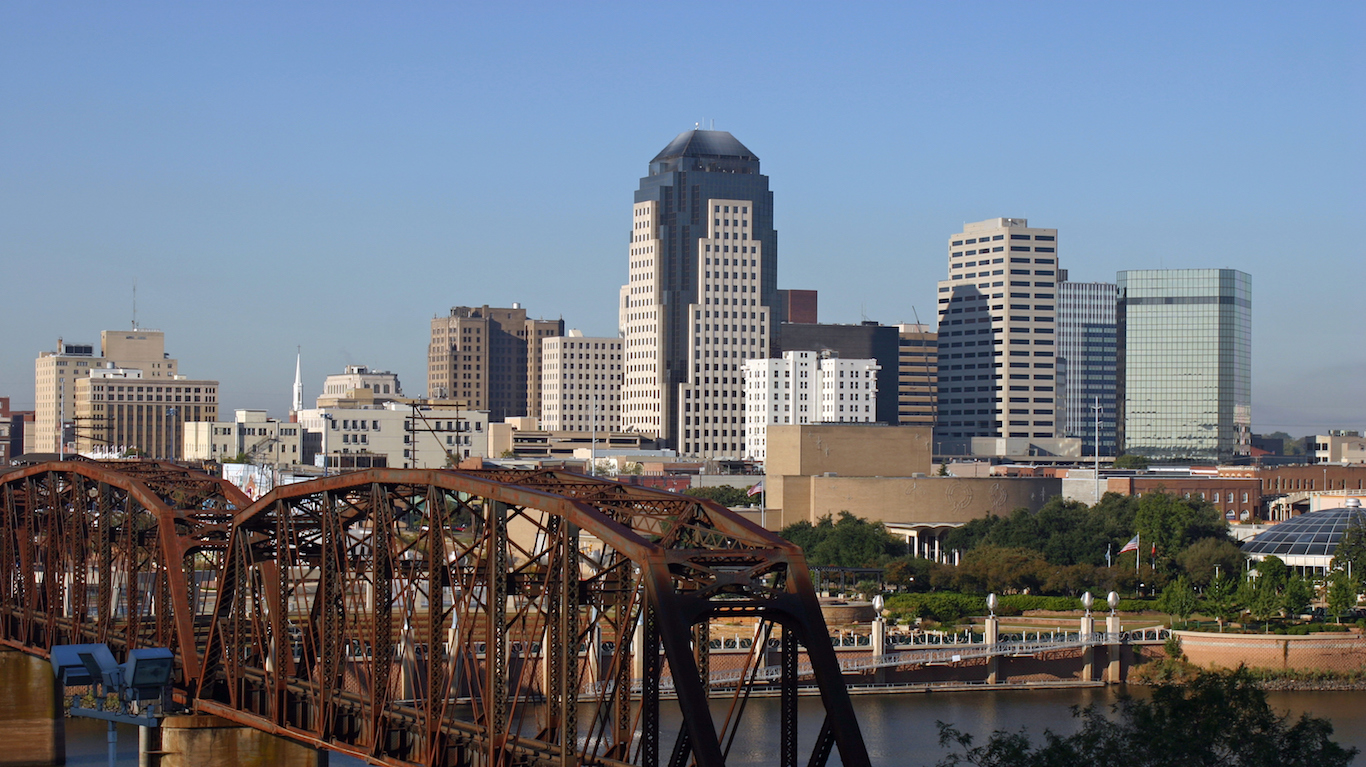
The violent crime rate in Louisiana of 566 incidents for every 100,000 residents is the fifth highest among states. In Shreveport, violence is even more prevalent. There were 959 violent crimes for every 100,000 residents in 2016, nearly double the corresponding state rate. Violence is often more common in poorer areas, and a large share of Shreveport residents face serious financial hardship. Some 30.8% of the city’s population lives below the poverty line compared to the 20.2% of the state’s population and 14.0% of the U.S. population.
Like many cities on this list, Shreveport is losing residents. In the last five years, Shreveport’s population fell by 3.7%, even as the U.S. population grew by 3.7%.
20. Compton, California
> Population: 97,537
> Median home value: $327,900
> Poverty rate: 26.5%
> Pct. with at least a bachelor’s degree: 8.1%
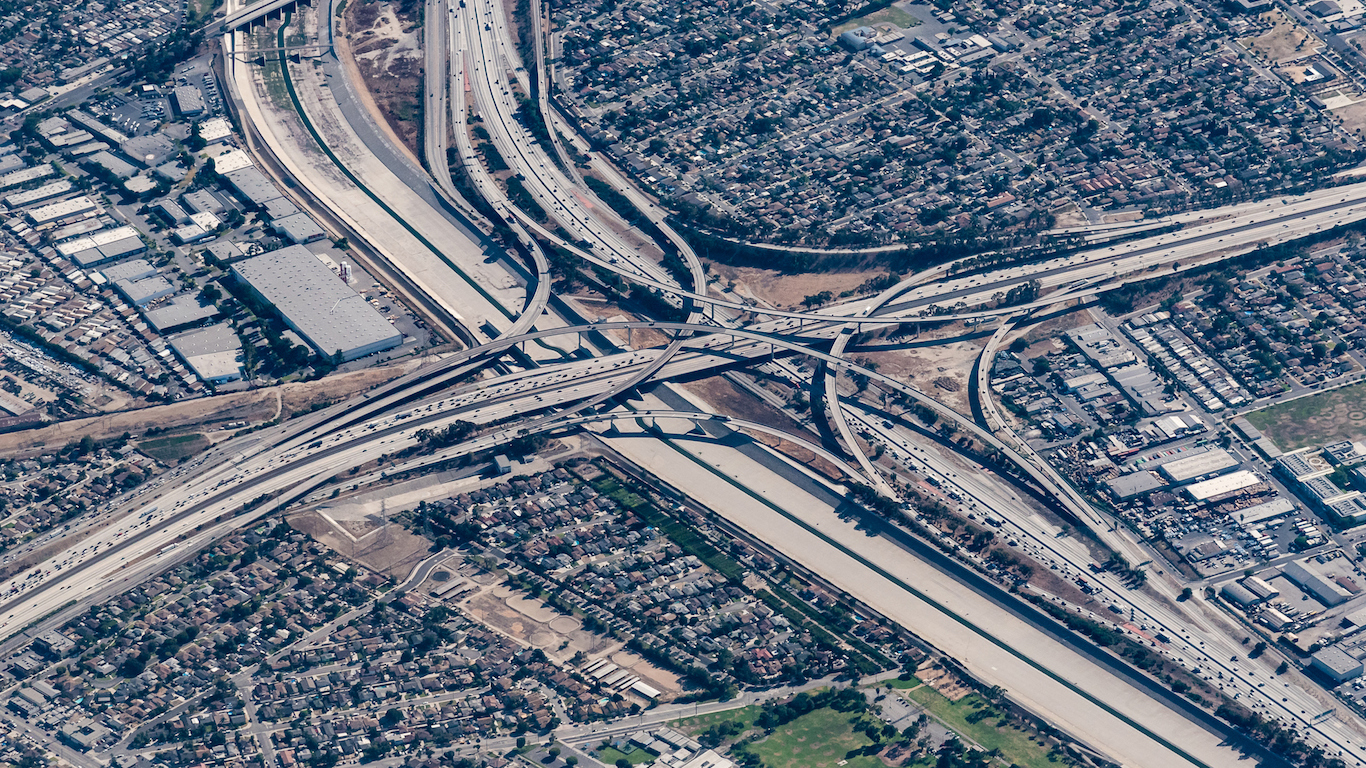
More than one in every four Compton residents live on poverty level income, well above the 14.0% U.S. poverty rate. The high poverty rate is partly attributable to the city’s weak job market. Some 8.2% of workers in Compton are unemployed compared to 4.9% of American workers nationwide. The jobs that are available in the city do not likely pay much. High-paying jobs are often only available to those with a college education, and in Compton, just 8.1% of adults have a bachelor’s degree or higher, less than a third of the U.S. share of 31.3% of adults.
Poor areas often have higher crime rates, and Compton is no different. There were 1,158 violent crimes in the city for every 100,000 residents in 2016, nearly three times the national violent crime rate.
[in-text-ad-2]
19. Little Rock, Arkansas
> Population: 198,546
> Median home value: $161,000
> Poverty rate: 18.8%
> Pct. with at least a bachelor’s degree: 40.2%
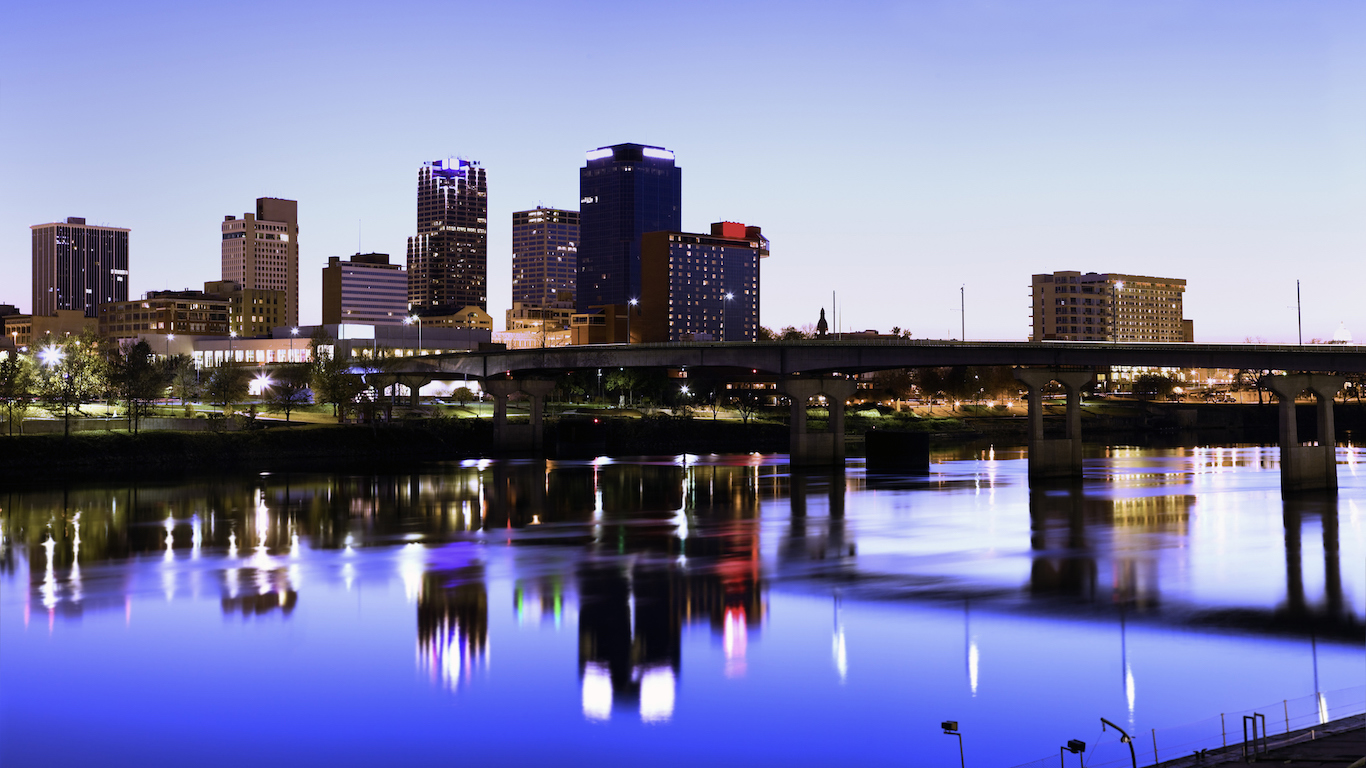
Little Rock, the capital of Arkansas, ranks as the worst city to live in in the state and one of the worst in the country. One of the most dangerous cities in the country, Little Rock’s violent crime rate of 1,533 incidents per 100,000 residents is nearly quadruple the national violent crime rate of 386 incidents per 100,000. The high violent crime rate may discourage some from relocating to or starting a family in the city. In the last decade, Little Rock’s population increased by only 0.2%, even as the U.S. population grew by 7.1%.
Likely due in part to the concentration of jobs common in state capitals that require higher education, a relatively large share of the Little Rock population is college educated. Some 40.2% of the city’s adults have a bachelor’s degree or higher compared to the 31.3% of American adults. Despite a high educational attainment rate, the city’s median household income of $45,605 is about $12,000 below the national median.
18. Gary, Indiana
> Population: 74,186
> Median home value: $64,800
> Poverty rate: 33.3%
> Pct. with at least a bachelor’s degree: 11.0%
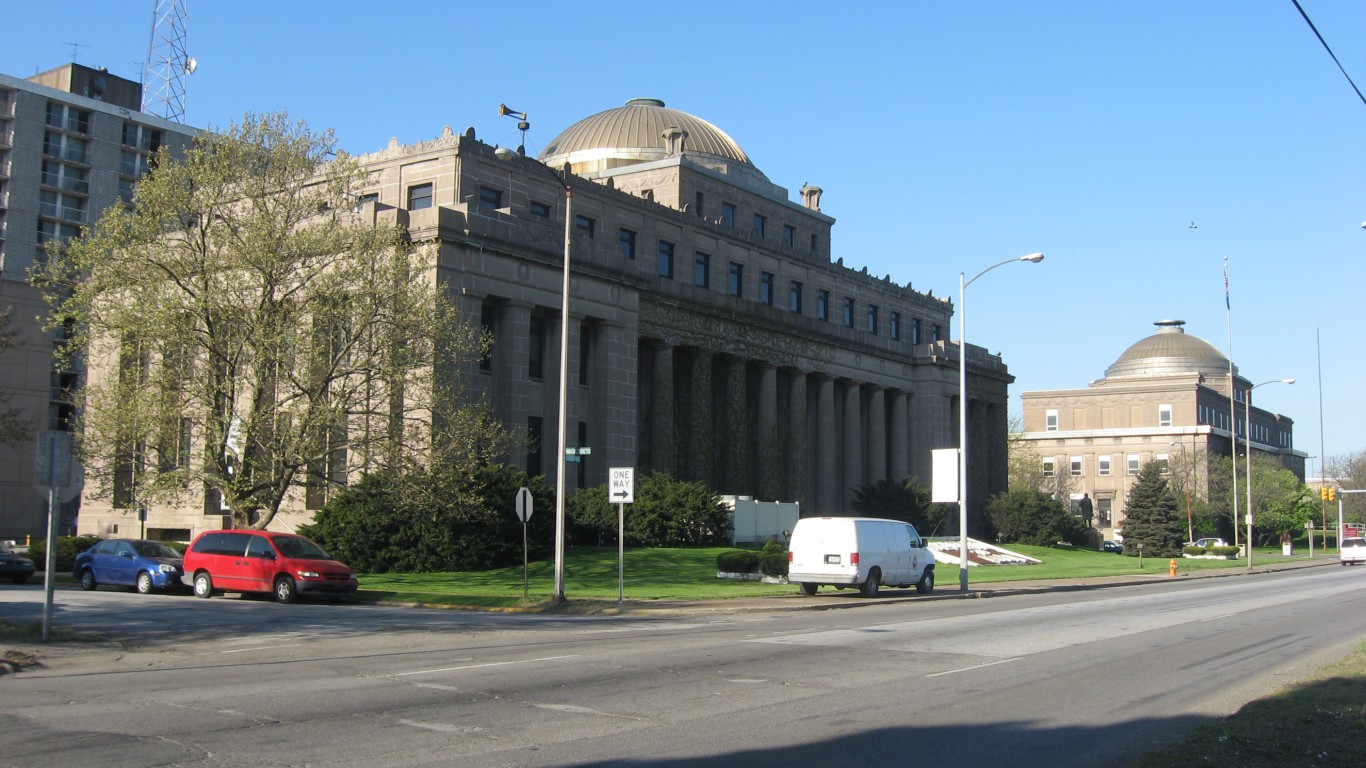
Gary, Indiana, is one of the most economically depressed cities in the country. One in every three city residents live below the poverty line, more than double the national poverty rate of 14.0%. Gary is also one of only a handful of cities nationwide where most households earn less than $30,000 per year. The low incomes are reflected in the area’s depressed real estate values. The typical home in Gary is worth just $64,800, nearly the lowest median home value of any U.S. city.
The financial hardship is due in part to a bleak jobs picture. Gary’s 9.0% unemployment rate is one of the worst in the country and far higher than the annual U.S. unemployment rate of 4.9%.
17. Pueblo, Colorado
> Population: 110,295
> Median home value: $126,200
> Poverty rate: 24.2%
> Pct. with at least a bachelor’s degree: 18.7%
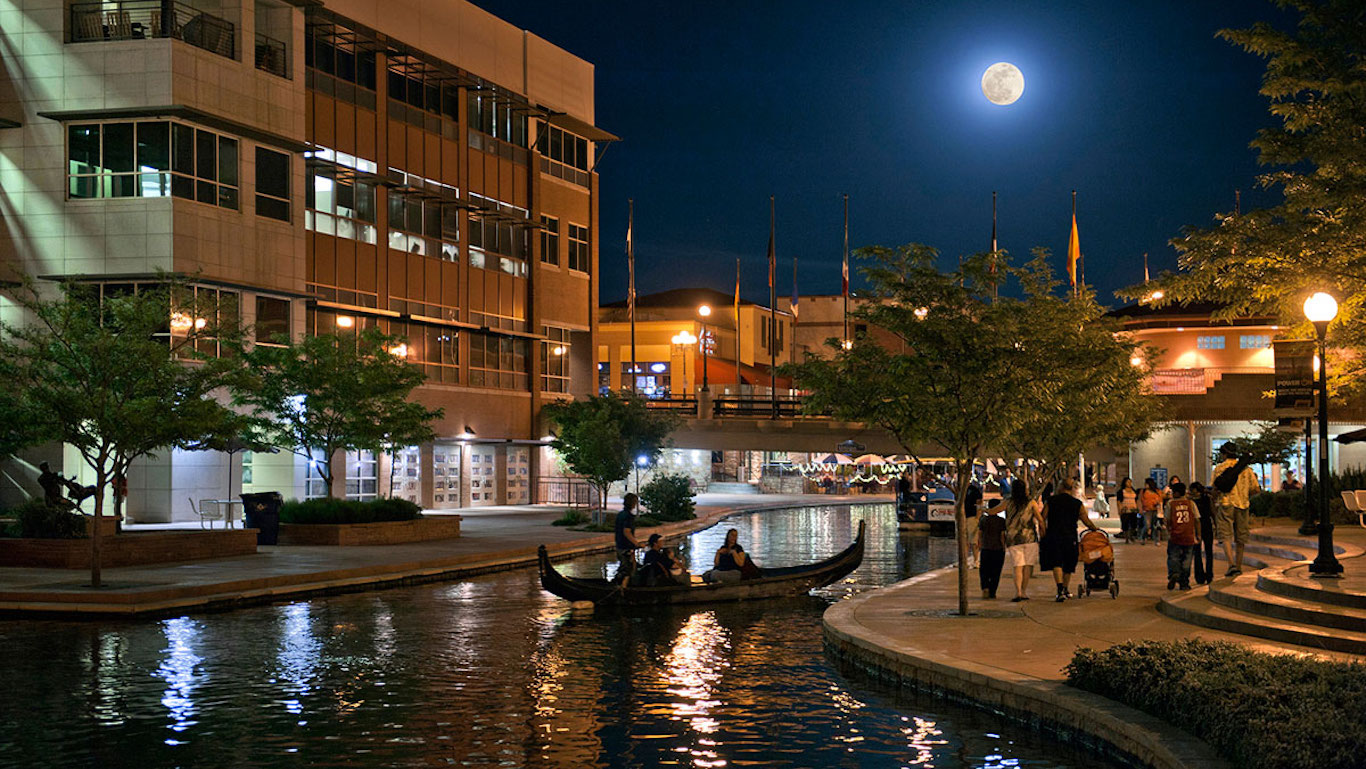
Pueblo is the only Colorado city to rank among the worst cities to live in. The typical household earns just $38,380 a year, by far the lowest median income of any city in the state. Pueblo is also home to many residents struggling with financial hardship. Nearly one in every four residents live below the poverty line, the highest poverty rate of any city in Colorado.
Poor areas are more likely to struggle with crime than affluent cities, and Pueblo is no different. There were 980 violent crimes for every 100,000 residents in 2016, the worst violent crime rate of any city in the state and nearly triple Colorado’s violent crime rate.
[in-text-ad-2]

16. Rockford, Illinois
> Population: 147,404
> Median home value: $89,200
> Poverty rate: 22.6%
> Pct. with at least a bachelor’s degree: 22.6%
The city of Rockford, Illinois, has an unemployment rate of 7.7%, the highest of any city in the state and well above the 4.9% annual U.S. jobless rate. The city also ranks as the most dangerous in the state, with a violent crime rate of 1,658 incidents per 100,000 residents in 2016 — which is more than four times the U.S. violent crime rate.
The week jobs picture and high crime likely depress property values in the city. The typical home in Rockford is worth just $89,200, less than half the median home value of $186,500 across the state.
15. Youngstown, Ohio
> Population: 65,161
> Median home value: $43,300
> Poverty rate: 38.0%
> Pct. with at least a bachelor’s degree: 12.0%
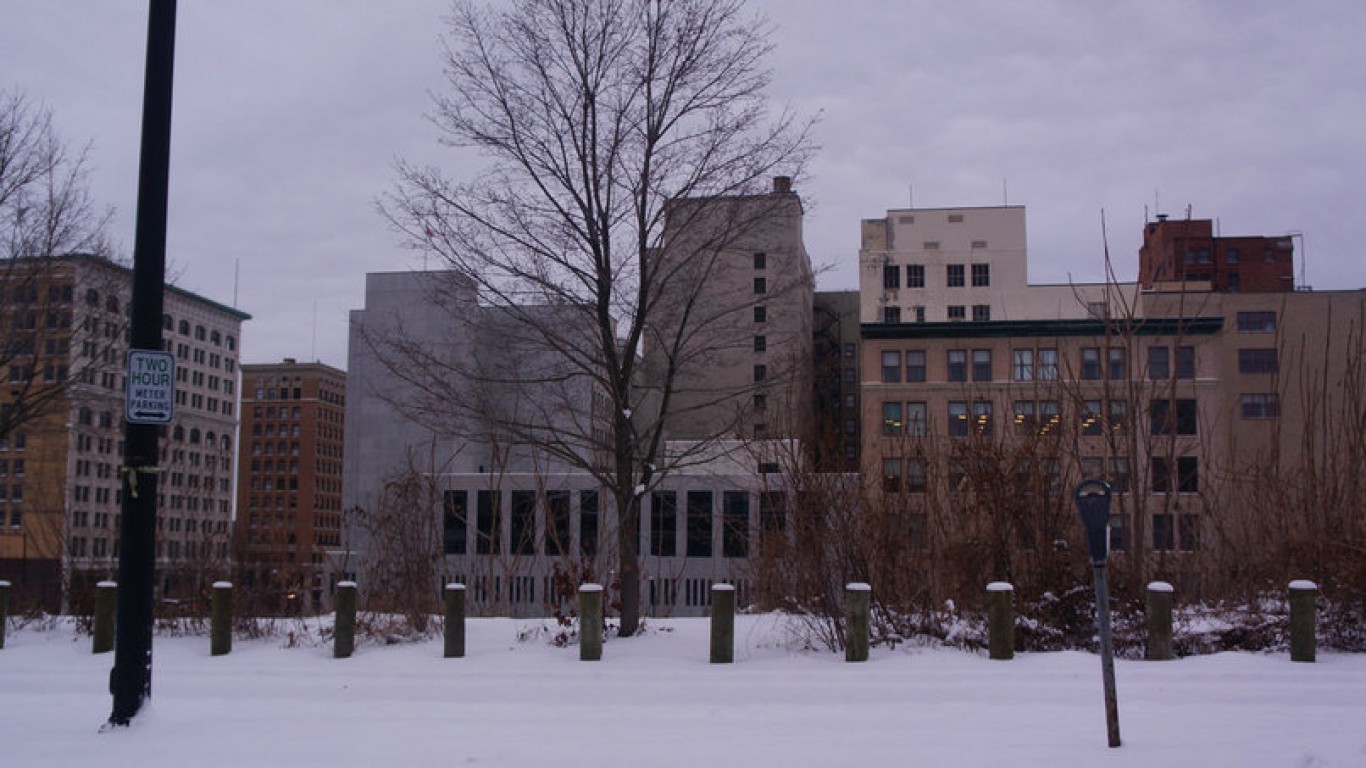
Youngstown, Ohio, is one of the poorest cities in the United States. Some 38.0% of the population lives below the poverty line, the third highest poverty rate among U.S. cities. Youngstown is also the only U.S. city where more than half of all households earn less than $25,000 a year. The low incomes are reflected in the city’s low property values. The typical home in Youngstown is worth just $43,300, less than a quarter of the national median home value of $205,000.
Like many poor cities, crime rates are high in Youngstown. There were 3,780 property crimes for every 100,000 city residents in 2016, well above the national property crime rate of 2,451 per 100,000.

14. San Bernardino, California
> Population: 216,242
> Median home value: $240,400
> Poverty rate: 29.4%
> Pct. with at least a bachelor’s degree: 9.1%
San Bernardino is the second worst city to live in in California and one of the worst in the country. San Bernardino’s 29.4% poverty is the third highest in the state and more than double the U.S. poverty rate. Widespread financial hardship is likely tied to the lack of available jobs in the city. Some 7.3% of workers are out of a job, well above the 5.4% statewide unemployment rate. Employers and small business owners may be discouraged from operating in the city because of the high concentration of crime. There were 1,331 violent crimes in the city for every 100,000 residents in 2016, about three times the statewide violent crime rate.
[in-text-ad]
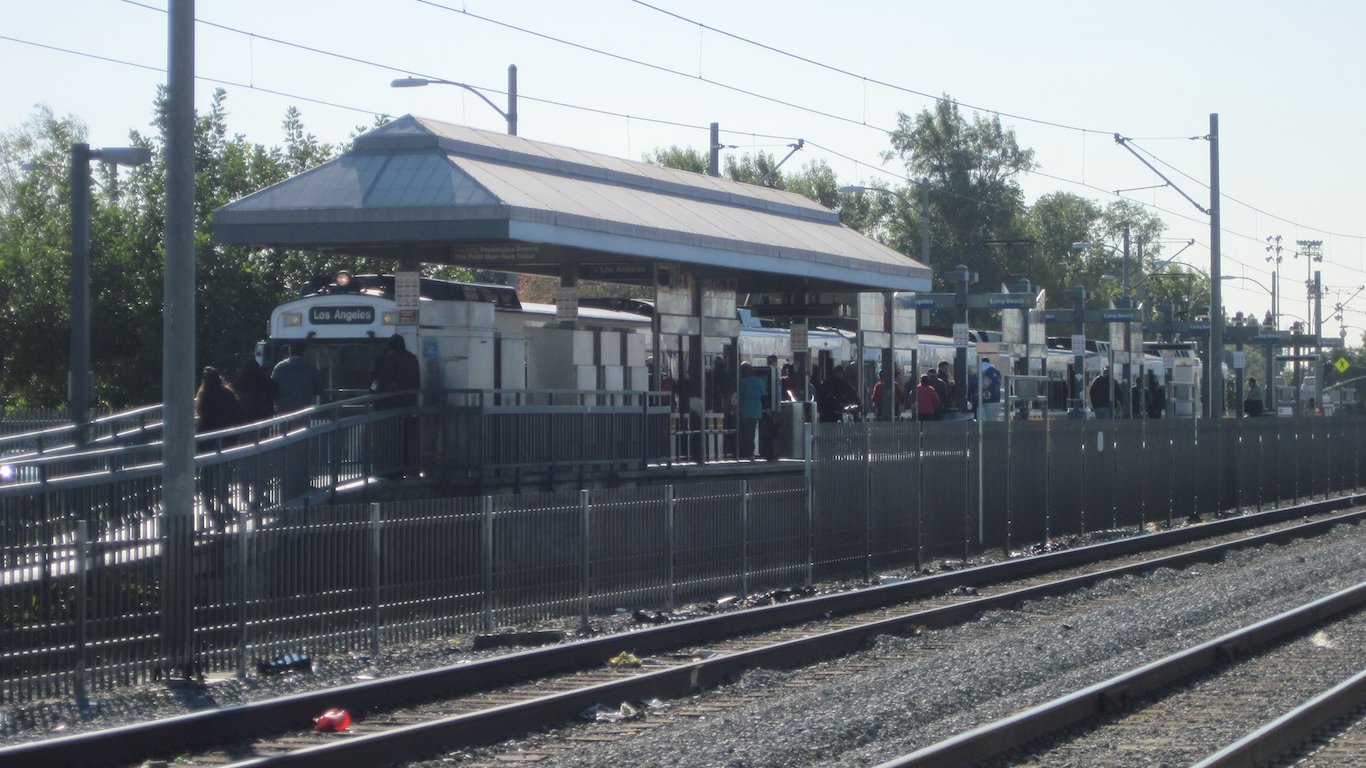
13. Florence-Graham, California
> Population: 63,390
> Median home value: $267,800
> Poverty rate: 31.5%
> Pct. with at least a bachelor’s degree: 4.4%
The typical household in Florence-Graham earns just $34,738 a year, almost half the $67,739 the typical California household earns. The city’s lower income residents face additional financial strain with a high cost of living. Goods and services in Florence-Graham are about 37% more expensive than they are on average nationwide.
High-paying jobs are often only available to those with a college education and the low incomes in Florence-Graham may be attributable to a relative lack of college-educated workers. Just 4.4% of adults in the city have a bachelor’s degree or higher, the smallest share of any U.S. city and just a fraction of the national bachelor’s degree attainment rate of 31.3%.
[in-text-ad-2]
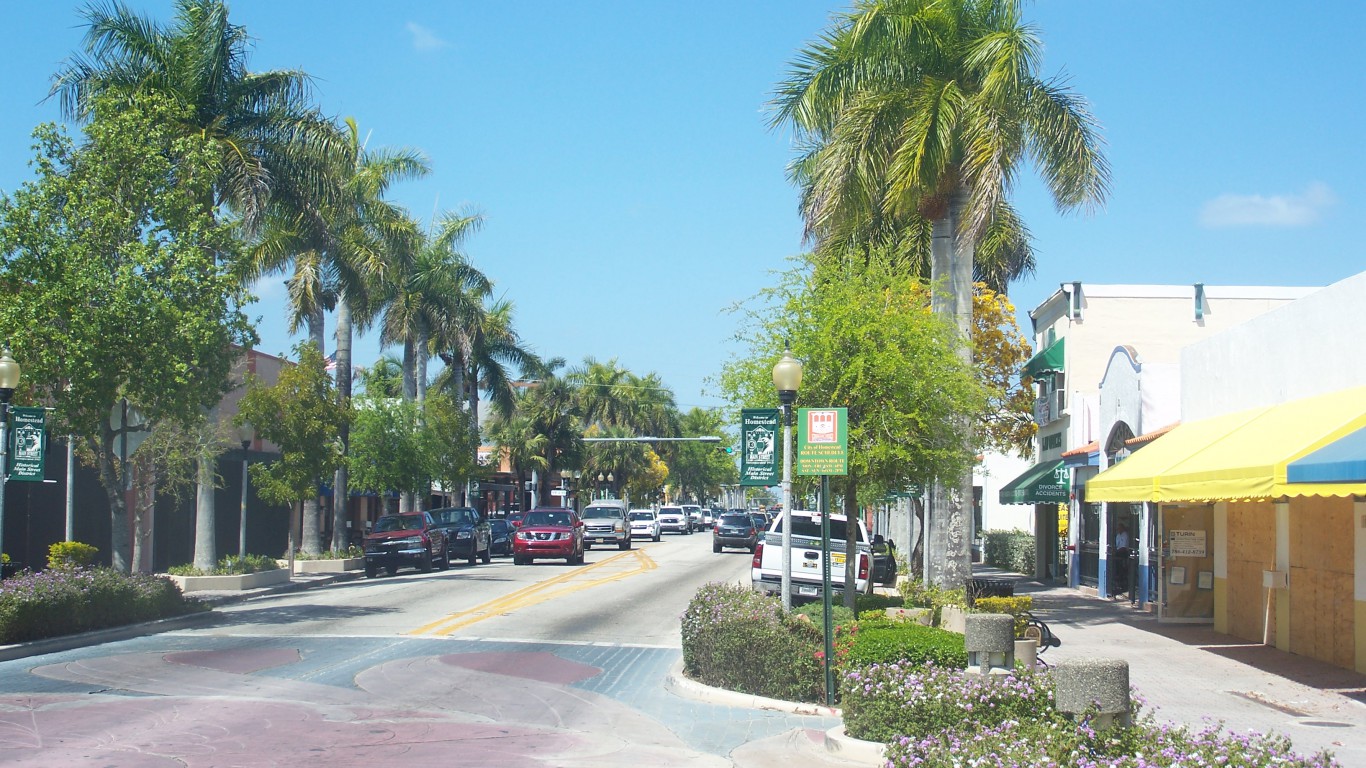
12. Homestead, Florida
> Population: 68,000
> Median home value: $204,800
> Poverty rate: 33.9%
> Pct. with at least a bachelor’s degree: 17.2%
One of three cities in Miami-Dade County to rank among the worst places in the country to live, Homestead is the worst city in Florida and 14th worst nationwide. The typical household in Homestead earns just $32,001 a year compared to the national median income of $57,617. Residents’ financial strain is compounded by the city’s a high cost of living. Goods and services are 15% more expensive in Homestead than they are on average nationwide.
Most cities have high concentrations of bars, restaurants, and cafes, but Homestead is an exception. The number of bars and restaurants in for every 100,000 people is less than half the average concentration across the United States as a whole.
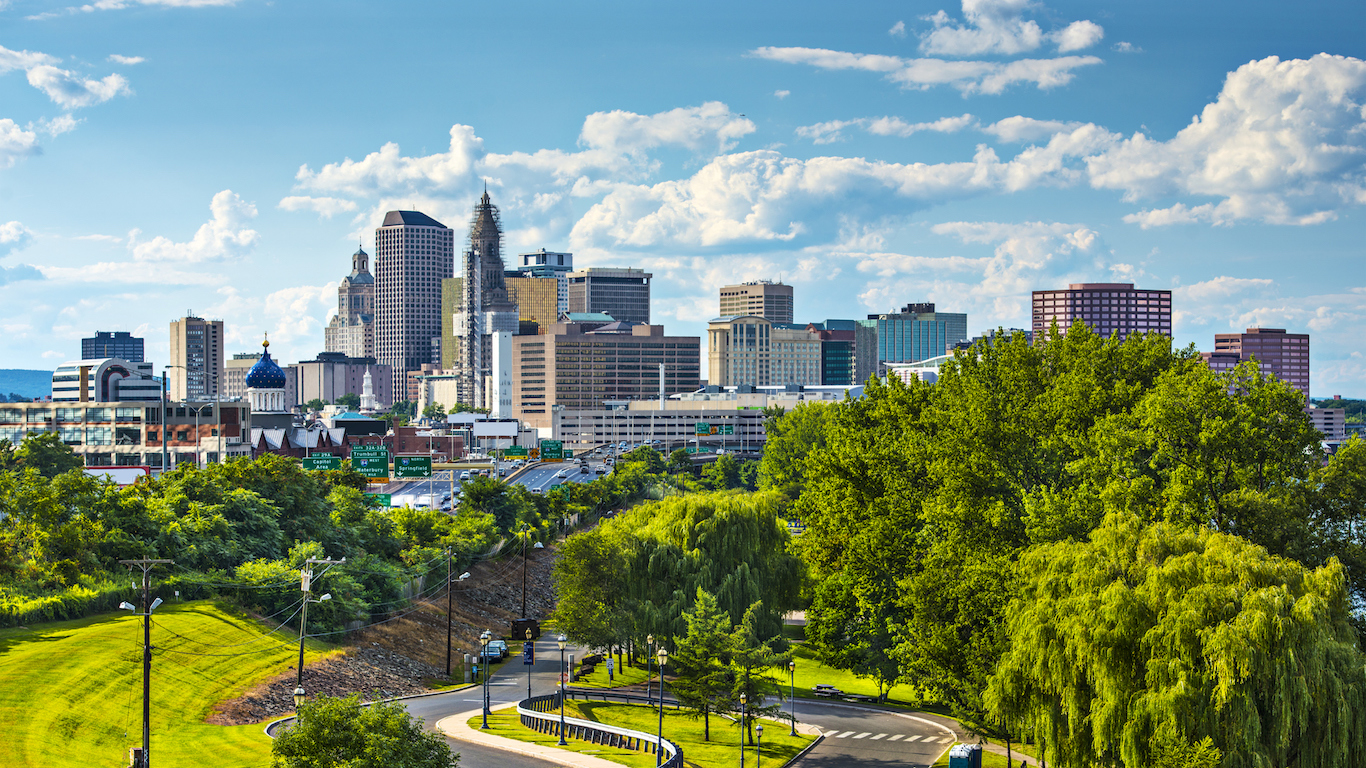
11. Hartford, Connecticut
> Population: 123,287
> Median home value: $161,200
> Poverty rate: 27.3%
> Pct. with at least a bachelor’s degree: 16.8%
Hartford is the worst city to live in in both Connecticut and the broader New England region. The typical Hartford household earns $36,637 a year, less than half the median income in Connecticut of $73,433. Low-income individuals in the city are put under additional financial strain as goods and services are 17.3% more expensive in the city than they are on average nationwide. A bleak jobs picture in the city is partially to blame for the low median income. Some 9.4% of workers are out of a job, the largest share in New England and nearly double the 4.9% 2016 annual U.S. unemployment rate.
The city’s poor economic conditions may be driving people out of Hartford. In the last five years, Hartford’s population shrank by 1.3% even as the national population increased by 3.7%.
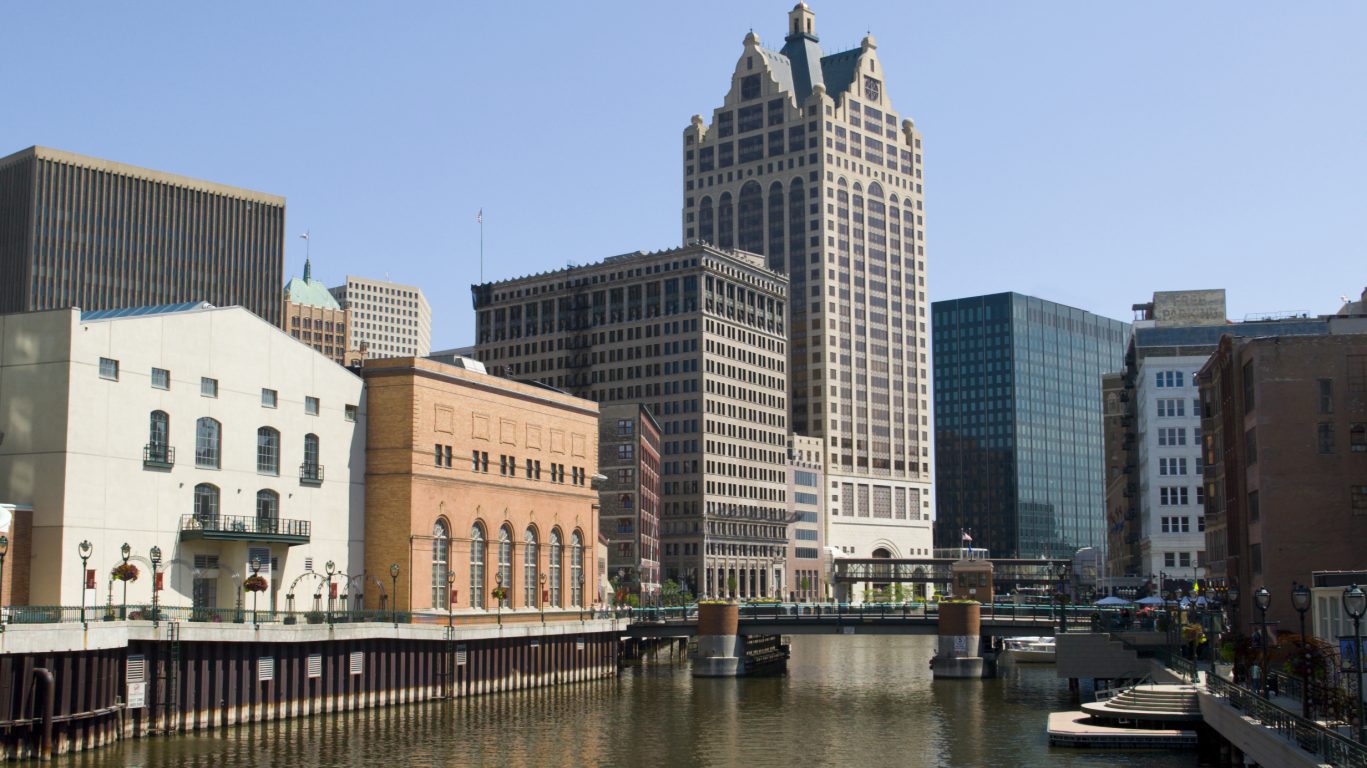
10. Milwaukee, Wisconsin
> Population: 595,070
> Median home value: $114,700
> Poverty rate: 26.7%
> Pct. with at least a bachelor’s degree: 23.3%
More than one in every four MIlwaukee residents live in poverty, more than double the 11.8% state poverty rate. Poor cities often have higher crime rates than more affluent cities, and Milwaukee is no exception. There were 1,546 violent crimes for every 100,000 Milwaukee residents, more than five times the statewide violent crime rate of 306 per 100,000.
As is the case with nearly every Midwestern city on this list, Milwaukee’s population is shrinking. In the last five years, the city’s population count fell by 0.5%, even as the U.S. population grew by 3.7%.
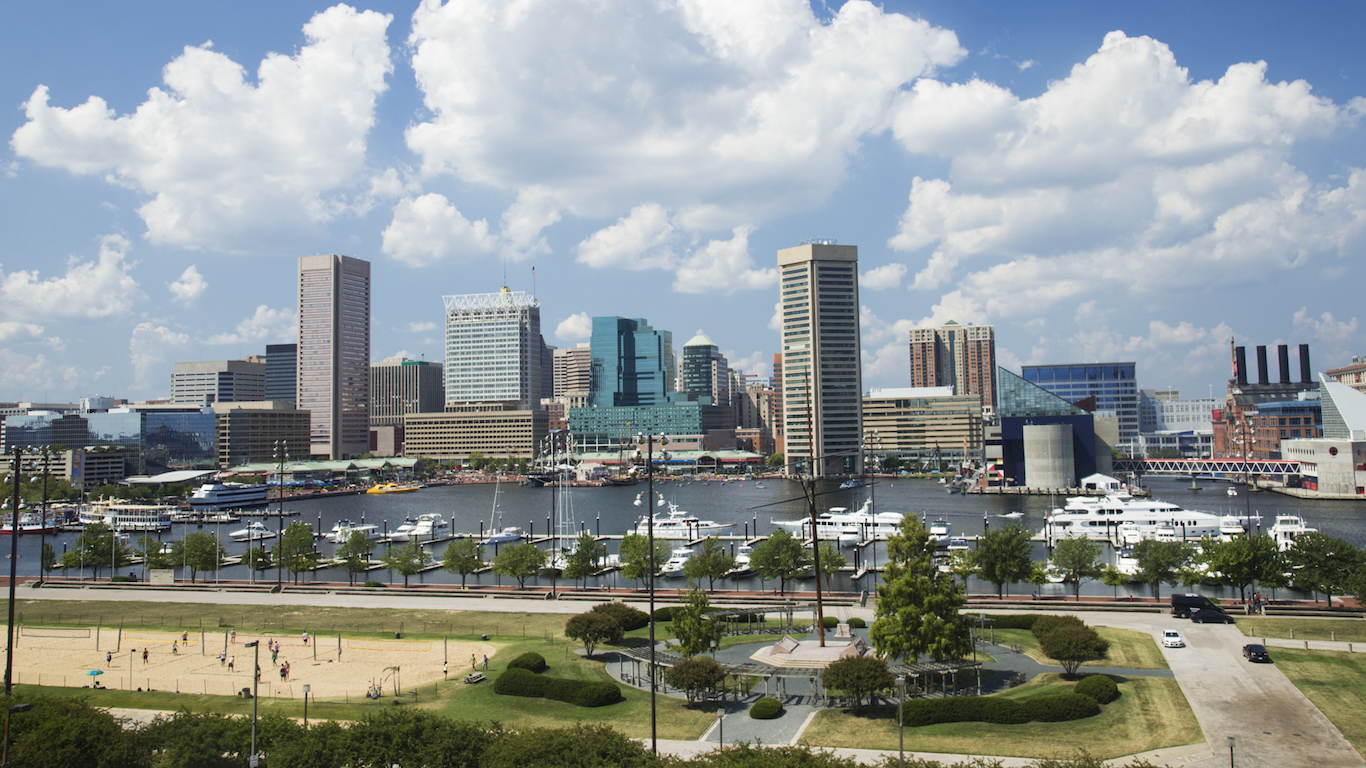
9. Baltimore, Maryland
> Population: 614,664
> Median home value: $153,500
> Poverty rate: 21.9%
> Pct. with at least a bachelor’s degree: 30.8%
Baltimore’s median annual household income of $47,350 is the lowest of any city in Maryland. The city’s poor households face additional strain because of the high cost of living. Goods and services are about 12% more expensive in Baltimore than they are nationwide on average.
Long commutes cut into personal time and can diminish overall quality of life. In Baltimore, a city with some of the most congested roadways in the country, the average commute time is over half an hour, longer than in the vast majority of American cities.
[in-text-ad]
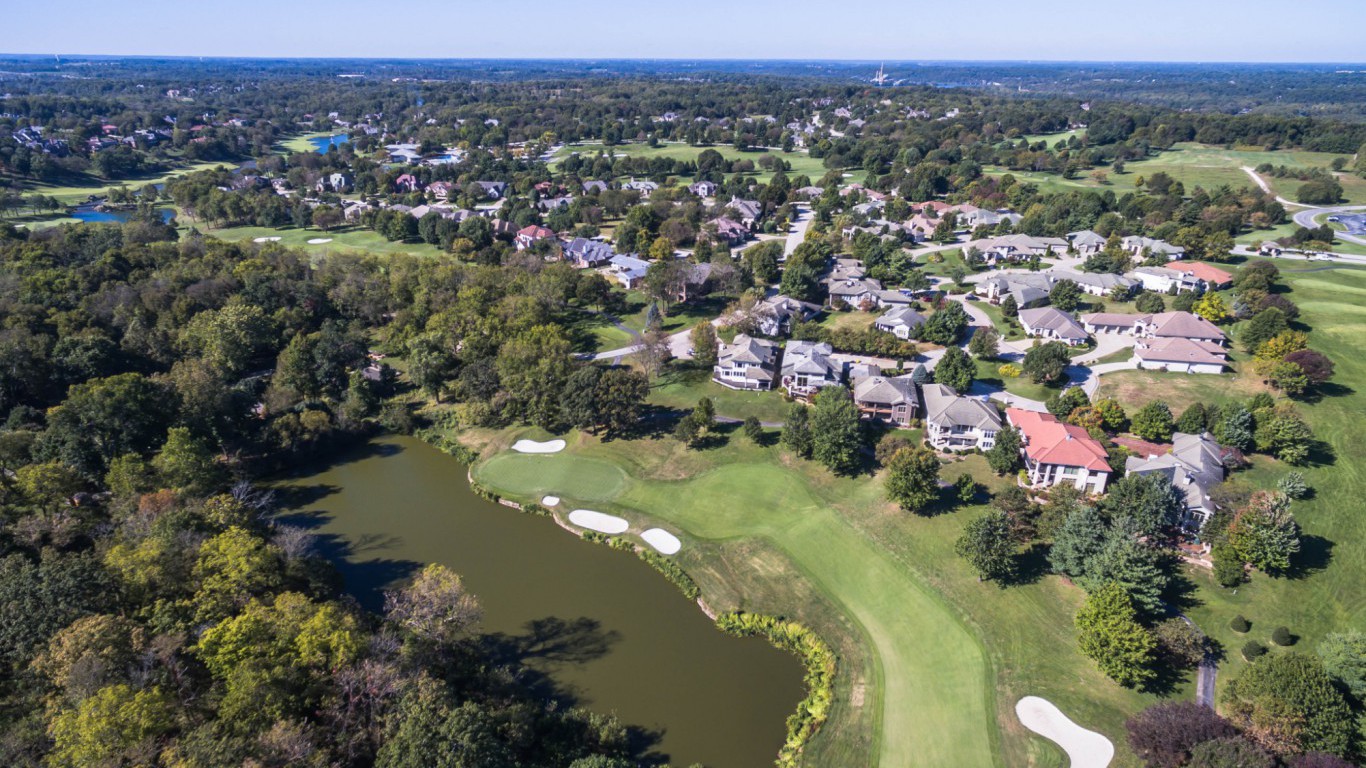
8. Springfield, Missouri
> Population: 167,313
> Median home value: $115,900
> Poverty rate: 24.6%
> Pct. with at least a bachelor’s degree: 25.7%
Along with St. Louis, Springfield is one of two Missouri cities to rank among the worst cities to live in. As is also the case in St. Louis, crime detracts considerably from overall quality of life in Springfield. There were 1,345 violent crimes for every 100,000 city residents in 2016, more than triple the U.S. violent crime rate. Additionally, there were 8,518 property crimes in the city for every 100,000 people in 2016, the third highest property crime rate in the United States.
A large share of Springfield residents struggle financially. About one in every four city residents live below the poverty line, the largest share of any large city in the state.

7. Albany, Georgia
> Population: 74,904
> Median home value: $88,800
> Poverty rate: 32.5%
> Pct. with at least a bachelor’s degree: 20.1%
The populations of several cities on this list are shrinking, but few are losing residents as fast as Albany, Georgia. In the last five years, Albany’s population declined by 4.8%, even as the U.S. population expanded by 3.7%. The falling population is likely attributable in part to bleak economic conditions. Some 32.5% of city residents live in poverty, more than double the state poverty rate of 16.0% and the U.S. rate of 14.0%. More jobs in the city would likely go a long way to ease serious financial hardship. Some 7.0% of workers in Albany are out of job, the highest unemployment rate of any Georgia city.
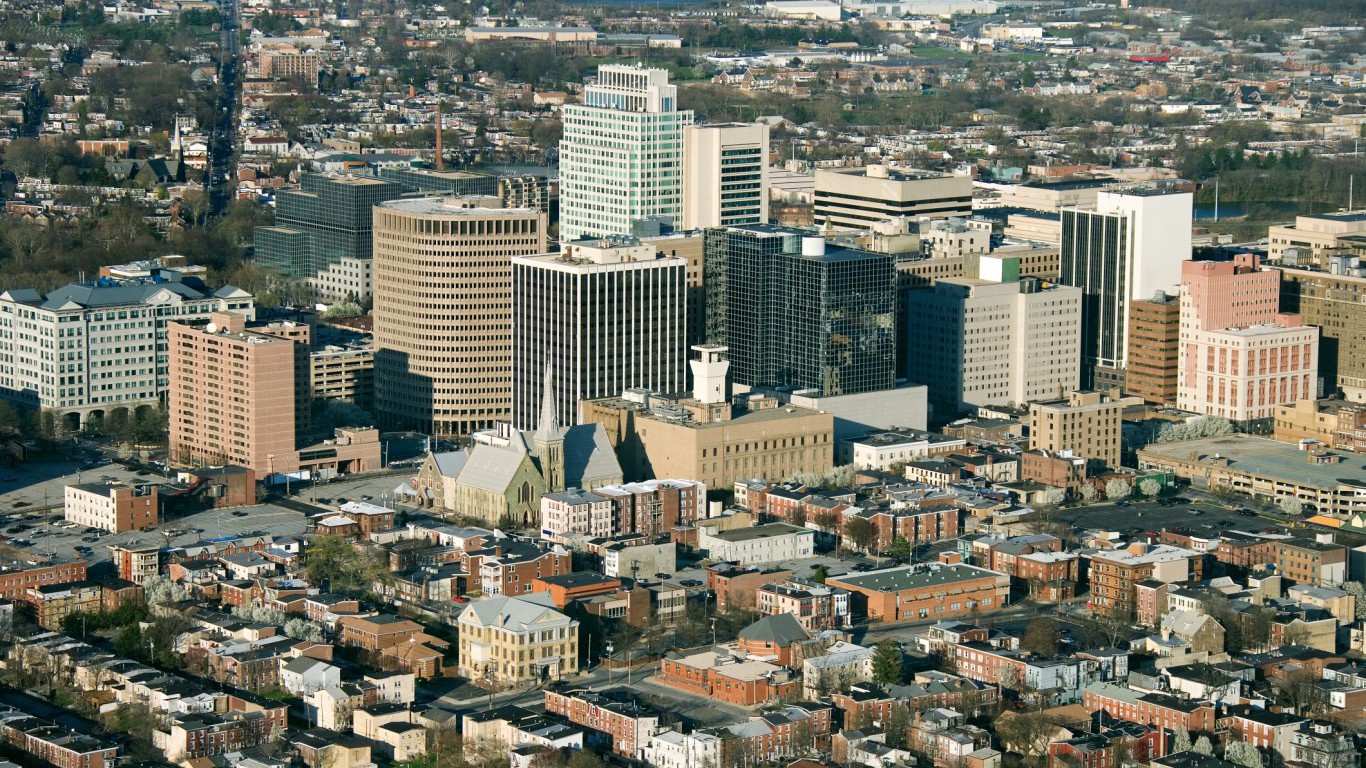
6. Wilmington, Delaware
> Population: 71,455
> Median home value: $145,600
> Poverty rate: 27.7%
> Pct. with at least a bachelor’s degree: 25.6%
Low incomes and a high cost of living likely detract from overall quality of life for many in Wilmington, Delaware. The typical household in the city earns just $36,435 a year — well below the median income of $57,617 nationwide — and 27.7% of the city’s population lives below the poverty line, nearly double the U.S. poverty rate. Meanwhile, goods and services in Wilmington are about 17% more expensive than they are on average nationwide.
Wilmington also ranks as one of the most dangerous cities in the United States. There were 1,798 violent crimes in Wilmington for every 100,000 residents in 2016, more than all but four other cities and more than quadruple the national violent crime rate.
[in-text-ad-2]
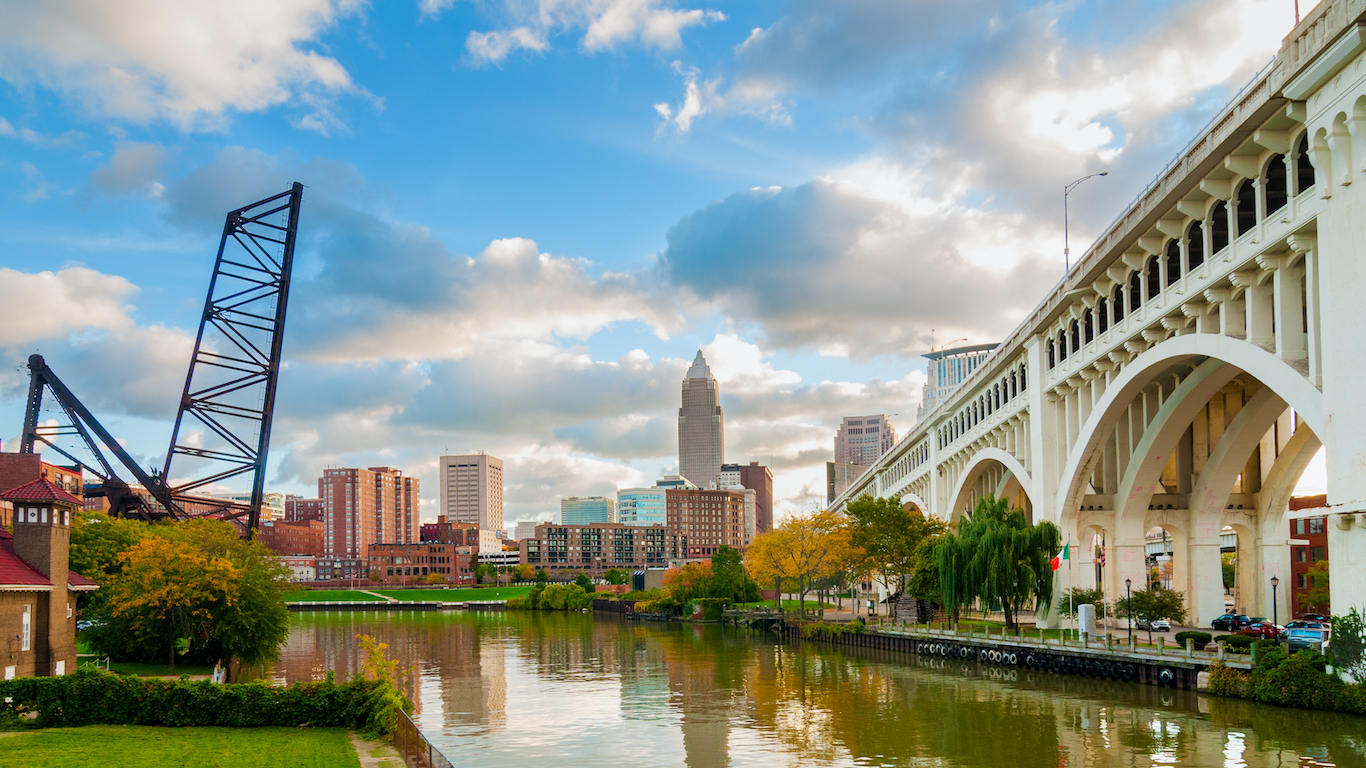
5. Cleveland, Ohio
> Population: 385,810
> Median home value: $66,800
> Poverty rate: 35.0%
> Pct. with at least a bachelor’s degree: 16.3%
One of the poorest cities in the country, Cleveland’s 35% poverty rate is more than double the U.S. poverty rate and higher than that of all but one other city in the state. Cleveland’s 6.9% jobless rate is also the second highest of any city in the state. The city is also dangerous. There were 1,633 violent crimes in the city for every 100,000 residents in 2016, more than in all but eight other U.S. cities and quadruple the national violent crime rate.
Widespread poverty, a high crime rate, and a bleak jobs picture likely partially explain the declining population. In the last decade, Cleveland’s population fell by 2.4% even as the country’s population as a whole grew by 7.1%.
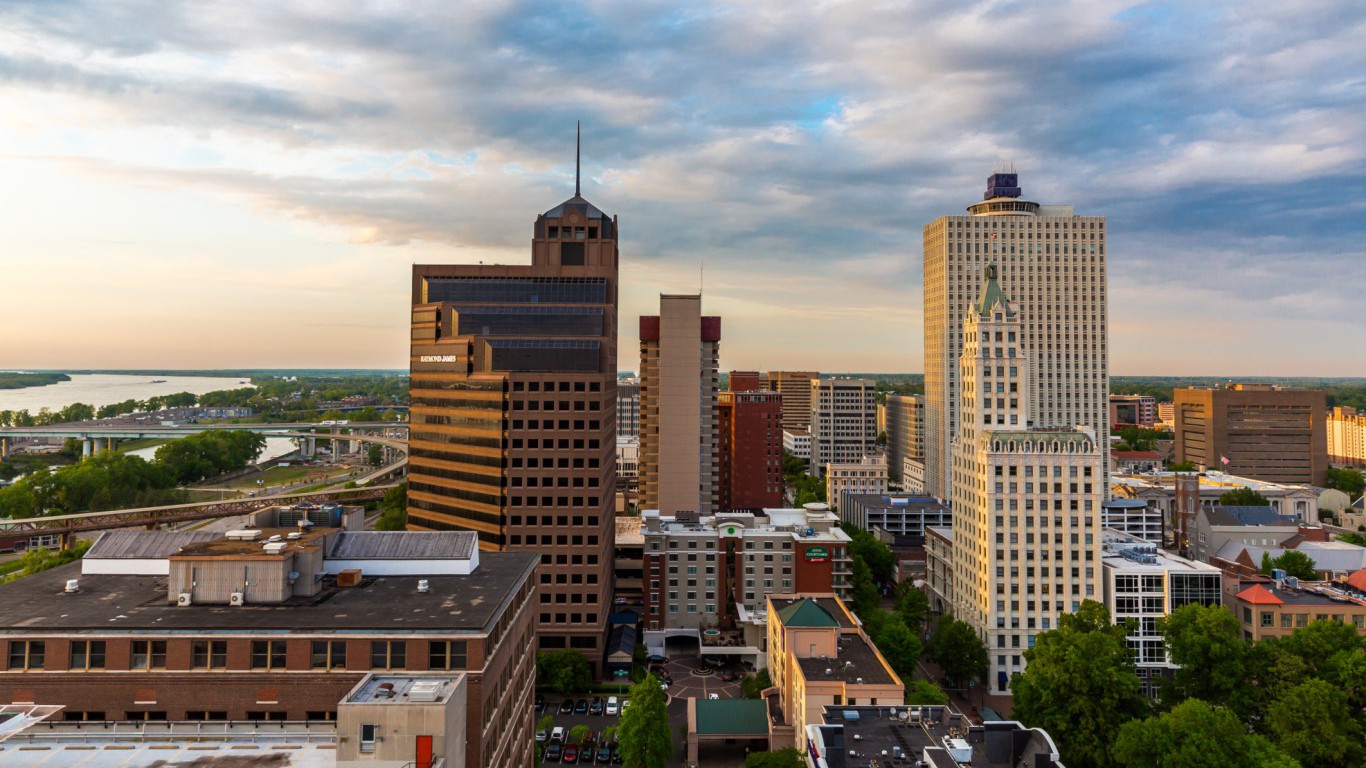
4. Memphis, Tennessee
> Population: 652,752
> Median home value: $96,800
> Poverty rate: 26.9%
> Pct. with at least a bachelor’s degree: 25.6%
In Memphis, serious financial hardship and high crime rate detract from the overall quality of life of many residents. Some 26.9% of area residents live in poverty, the largest share of any city in the state and well above the 14.0% U.S. poverty rate. Poorer cities often struggle more with crime, and Memphis is no exception. There were 1,830 violent crimes in the city for every 100,000 residents in 2016, a higher violent crime rate than in all but three other U.S. cities and nearly five times the comparable U.S. violent crime rate.
[in-text-ad]

3. St. Louis, Missouri
> Population: 311,404
> Median home value: $125,800
> Poverty rate: 23.8%
> Pct. with at least a bachelor’s degree: 34.1%
St. Louis is the worst city to live in in Missouri and third worst nationwide. A concentration of violence in parts of the city makes St. Louis a particularly difficult place to live. There were 1,932 violent crimes for every 100,000 city residents in 2016, the third highest violent crime rate of any U.S. city and five times the comparable U.S. rate. Crime rates are often higher in economically depressed areas, and St. Louis is a relatively poor city. Some 23.8% of residents live below the poverty line, a higher poverty rate than in the majority of U.S. cities and nearly 10 percentage points above both the U.S. and statewide poverty rates of 14.0%.
As is the case in nearly every other Midwestern city on this list, St. Louis is losing residents. The city’s population fell by 11.2% over the past decade, even as the U.S. population expanded by 7.1%.
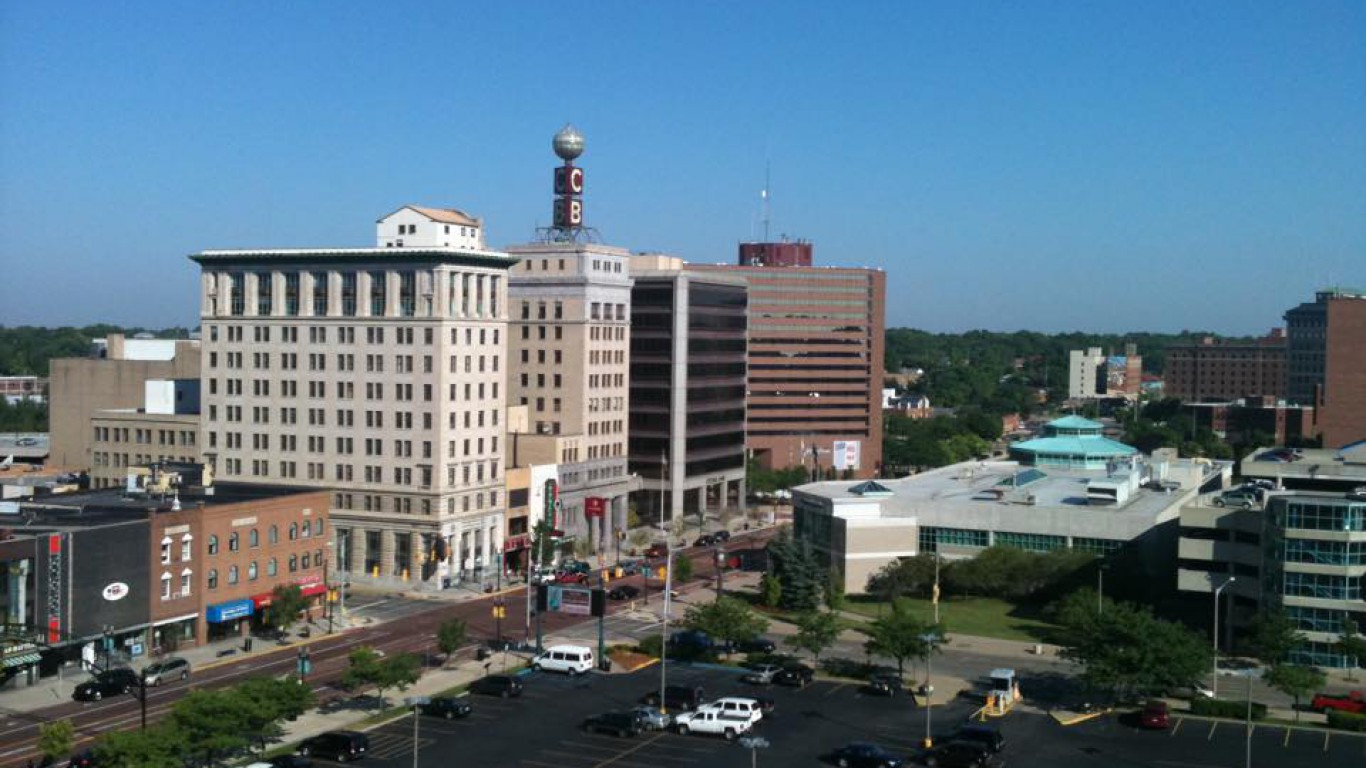
2. Flint, Michigan
> Population: 97,379
> Median home value: $28,200
> Poverty rate: 44.5%
> Pct. with at least a bachelor’s degree: 10.5%
Flint is second worst city to live in in both Michigan and the United States as a whole. Some 44.5% of Flint’s population lives below the poverty line, the highest poverty rate of any city in the country. Financial hardship in the city is precipitated in part by a lagging job market. The city’s 9.8% unemployment rate is double the annual U.S. unemployment rate of 4.9%. The city may be an unattractive place for many employers and small business owners to operate in, both because of high crime rates and the relatively small college-educated population. Flint’s violent crime rate of 1,587 incidents per 100,000 people is more than triple the state violent crime rate. Also, only 10.5% of city residents have a bachelor’s degree, about a third of the 31.3% share of American adults.
[in-text-ad-2]
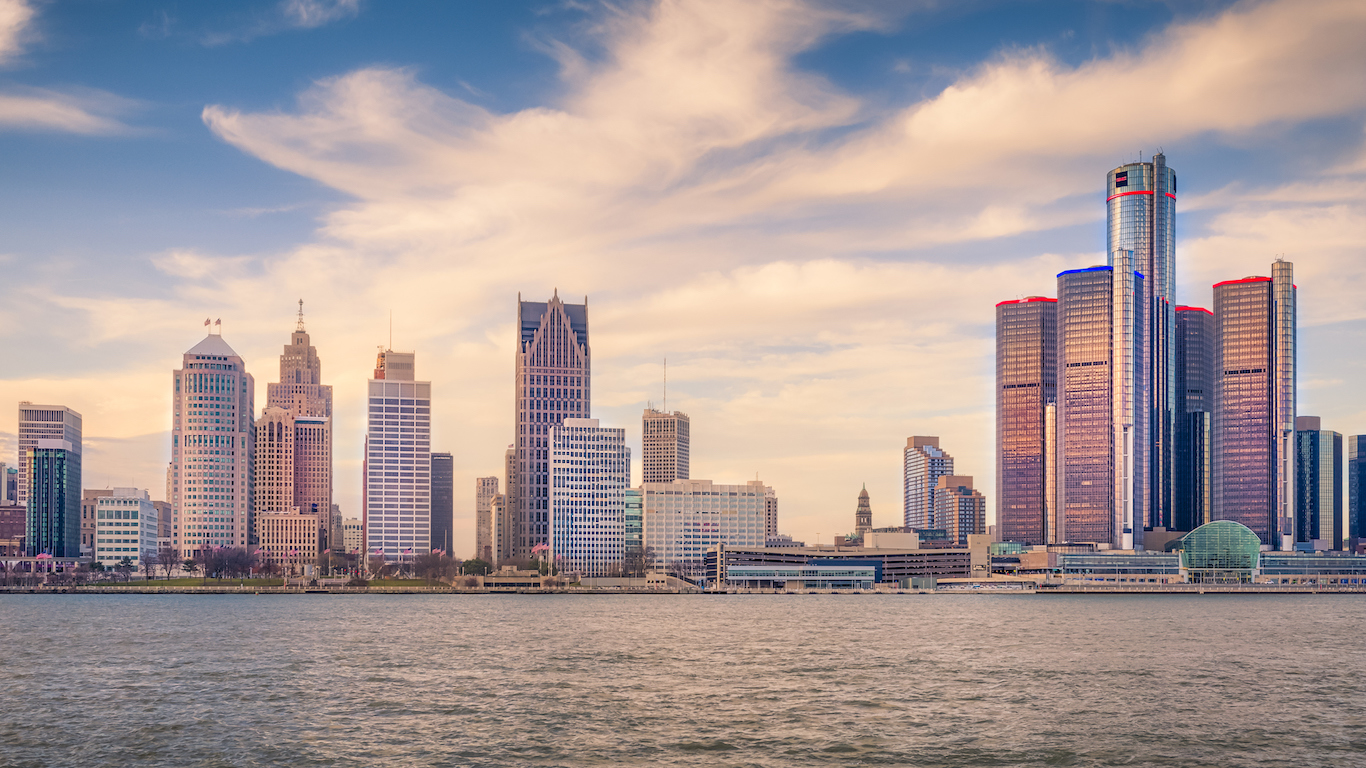
1. Detroit, Michigan
> Population: 672,829
> Median home value: $43,500
> Poverty rate: 35.7%
> Pct. with at least a bachelor’s degree: 14.9%
The poster child of American post-industrial urban decline, Detroit, Michigan, ranks as the worst city in the country to live in. Once home to 1.8 million residents at the peak of U.S. auto manufacturing in the 1950s, the city is now home to fewer than 700,000 after decades of decline.
A poor, economically depressed city, more than one in every three Detroit residents live below the poverty line. The city also has one of the highest unemployment rates in the United States, with 10.9% of the workforce out of a job. Detroit is also dangerous. It is the only city in the country where there were over 2,000 violent crimes for every 100,000 residents in 2016.
Detailed Findings
Problems like poverty, high unemployment rates, and high crime rates can have far reaching effects — and rarely does one exist without the others.
By itself, a high concentration of violent and property crime is bad for any city. People living in high crime areas are at greater risk of being the victim of a crime — and even if they are not victims themselves, high crime rates can take a toll on residents’ mental health.
High crime rates can also have economic implications for a city. Employers and small business owners may be less likely to operate in cities with high crime rates. This can then lead to higher jobless rates and economic stagnation. Of the 50 cities on this list, 39 have both higher than typical violent crime rates as well as unemployment rates above the 4.9% nationwide annual average.
The high unemployment rates in the cities on this list may also be due in part to their poorly educated labor pools — a less educated workforce may make a city less attractive for major employers. Only a dozen of the 50 cities on this list are home to a larger share of adults with a bachelor’s degree than the 31.3% share nationwide.
A weak job market tends to lower the typical income in an area, and the cities on this list tend to be relatively poor. In the majority of the worst cities to live in, the median income is less than $40,000 a year. Oakland, California, is the only city on this list with a median household income above the national median of $57,617. However, in many of the higher income cities like Oakland, a high cost of living offsets the higher incomes. In Oakland, goods and services are 27.4% more expensive on average than they are nationwide.
For many American homeowners, their home comprises the bulk of their wealth. However, low incomes, high crime rates, and stagnant economies have depressed home values in many of these cities. In 17 of the 50 cities on this list, the typical home is worth less than $100,000, and only 12 cities have a higher median home value than the national median of $205,000. In those cities with higher home values, homeownership may be prohibitively expensive as in most cases the median home value is more than five times the median income. Nationwide, the median home value is worth only about 3.6 times the median income.
In addition to some of the interconnected social and economic measures included in our index. We considered several factors that tend to move independently of one another, including air quality, average commute times, and risk of natural disasters.
Methodology
To determine America’s 50 worst cities to live in, 24/7 Wall St. considered the roughly 600 cities that the U.S. Census Bureau reported as having populations of more than 50,000 in 2016. Data was collected in nine major categories: crime, demography, economy, education, environment, health, housing, infrastructure, and leisure.
Within each category, specific measures contributed to a city’s overall category score. For example, the economy category included median household income adjusted for cost of living, the ratio between a city’s and its state’s median household income, poverty and unemployment rates, as well as a city’s three-year employment growth. Each measure was adjusted to range from 0 to 1 using min-max normalization, with lower scores indicating better outcomes.
Normalizing each measure, as opposed to aggregating category scores in other ways, allowed us to assign weight to individual measures for added importance rather than entire categories. It also enabled us to expose the principal components of our index — those measures with wider variation that disproportionately determine the rank of a city’s composite score. The housing category, for example, had the widest range, giving it the greatest pull in our index. Crime and economy also had large variances.
We did not include any measures in the demography category in our composite index. However, this category provided exclusion rules. Cities that are better to live in often attract job seekers and their families. Conversely, labor market slack, unaffordable housing, high crime rates, or other negative factors may induce people to move to a different city with better prospects. Population figures are from the Census Bureau’s 2016 American Community Survey (ACS).
The crime category consists of both violent and property crime rates from the Federal Bureau of Investigation’s 2016 Uniform Crime Report. High crime rates have the potential to make a city less desirable. As a result, cities with crime rates lower than the national rates were rewarded, while cities with higher crime rates were penalized.
The economy category includes a city’s 2016 unemployment rate and employment growth from 2014-2016, both from the Bureau of Labor Statistics. Cities were penalized for having poverty rates above the national rate of 14.0%. Our goal was to identify cities that were livable for everyone, not just the rich. Still, if incomes are too low, a city may not be desirable. To that end, we adjusted median household income for cost of living in the city. Cities were penalized if cost-adjusted incomes were less than $44,000 or more than $112,000 a year, roughly 80% to 200% of a typical household’s income nationwide. Poverty rates and median income came from the 2016 ACS. Cost of living data came from property and real estate data provider ATTOM Data Solutions.
As a proxy for school system strength, we considered high school standardized test scores relative to state scores from ATTOM Data Solutions. Test score data are for 2015 or the most recently available year. Additionally, the education category included the percentage of adults with at least a bachelor’s degree from the ACS, as well as the number of colleges and universities in a city per 100,000 residents from the Department of Education. Both measures are as of 2016.
In the environment category, we included an air quality index to assess the levels of a variety of pollutants on a given day. Additionally, we considered an index measuring natural hazard risk, as well as average monthly rainfall. All data in this category came from ATTOM Data Solutions.
From the Centers for Medicare and Medicaid Services (CMS), we calculated 30-day risk-adjusted mortality rates of heart attacks, COPD, heart failure, pneumonia, and stroke. Also from CMS, we examined the rate at which individuals were readmitted to a hospital within 30 days of being discharged. This category also includes preventable hospitalizations — the share of hospitalizations that could have been treated with outpatient or ambulatory care for every 1,000 Medicare recipients from County Health Rankings.
In our housing index, we considered the ratio of a city’s median home value to the statewide median home value. Cities were penalized if a city’s home values were worth less than 90% of statewide home values. Conversely, if home values were typically 25% higher than across the state, high barriers to entry exist that can make a city unaffordable. As an additional measure of affordability, we included the ratio of median home value to median annual household income. This ratio — called a price-to-income ratio — helps identify cities that are less liveable for a broad audience. We also considered median property taxes as a percentage of median home value. All data in this category came from the 2016 ACS.
From the ACS, we considered the percentage of commuters travelling to work by foot or public transportation. Additionally, we reviewed the average time it takes to travel to work each day. Lastly, we included the number of airports in the metro area in which the city is located. There are, for example, no airports in New York County, the primary county of New York City. However, at least three major airports exist outside county limits — and within the metro area — that service people who live in the city. Airport data came from the Federal Aviation Administration and only consider operational public-use and commercial airports as of 2015.
The leisure category can be broken into two parts: activities that take place in the city and outside it. Within a city, residents may take advantage of restaurants and bars, libraries and archives, theater companies, fitness and recreational sports centers, museums, movie theaters, hotels, or amateur and professional sports teams. To engage in other pastimes — skiing, for example — residents likely have to leave city limits. We included in this index the number of zoos, nature parks, ski resorts, and golf courses in the counties surrounding the city. All data in this category were aggregated to the city level from 2015 Zip Code Business Patterns, a program maintained by the Census and adjusted for the city’s 2016 population.
The Average American Is Losing Their Savings Every Day (Sponsor)
If you’re like many Americans and keep your money ‘safe’ in a checking or savings account, think again. The average yield on a savings account is a paltry .4% today, and inflation is much higher. Checking accounts are even worse.
Every day you don’t move to a high-yield savings account that beats inflation, you lose more and more value.
But there is good news. To win qualified customers, some accounts are paying 9-10x this national average. That’s an incredible way to keep your money safe, and get paid at the same time. Our top pick for high yield savings accounts includes other one time cash bonuses, and is FDIC insured.
Click here to see how much more you could be earning on your savings today. It takes just a few minutes and your money could be working for you.
Thank you for reading! Have some feedback for us?
Contact the 24/7 Wall St. editorial team.
 24/7 Wall St.
 24/7 Wall St.
 24/7 Wall St.

