Special Report
American Cities That Will Soon Be Under Water
Published:
Last Updated:

The steady rise in global surface temperatures, monitored since the 1880s, is largely attributed to human-caused greenhouse gas emissions. With rising temperatures, the world’s ice has been melting and the sea level rising. As a result, barring major interventions, sooner or later thousands of coastal communities around the world will become uninhabitable.
The most recent assessment published this June in the science journal Nature found that Antarctica is melting at triple the rate it did in 2007 and previous projections may have underestimated the continent’s slow disappearance.
According to a 2017 study, if rising carbon emissions and ice sheet loss continue at their current rate, global sea levels could rise by an estimated 8 feet by the year 2100. And if, in the even more distant future, all of the Antarctic ice sheet — which comprises the vast majority of Earth’s freshwater supply — melts, sea levels would rise by approximately 200 feet.
Change on such a large scale is incremental and can seem quite distant. Still, any large scale solution to the problem would need to be implemented relatively soon. Already, for many areas, flooding is inevitable and the problem is imminent. According to NOAA scientists, high tide flooding across U.S. coastlines this year may surpass what was typical flooding 20 years ago by as much as 60%.
24/7 Wall St. reviewed data modeled by environmental watchdog group the Union of Concerned Scientists, which identified U.S. coastal communities expected to face chronic and disruptive flooding before the end of the century — defined as having 10% or more of livable land area flooded at least 26 times per year.
Across U.S. coastal cities within the next 30 years, more than 300,000 homes worth a combined $117.5 billion are likely to be at risk of chronic tidal flooding, according to UCS analysis and projections.
We reviewed the coastal communities in which at least 10% of livable area is expected to experience chronic flooding by 2060. Places are ranked by the number of residents that live in parts of the community expected to be under water by 2060.
Cities and institutions can mitigate flood damage by implementing wetlands, levees, and other mechanisms, and many of the cities on this list have done so. It is important to note that the estimates published by the UCS do not take into account the mitigating effects of such mechanisms.
Correction: An earlier version of this piece attributed the $117.5 billion flooding estimate cost to Zillow. That estimate was calculated by the Union of Concerned Scientists.
Click here to see the American cities that will soon be under water.
Click here to read our methodology.
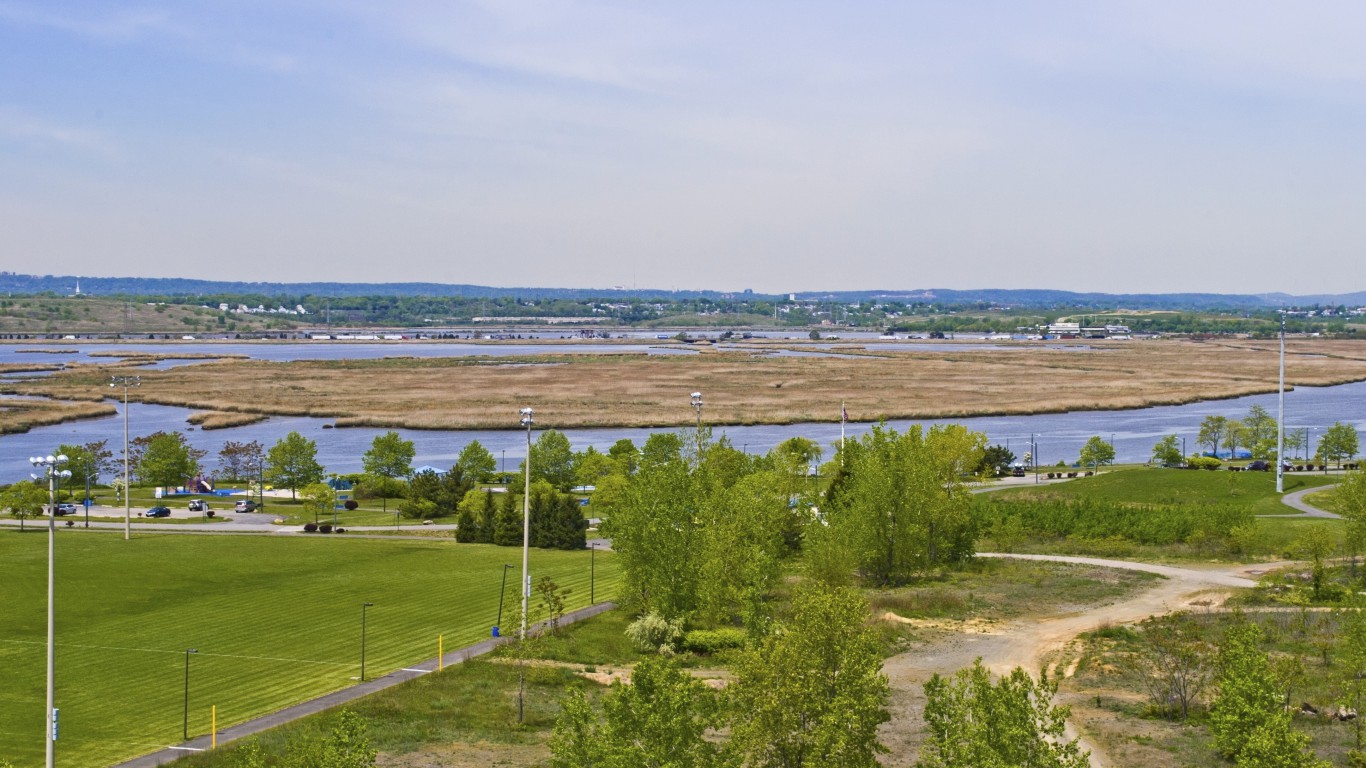
30. Secaucus, New Jersey
> Population with homes at risk of flooding in 2060: 3,092 (19.0%)
> Livable land that will be underwater by 2060: 25.7%
> Livable land that will be underwater by 2100: 65.8%
> Property value at risk in 2060: $230.21 million
> Last major flooding event: October 2012 (Superstorm Sandy)
[in-text-ad]

29. St. Simons, Georgia
> Population with homes at risk of flooding in 2060: 3,370 (22.9%)
> Livable land that will be underwater by 2060: 26.4%
> Livable land that will be underwater by 2100: 60.1%
> Property value at risk in 2060: $1.75 billion
> Last major flooding event: September 2017 (Hurricane Irma)
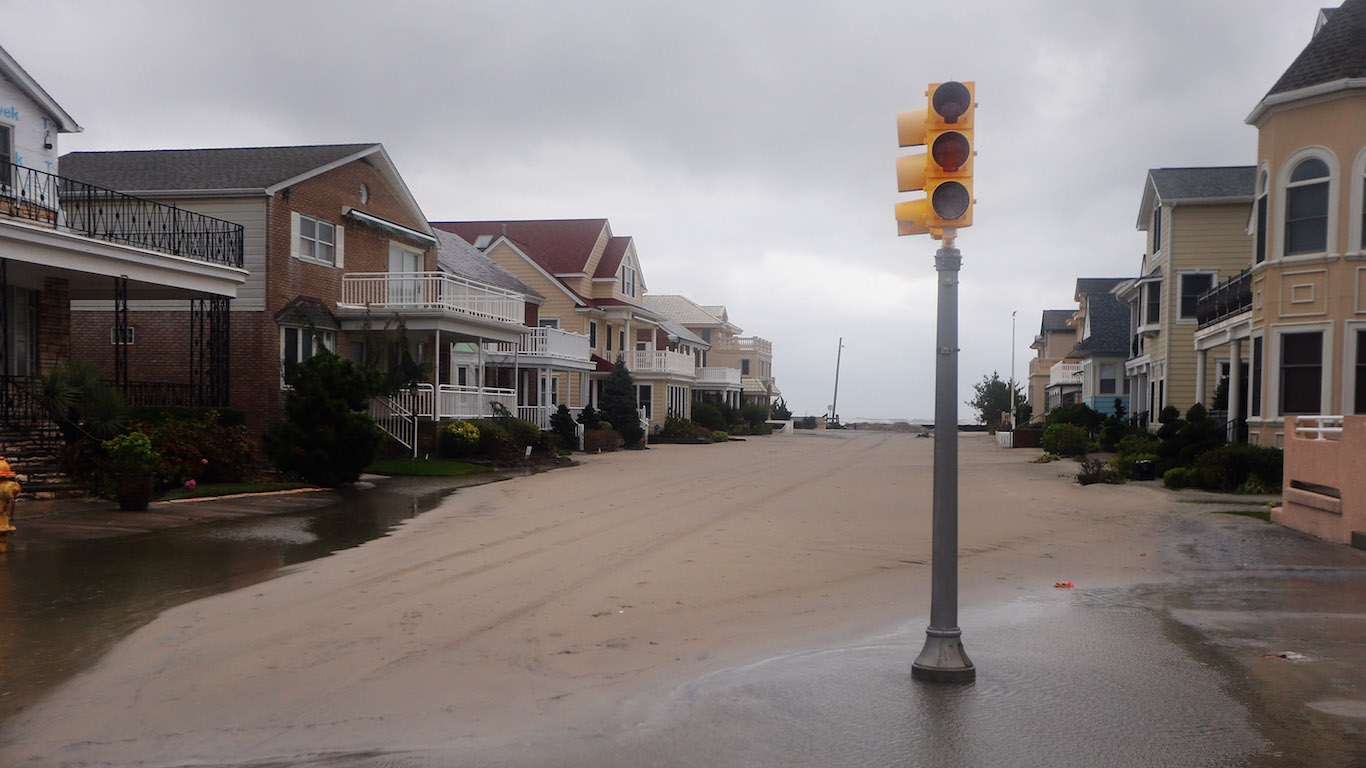
28. Margate City, New Jersey
> Population with homes at risk of flooding in 2060: 3,533 (55.6%)
> Livable land that will be underwater by 2060: 55.7%
> Livable land that will be underwater by 2100: 99.6%
> Property value at risk in 2060: $1.90 billion
> Last major flooding event: October 2012 (Superstorm Sandy)
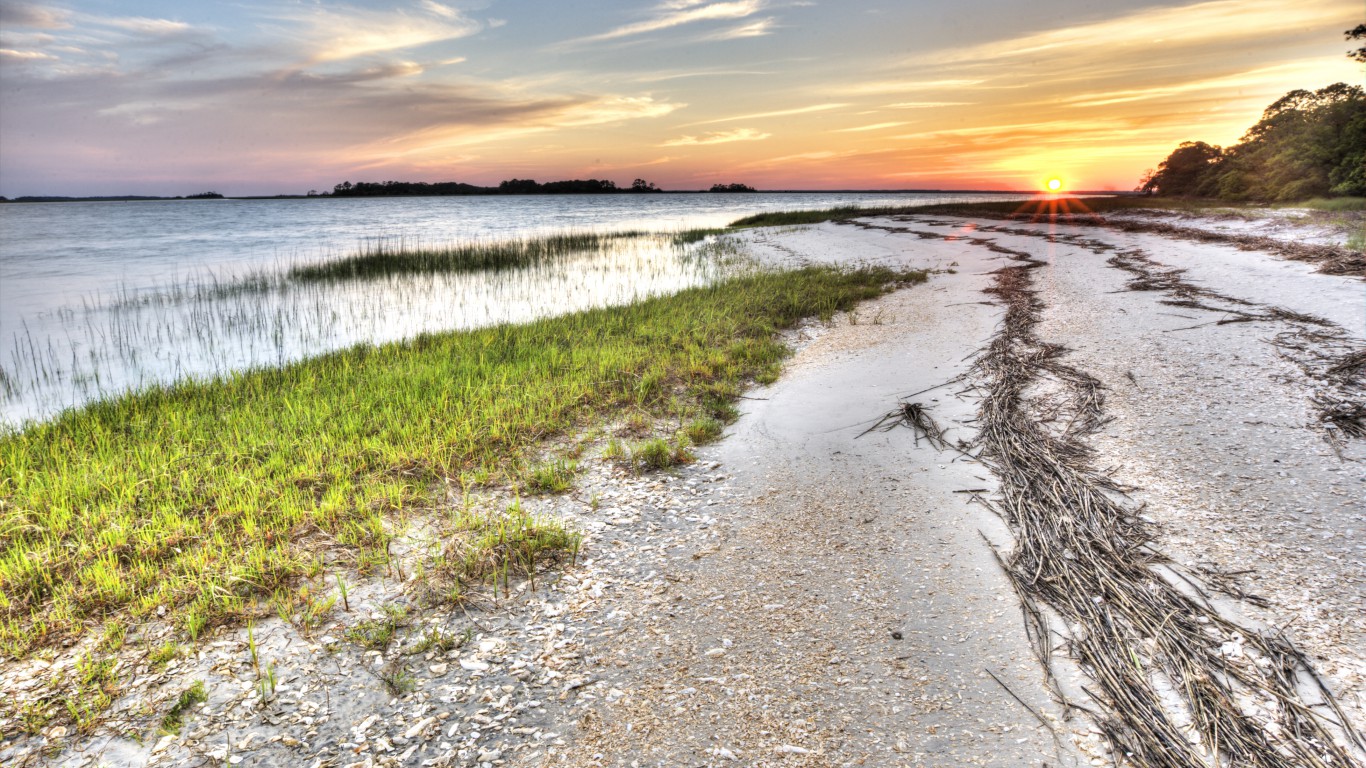
27. St. Helena Island, South Carolina
> Population with homes at risk of flooding in 2060: 3,535 (16.0%)
> Livable land that will be underwater by 2060: 27.3%
> Livable land that will be underwater by 2100: 59.0%
> Property value at risk in 2060: $736.21 million
> Last major flooding event: September 2017 (Hurricane Irma)
[in-text-ad-2]
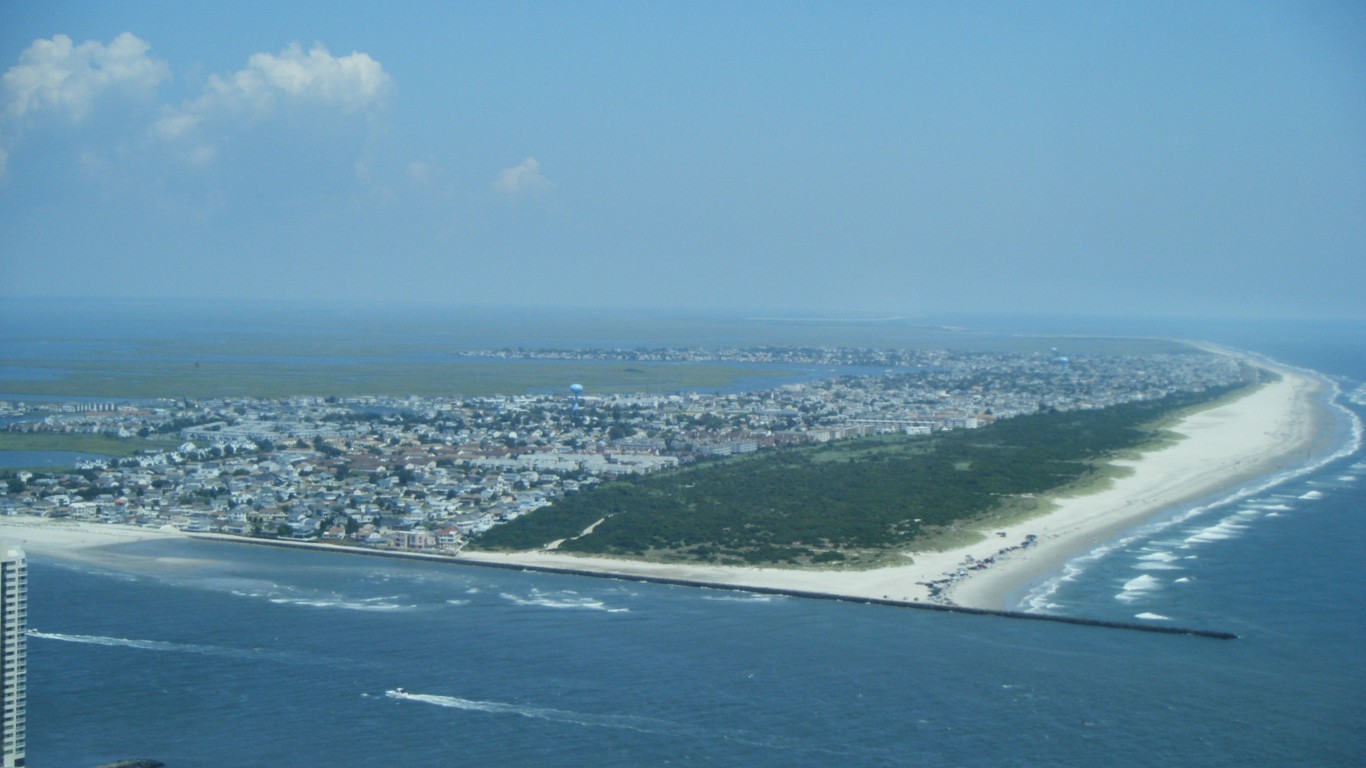
26. Brigantine, New Jersey
> Population with homes at risk of flooding in 2060: 3,590 (38.0%)
> Livable land that will be underwater by 2060: 48.0%
> Livable land that will be underwater by 2100: 95.9%
> Property value at risk in 2060: $1.29 billion
> Last major flooding event: September 2017 (Hurricane Jose)
25. West Ashley, South Carolina
> Population with homes at risk of flooding in 2060: 3,753 (5.5%)
> Livable land that will be underwater by 2060: 13.7%
> Livable land that will be underwater by 2100: 42.2%
> Property value at risk in 2060: $592.95 million
> Last major flooding event: November 2017
[in-text-ad]
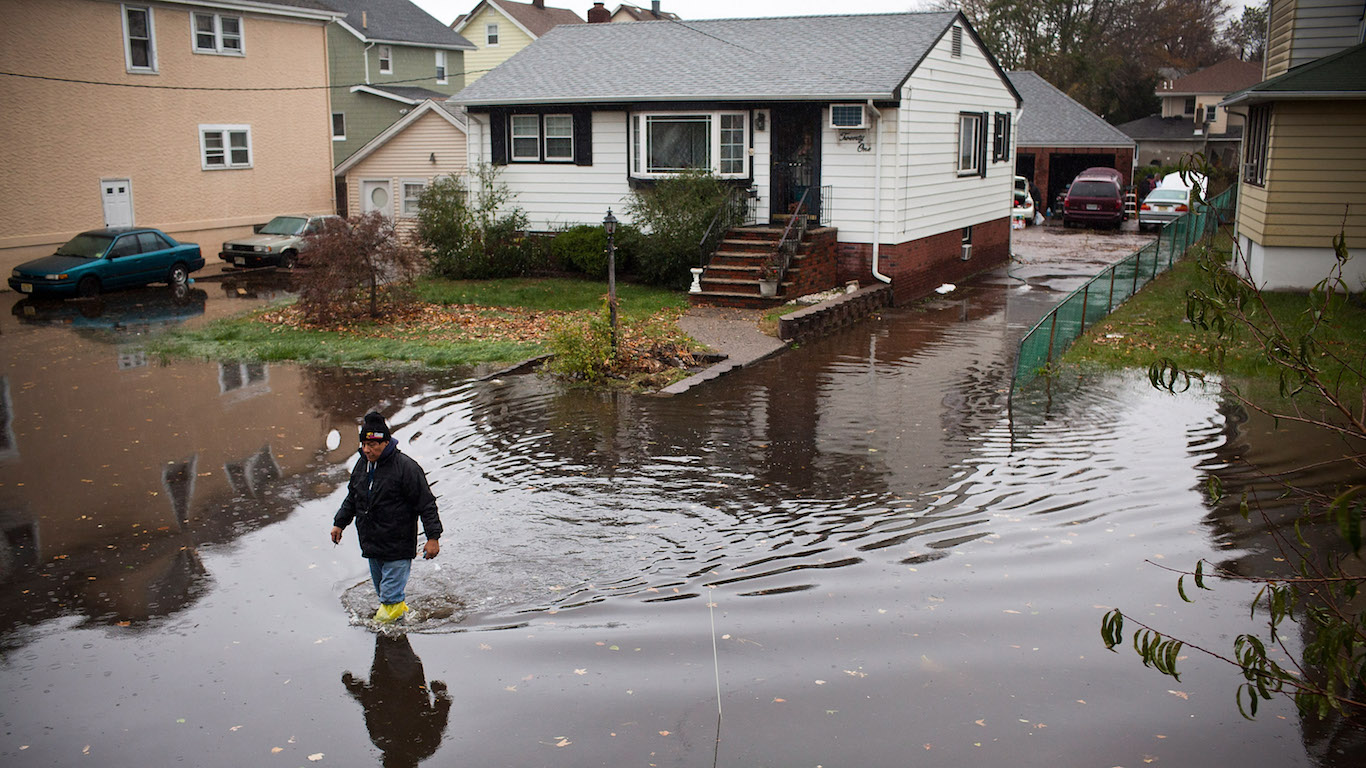
24. Little Ferry, New Jersey
> Population with homes at risk of flooding in 2060: 3,881 (36.5%)
> Livable land that will be underwater by 2060: 75.4%
> Livable land that will be underwater by 2100: 92.0%
> Property value at risk in 2060: $478.20 million
> Last major flooding event: October 2012 (Superstorm Sandy)
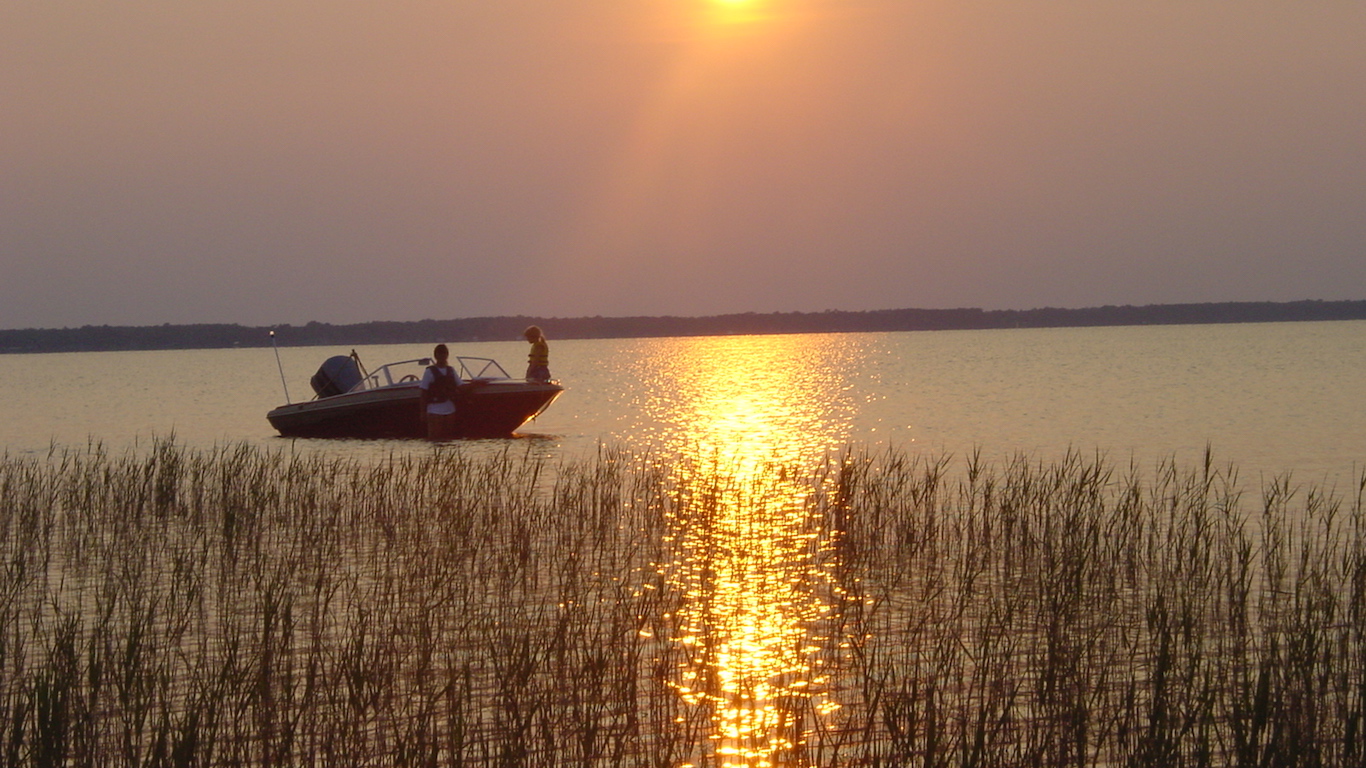
23. Waccamaw Neck, South Carolina
> Population with homes at risk of flooding in 2060: 3,933 (17.7%)
> Livable land that will be underwater by 2060: 15.7%
> Livable land that will be underwater by 2100: 32.5%
> Property value at risk in 2060: $1.88 billion
> Last major flooding event: September 2017 (Hurricane Irma)
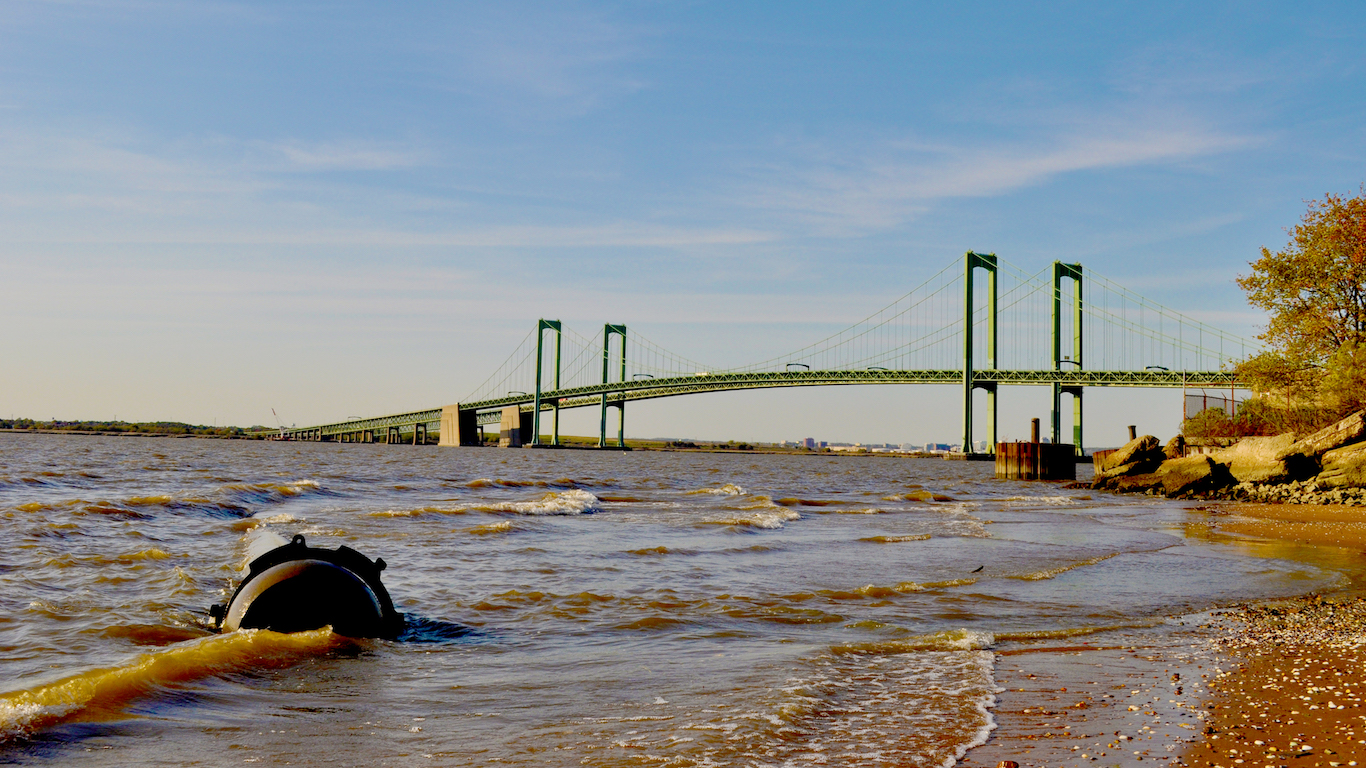
22. Pennsville, New Jersey
> Population with homes at risk of flooding in 2060: 4,081 (30.4%)
> Livable land that will be underwater by 2060: 35.4%
> Livable land that will be underwater by 2100: 70.5%
> Property value at risk in 2060: $289.22 million
> Last major flooding event: May 2018
[in-text-ad-2]
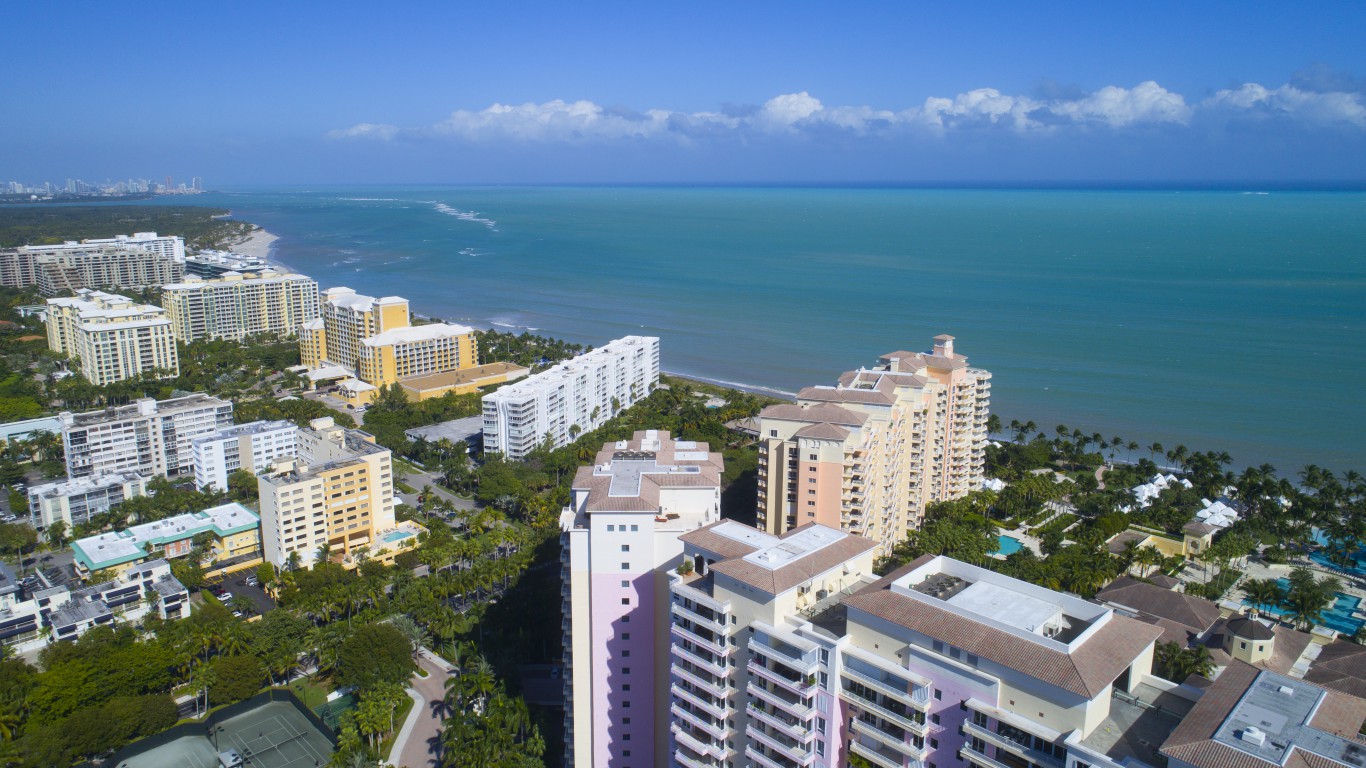
21. Key Biscayne, Florida
> Population with homes at risk of flooding in 2060: 4,302 (34.7%)
> Livable land that will be underwater by 2060: 50.6%
> Livable land that will be underwater by 2100: 86.3%
> Property value at risk in 2060: $2.61 billion
> Last major flooding event: September 2017 (Hurricane Irma)
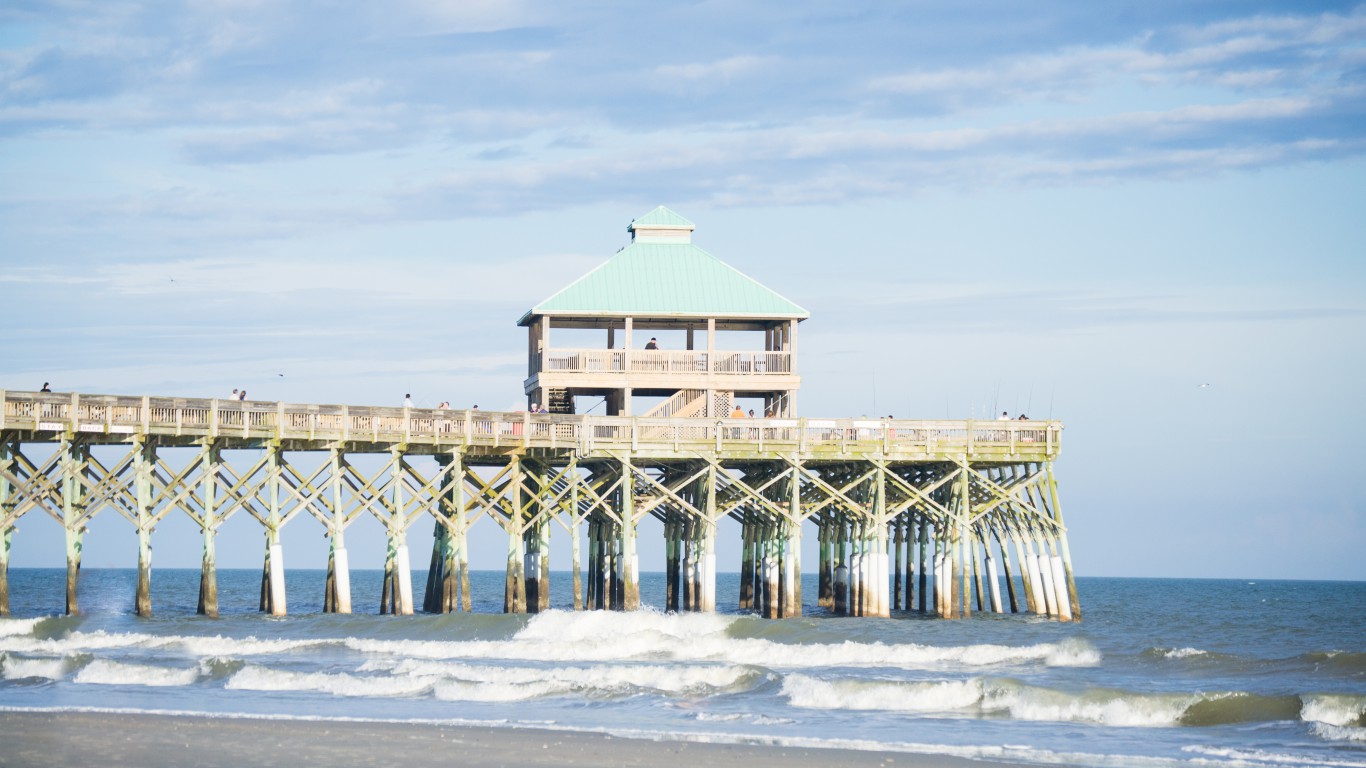
20. James Island, South Carolina
> Population with homes at risk of flooding in 2060: 4,405 (11.5%)
> Livable land that will be underwater by 2060: 27.4%
> Livable land that will be underwater by 2100: 68.4%
> Property value at risk in 2060: $898.66 million
> Last major flooding event: September 2017 (Hurricane Irma)
[in-text-ad]
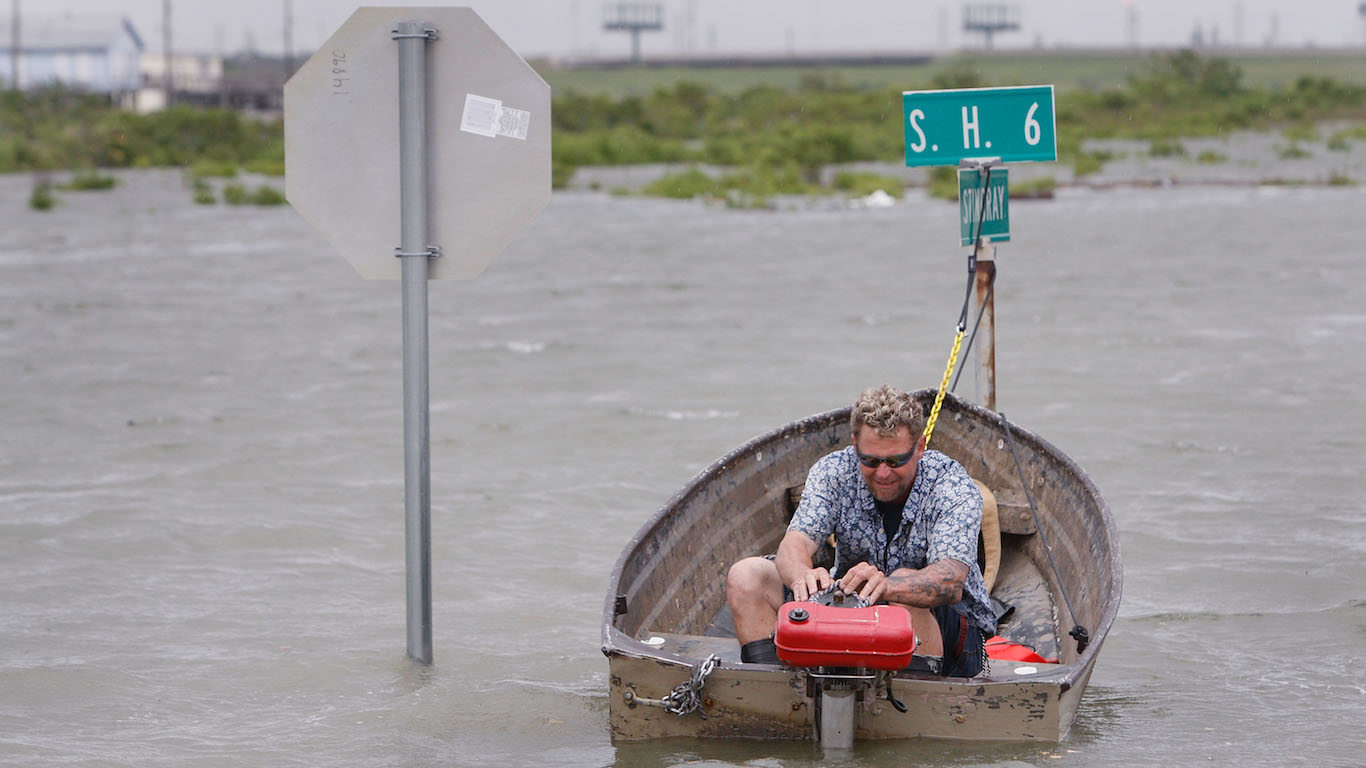
19. La Marque-Hitchcock, Texas
> Population with homes at risk of flooding in 2060: 4,576 (20.4%)
> Livable land that will be underwater by 2060: 19.7%
> Livable land that will be underwater by 2100: 46.0%
> Property value at risk in 2060: $590.55 million
> Last major flooding event: August 2017 (Hurricane Harvey)
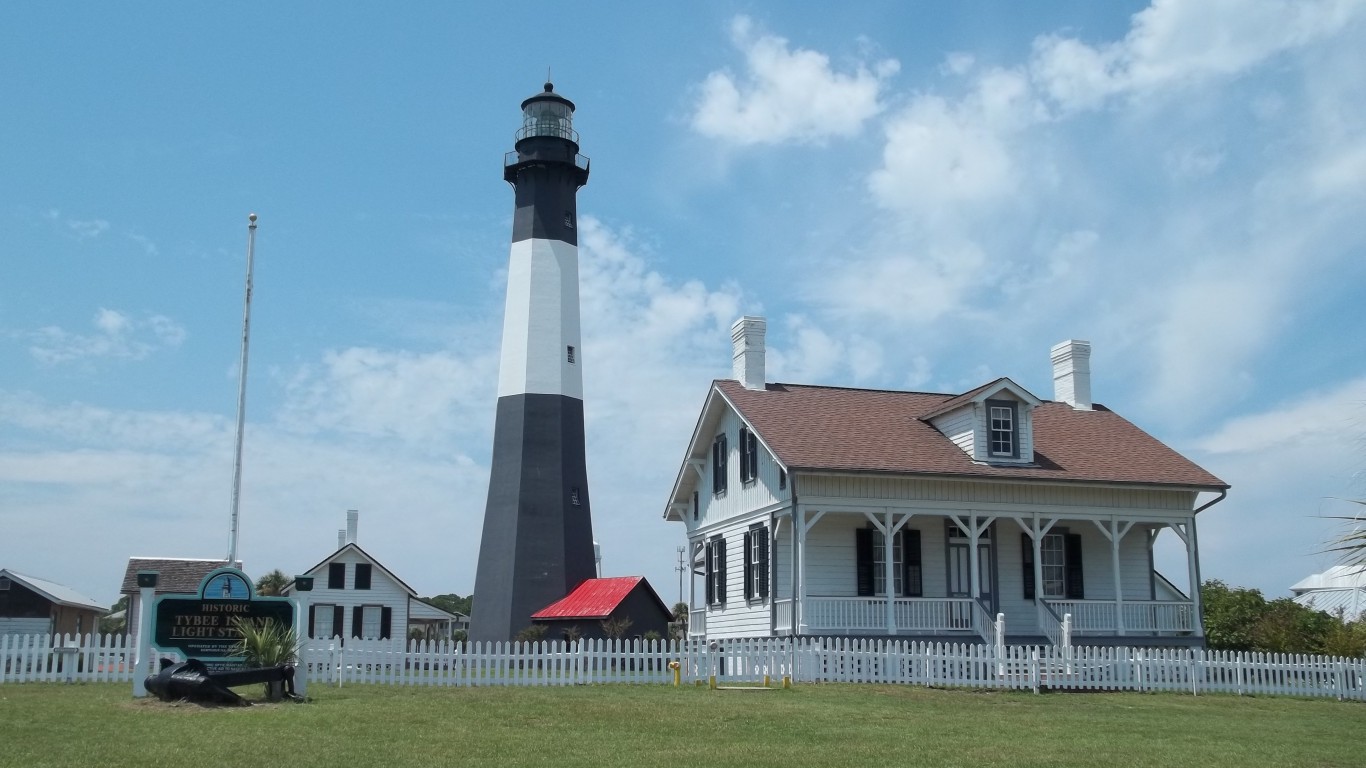
18. Tybee Island-Wilmington Island, Georgia
> Population with homes at risk of flooding in 2060: 4,679 (17.4%)
> Livable land that will be underwater by 2060: 32.9%
> Livable land that will be underwater by 2100: 70.4%
> Property value at risk in 2060: $914.94 million
> Last major flooding event: September 2017 (Hurricane Irma)
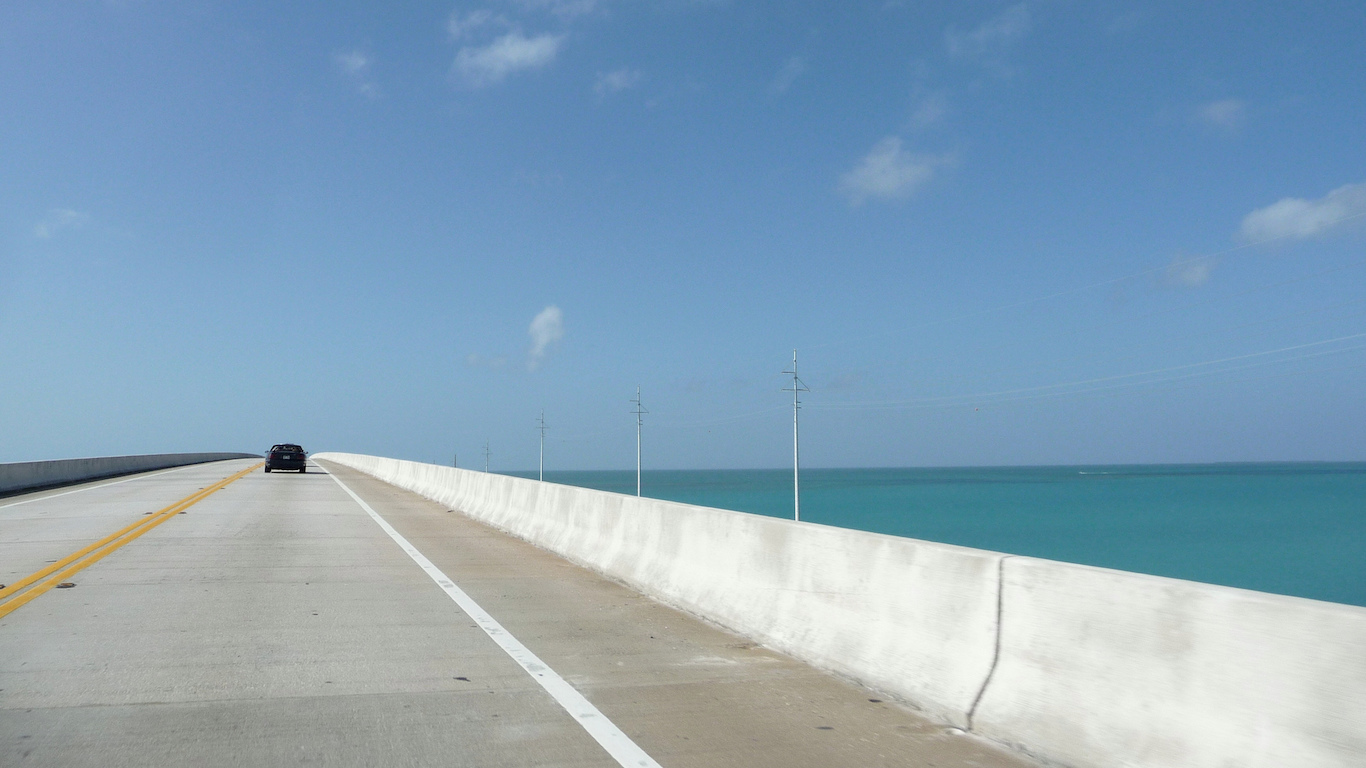
17. Middle Keys, Florida
> Population with homes at risk of flooding in 2060: 4,720 (47.0%)
> Livable land that will be underwater by 2060: 67.8%
> Livable land that will be underwater by 2100: 98.1%
> Property value at risk in 2060: $1.98 billion
> Last major flooding event: September 2017 (Hurricane Irma)
[in-text-ad-2]
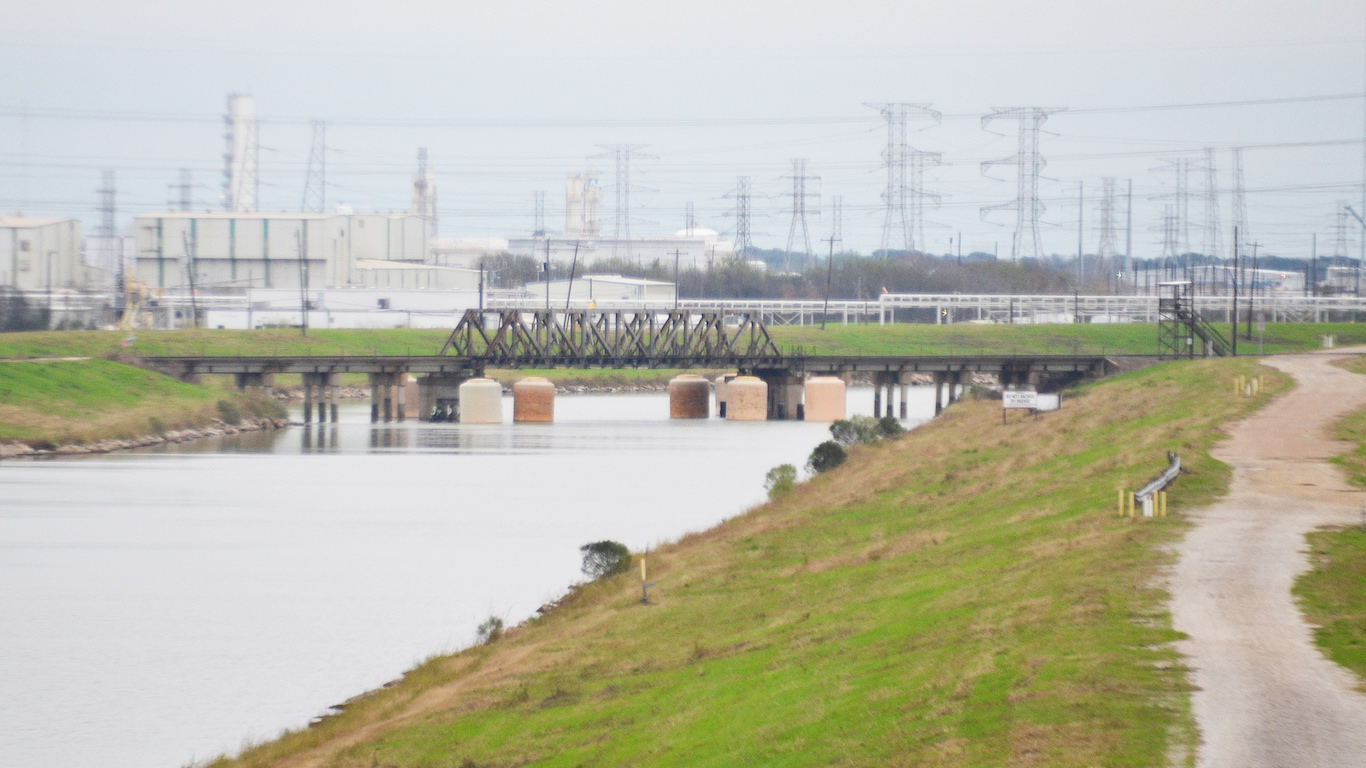
16. Brazosport, Texas
> Population with homes at risk of flooding in 2060: 4,859 (8.1%)
> Livable land that will be underwater by 2060: 32.3%
> Livable land that will be underwater by 2100: 70.0%
> Property value at risk in 2060: $344.96 million
> Last major flooding event: August 2017 (Hurricane Harvey)

15. Ventnor City, New Jersey
> Population with homes at risk of flooding in 2060: 4,916 (46.2%)
> Livable land that will be underwater by 2060: 53.9%
> Livable land that will be underwater by 2100: 98.9%
> Property value at risk in 2060: $849.98 million
> Last major flooding event: January 2018
[in-text-ad]
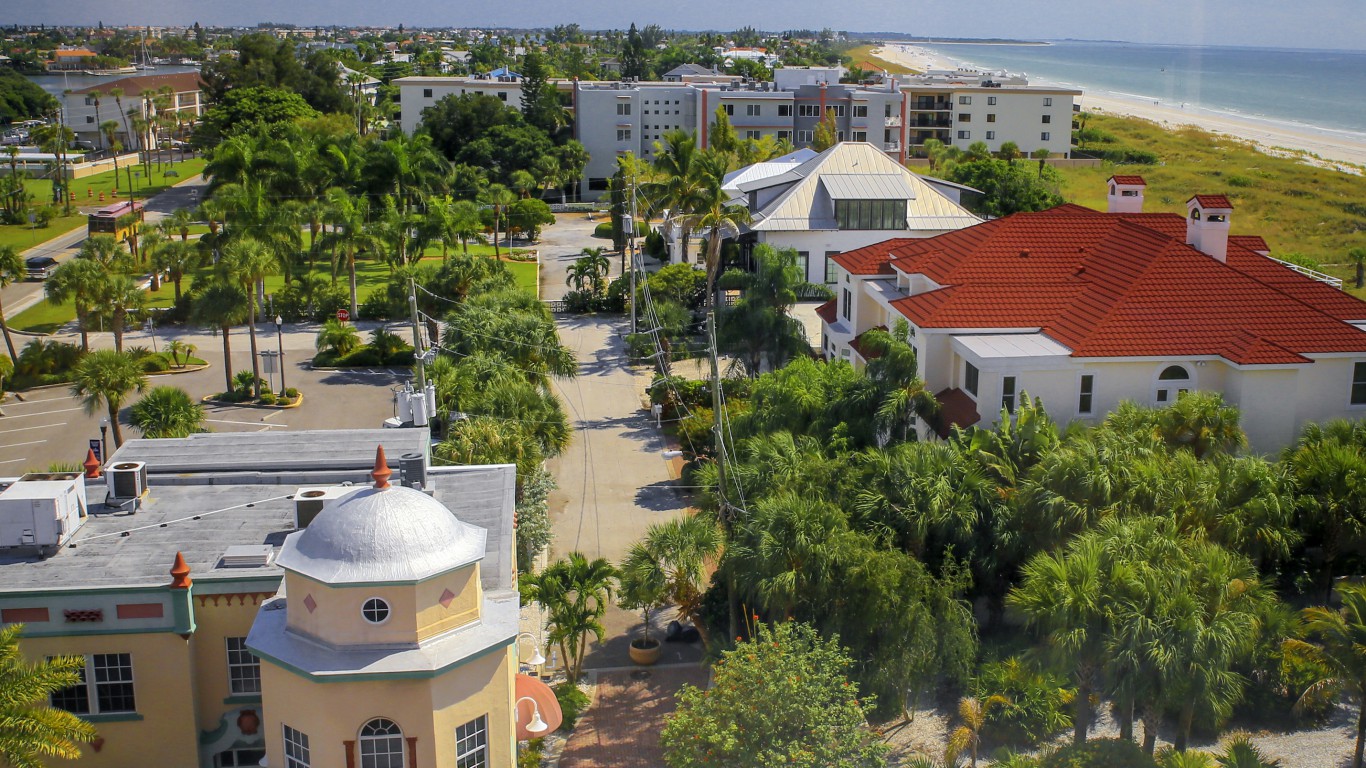
14. St. Pete Beach, Florida
> Population with homes at risk of flooding in 2060: 5,008 (31.5%)
> Livable land that will be underwater by 2060: 50.5%
> Livable land that will be underwater by 2100: 99.5%
> Property value at risk in 2060: $1.56 billion
> Last major flooding event: July 2017 (Hurricane Emily)

13. Charleston Central, South Carolina
> Population with homes at risk of flooding in 2060: 5,122 (14.8%)
> Livable land that will be underwater by 2060: 25.5%
> Livable land that will be underwater by 2100: 58.0%
> Property value at risk in 2060: $2.07 billion
> Last major flooding event: September 2017 (Hurricane Irma)
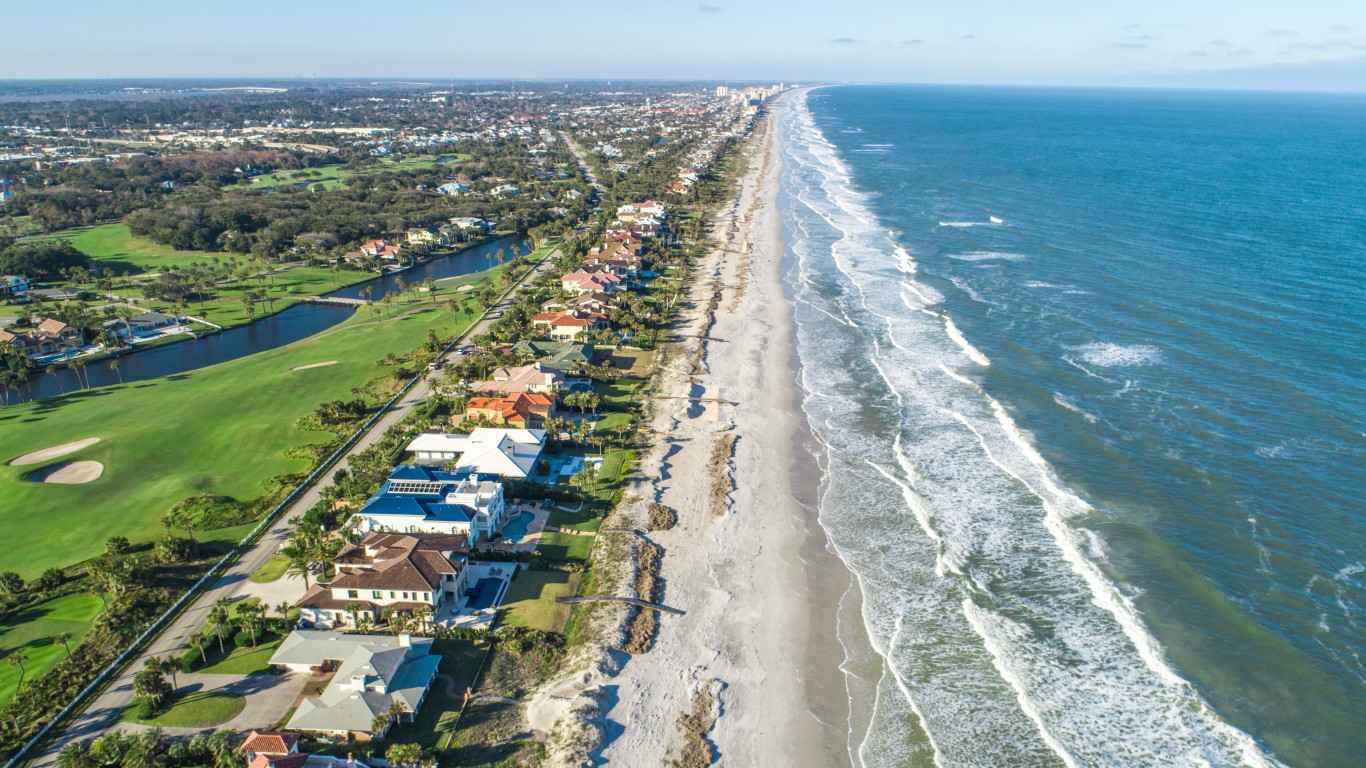
12. Ponte Vedra, Florida
> Population with homes at risk of flooding in 2060: 5,649 (20.8%)
> Livable land that will be underwater by 2060: 21.6%
> Livable land that will be underwater by 2100: 43.3%
> Property value at risk in 2060: $1.41 billion
> Last major flooding event: September 2017 (Hurricane Irma)
[in-text-ad-2]

11. Ocean City, New Jersey
> Population with homes at risk of flooding in 2060: 6,028 (51.5%)
> Livable land that will be underwater by 2060: 58.9%
> Livable land that will be underwater by 2100: 98.3%
> Property value at risk in 2060: $5.68 billion
> Last major flooding event: October 2012 (Superstorm Sandy)
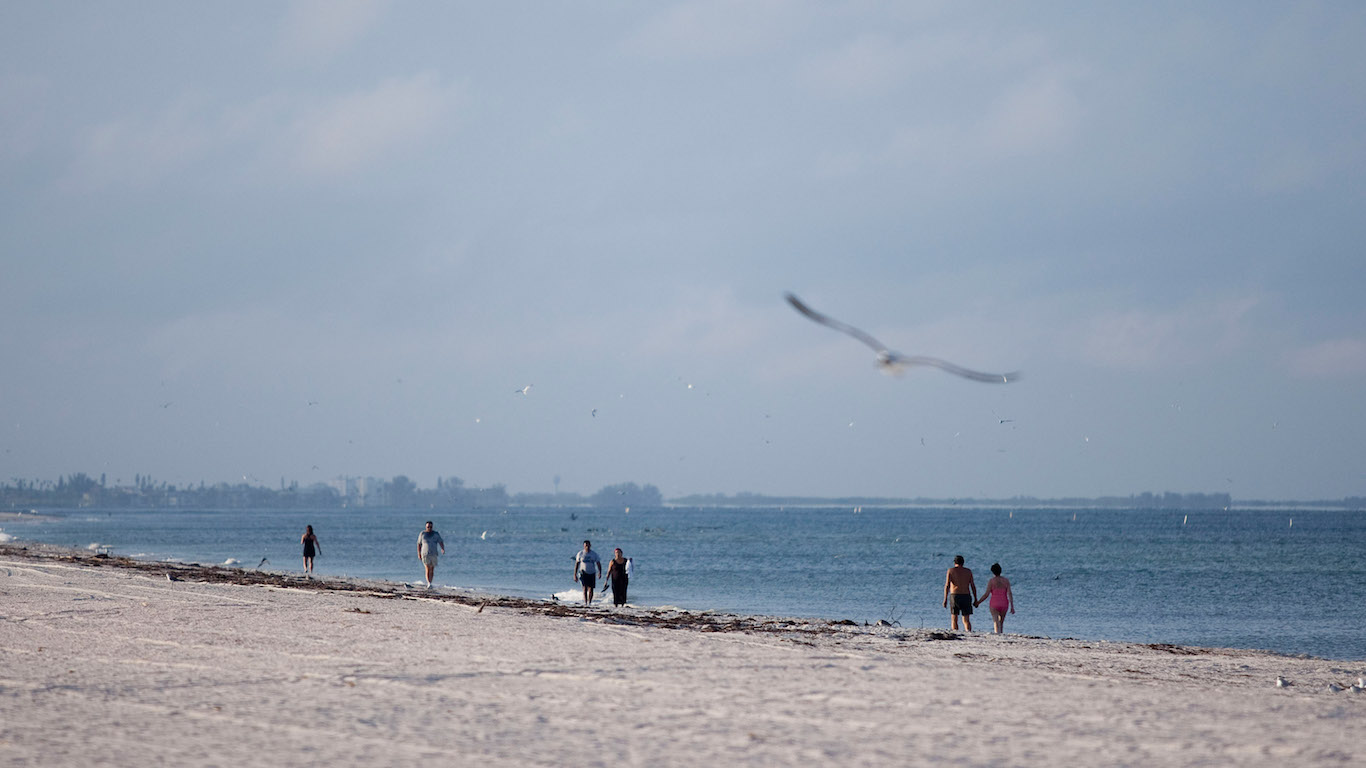
10. Boca Ciega, Florida
> Population with homes at risk of flooding in 2060: 6,810 (10.2%)
> Livable land that will be underwater by 2060: 10.5%
> Livable land that will be underwater by 2100: 23.7%
> Property value at risk in 2060: $1.36 billion
> Last major flooding event: July 2017
[in-text-ad]
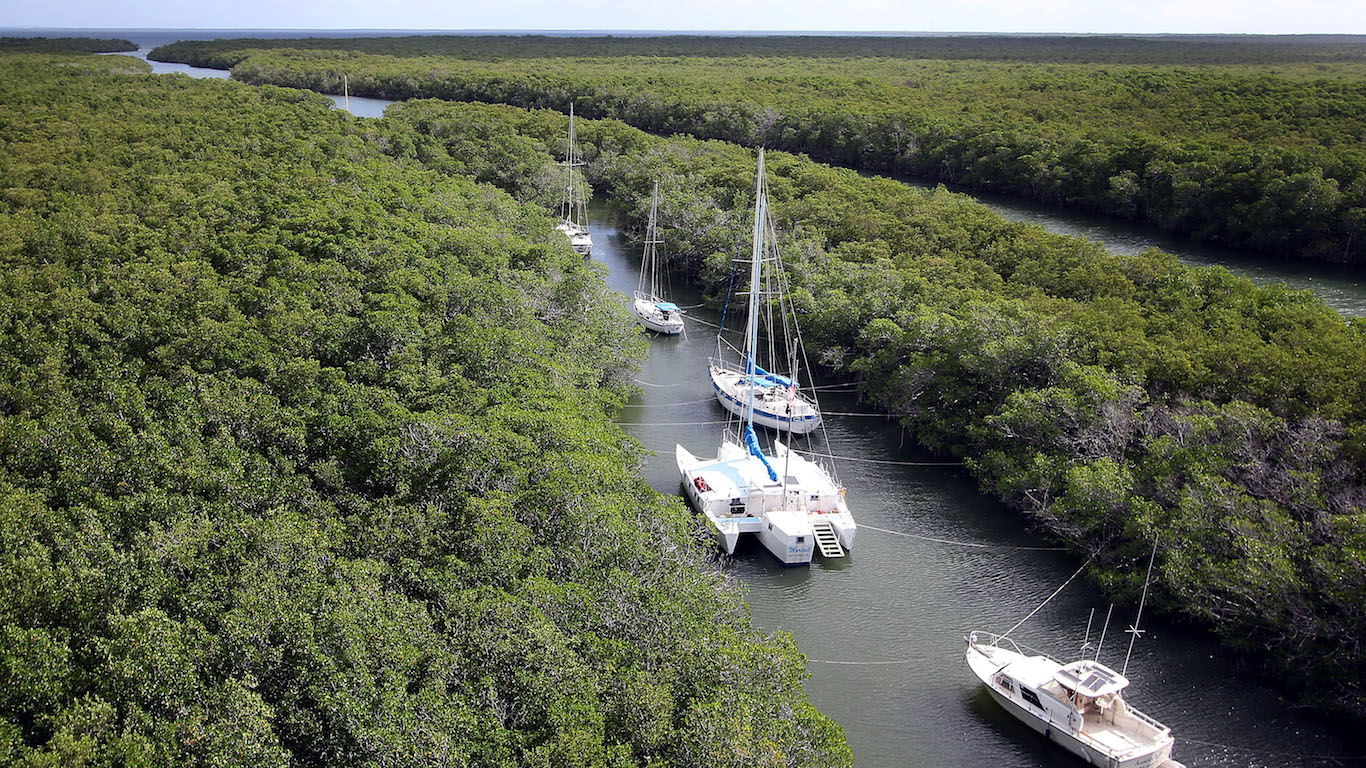
9. Upper Keys, Florida
> Population with homes at risk of flooding in 2060: 6,992 (35.0%)
> Livable land that will be underwater by 2060: 40.4%
> Livable land that will be underwater by 2100: 77.4%
> Property value at risk in 2060: $3.80 billion
> Last major flooding event: September 2017 (Hurricane Irma)
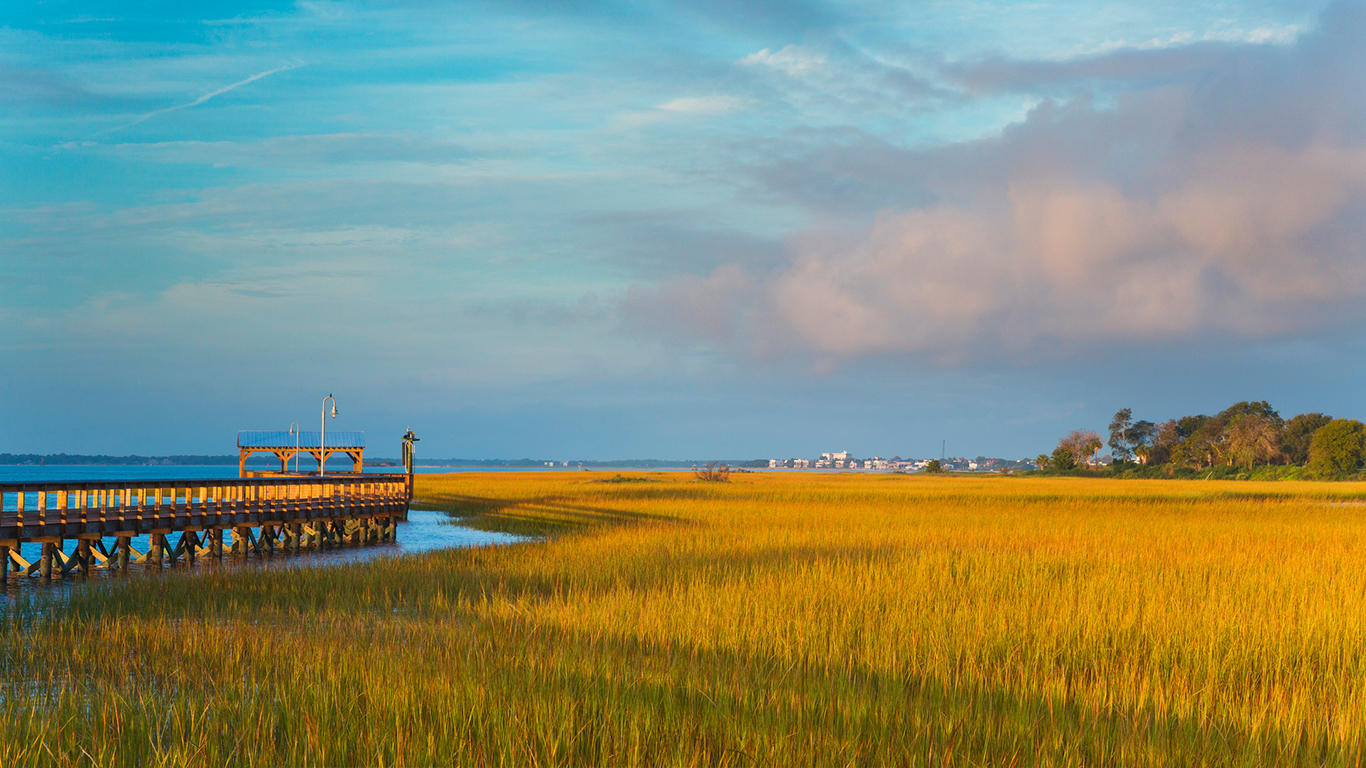
8. Mount Pleasant, South Carolina
> Population with homes at risk of flooding in 2060: 8,389 (10.6%)
> Livable land that will be underwater by 2060: 21.0%
> Livable land that will be underwater by 2100: 53.3%
> Property value at risk in 2060: $2.71 billion
> Last major flooding event: September 2017 (Hurricane Irma)
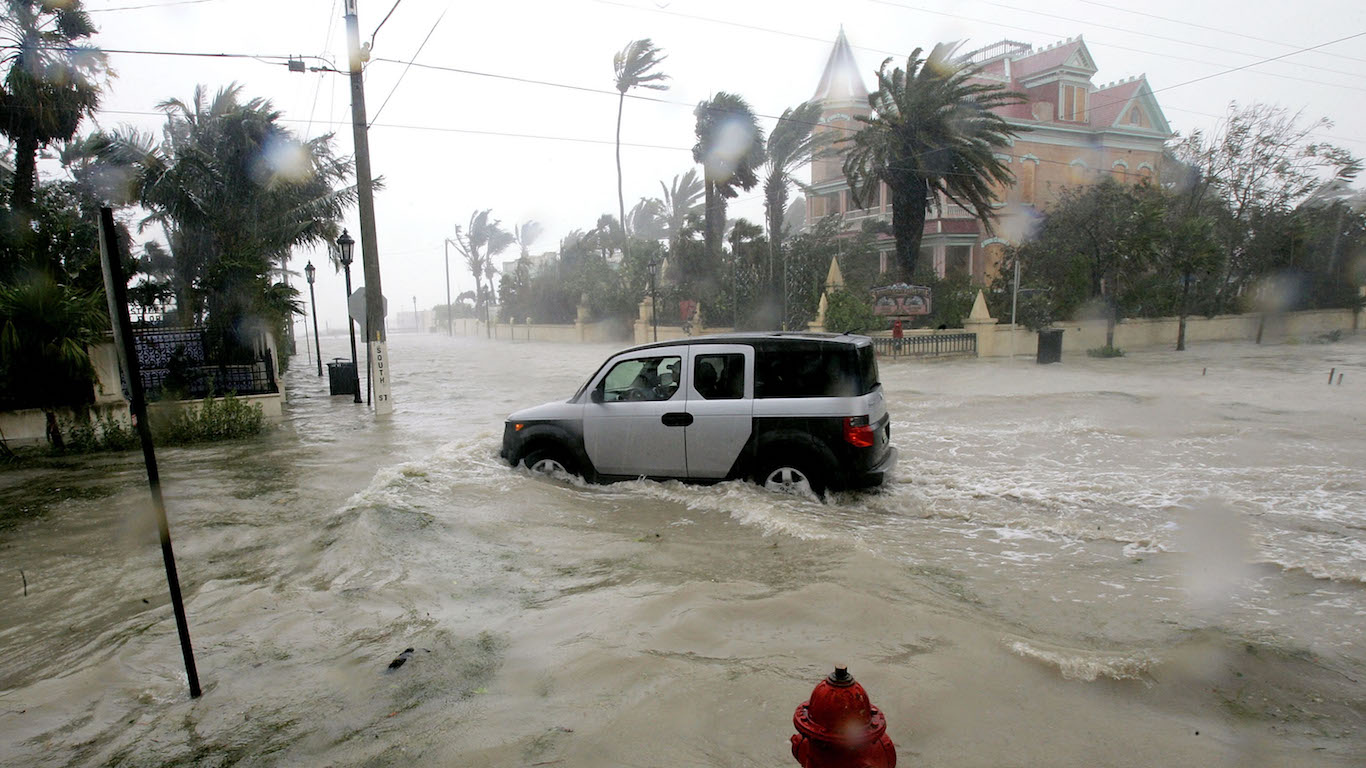
7. Lower Keys, Florida
> Population with homes at risk of flooding in 2060: 8,630 (81.0%)
> Livable land that will be underwater by 2060: 84.6%
> Livable land that will be underwater by 2100: 97.9%
> Property value at risk in 2060: $2.58 billion
> Last major flooding event: September 2017 (Hurricane Irma)
[in-text-ad-2]
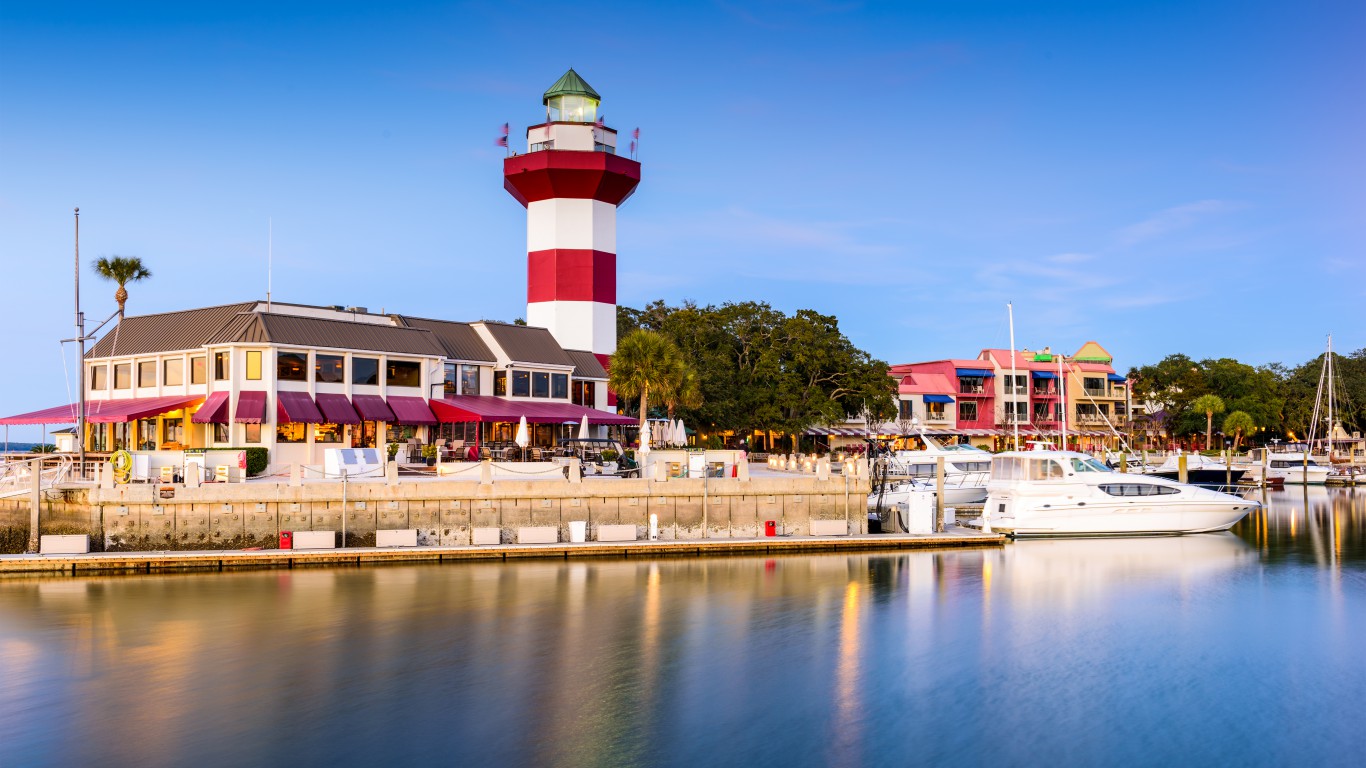
6. Hilton Head Island, South Carolina
> Population with homes at risk of flooding in 2060: 8,935 (23.6%)
> Livable land that will be underwater by 2060: 25.6%
> Livable land that will be underwater by 2100: 57.6%
> Property value at risk in 2060: $4.59 billion
> Last major flooding event: September 2017 (Hurricane Irma)
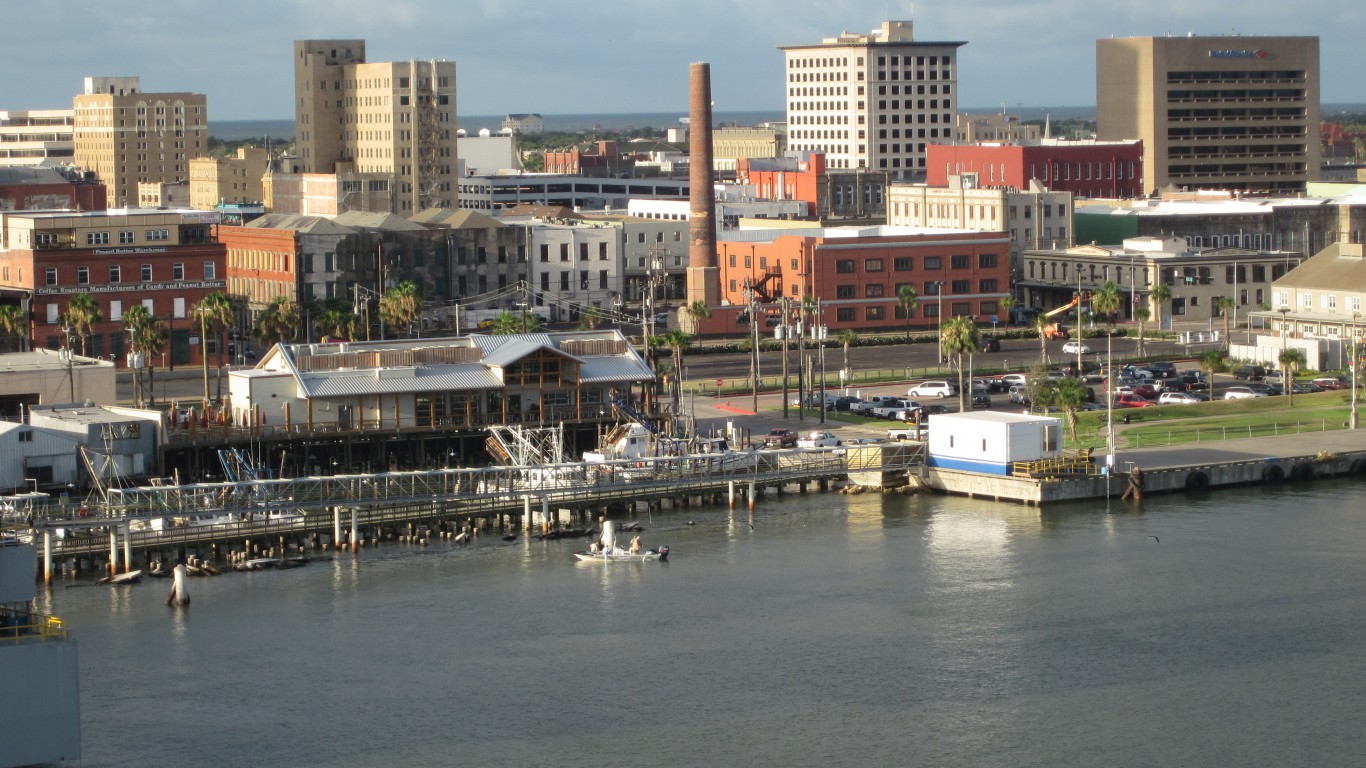
5. Galveston, Texas
> Population with homes at risk of flooding in 2060: 10,293 (21.1%)
> Livable land that will be underwater by 2060: 45.1%
> Livable land that will be underwater by 2100: 90.0%
> Property value at risk in 2060: $2.14 billion
> Last major flooding event: August 2017 (Hurricane Harvey)
[in-text-ad]
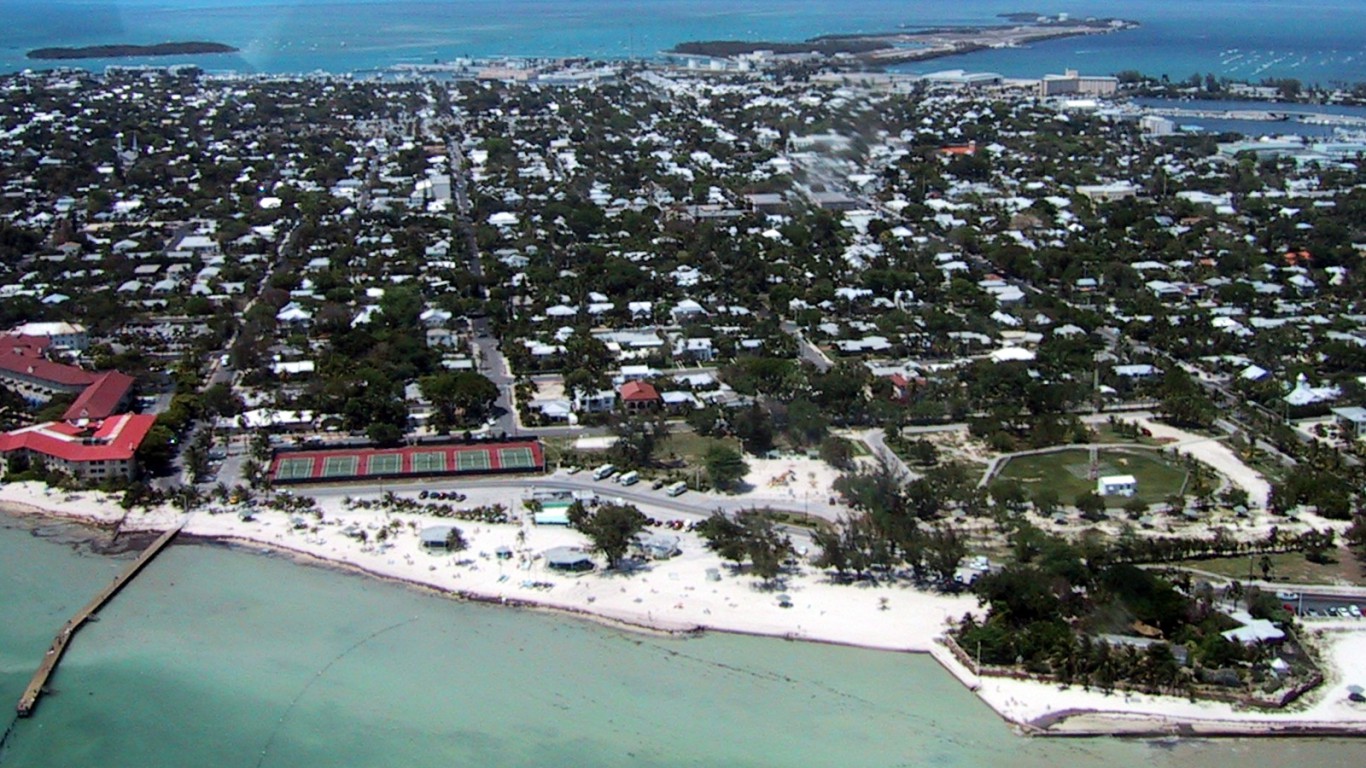
4. Key West, Florida
> Population with homes at risk of flooding in 2060: 11,645 (35.9%)
> Livable land that will be underwater by 2060: 62.6%
> Livable land that will be underwater by 2100: 94.4%
> Property value at risk in 2060: $3.22 billion
> Last major flooding event: September 2017 (Hurricane Irma)
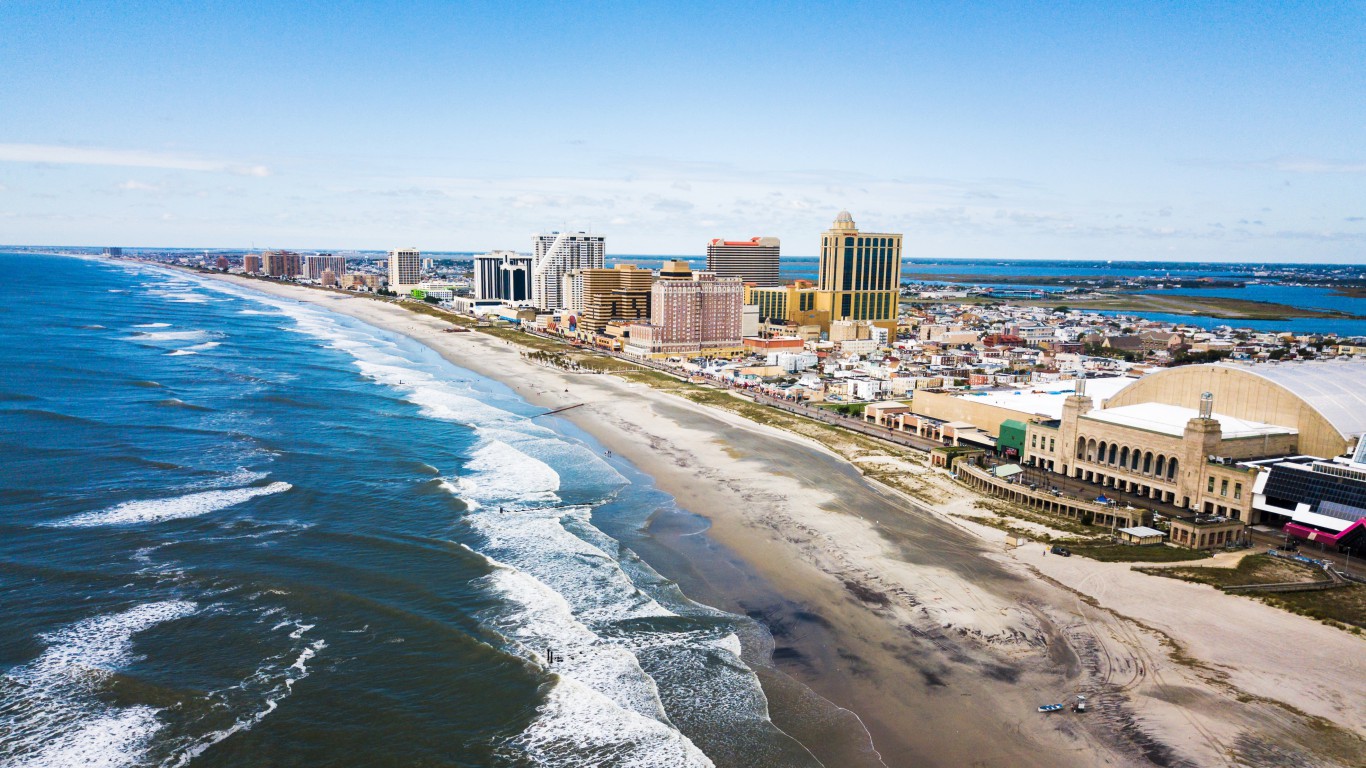
3. Atlantic City, New Jersey
> Population with homes at risk of flooding in 2060: 13,687 (34.6%)
> Livable land that will be underwater by 2060: 50.2%
> Livable land that will be underwater by 2100: 92.8%
> Property value at risk in 2060: $1.05 billion
> Last major flooding event: May 2018
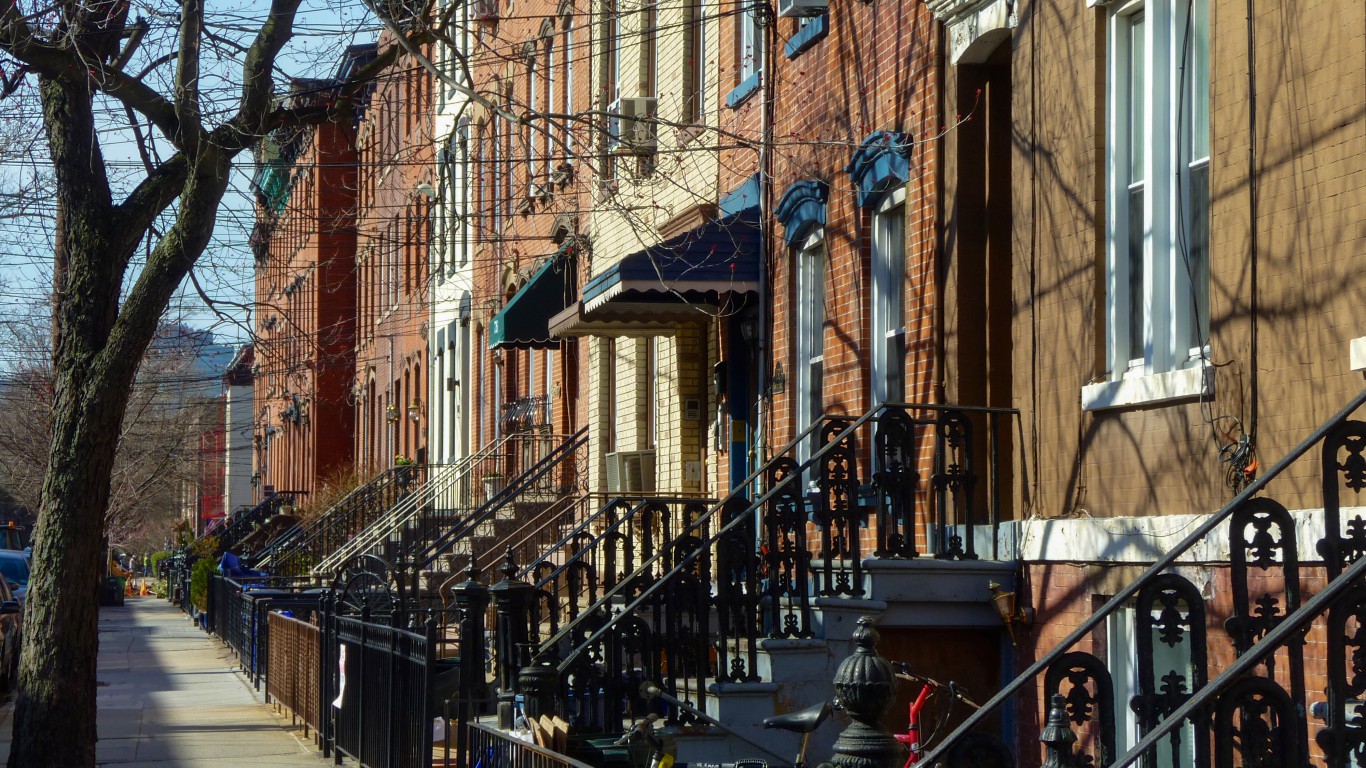
2. Hoboken, New Jersey
> Population with homes at risk of flooding in 2060: 14,747 (29.5%)
> Livable land that will be underwater by 2060: 49.8%
> Livable land that will be underwater by 2100: 71.3%
> Property value at risk in 2060: $4.51 billion
> Last major flooding event: April 2018
[in-text-ad-2]
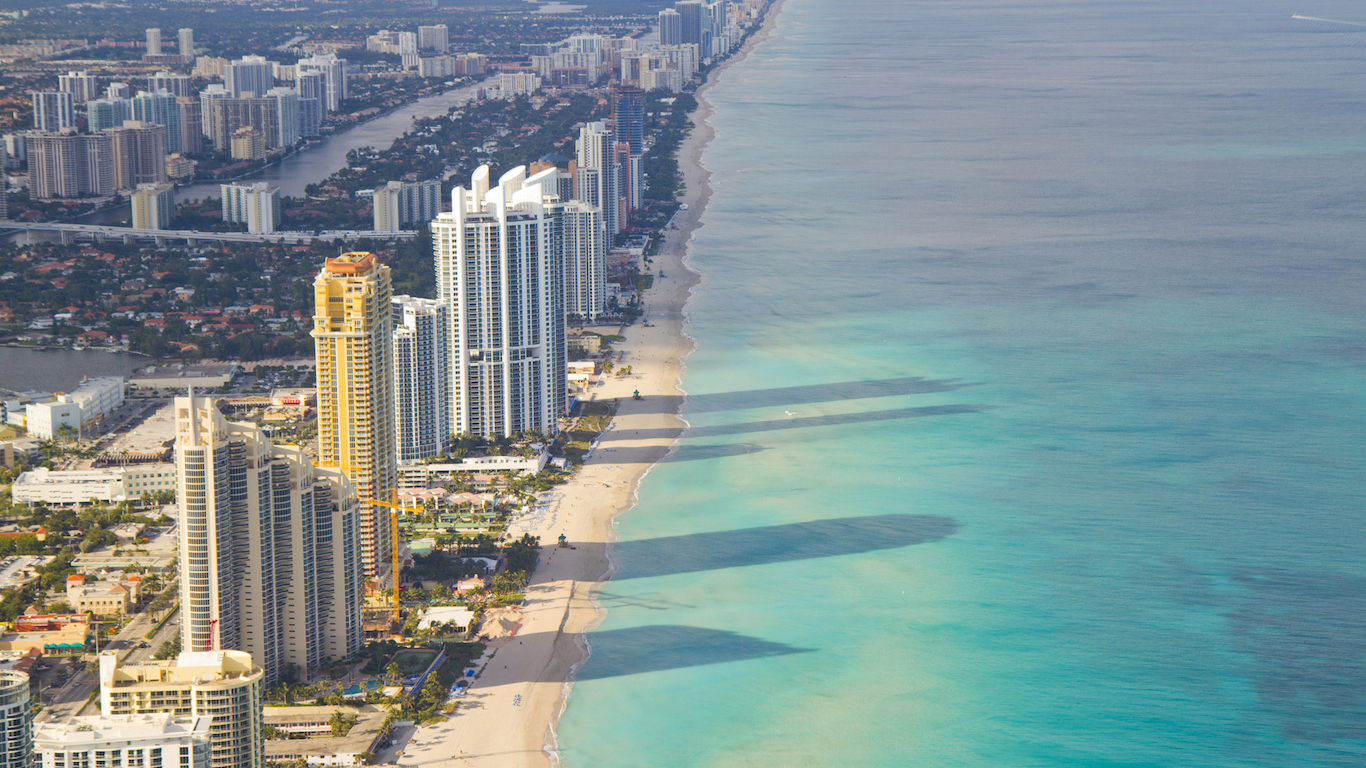
1. Miami Beach, Florida
> Population with homes at risk of flooding in 2060: 39,547 (30.2%)
> Livable land that will be underwater by 2060: 58.5%
> Livable land that will be underwater by 2100: 94.1%
> Property value at risk in 2060: $19.33 billion
> Last major flooding event: May 2018
Methodology
To identify the cities that will soon be underwater, 24/7 Wall St. reviewed data from “When Rising Seas Hit Home,” published July 2017 by Cambridge Massachusetts-based environmental watchdog group the Union of Concerned Scientists. The study identified U.S. coastal communities where the largest number of residents live in properties that are projected to face by 2060 the highest level of chronic and disruptive flooding, or effective inundation — defined as having 10% or more of livable land area flooded at least 26 times per year. We reviewed the number of properties and total value of properties that are exposed to flood risk based on a “high” scenario calculated by the Union for Concerned scientists, which entails a 6.5 foot rise in sea level by the end of the century. The places on our list, which are county subdivisions, are those in which the largest number of residents live in housing that is exposed to the effective inundation.
Credit card companies are at war, handing out free rewards and benefits to win the best customers. A good cash back card can be worth thousands of dollars a year in free money, not to mention other perks like travel, insurance, and access to fancy lounges. See our top picks for the best credit cards today. You won’t want to miss some of these offers.
Flywheel Publishing has partnered with CardRatings for our coverage of credit card products. Flywheel Publishing and CardRatings may receive a commission from card issuers.
Thank you for reading! Have some feedback for us?
Contact the 24/7 Wall St. editorial team.