
For many Americans, driving is a mundane, routine part of everyday life. As such, it can be easy to forget how dangerous it is. Car crashes are the leading cause of death among Americans age 54 and younger.
American roads have become more dangerous in recent years. There were 11.6 deaths attributable to motor vehicle crashes for every 100,000 Americans in 2016 — the highest rate since 2008.
The likelihood of dying in a car accident can increase substantially depending on where one is driving. Across the country, roadway fatality rates can more than quadruple from one state to the next. Several factors contribute to the varying degrees of danger on U.S. roadways, including environment, laws and regulations, driver behavior, and even economic conditions.
24/7 Wall St. reviewed motor vehicle crash death rates in each state to identify the states with the most dangerous roads. The states with the highest roadway fatality rates are concentrated in the South, while the states with the safest roads are mostly in the Northeast and Midwest.
Click here to see the states with the most dangerous roads.
Click here to see our detailed findings and methodology.
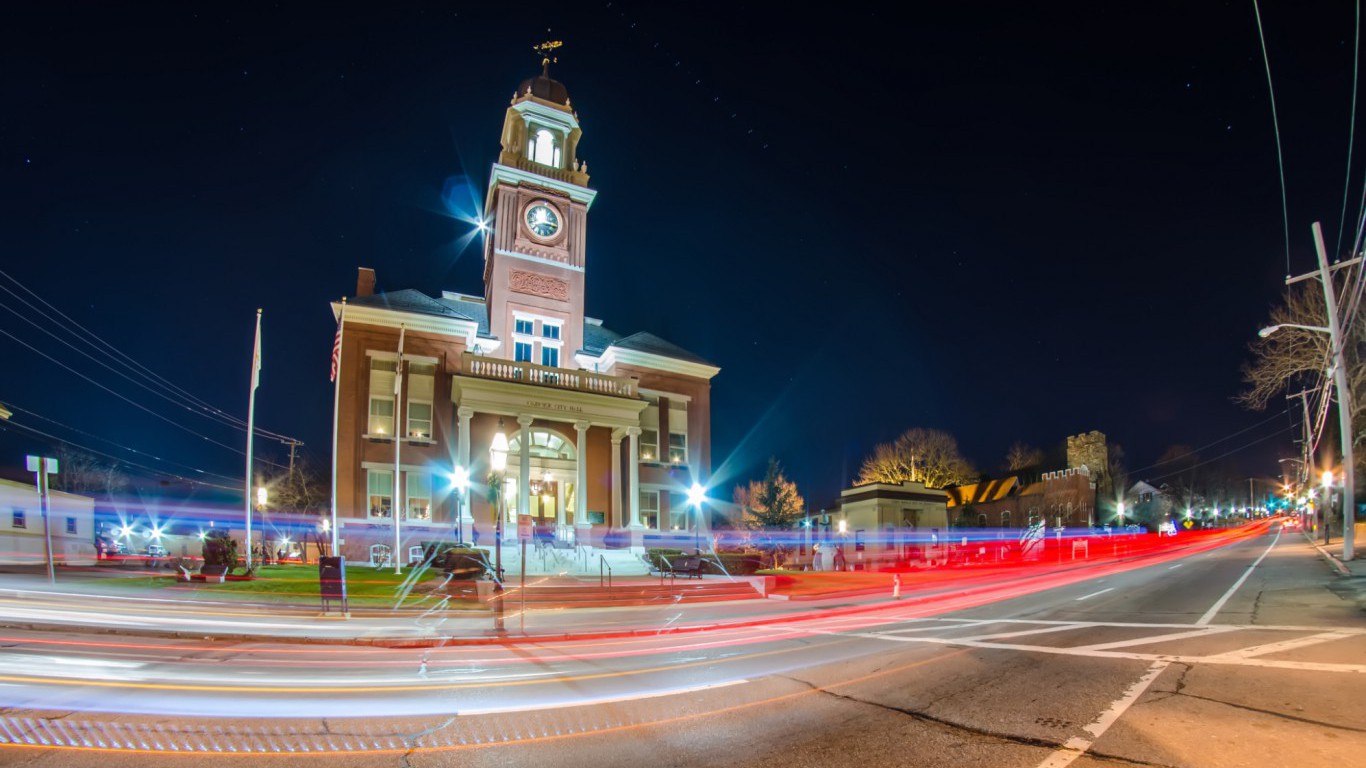
50. Rhode Island
> Road deaths per 100,000: 4.8
> 2016 roadway fatalities: 51 (the least)
> Seat belt use: 88%
> Deadliest holiday in 2016: Martin Luther King’s Birthday (1 fatal crash)
> Fatal crashes on rural roads: 20%
[in-text-ad]

49. New York
> Road deaths per 100,000: 5.2
> 2016 roadway fatalities: 1,025 (12th most)
> Seat belt use: 92%
> Deadliest holiday in 2016: Labor Day (14 fatal crashes)
> Fatal crashes on rural roads: 44%

48. Massachusetts
> Road deaths per 100,000: 5.7
> 2016 roadway fatalities: 389 (18th least)
> Seat belt use: 78%
> Deadliest holiday in 2016: Memorial Day (8 fatal crashes)
> Fatal crashes on rural roads: 4%
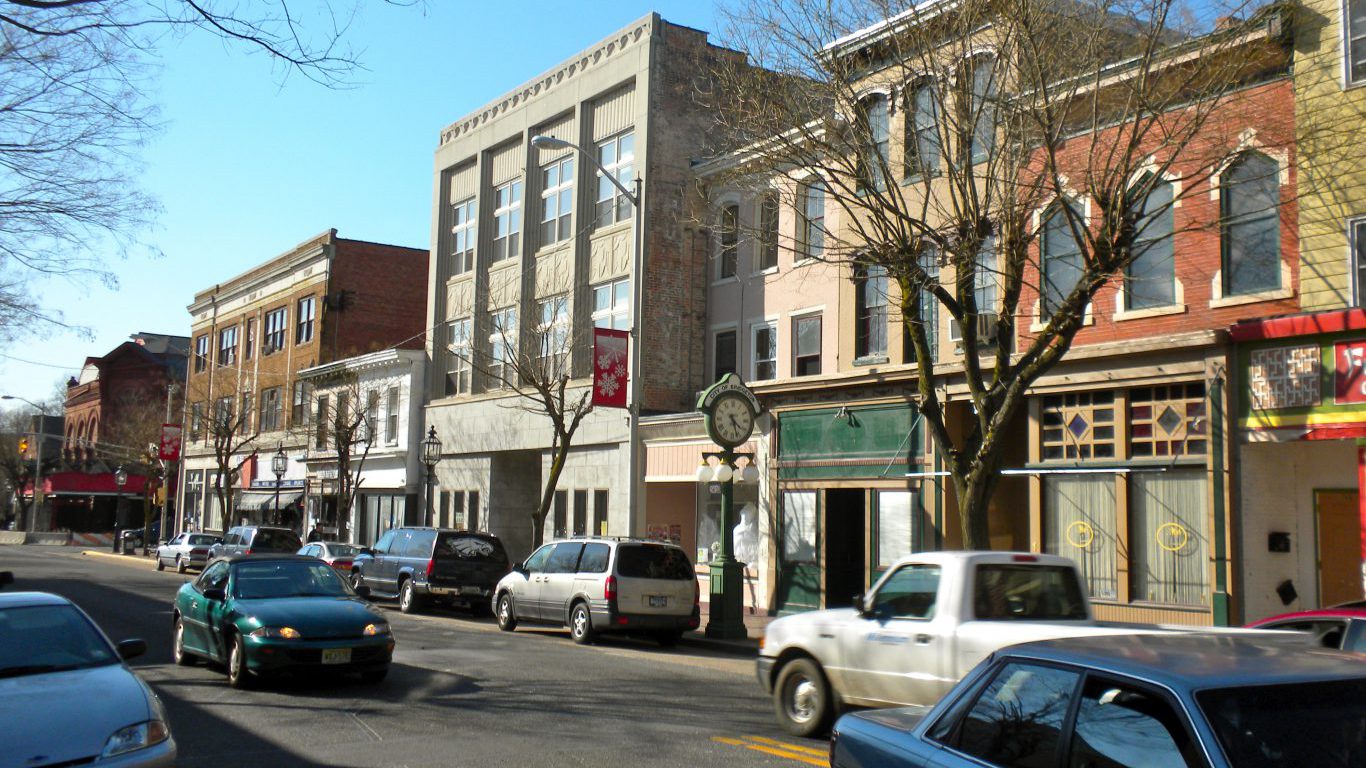
47. New Jersey
> Road deaths per 100,000: 6.7
> 2016 roadway fatalities: 601 (24th most)
> Seat belt use: 93%
> Deadliest holiday in 2016: Memorial Day (15 fatal crashes)
> Fatal crashes on rural roads: 14%
[in-text-ad-2]
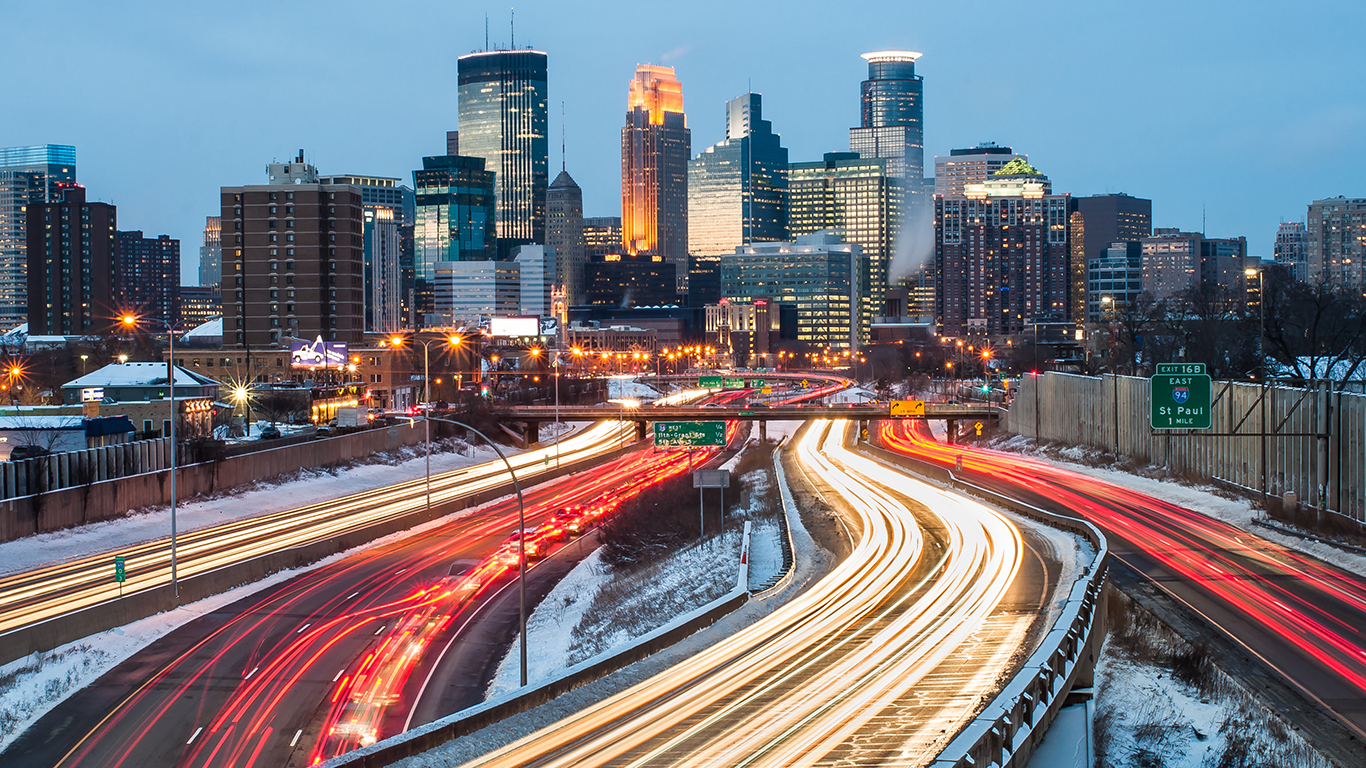
46. Minnesota
> Road deaths per 100,000: 7.1
> 2016 roadway fatalities: 392 (19th least)
> Seat belt use: 93%
> Deadliest holiday in 2016: Memorial Day (6 fatal crashes)
> Fatal crashes on rural roads: 59%

45. Washington
> Road deaths per 100,000: 7.4
> 2016 roadway fatalities: 537 (25th least)
> Seat belt use: 95%
> Deadliest holiday in 2016: President’s Day (5 fatal crashes)
> Fatal crashes on rural roads: 44%
[in-text-ad]

44. Connecticut
> Road deaths per 100,000: 8.2
> 2016 roadway fatalities: 293 (16th least)
> Seat belt use: 89%
> Deadliest holiday in 2016: Christmas (5 fatal crashes)
> Fatal crashes on rural roads: 13%

43. Maryland
> Road deaths per 100,000: 8.4
> 2016 roadway fatalities: 505 (24th least)
> Seat belt use: 91%
> Deadliest holiday in 2016: Christmas (13 fatal crashes)
> Fatal crashes on rural roads: 21%

42. Hawaii
> Road deaths per 100,000: 8.4
> 2016 roadway fatalities: 120 (8th least)
> Seat belt use: 95%
> Deadliest holiday in 2016: Independence Day (6 fatal crashes)
> Fatal crashes on rural roads: 21%
[in-text-ad-2]
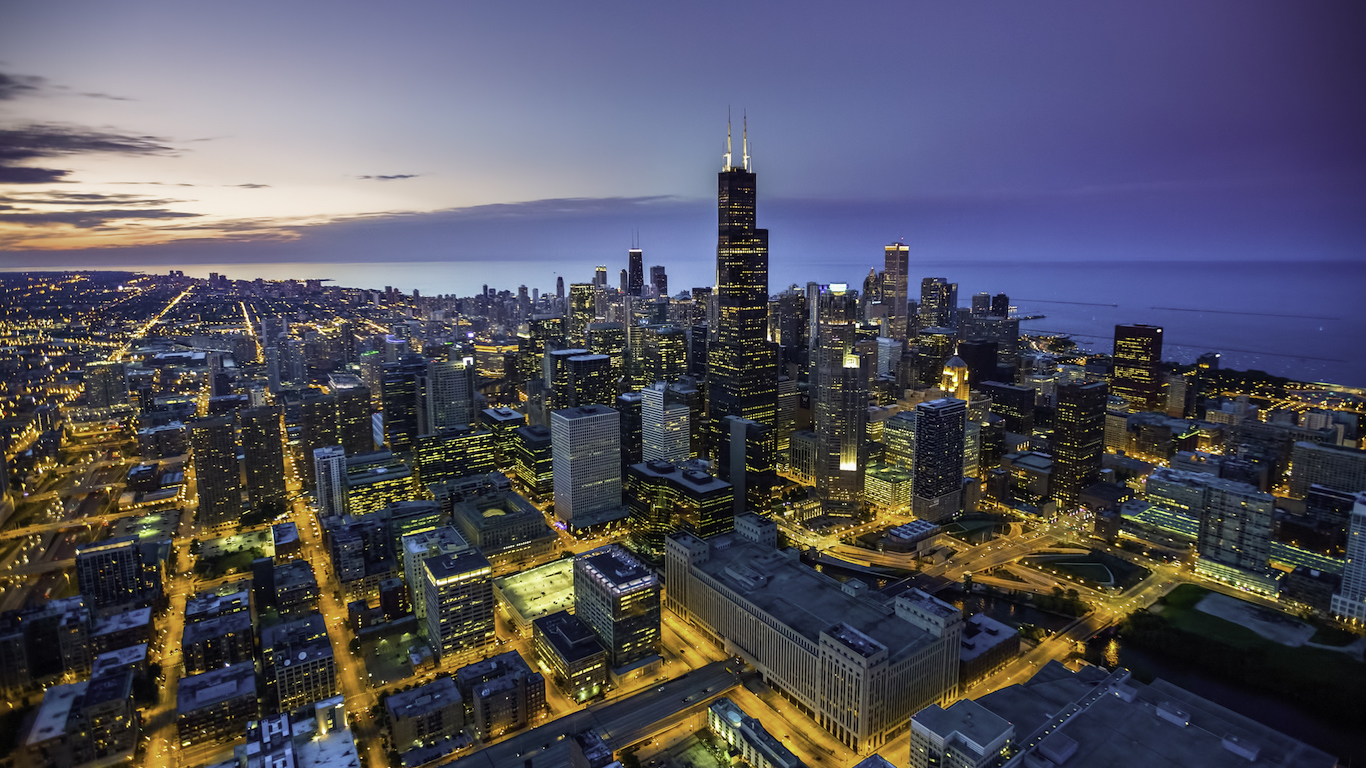
41. Illinois
> Road deaths per 100,000: 8.5
> 2016 roadway fatalities: 1,082 (8th most)
> Seat belt use: 93%
> Deadliest holiday in 2016: Labor Day (20 fatal crashes)
> Fatal crashes on rural roads: 40%

40. Virginia
> Road deaths per 100,000: 9.0
> 2016 roadway fatalities: 760 (18th most)
> Seat belt use: 79%
> Deadliest holiday in 2016: Christmas (12 fatal crashes)
> Fatal crashes on rural roads: 63%
[in-text-ad]

39. Utah
> Road deaths per 100,000: 9.2
> 2016 roadway fatalities: 281 (15th least)
> Seat belt use: 88%
> Deadliest holiday in 2016: Independence Day (5 fatal crashes)
> Fatal crashes on rural roads: 43%
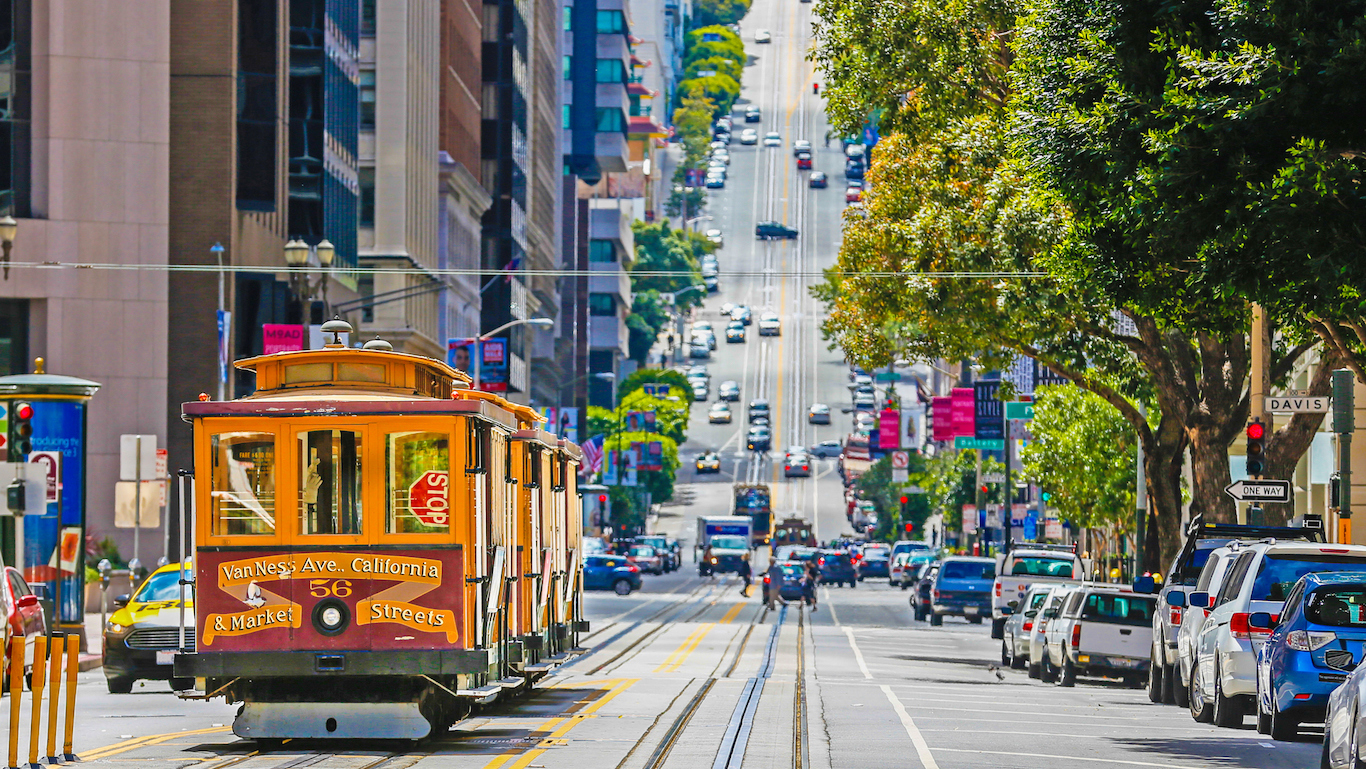
38. California
> Road deaths per 100,000: 9.2
> 2016 roadway fatalities: 3,623 (2nd most)
> Seat belt use: 97%
> Deadliest holiday in 2016: Memorial Day (39 fatal crashes)
> Fatal crashes on rural roads: 42%

37. Pennsylvania
> Road deaths per 100,000: 9.3
> 2016 roadway fatalities: 1,188 (6th most)
> Seat belt use: 85%
> Deadliest holiday in 2016: Labor Day (16 fatal crashes)
> Fatal crashes on rural roads: 54%
[in-text-ad-2]

36. Ohio
> Road deaths per 100,000: 9.7
> 2016 roadway fatalities: 1,132 (7th most)
> Seat belt use: 84%
> Deadliest holiday in 2016: Labor Day (14 fatal crashes)
> Fatal crashes on rural roads: 45%
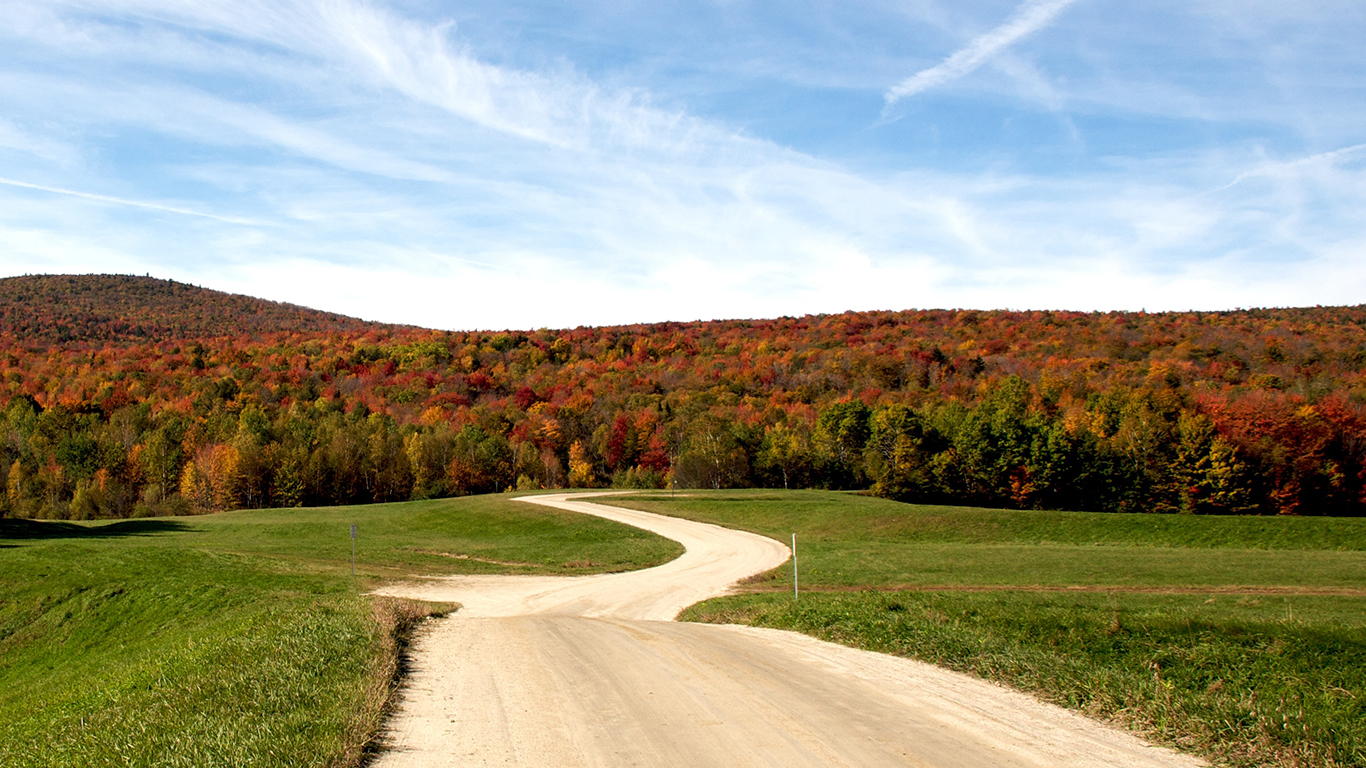
35. Vermont
> Road deaths per 100,000: 9.9
> 2016 roadway fatalities: 62 (2nd least)
> Seat belt use: 80%
> Deadliest holiday in 2016: Memorial Day (3 fatal crashes)
> Fatal crashes on rural roads: 84%
[in-text-ad]

34. New Hampshire
> Road deaths per 100,000: 10.2
> 2016 roadway fatalities: 136 (9th least)
> Seat belt use: 70%
> Deadliest holiday in 2016: Columbus Day (6 fatal crashes)
> Fatal crashes on rural roads: 55%

33. Wisconsin
> Road deaths per 100,000: 10.5
> 2016 roadway fatalities: 607 (23rd most)
> Seat belt use: 88%
> Deadliest holiday in 2016: Columbus Day (11 fatal crashes)
> Fatal crashes on rural roads: 67%
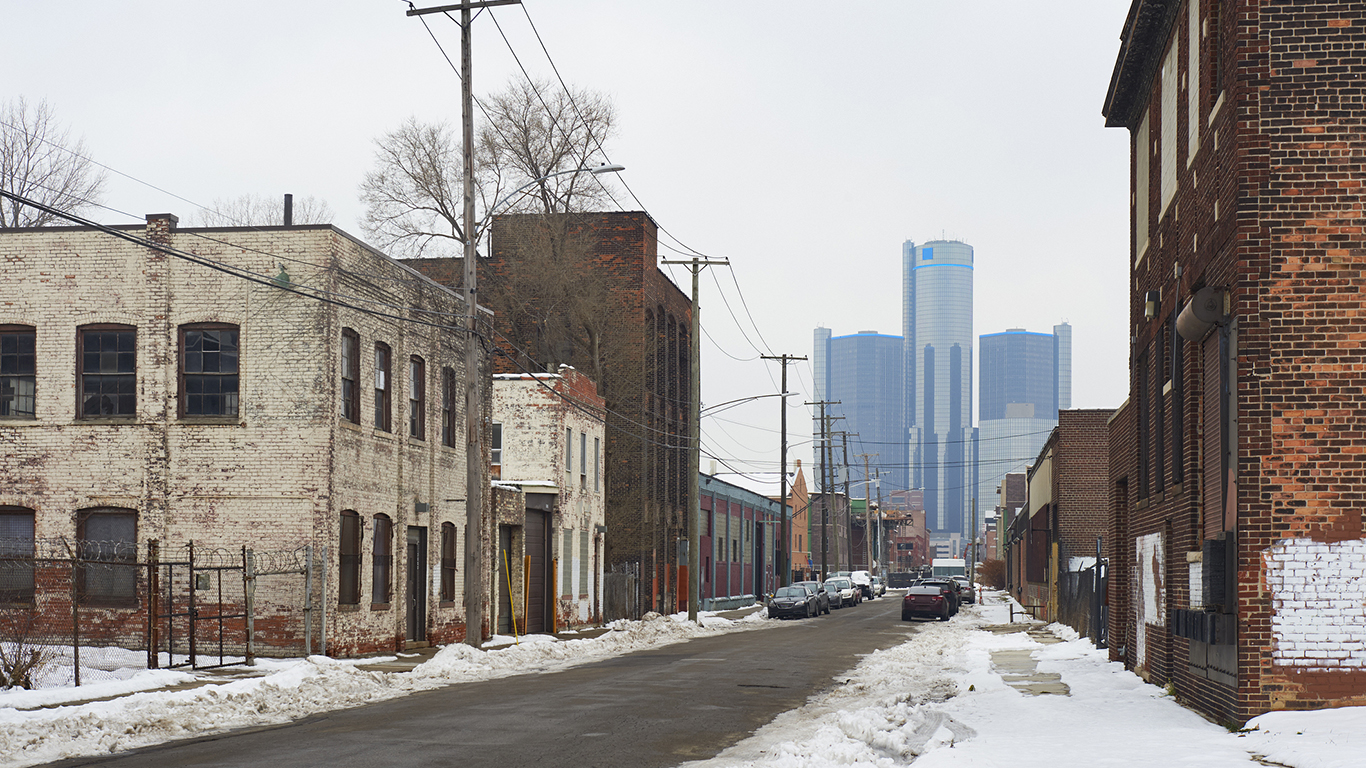
32. Michigan
> Road deaths per 100,000: 10.7
> 2016 roadway fatalities: 1,064 (9th most)
> Seat belt use: 95%
> Deadliest holiday in 2016: Independence Day (13 fatal crashes)
> Fatal crashes on rural roads: 40%
[in-text-ad-2]

31. Colorado
> Road deaths per 100,000: 11.0
> 2016 roadway fatalities: 608 (22nd most)
> Seat belt use: 84%
> Deadliest holiday in 2016: Labor Day (14 fatal crashes)
> Fatal crashes on rural roads: 44%

30. Nevada
> Road deaths per 100,000: 11.2
> 2016 roadway fatalities: 328 (17th least)
> Seat belt use: 89%
> Deadliest holiday in 2016: Memorial Day (5 fatal crashes)
> Fatal crashes on rural roads: 29%
[in-text-ad]

29. Alaska
> Road deaths per 100,000: 11.3
> 2016 roadway fatalities: 84 (3rd least)
> Seat belt use: 89%
> Deadliest holiday in 2016: Martin Luther King’s Birthday (2 fatal crashes)
> Fatal crashes on rural roads: 63%
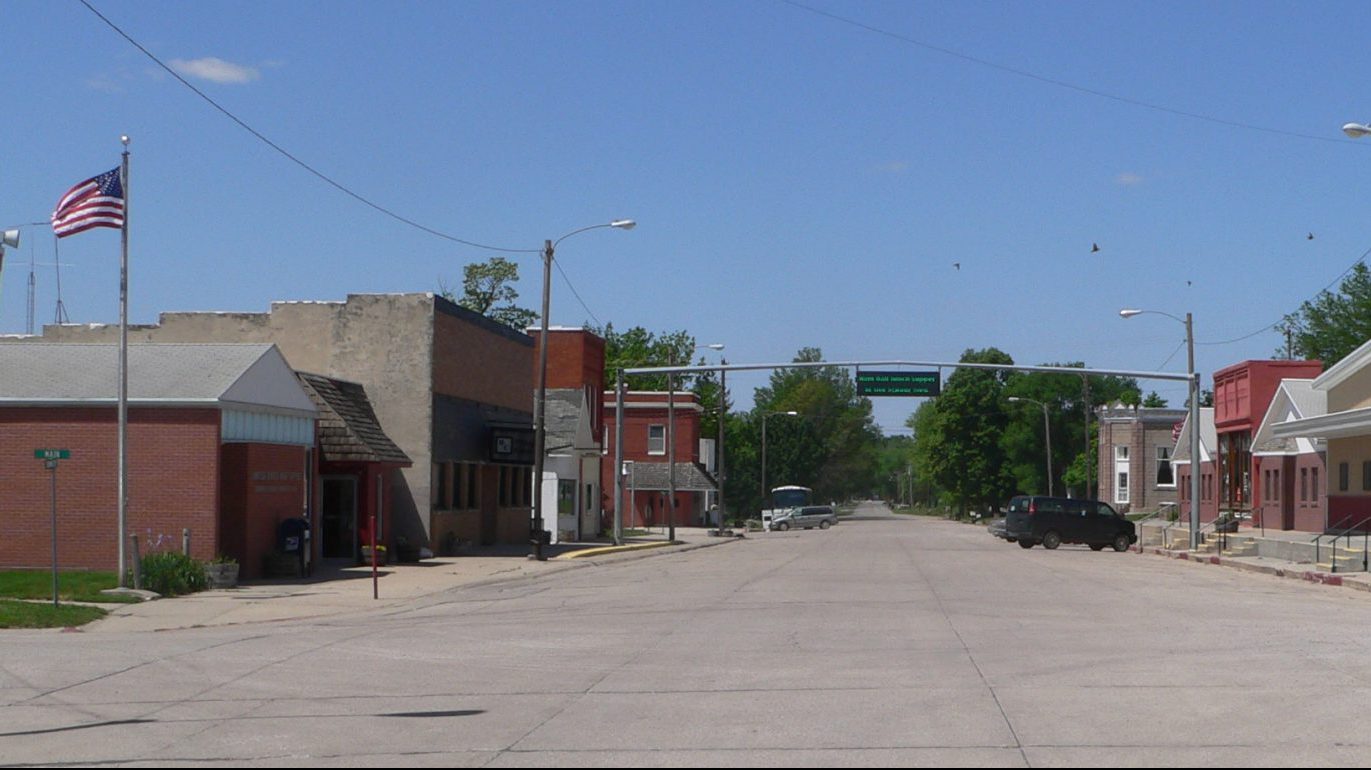
28. Nebraska
> Road deaths per 100,000: 11.4
> 2016 roadway fatalities: 218 (12th least)
> Seat belt use: 83%
> Deadliest holiday in 2016: Memorial Day (3 fatal crashes)
> Fatal crashes on rural roads: 76%

27. Maine
> Road deaths per 100,000: 12.1
> 2016 roadway fatalities: 161 (10th least)
> Seat belt use: 86%
> Deadliest holiday in 2016: Independence Day (4 fatal crashes)
> Fatal crashes on rural roads: 81%
[in-text-ad-2]
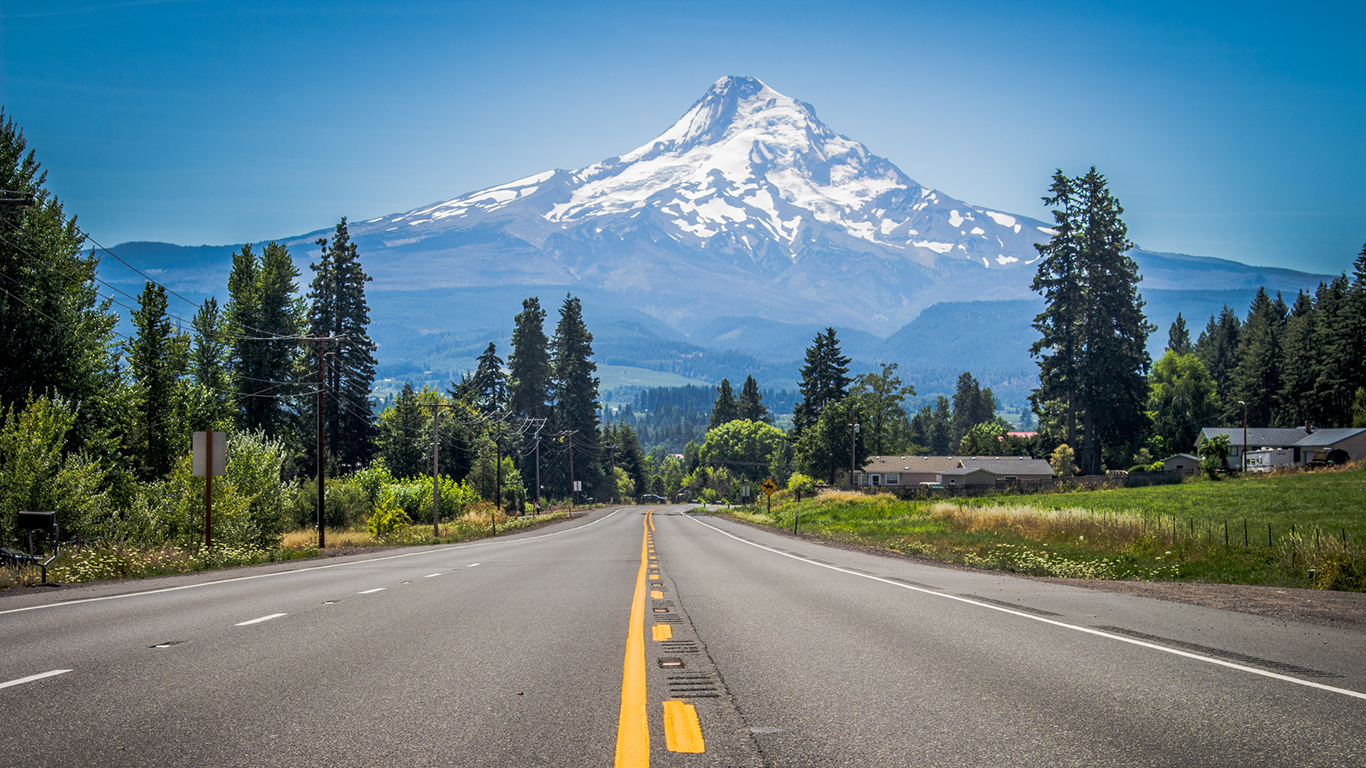
26. Oregon
> Road deaths per 100,000: 12.1
> 2016 roadway fatalities: 495 (23rd least)
> Seat belt use: 96%
> Deadliest holiday in 2016: Memorial Day (8 fatal crashes)
> Fatal crashes on rural roads: 69%
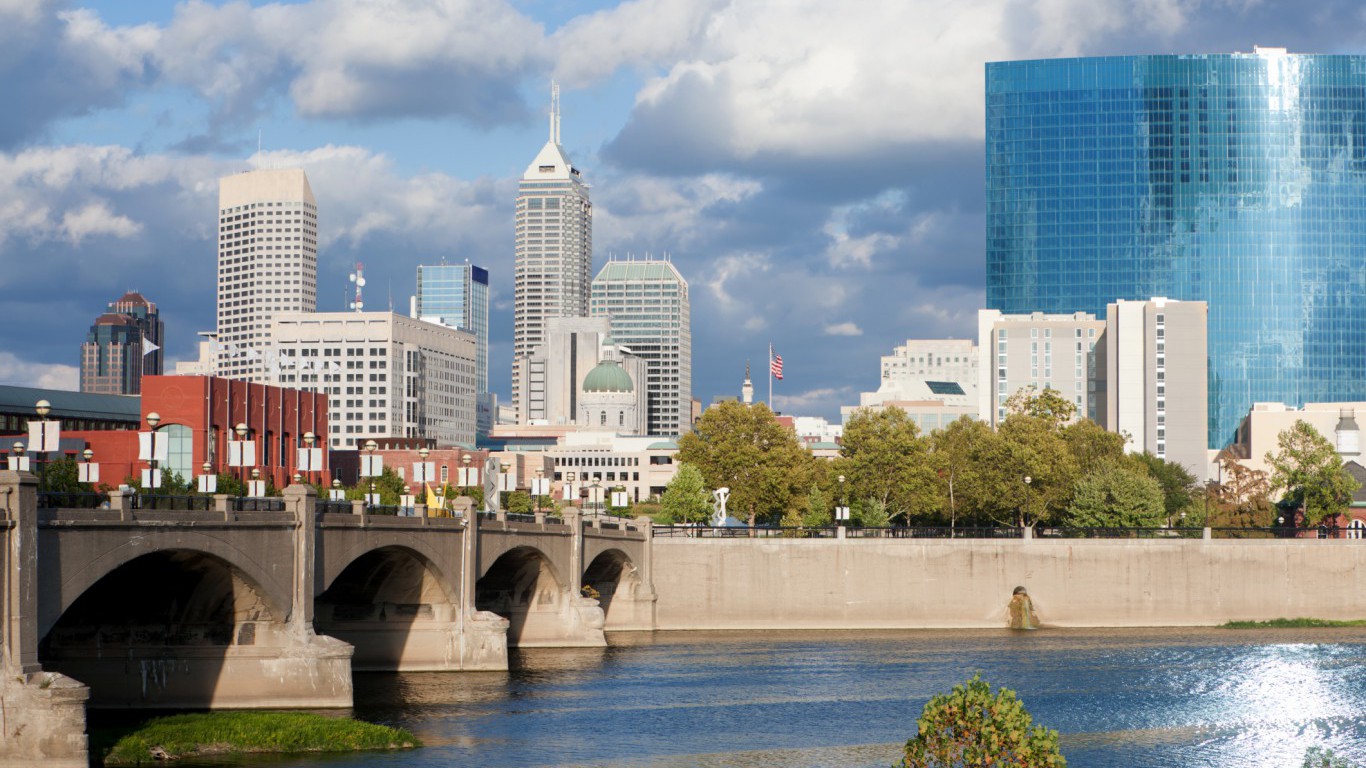
25. Indiana
> Road deaths per 100,000: 12.4
> 2016 roadway fatalities: 821 (17th most)
> Seat belt use: 92%
> Deadliest holiday in 2016: Independence Day (13 fatal crashes)
> Fatal crashes on rural roads: 66%
[in-text-ad]
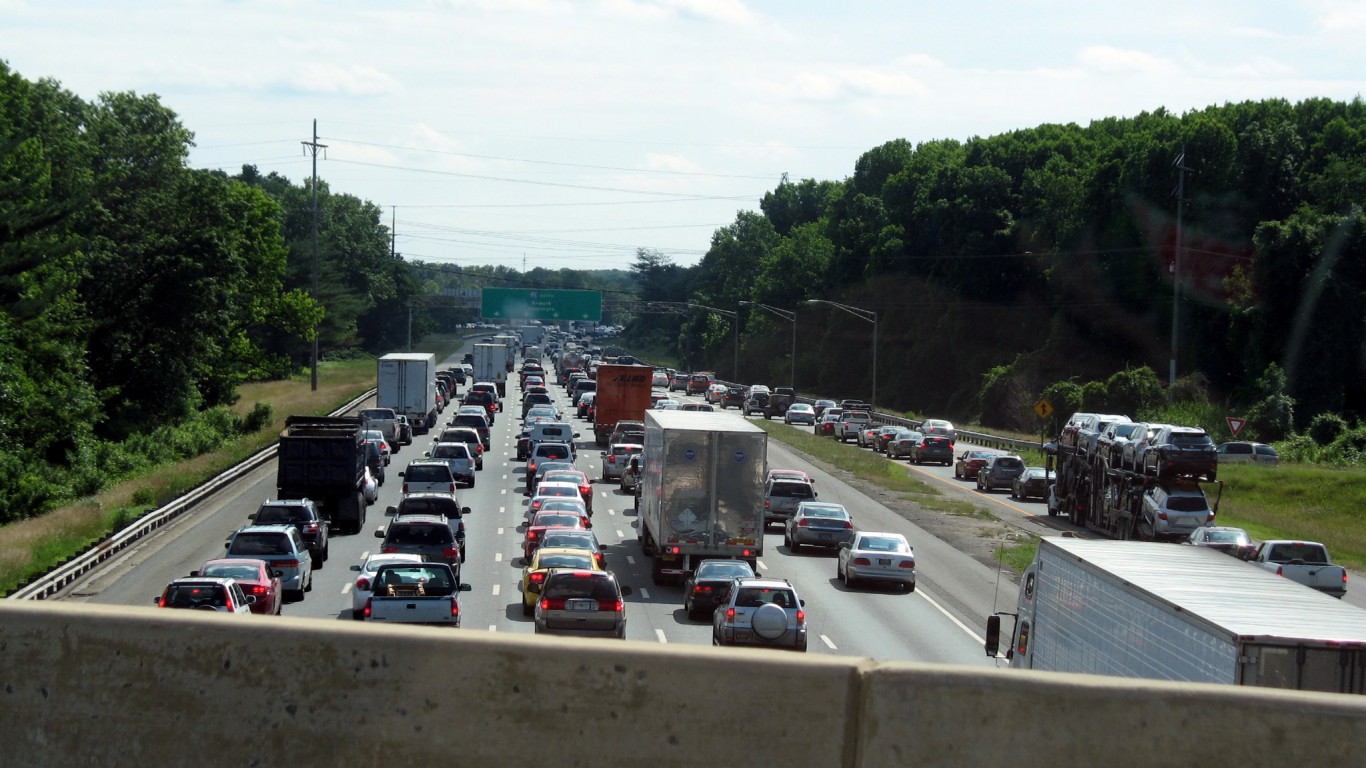
24. Delaware
> Road deaths per 100,000: 12.5
> 2016 roadway fatalities: 119 (7th least)
> Seat belt use: 91%
> Deadliest holiday in 2016: Martin Luther King’s Birthday (2 fatal crashes)
> Fatal crashes on rural roads: 58%
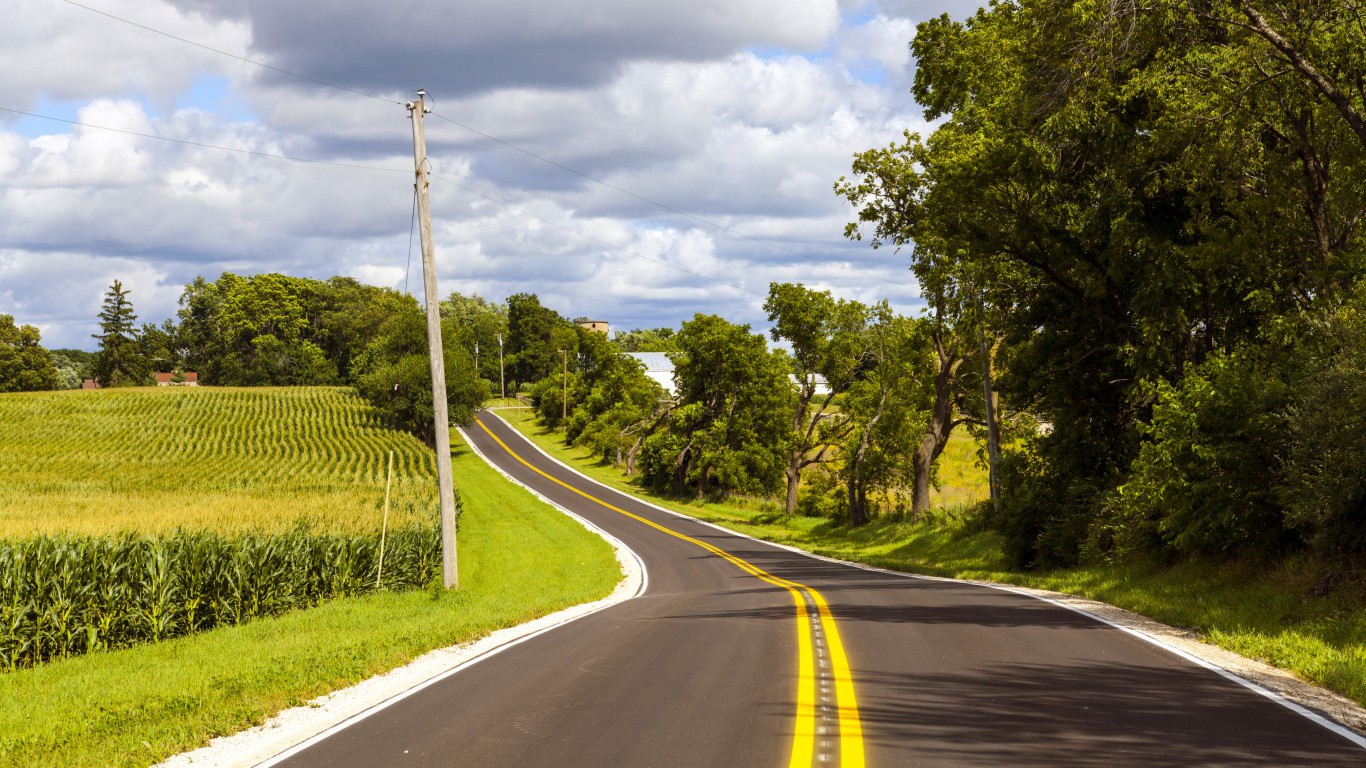
23. Iowa
> Road deaths per 100,000: 12.9
> 2016 roadway fatalities: 404 (21st least)
> Seat belt use: 94%
> Deadliest holiday in 2016: President’s Day (4 fatal crashes)
> Fatal crashes on rural roads: 76%
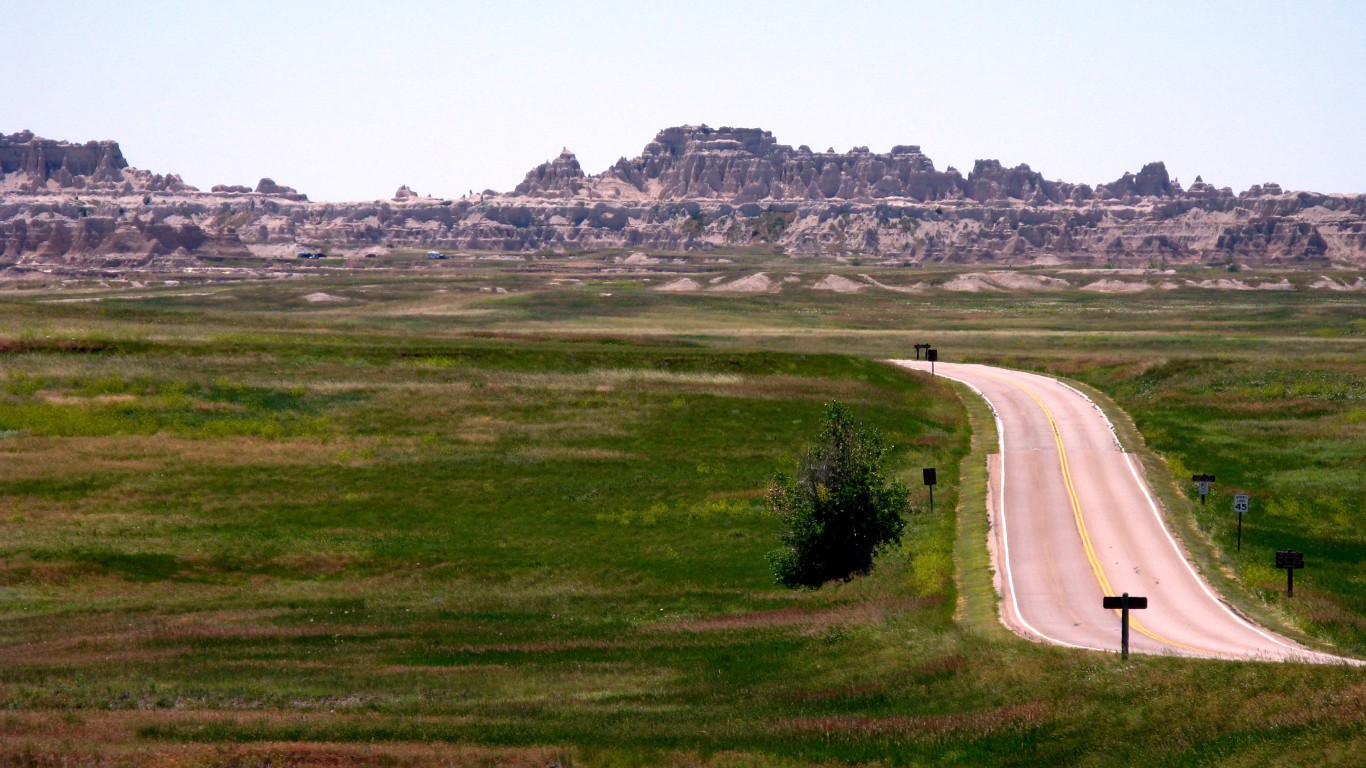
22. South Dakota
> Road deaths per 100,000: 13.4
> 2016 roadway fatalities: 116 (6th least)
> Seat belt use: 74%
> Deadliest holiday in 2016: Independence Day (2 fatal crashes)
> Fatal crashes on rural roads: 89%
[in-text-ad-2]
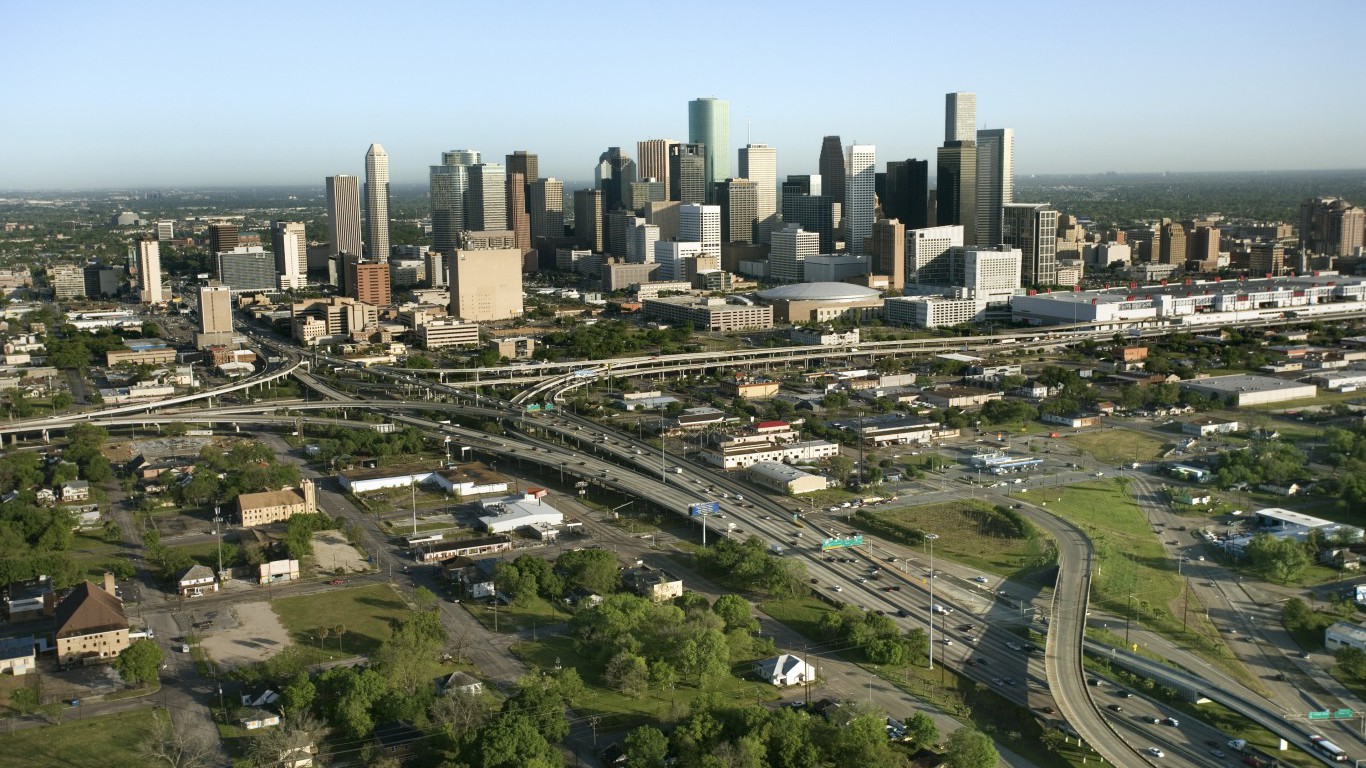
21. Texas
> Road deaths per 100,000: 13.6
> 2016 roadway fatalities: 3,776 (the most)
> Seat belt use: 92%
> Deadliest holiday in 2016: President’s Day (46 fatal crashes)
> Fatal crashes on rural roads: 39%
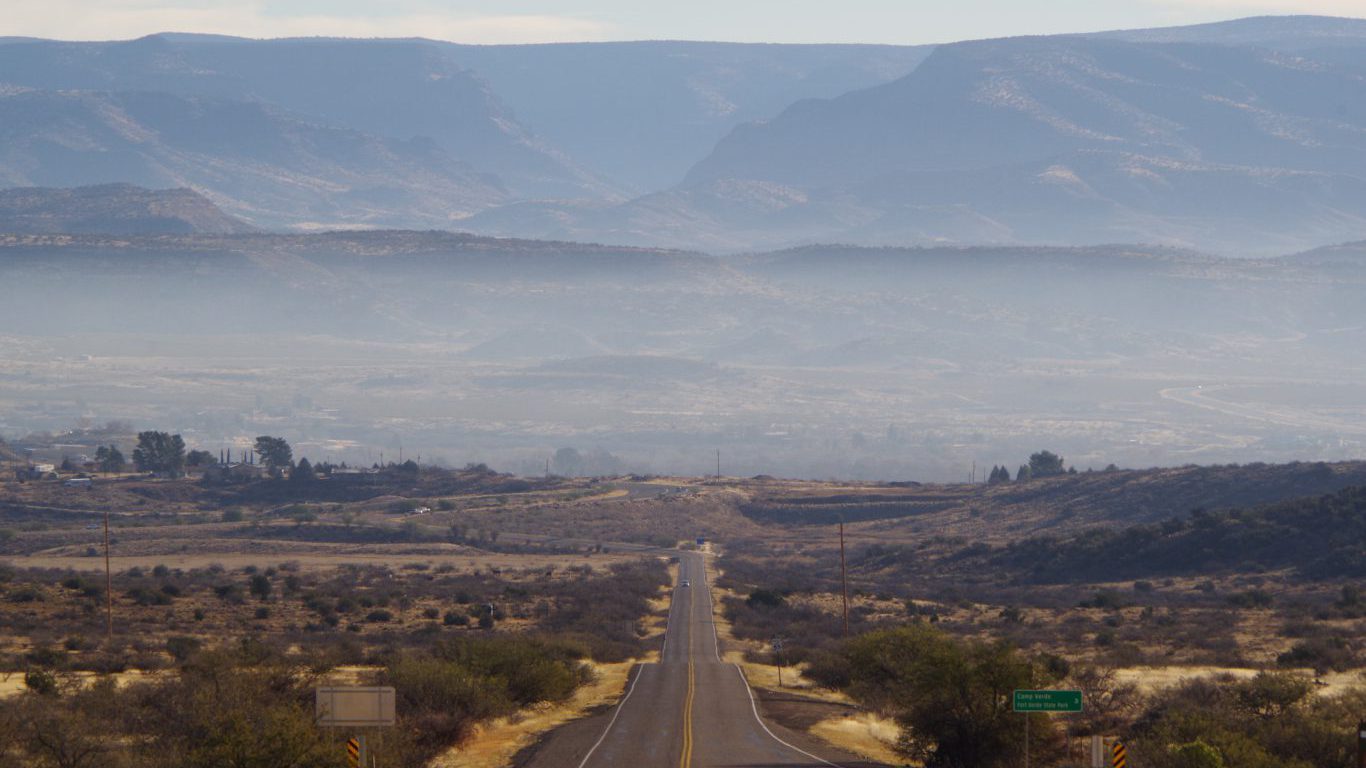
20. Arizona
> Road deaths per 100,000: 13.9
> 2016 roadway fatalities: 962 (14th most)
> Seat belt use: 88%
> Deadliest holiday in 2016: Independence Day (13 fatal crashes)
> Fatal crashes on rural roads: 35%
[in-text-ad]
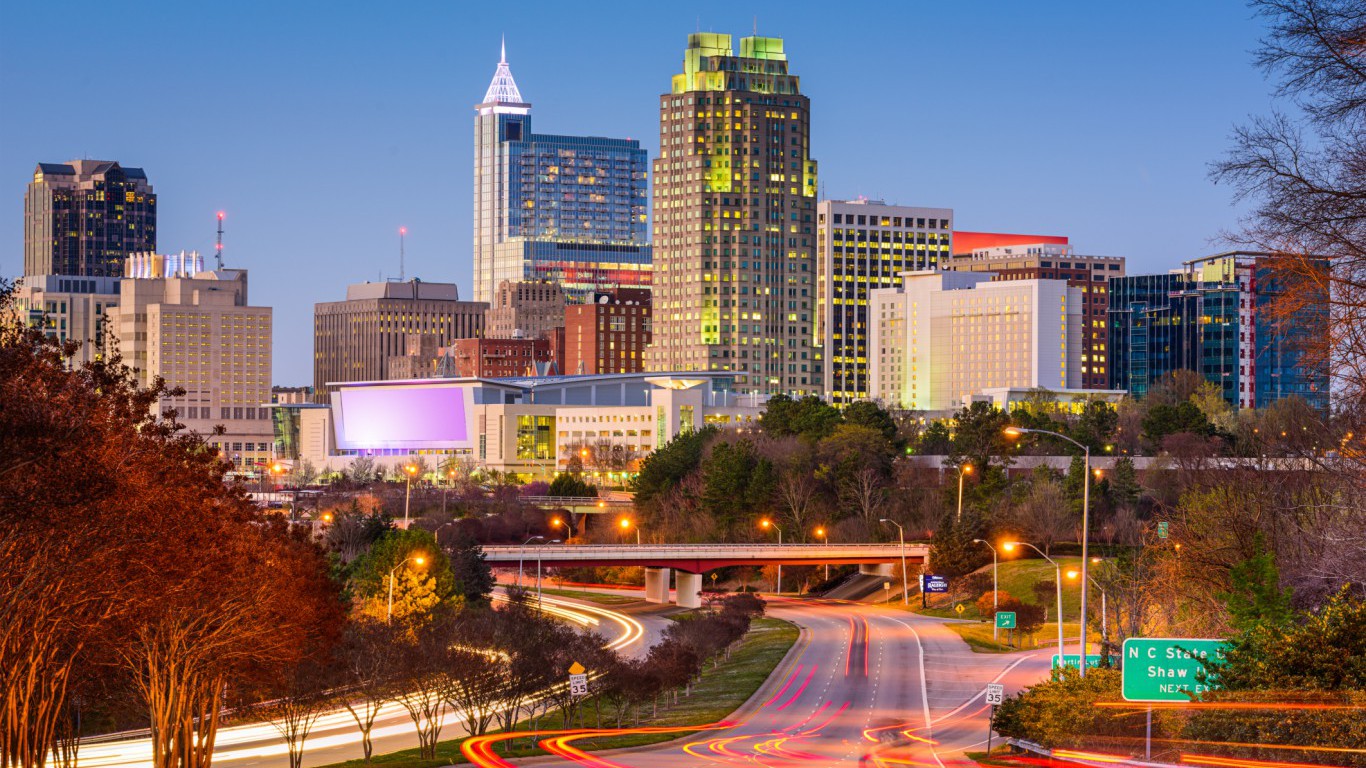
19. North Carolina
> Road deaths per 100,000: 14.3
> 2016 roadway fatalities: 1,450 (5th most)
> Seat belt use: 92%
> Deadliest holiday in 2016: Columbus Day (21 fatal crashes)
> Fatal crashes on rural roads: 62%

18. West Virginia
> Road deaths per 100,000: 14.7
> 2016 roadway fatalities: 269 (14th least)
> Seat belt use: 87%
> Deadliest holiday in 2016: Independence Day (6 fatal crashes)
> Fatal crashes on rural roads: 63%
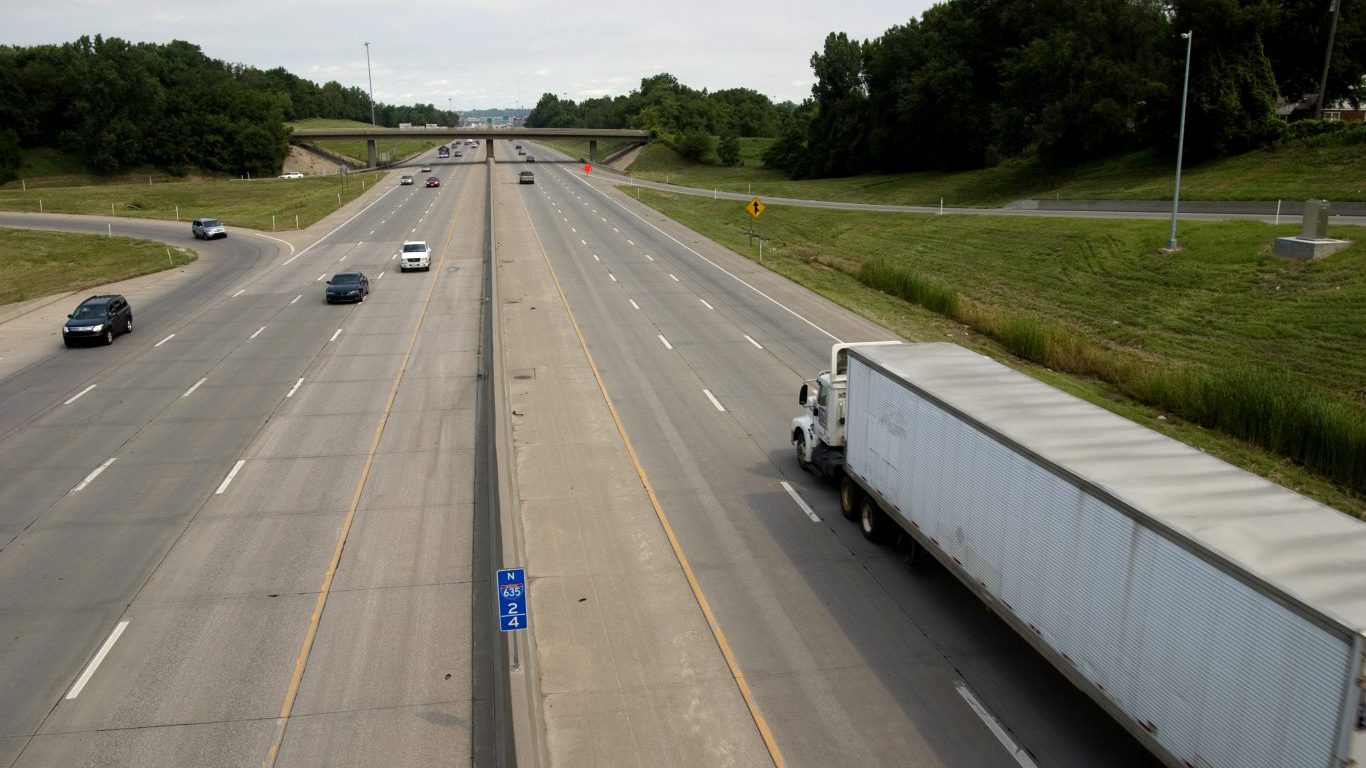
17. Kansas
> Road deaths per 100,000: 14.8
> 2016 roadway fatalities: 429 (22nd least)
> Seat belt use: 87%
> Deadliest holiday in 2016: Labor Day (7 fatal crashes)
> Fatal crashes on rural roads: 67%
[in-text-ad-2]
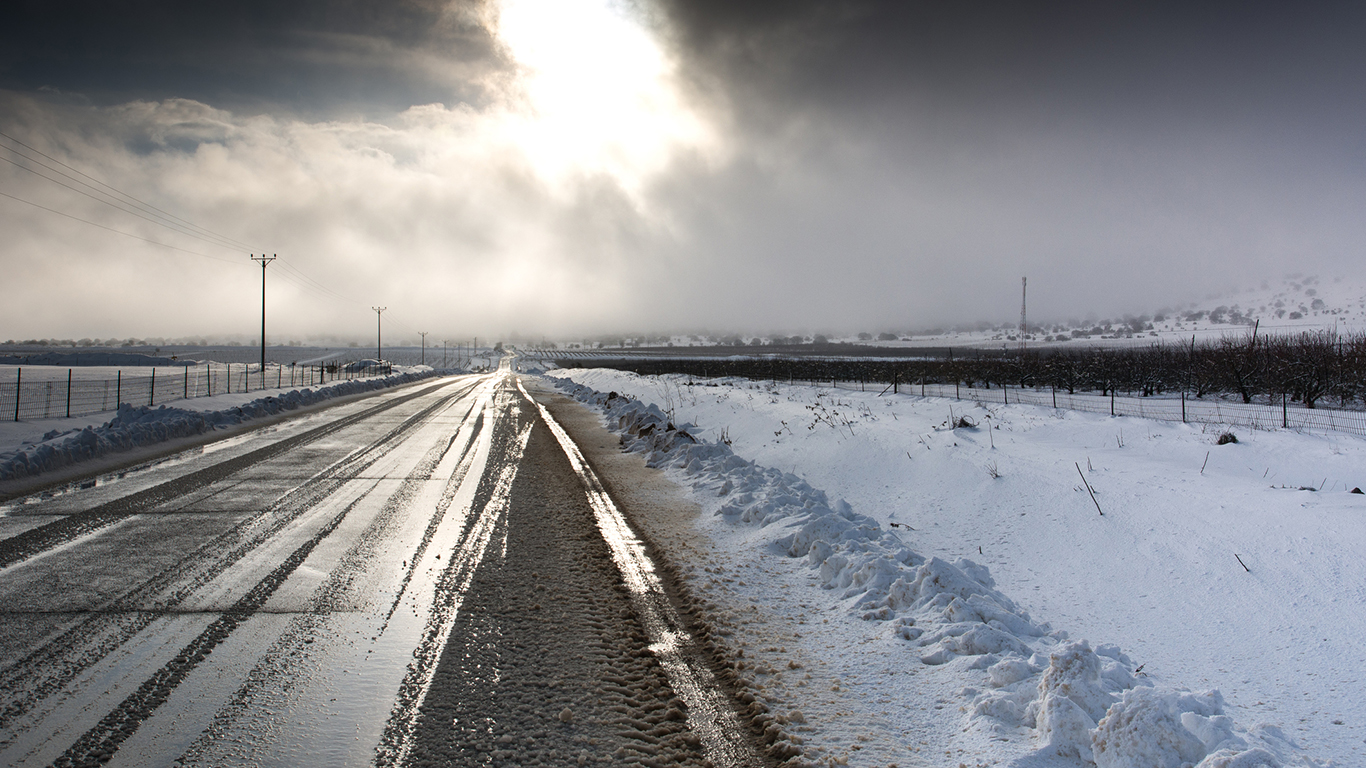
16. North Dakota
> Road deaths per 100,000: 14.9
> 2016 roadway fatalities: 113 (5th least)
> Seat belt use: 83%
> Deadliest holiday in 2016: Columbus Day (3 fatal crashes)
> Fatal crashes on rural roads: 94%

15. Idaho
> Road deaths per 100,000: 15.0
> 2016 roadway fatalities: 253 (13th least)
> Seat belt use: 83%
> Deadliest holiday in 2016: Memorial Day (5 fatal crashes)
> Fatal crashes on rural roads: 77%
[in-text-ad]
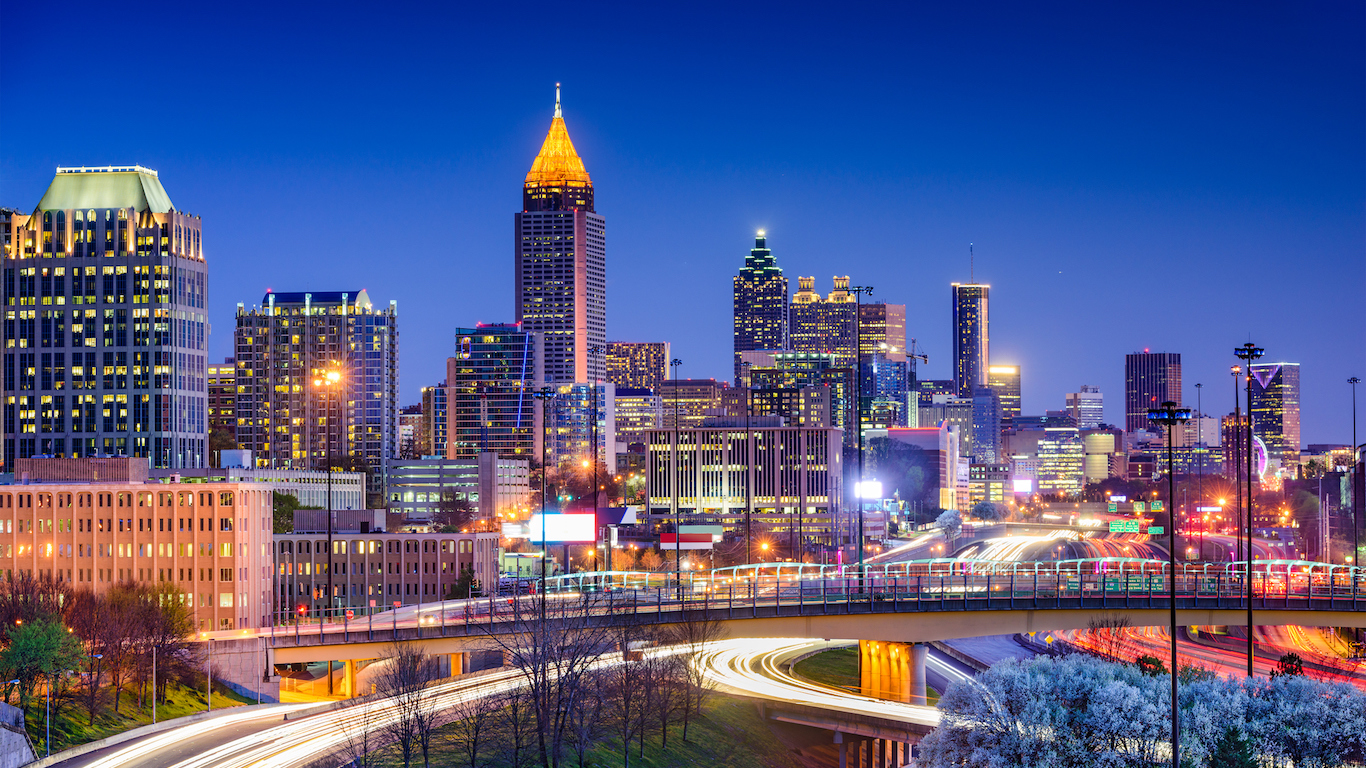
14. Georgia
> Road deaths per 100,000: 15.1
> 2016 roadway fatalities: 1,554 (4th most)
> Seat belt use: 97%
> Deadliest holiday in 2016: Martin Luther King’s Birthday (17 fatal crashes)
> Fatal crashes on rural roads: 39%

13. Florida
> Road deaths per 100,000: 15.4
> 2016 roadway fatalities: 3,174 (3rd most)
> Seat belt use: 90%
> Deadliest holiday in 2016: President’s Day (40 fatal crashes)
> Fatal crashes on rural roads: 44%

12. Missouri
> Road deaths per 100,000: 15.5
> 2016 roadway fatalities: 945 (15th most)
> Seat belt use: 81%
> Deadliest holiday in 2016: Labor Day (18 fatal crashes)
> Fatal crashes on rural roads: 58%
[in-text-ad-2]

11. Tennessee
> Road deaths per 100,000: 15.7
> 2016 roadway fatalities: 1,041 (10th most)
> Seat belt use: 89%
> Deadliest holiday in 2016: President’s Day (15 fatal crashes)
> Fatal crashes on rural roads: 45%
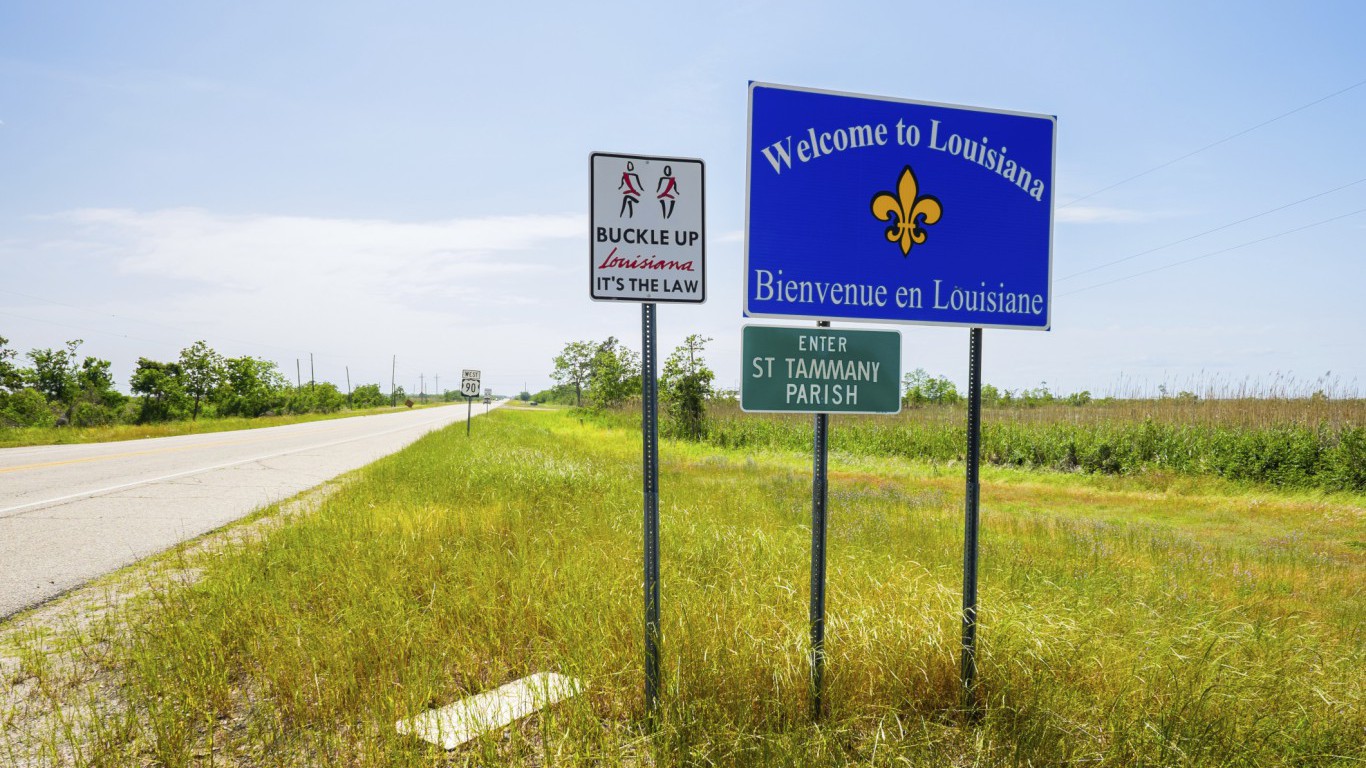
10. Louisiana
> Road deaths per 100,000: 16.2
> 2016 roadway fatalities: 757 (19th most)
> Seat belt use: 88%
> Deadliest holiday in 2016: Martin Luther King’s Birthday (14 fatal crashes)
> Fatal crashes on rural roads: 49%
[in-text-ad]
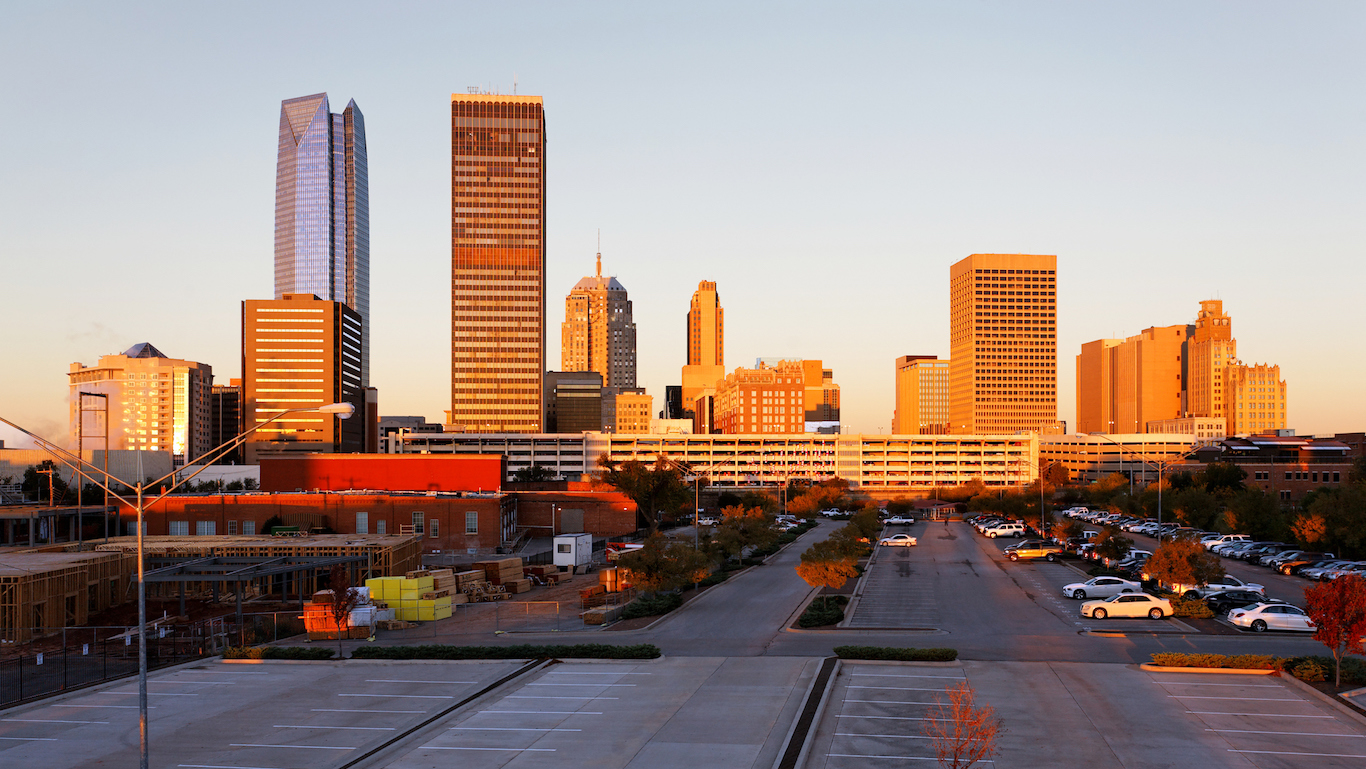
9. Oklahoma
> Road deaths per 100,000: 17.4
> 2016 roadway fatalities: 683 (21st most)
> Seat belt use: 87%
> Deadliest holiday in 2016: Labor Day (8 fatal crashes)
> Fatal crashes on rural roads: 62%
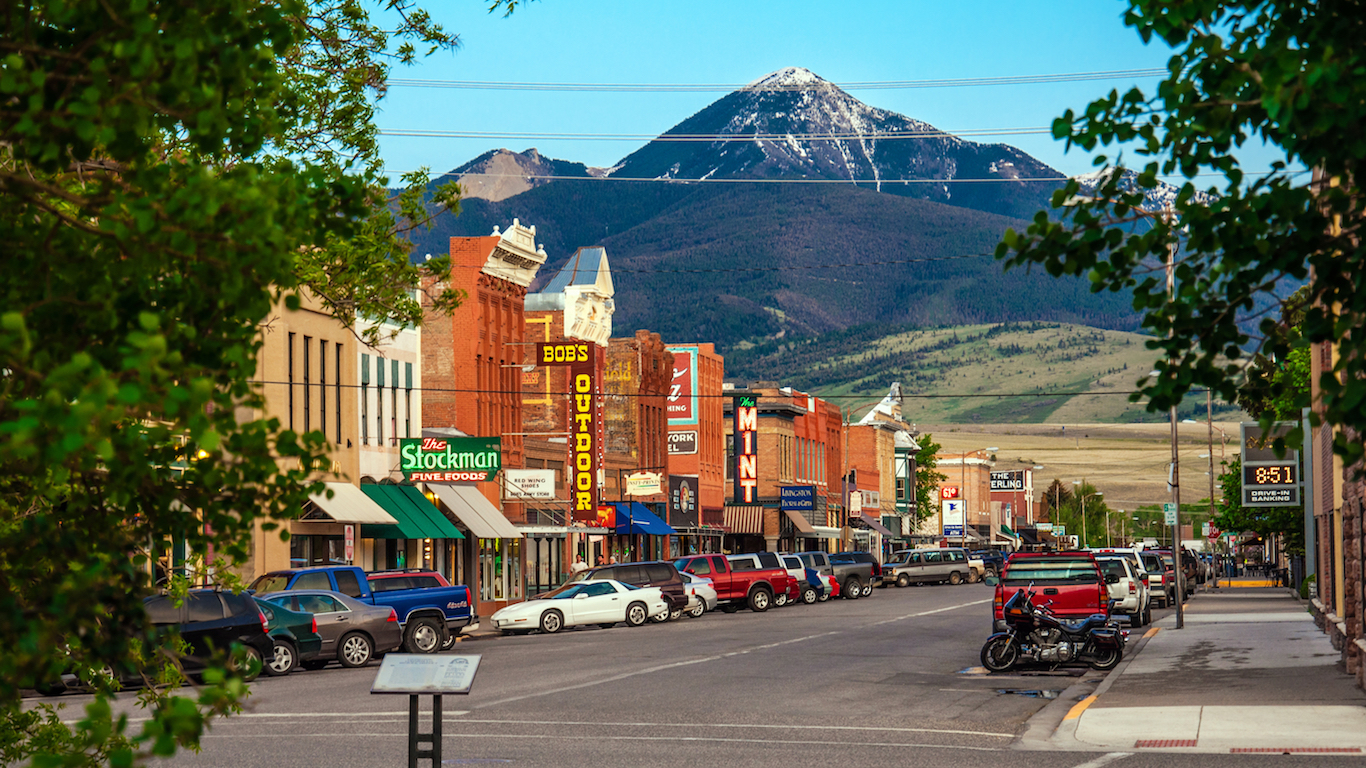
8. Montana
> Road deaths per 100,000: 18.2
> 2016 roadway fatalities: 190 (11th least)
> Seat belt use: 76%
> Deadliest holiday in 2016: Labor Day (4 fatal crashes)
> Fatal crashes on rural roads: 89%
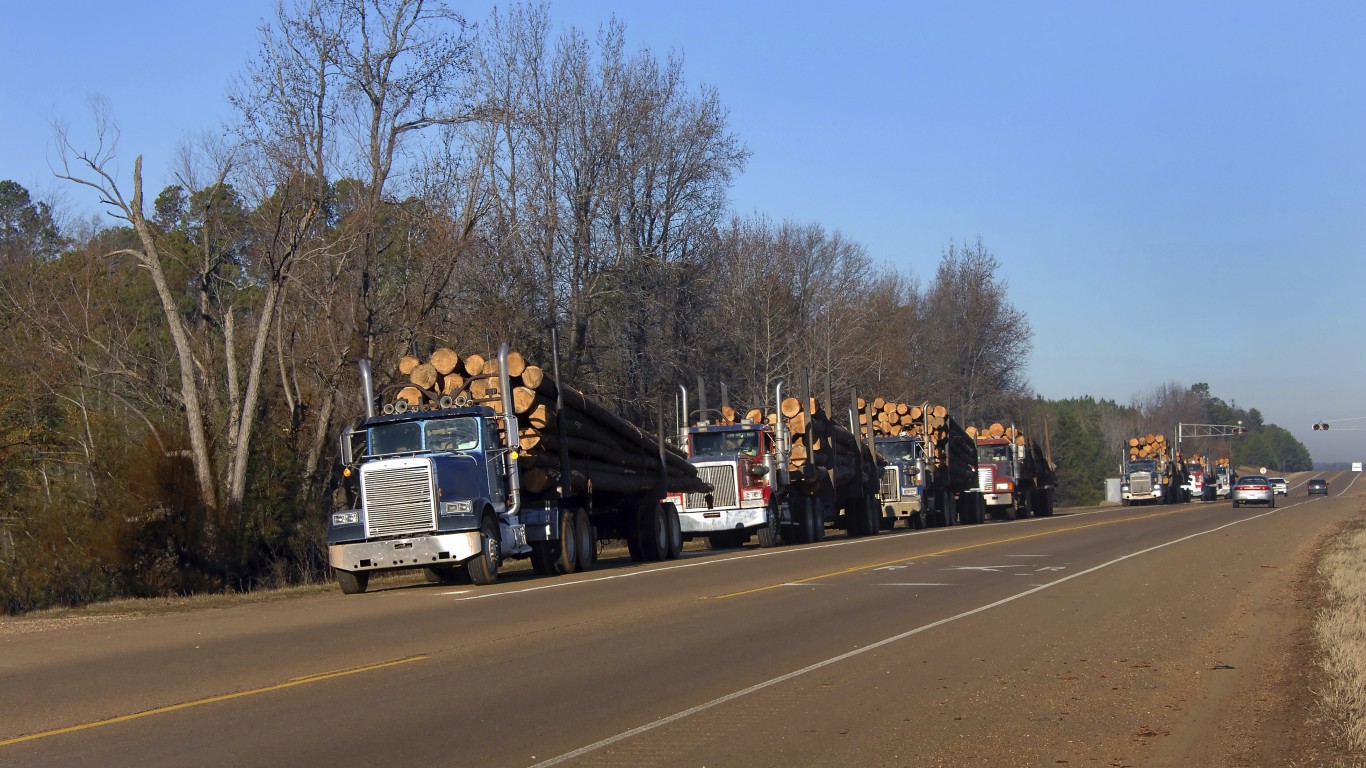
7. Arkansas
> Road deaths per 100,000: 18.2
> 2016 roadway fatalities: 545 (25th most)
> Seat belt use: 75%
> Deadliest holiday in 2016: Memorial Day (9 fatal crashes)
> Fatal crashes on rural roads: 66%
[in-text-ad-2]

6. Kentucky
> Road deaths per 100,000: 18.8
> 2016 roadway fatalities: 834 (16th most)
> Seat belt use: 87%
> Deadliest holiday in 2016: Columbus Day (11 fatal crashes)
> Fatal crashes on rural roads: 73%
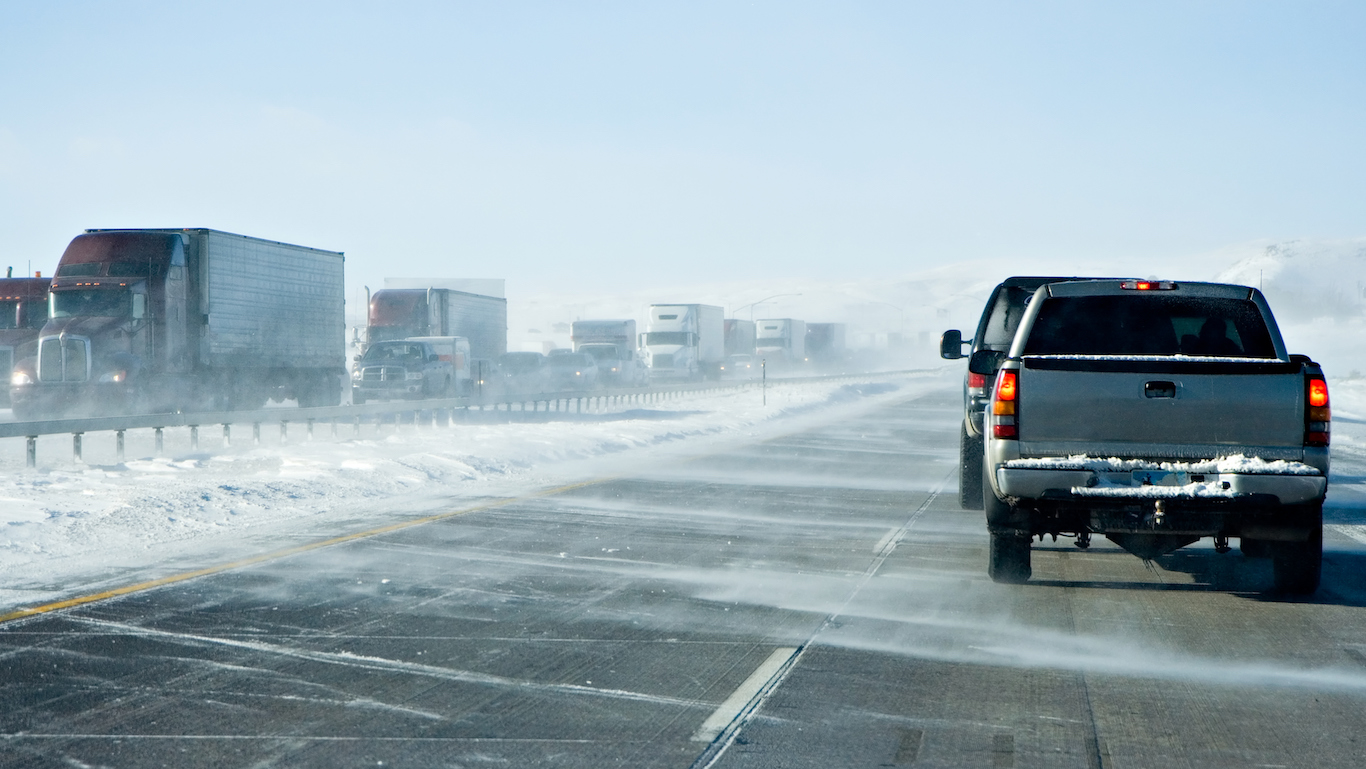
5. Wyoming
> Road deaths per 100,000: 19.1
> 2016 roadway fatalities: 112 (4th least)
> Seat belt use: 81%
> Deadliest holiday in 2016: Columbus Day (2 fatal crashes)
> Fatal crashes on rural roads: 81%
[in-text-ad]
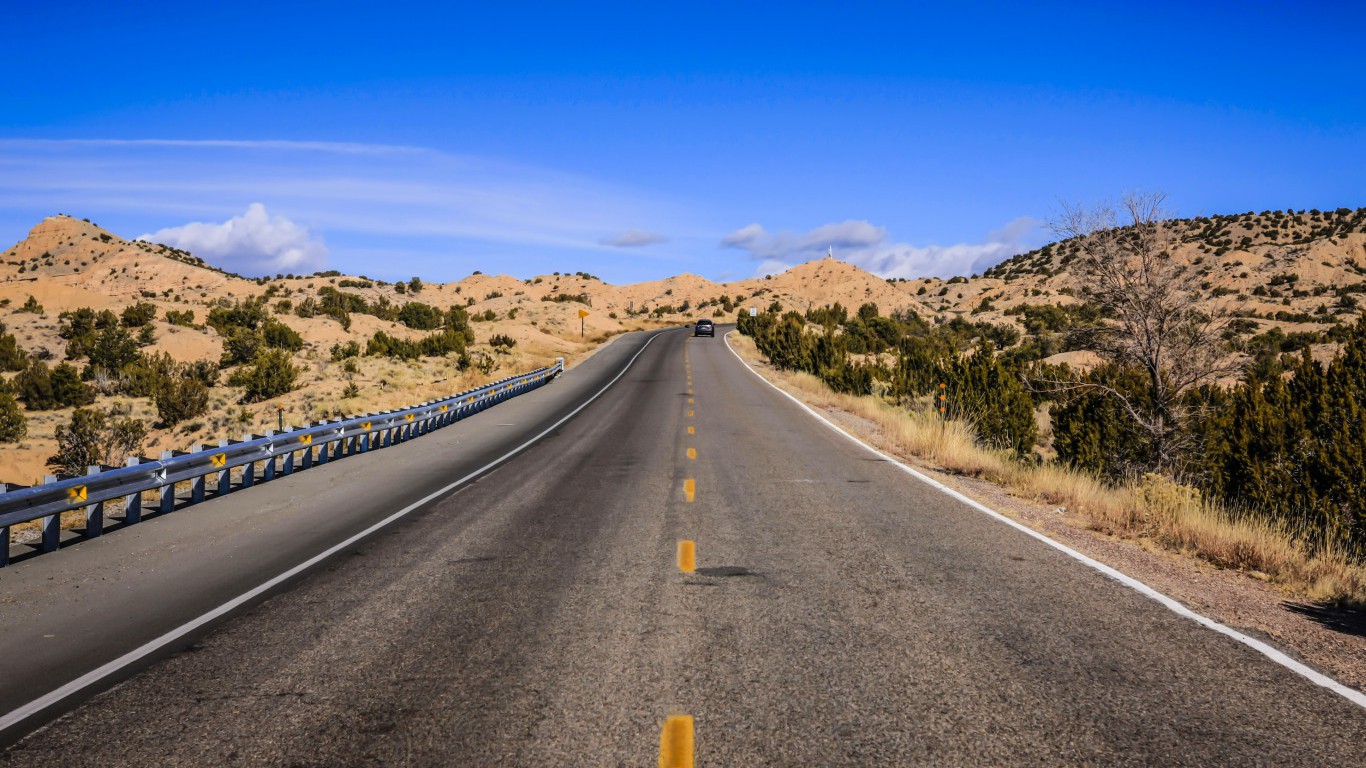
4. New Mexico
> Road deaths per 100,000: 19.3
> 2016 roadway fatalities: 402 (20th least)
> Seat belt use: 92%
> Deadliest holiday in 2016: Columbus Day (10 fatal crashes)
> Fatal crashes on rural roads: 56%
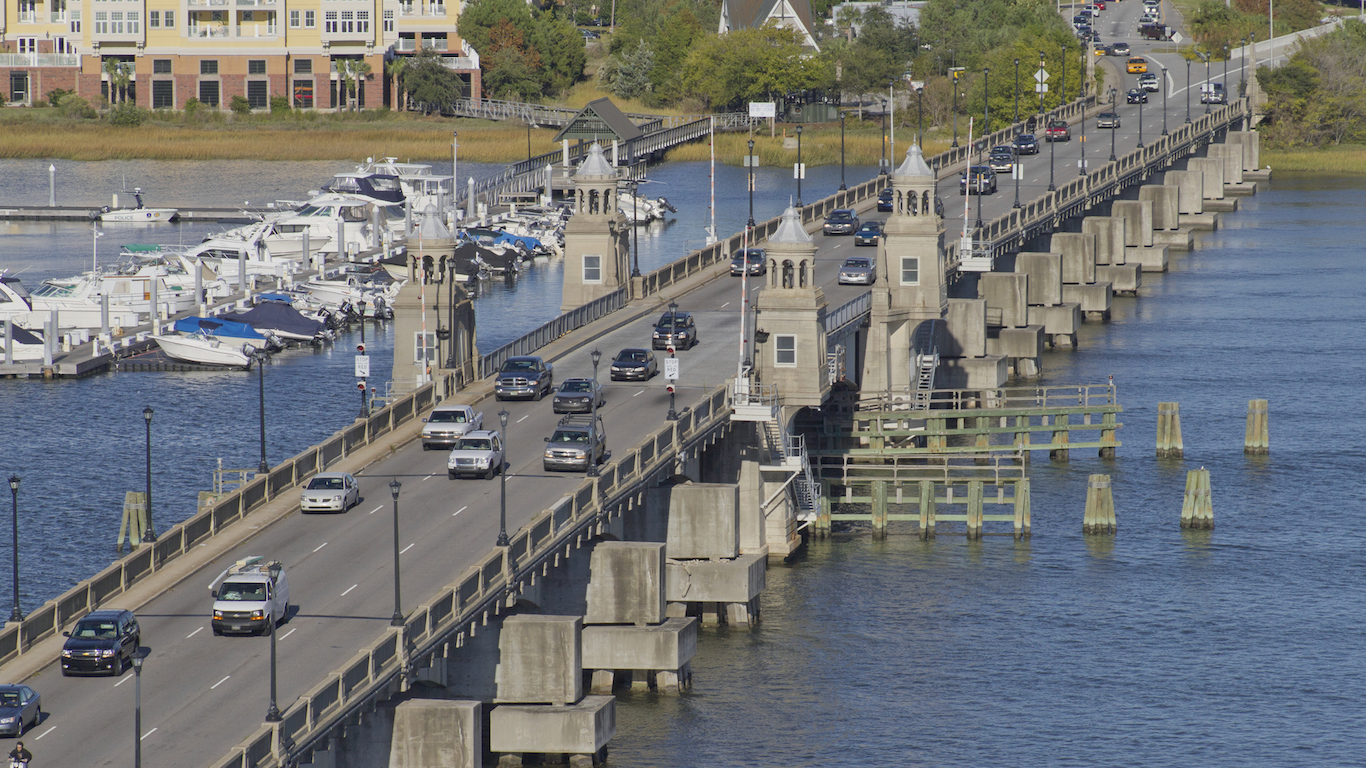
3. South Carolina
> Road deaths per 100,000: 20.5
> 2016 roadway fatalities: 1,015 (13th most)
> Seat belt use: 94%
> Deadliest holiday in 2016: Martin Luther King’s Birthday (16 fatal crashes)
> Fatal crashes on rural roads: 60%

2. Alabama
> Road deaths per 100,000: 21.3
> 2016 roadway fatalities: 1,038 (11th most)
> Seat belt use: 92%
> Deadliest holiday in 2016: Columbus Day (18 fatal crashes)
> Fatal crashes on rural roads: 62%
[in-text-ad-2]

1. Mississippi
> Road deaths per 100,000: 23.1
> 2016 roadway fatalities: 690 (20th most)
> Seat belt use: 78%
> Deadliest holiday in 2016: Independence Day (11 fatal crashes)
> Fatal crashes on rural roads: 98%
Detailed Findings
Russ Rader, senior vice president of communications at the Insurance Institute for Highway Safety, explained to 24/7 Wall St. why fatality rates can vary so widely. “A big factor in a state’s fatality rate is how much of its area is rural,” Rader said. Rural roads tend to have higher speed limits and are often lined with trees and telephone poles, raising the stakes of a collision.
Minnesota is the only state to rank among the 10 safest where a larger share of roadway is rural than the 70.7% U.S. share. Meanwhile, each of the 10 most dangerous states to drive in has a larger share of rural roads than is typical nationwide.
State regulations — seat belt laws in particular — also have a considerable impact on roadway safety. According to the Centers for Disease Control and Prevention, seat belts save thousands of lives every year, and wearing a seat belt in the front seat of a car reduces the risk of death by 45%.
In some states, seat belt use is less common than typical nationwide, partially because of state laws. For example, 15 states have secondary seat belt laws, meaning a motorist cannot be pulled over for not using a seat belt. And another, New Hampshire, does not issue any traffic tickets for adults not using a seat belt. The remaining 34 states, however, have primary seat belt laws, meaning police can make traffic stops for failure to buckle up.
Not surprisingly, seat belt usage rates tend to be higher and fatality rates often lower in states with primary seat belt laws. Massachusetts is the only state to rank among the 10 safest with a secondary seat belt law. Meanwhile, three of the 10 most dangerous states have secondary seat belt laws.
Such laws have a meaningful impact on outcomes. “If every state with secondary enforcement of their safety belt laws switched to primary enforcement, 242 fewer people would have died in 2016,” Rader said.
Despite ever-improving vehicle safety features and technology that reduces the likelihood of a fatal accident, driving deaths nationwide are on the rise. Part of the explanation is continued economic improvement since the end the Great Recession. “We had a big dip in traffic fatalities during the recession and when the economy recovers, traffic deaths go up as well,” Rader explained. This is largely because people tend to drive more when the economy is good.
Indeed, the roadway fatality rate dipped from 13.7 deaths per 100,000 people in 2007, the year the recession began, to 11.0 per 100,000 in 2009, the year the recession ended. As economic conditions continue to improve, the traffic fatality rate has climbed slightly in each of the last three years.
Methodology
To rank the safest and most dangerous states to drive in the United States, 24/7 Wall St. reviewed roadway fatality data from the Insurance Institute for Highway Safety along with urban and rural travel data from the Federal Highway Administration, each for 2016. The number of fatal roadway deaths was then adjusted for the population, noted as fatalities per 100,000 residents. Seat belt use rates and the share of fatal accidents on rural roads are also from IIHS and are all for 2016. Fatal injuries due to vehicle accidents include pedestrian and cyclist fatalities. Data on holiday deaths are for 2016 and came from the National Highway Traffic Safety Administration’s Fatality Analysis Reporting System.
Are You Still Paying With a Debit Card?
The average American spends $17,274 on debit cards a year, and it’s a HUGE mistake. First, debit cards don’t have the same fraud protections as credit cards. Once your money is gone, it’s gone. But more importantly you can actually get something back from this spending every time you swipe.
Issuers are handing out wild bonuses right now. With some you can earn up to 5% back on every purchase. That’s like getting a 5% discount on everything you buy!
Our top pick is kind of hard to imagine. Not only does it pay up to 5% back, it also includes a $200 cash back reward in the first six months, a 0% intro APR, and…. $0 annual fee. It’s quite literally free money for any one that uses a card regularly. Click here to learn more!
Flywheel Publishing has partnered with CardRatings to provide coverage of credit card products. Flywheel Publishing and CardRatings may receive a commission from card issuers.
Thank you for reading! Have some feedback for us?
Contact the 24/7 Wall St. editorial team.
 24/7 Wall St.
 24/7 Wall St.
 24/7 Wall St.
 24/7 Wall St.
 24/7 Wall St.
 24/7 Wall St.
 24/7 Wall St.
