Special Report
States Where the Most People Still Live With Their Parents

Published:
Last Updated:

In the United States, adulthood is a legal designation that generally means parents are no longer obligated to support their son or daughter. Adulthood begins at age 18 throughout most of the country — one to three years later in a handful of states — and is a milestone often met with an eagerness to embrace newfound independence.
However, an increasing number of Americans are choosing to stay home with mom and dad well into adulthood. And, as Americans are leaving the nest later in life, they are also delaying other life milestones — notably marriage and homeownership.
The share of Americans age 18 to 34 living with at least one parent climbed from 29.0% in 2006 to 34.4% in 2016 — a 5.4 percentage point increase. In fact, the share of young adults choosing to live under the same roof as their parents has gone up in every state except Alaska in the last 10 years.
Depending on the region, staying at home is either relatively uncommon, or is a given for a large segment of the population. The share of children living with their parents ranges from less than 25% in some states to more than 40% in others. The social and economic differences between states offer at least a partial explanation for this phenomenon. For example, states with the largest shares of young adults living with mom and dad tend to be more expensive places to live.
24/7 Wall St. reviewed the share of 18- to 34-year-olds that live with their parents in each state.
Click here to see the states where the most people live with their parents.
Click here to see our detailed findings and methodology.
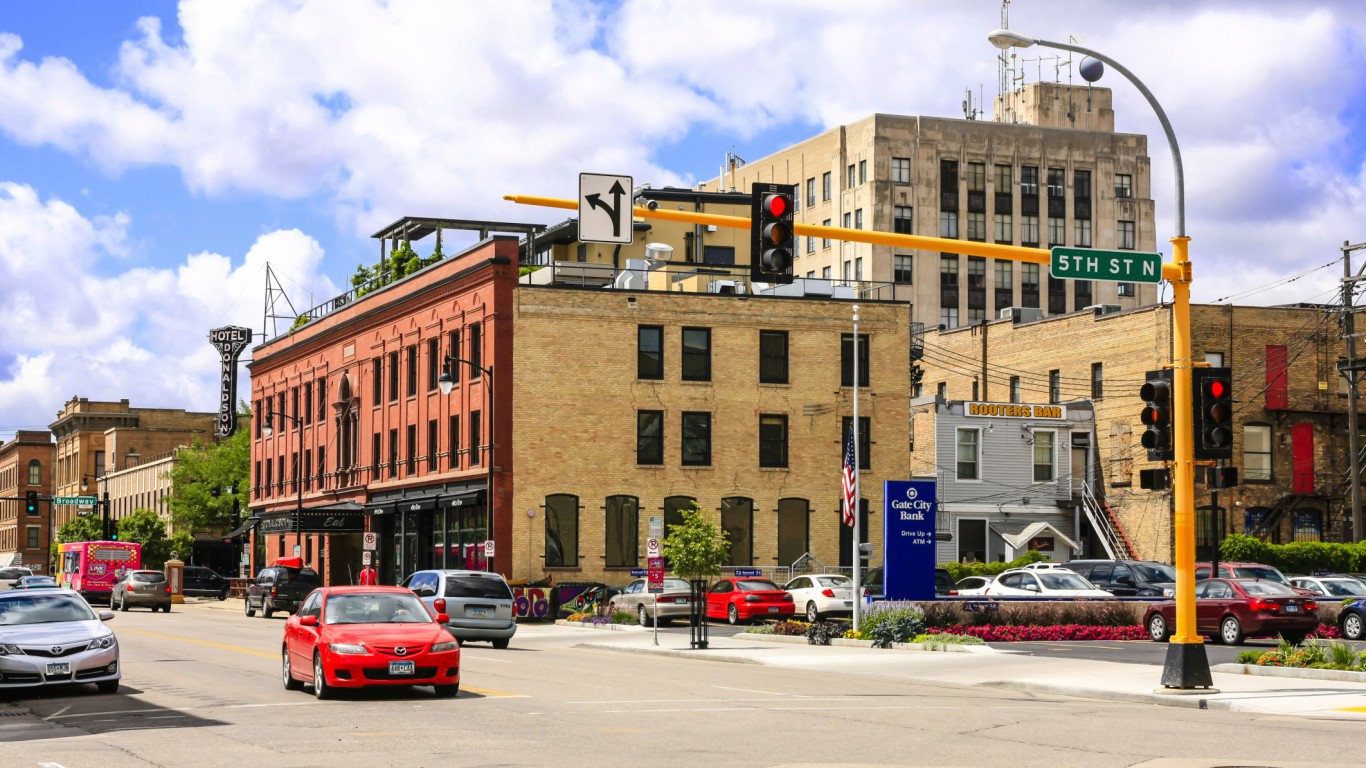
50. North Dakota
> 18-34 yr. old population living with parent, 2016: 15.4%
> 18-34 yr. old population living with parent, 2006: 14.9% (the lowest)
> Cost of living: 8.5% lower than nation
> Median age to get married: 27.4 (9th lowest)
[in-text-ad]

49. Wyoming
> 18-34 yr. old population living with parent, 2016: 22.2%
> 18-34 yr. old population living with parent, 2006: 20.2% (5th lowest)
> Cost of living: 3.3% lower than nation
> Median age to get married: 27.5 (10th lowest)

48. Iowa
> 18-34 yr. old population living with parent, 2016: 22.9%
> 18-34 yr. old population living with parent, 2006: 19.7% (3rd lowest)
> Cost of living: 9.8% lower than nation
> Median age to get married: 27.7 (16th lowest)

47. South Dakota
> 18-34 yr. old population living with parent, 2016: 22.9%
> 18-34 yr. old population living with parent, 2006: 21.5% (7th lowest)
> Cost of living: 11.7% lower than nation
> Median age to get married: 27.0 (6th lowest)
[in-text-ad-2]

46. Nebraska
> 18-34 yr. old population living with parent, 2016: 24.3%
> 18-34 yr. old population living with parent, 2006: 21.2% (6th lowest)
> Cost of living: 9.5% lower than nation
> Median age to get married: 27.5 (11th lowest)

45. Colorado
> 18-34 yr. old population living with parent, 2016: 24.3%
> 18-34 yr. old population living with parent, 2006: 21.5% (8th lowest)
> Cost of living: 3.0% higher than nation
> Median age to get married: 28.3 (24th lowest)
[in-text-ad]

44. Montana
> 18-34 yr. old population living with parent, 2016: 25.5%
> 18-34 yr. old population living with parent, 2006: 23.1% (11th lowest)
> Cost of living: 5.9% lower than nation
> Median age to get married: 28.0 (20th lowest)

43. Oklahoma
> 18-34 yr. old population living with parent, 2016: 25.7%
> 18-34 yr. old population living with parent, 2006: 23.7% (13th lowest)
> Cost of living: 11.0% lower than nation
> Median age to get married: 26.7 (4th lowest)

42. Kansas
> 18-34 yr. old population living with parent, 2016: 25.9%
> 18-34 yr. old population living with parent, 2006: 22.6% (10th lowest)
> Cost of living: 9.5% lower than nation
> Median age to get married: 26.8 (5th lowest)
[in-text-ad-2]

41. Washington
> 18-34 yr. old population living with parent, 2016: 27.0%
> 18-34 yr. old population living with parent, 2006: 24.0% (16th lowest)
> Cost of living: 5.5% higher than nation
> Median age to get married: 28.3 (22nd lowest)

40. Minnesota
> 18-34 yr. old population living with parent, 2016: 27.4%
> 18-34 yr. old population living with parent, 2006: 23.9% (15th lowest)
> Cost of living: 2.5% lower than nation
> Median age to get married: 28.6 (24th highest)
[in-text-ad]

39. Oregon
> 18-34 yr. old population living with parent, 2016: 27.5%
> 18-34 yr. old population living with parent, 2006: 22.3% (9th lowest)
> Cost of living: 0.2% lower than nation
> Median age to get married: 28.7 (20th highest)

38. Idaho
> 18-34 yr. old population living with parent, 2016: 27.7%
> 18-34 yr. old population living with parent, 2006: 19.6% (2nd lowest)
> Cost of living: 7.0% lower than nation
> Median age to get married: 26.1 (2nd lowest)

37. Arkansas
> 18-34 yr. old population living with parent, 2016: 28.3%
> 18-34 yr. old population living with parent, 2006: 24.6% (19th lowest)
> Cost of living: 13.1% lower than nation
> Median age to get married: 26.4 (3rd lowest)
[in-text-ad-2]

36. Wisconsin
> 18-34 yr. old population living with parent, 2016: 28.5%
> 18-34 yr. old population living with parent, 2006: 24.6% (18th lowest)
> Cost of living: 7.2% lower than nation
> Median age to get married: 29.0 (16th highest)

35. Utah
> 18-34 yr. old population living with parent, 2016: 28.6%
> 18-34 yr. old population living with parent, 2006: 23.6% (12th lowest)
> Cost of living: 2.7% lower than nation
> Median age to get married: 25.5 (the lowest)
[in-text-ad]

34. Alaska
> 18-34 yr. old population living with parent, 2016: 28.7%
> 18-34 yr. old population living with parent, 2006: 31.0% (13th highest)
> Cost of living: 5.4% higher than nation
> Median age to get married: 28.8 (19th highest)

33. Missouri
> 18-34 yr. old population living with parent, 2016: 29.2%
> 18-34 yr. old population living with parent, 2006: 26.1% (22nd lowest)
> Cost of living: 10.5% lower than nation
> Median age to get married: 28.0 (19th lowest)

32. Vermont
> 18-34 yr. old population living with parent, 2016: 29.8%
> 18-34 yr. old population living with parent, 2006: 29.5% (20th highest)
> Cost of living: 1.6% higher than nation
> Median age to get married: 29.6 (12th highest)
[in-text-ad-2]

31. Tennessee
> 18-34 yr. old population living with parent, 2016: 29.9%
> 18-34 yr. old population living with parent, 2006: 26.2% (23rd lowest)
> Cost of living: 9.8% lower than nation
> Median age to get married: 27.7 (15th lowest)

30. Indiana
> 18-34 yr. old population living with parent, 2016: 30.4%
> 18-34 yr. old population living with parent, 2006: 26.0% (21st lowest)
> Cost of living: 9.7% lower than nation
> Median age to get married: 27.9 (17th lowest)
[in-text-ad]

29. Kentucky
> 18-34 yr. old population living with parent, 2016: 31.0%
> 18-34 yr. old population living with parent, 2006: 27.8% (25th lowest)
> Cost of living: 12.2% lower than nation
> Median age to get married: 27.4 (8th lowest)

28. Ohio
> 18-34 yr. old population living with parent, 2016: 31.1%
> 18-34 yr. old population living with parent, 2006: 29.5% (19th highest)
> Cost of living: 10.7% lower than nation
> Median age to get married: 28.7 (22nd highest)

27. North Carolina
> 18-34 yr. old population living with parent, 2016: 31.7%
> 18-34 yr. old population living with parent, 2006: 23.8% (14th lowest)
> Cost of living: 9.1% lower than nation
> Median age to get married: 28.4 (25th lowest)
[in-text-ad-2]

26. Arizona
> 18-34 yr. old population living with parent, 2016: 32.2%
> 18-34 yr. old population living with parent, 2006: 24.2% (17th lowest)
> Cost of living: 4.1% lower than nation
> Median age to get married: 28.9 (17th highest)

25. Virginia
> 18-34 yr. old population living with parent, 2016: 33.0%
> 18-34 yr. old population living with parent, 2006: 28.0% (24th highest)
> Cost of living: 2.3% higher than nation
> Median age to get married: 28.7 (21st highest)
[in-text-ad]

24. West Virginia
> 18-34 yr. old population living with parent, 2016: 33.1%
> 18-34 yr. old population living with parent, 2006: 28.8% (22nd highest)
> Cost of living: 12.4% lower than nation
> Median age to get married: 27.7 (13th lowest)

23. New Mexico
> 18-34 yr. old population living with parent, 2016: 33.3%
> 18-34 yr. old population living with parent, 2006: 30.9% (15th highest)
> Cost of living: 6.4% lower than nation
> Median age to get married: 27.7 (14th lowest)

22. South Carolina
> 18-34 yr. old population living with parent, 2016: 33.5%
> 18-34 yr. old population living with parent, 2006: 29.5% (18th highest)
> Cost of living: 9.7% lower than nation
> Median age to get married: 29.1 (14th highest)
[in-text-ad-2]

21. Michigan
> 18-34 yr. old population living with parent, 2016: 33.6%
> 18-34 yr. old population living with parent, 2006: 30.9% (14th highest)
> Cost of living: 6.7% lower than nation
> Median age to get married: 28.9 (18th highest)

20. Texas
> 18-34 yr. old population living with parent, 2016: 34.0%
> 18-34 yr. old population living with parent, 2006: 28.2% (23rd highest)
> Cost of living: 3.1% lower than nation
> Median age to get married: 27.9 (18th lowest)
[in-text-ad]

19. Maine
> 18-34 yr. old population living with parent, 2016: 34.1%
> 18-34 yr. old population living with parent, 2006: 25.6% (20th lowest)
> Cost of living: 1.6% lower than nation
> Median age to get married: 28.5 (25th highest)
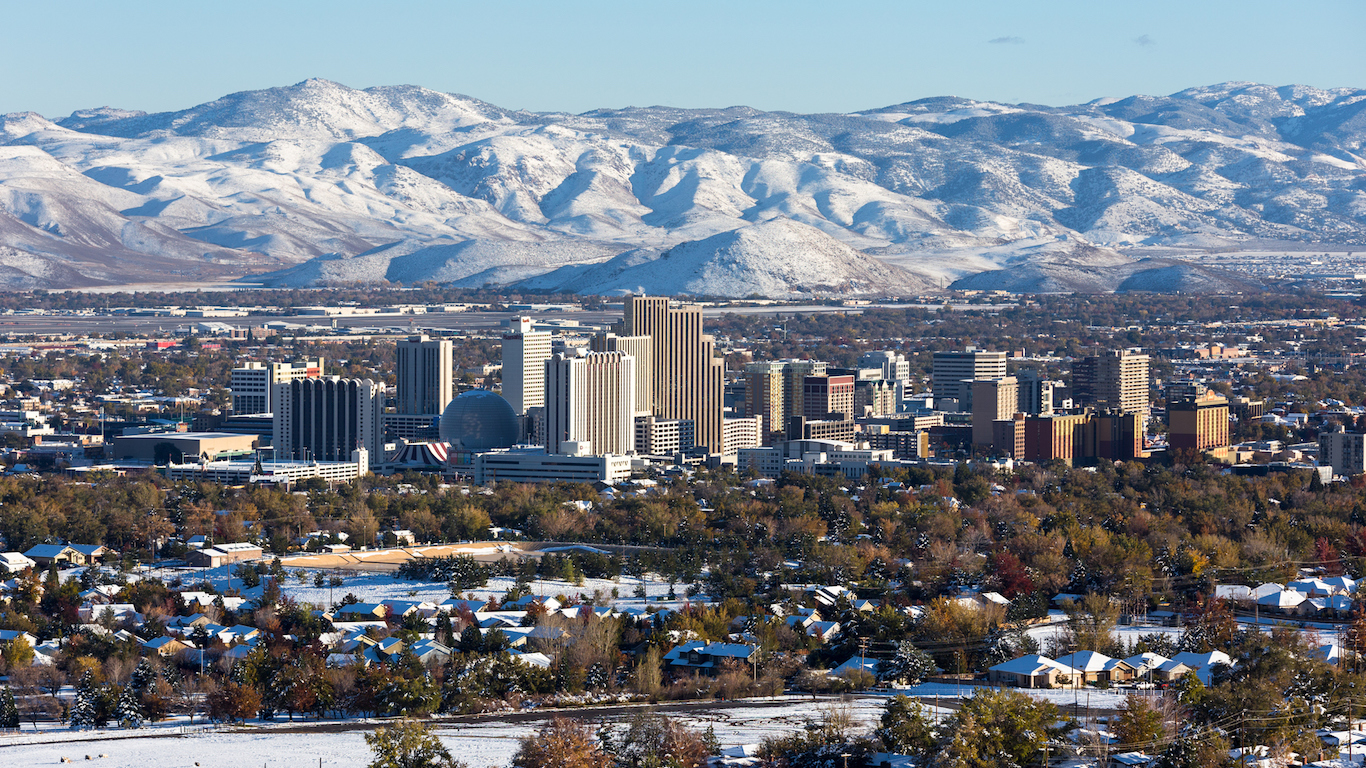
18. Nevada
> 18-34 yr. old population living with parent, 2016: 34.8%
> 18-34 yr. old population living with parent, 2006: 19.8% (4th lowest)
> Cost of living: 2.6% lower than nation
> Median age to get married: 29.0 (15th highest)

17. Louisiana
> 18-34 yr. old population living with parent, 2016: 35.1%
> 18-34 yr. old population living with parent, 2006: 32.7% (7th highest)
> Cost of living: 9.6% lower than nation
> Median age to get married: 28.6 (23rd highest)
[in-text-ad-2]

16. Alabama
> 18-34 yr. old population living with parent, 2016: 35.6%
> 18-34 yr. old population living with parent, 2006: 30.6% (16th highest)
> Cost of living: 13.4% lower than nation
> Median age to get married: 27.3 (7th lowest)

15. Georgia
> 18-34 yr. old population living with parent, 2016: 35.6%
> 18-34 yr. old population living with parent, 2006: 26.5% (24th lowest)
> Cost of living: 7.9% lower than nation
> Median age to get married: 28.2 (21st lowest)
[in-text-ad]

14. Hawaii
> 18-34 yr. old population living with parent, 2016: 35.6%
> 18-34 yr. old population living with parent, 2006: 33.0% (6th highest)
> Cost of living: 18.4% higher than nation
> Median age to get married: 28.3 (23rd lowest)

13. New Hampshire
> 18-34 yr. old population living with parent, 2016: 35.7%
> 18-34 yr. old population living with parent, 2006: 29.6% (17th highest)
> Cost of living: 5.9% higher than nation
> Median age to get married: 29.5 (13th highest)

12. Illinois
> 18-34 yr. old population living with parent, 2016: 36.5%
> 18-34 yr. old population living with parent, 2006: 31.8% (10th highest)
> Cost of living: 1.1% lower than nation
> Median age to get married: 29.6 (10th highest)
[in-text-ad-2]
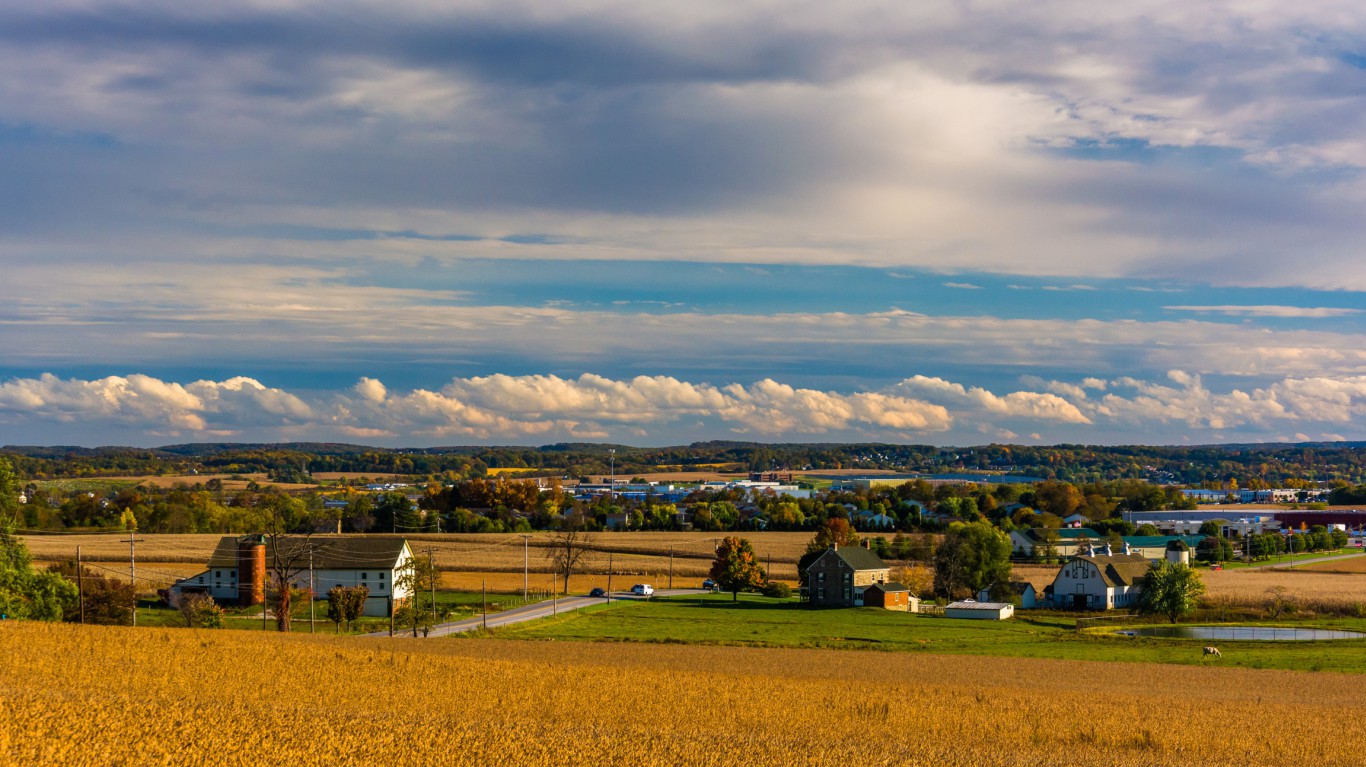
11. Pennsylvania
> 18-34 yr. old population living with parent, 2016: 37.3%
> 18-34 yr. old population living with parent, 2006: 33.9% (4th highest)
> Cost of living: 1.6% lower than nation
> Median age to get married: 29.7 (9th highest)

10. Mississippi
> 18-34 yr. old population living with parent, 2016: 37.4%
> 18-34 yr. old population living with parent, 2006: 32.4% (8th highest)
> Cost of living: 13.6% lower than nation
> Median age to get married: 27.6 (12th lowest)
[in-text-ad]

9. Massachusetts
> 18-34 yr. old population living with parent, 2016: 37.5%
> 18-34 yr. old population living with parent, 2006: 33.4% (5th highest)
> Cost of living: 7.8% higher than nation
> Median age to get married: 30.5 (2nd highest)

8. Maryland
> 18-34 yr. old population living with parent, 2016: 37.9%
> 18-34 yr. old population living with parent, 2006: 31.2% (11th highest)
> Cost of living: 9.5% higher than nation
> Median age to get married: 29.7 (7th highest)

7. Delaware
> 18-34 yr. old population living with parent, 2016: 38.2%
> 18-34 yr. old population living with parent, 2006: 29.2% (21st highest)
> Cost of living: 0.2% higher than nation
> Median age to get married: 29.6 (11th highest)
[in-text-ad-2]

6. California
> 18-34 yr. old population living with parent, 2016: 38.6%
> 18-34 yr. old population living with parent, 2006: 31.1% (12th highest)
> Cost of living: 14.4% higher than nation
> Median age to get married: 29.7 (8th highest)

5. Florida
> 18-34 yr. old population living with parent, 2016: 38.8%
> 18-34 yr. old population living with parent, 2006: 27.8% (25th highest)
> Cost of living: 0.3% lower than nation
> Median age to get married: 29.9 (6th highest)
[in-text-ad]

4. Rhode Island
> 18-34 yr. old population living with parent, 2016: 39.7%
> 18-34 yr. old population living with parent, 2006: 31.9% (9th highest)
> Cost of living: 0.4% lower than nation
> Median age to get married: 30.4 (3rd highest)

3. New York
> 18-34 yr. old population living with parent, 2016: 40.4%
> 18-34 yr. old population living with parent, 2006: 36.7% (2nd highest)
> Cost of living: 15.6% higher than nation
> Median age to get married: 30.4 (4th highest)

2. Connecticut
> 18-34 yr. old population living with parent, 2016: 41.5%
> 18-34 yr. old population living with parent, 2006: 34.0% (3rd highest)
> Cost of living: 8.7% higher than nation
> Median age to get married: 30.5 (the highest)
[in-text-ad-2]

1. New Jersey
> 18-34 yr. old population living with parent, 2016: 45.8%
> 18-34 yr. old population living with parent, 2006: 39.2% (the highest)
> Cost of living: 13.2% higher than nation
> Median age to get married: 30.1 (5th highest)
Detailed Findings
While staying at home may often be seen as immature or overly sentimental, many make the choice out of financial necessity. In the states 18- to 34-year-olds are less likely to live with their parents, goods and services tend to be relatively inexpensive. Of the 10 states with the smallest shares of adults living with their parents, eight have a lower cost of living than the U.S. as whole. For example, in Oklahoma, where a far smaller than average 25.7% share of 18- to 34-year-olds live at home, goods and services are 11% cheaper than they are on average nationwide.
Meanwhile, seven of the 10 states with the largest shares of 18- to 34-year-olds living at home have a higher cost of living than the U.S. as a whole.
The ability to move out of home is generally predicated on financial independence, and for most Americans financial independence requires full-time employment. The availability of jobs appears closely tied to the likelihood of moving away from home. In six of the 10 states with the smallest shares of adults living at home, the unemployment rate is at or below 3.0%. Meanwhile, none of the states on the other end of this list have an unemployment rate below 3.3%.
The increasing proclivity of young adults to remain at home may be tied to another growing phenomenon — the student debt crisis. Americans owe a staggering $1.4 trillion in outstanding student loans — more than any other form of household debt except home mortgages.
Living at home is one way to pay down student loans faster. Seven of the 10 states with the largest shares of young adults living at home have a larger share of college-educated adults than the U.S. as a whole, compared to just four of the states on the other end of this list.
Leaving home is not the only life milestone Americans are increasingly choosing to put off. For example, the median marriage age in 2006 was 27.5 for men and 25.9 for women. As of 2016, the median marriage age stood at 29.9 for men and 27.9 for women.
Americans are also waiting longer to buy homes. Some 53.3% of 18- to 34-year-olds were homeowners in 2006, compared to 47.7% of the same age cohort in 2016.
Methodology
To identify the states where the most people live with their parents, 24/7 Wall St. reviewed the share of 18- to 34-year-olds living with their parents in each state, with data from the U.S. Census Bureau’s 2017 report, “The Changing Economics and Demographics of Young Adulthood: 1975–2016.” The cost of living in each state, or regional price parity, came from the Bureau of Economic Analysis and is for 2016. The median age of men and women when they were first married in each state came from the Census Bureau’s 2016 American Consumer Survey. We calculated an average age at first marriage weighted using the ratio of male to female populations in each state between 15 and 54 years old — the same age group considered within the male and female median age at first marriage figures.
Retirement can be daunting, but it doesn’t need to be.
Imagine having an expert in your corner to help you with your financial goals. Someone to help you determine if you’re ahead, behind, or right on track. With SmartAsset, that’s not just a dream—it’s reality. This free tool connects you with pre-screened financial advisors who work in your best interests. It’s quick, it’s easy, so take the leap today and start planning smarter!
Don’t waste another minute; get started right here and help your retirement dreams become a retirement reality.
Thank you for reading! Have some feedback for us?
Contact the 24/7 Wall St. editorial team.