
Most Americans would likely agree that their lifestyle choices and financial security are dictated largely by their income. Income, however, is only one half of the equation. The other half is the price of goods and services. The cost of everyday necessities — such as groceries, transportation, and rent — varies considerably across the country and ultimately impacts just how far a dollar will go.
On a state level, the cost of goods and services varies dramatically. In Mississippi, the cost of living is 13.6% less than it is on average across the nation as a whole. Meanwhile, in Hawaii, goods and services are 18.4% more expensive than they are on average nationwide.
On a city level, the differences are even more stark. For example, adjusting for cost of living, a household earning $65,000 annually in Morristown, Tennessee, one of the least expensive cities in the country, has greater purchasing power than a household earning $100,000 in San Jose, California, one of the country’s most expensive cities.
24/7 Wall St. reviewed regional price parities in the nation’s 382 metropolitan areas to identify the most expensive city in every state. In many cities on this list, the cost of living is so high that simply meeting basic needs puts a great strain on lower-income households and largely offsets much of the disposable income of higher earning households.
For those looking to stretch their dollar as far as possible, the cities on this list may best be avoided.
Click here to see the most expensive city in each state.
Click here to see our detailed findings and methodology.

1. Alabama: Daphne-Fairhope-Foley
> Cost of living in Daphne-Fairhope-Foley: 8.7% less expensive than avg.
> Cost of living in Alabama: 13.4% less expensive than avg.
> Poverty rate: 11.4%
> Median household income: $56,732
[in-text-ad]
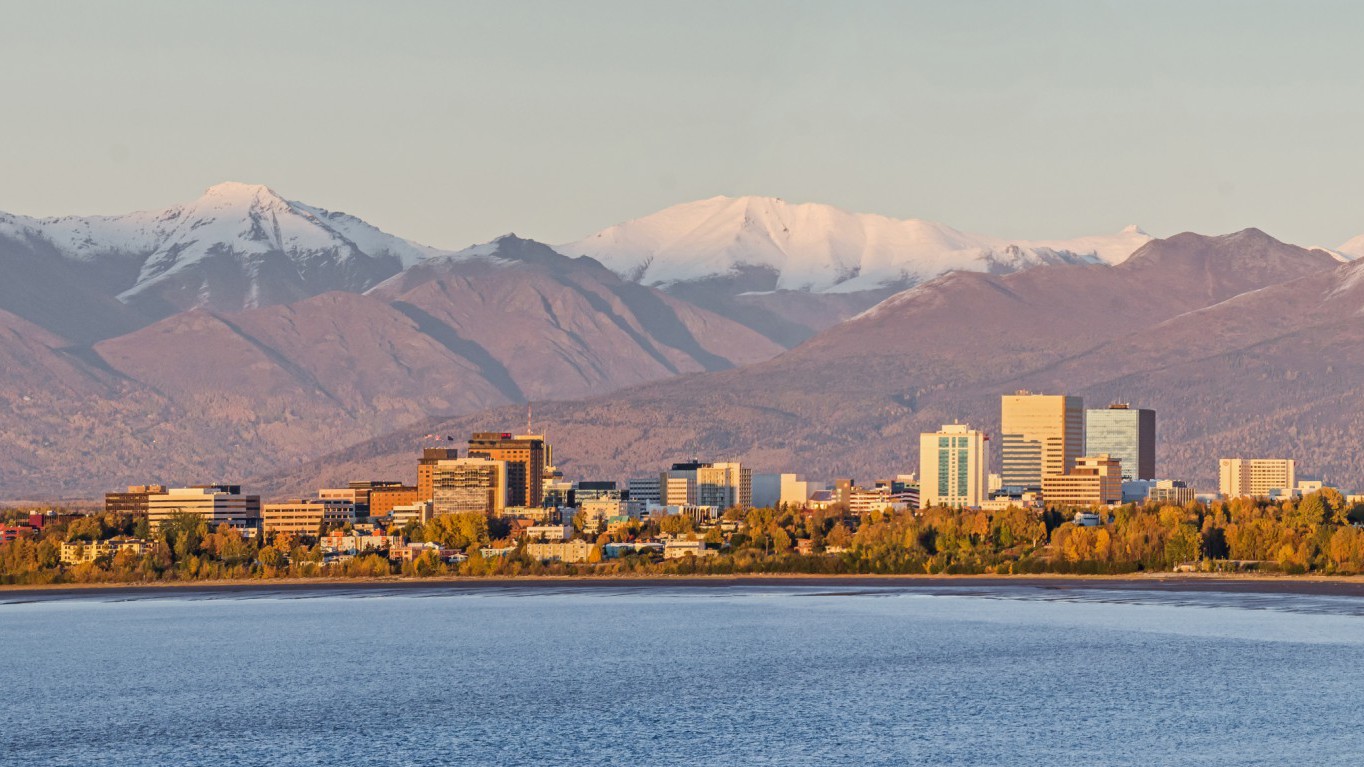
2. Alaska: Anchorage
> Cost of living in Anchorage: 9.2% more expensive than avg.
> Cost of living in Alaska: 5.4% more expensive than avg.
> Poverty rate: 7.2%
> Median household income: $82,203

3. Arizona: Flagstaff
> Cost of living in Flagstaff: 2.0% less expensive than avg.
> Cost of living in Arizona: 4.1% less expensive than avg.
> Poverty rate: 17.9%
> Median household income: $55,091

4. Arkansas: Little Rock-North Little Rock-Conway
> Cost of living in Little Rock-North Little Rock-Conway: 9.5% less expensive than avg.
> Cost of living in Arkansas: 13.1% less expensive than avg.
> Poverty rate: 15.9%
> Median household income: $51,501
[in-text-ad-2]

5. California: San Jose-Sunnyvale-Santa Clara
> Cost of living in San Jose-Sunnyvale-Santa Clara: 27.1% more expensive than avg.
> Cost of living in California: 14.4% more expensive than avg.
> Poverty rate: 9.4%
> Median household income: $110,040
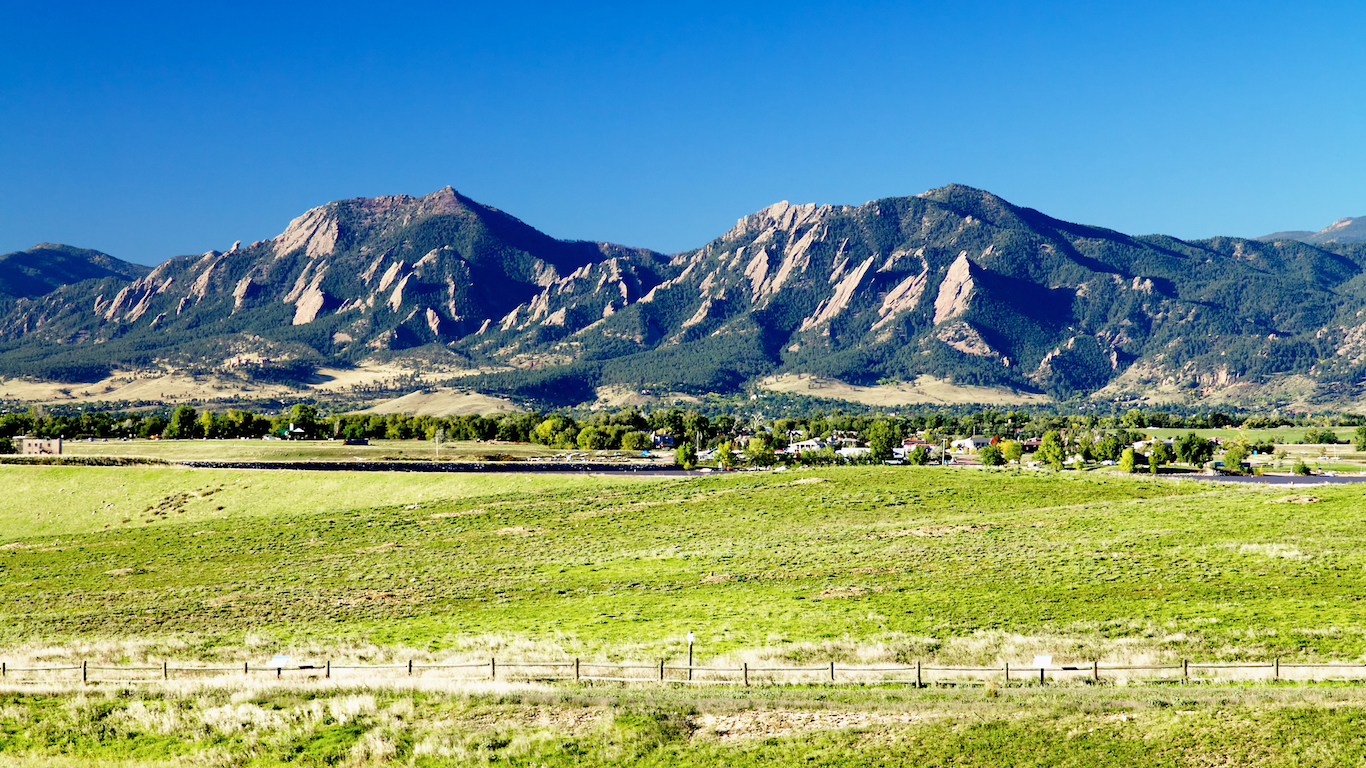
6. Colorado: Boulder
> Cost of living in Boulder: 8.9% more expensive than avg.
> Cost of living in Colorado: 3.0% more expensive than avg.
> Poverty rate: 11.0%
> Median household income: $74,615
[in-text-ad]
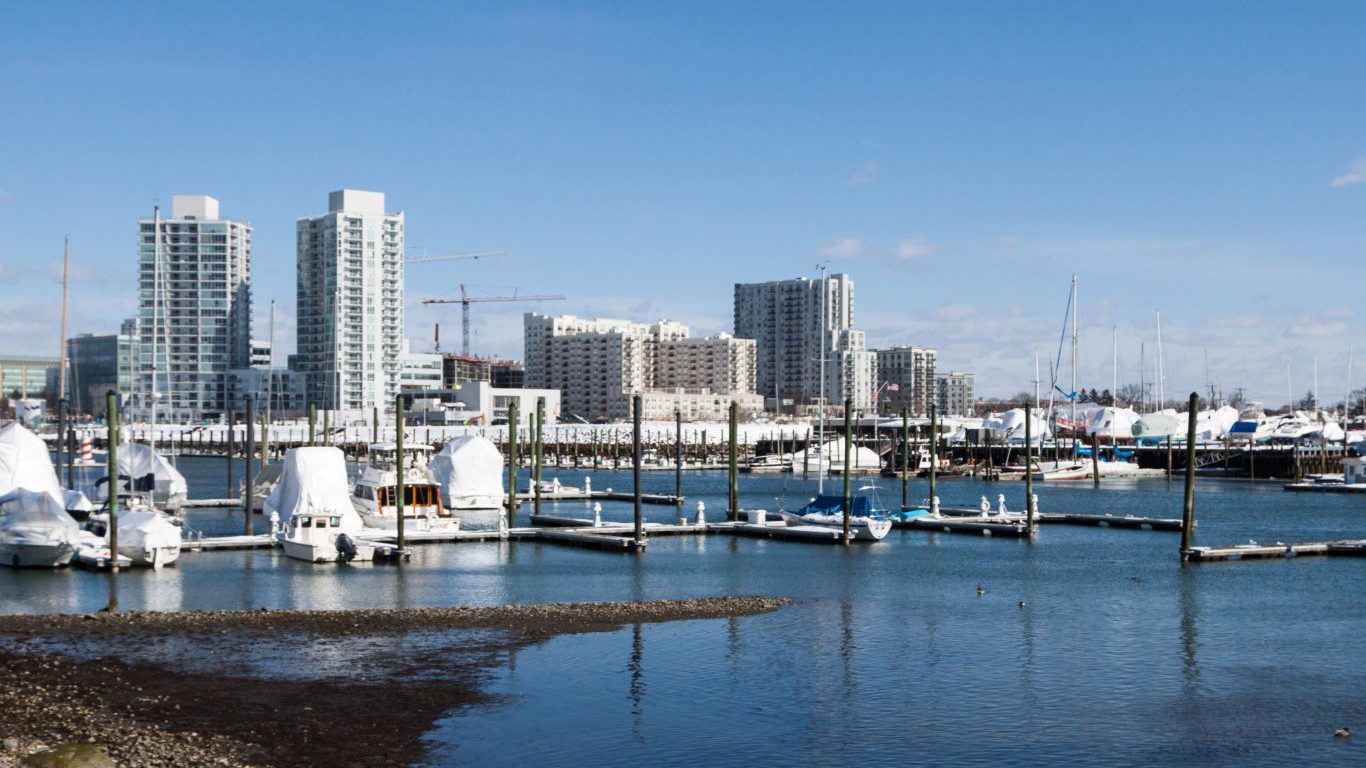
7. Connecticut: Bridgeport-Stamford-Norwalk
> Cost of living in Bridgeport-Stamford-Norwalk: 20.1% more expensive than avg.
> Cost of living in Connecticut: 8.7% more expensive than avg.
> Poverty rate: 8.6%
> Median household income: $90,123
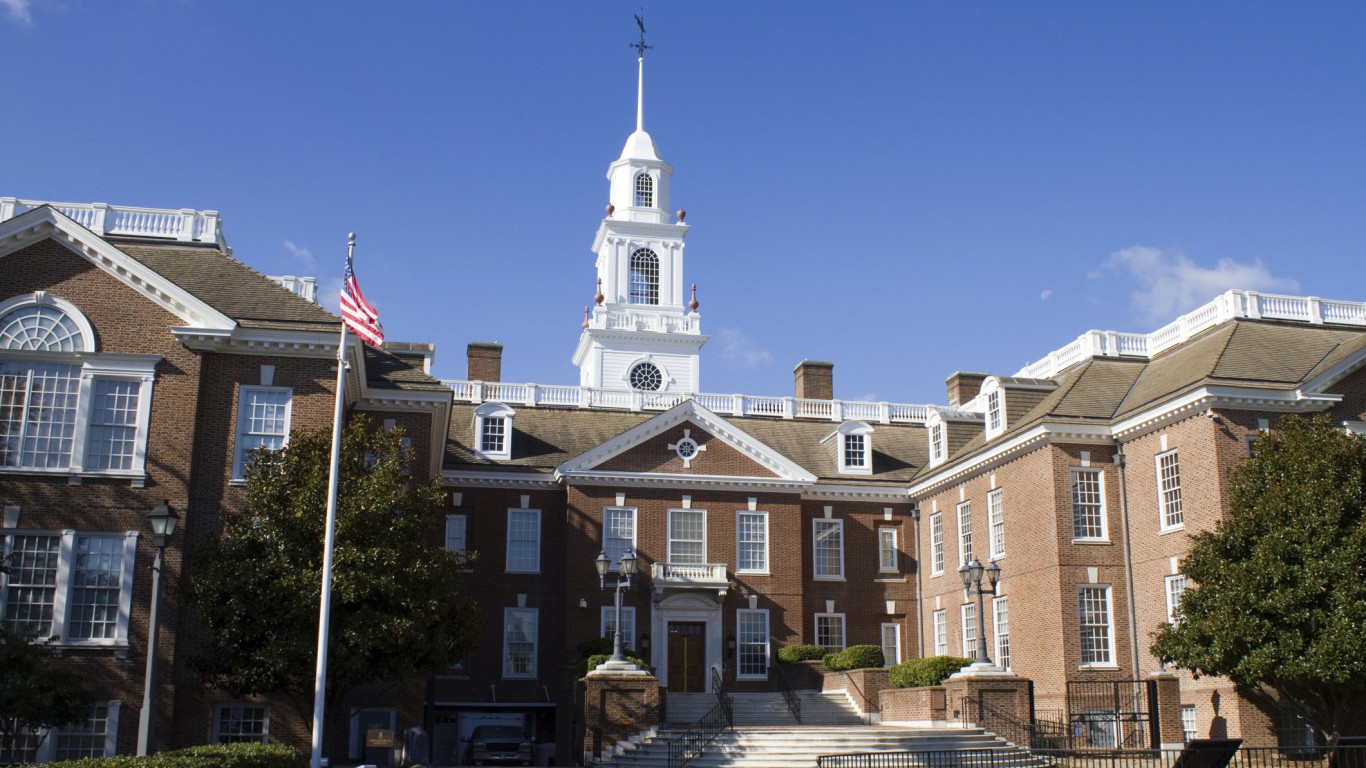
8. Delaware: Dover
> Cost of living in Dover: 5.6% less expensive than avg.
> Cost of living in Delaware: 0.2% more expensive than avg.
> Poverty rate: 13.8%
> Median household income: $54,140
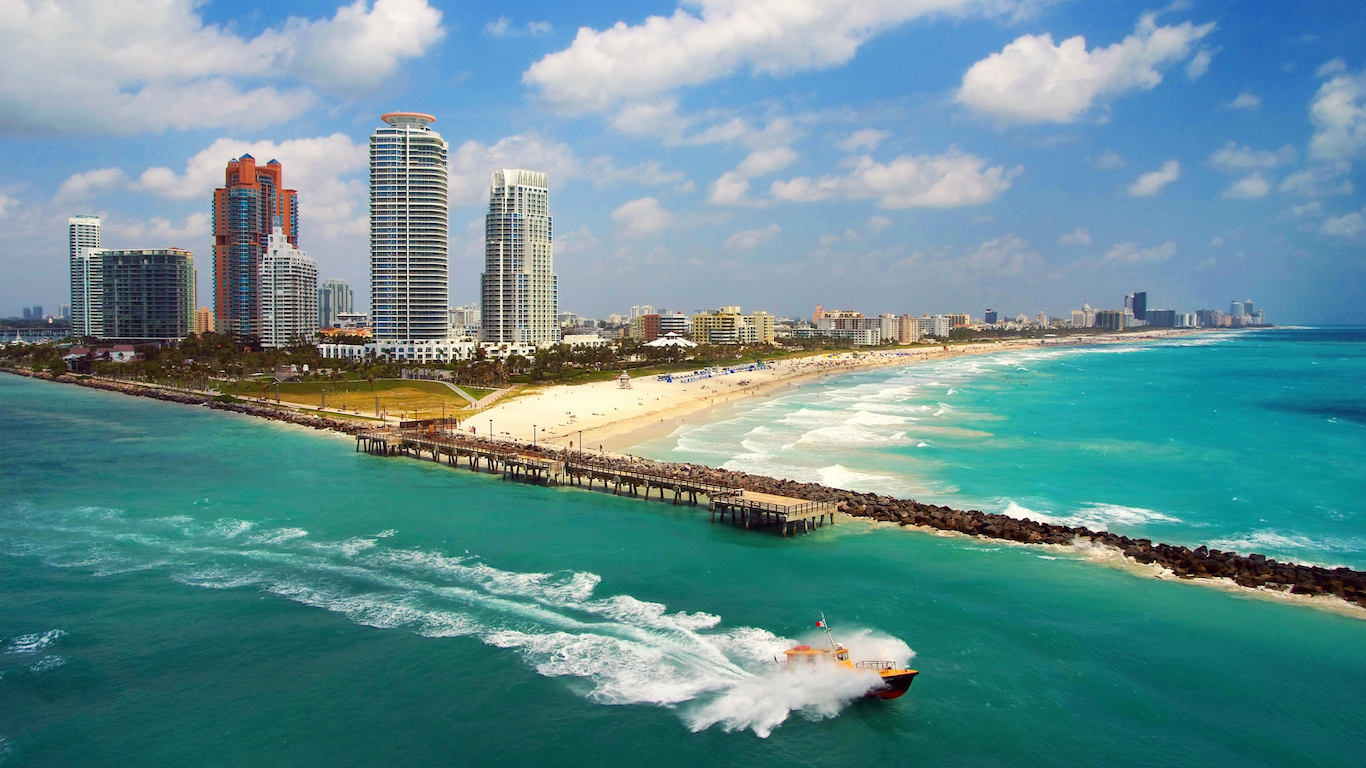
9. Florida: Miami-Fort Lauderdale-West Palm Beach
> Cost of living in Miami-Fort Lauderdale-West Palm Beach: 7.6% more expensive than avg.
> Cost of living in Florida: 0.3% less expensive than avg.
> Poverty rate: 15.4%
> Median household income: $51,362
[in-text-ad-2]
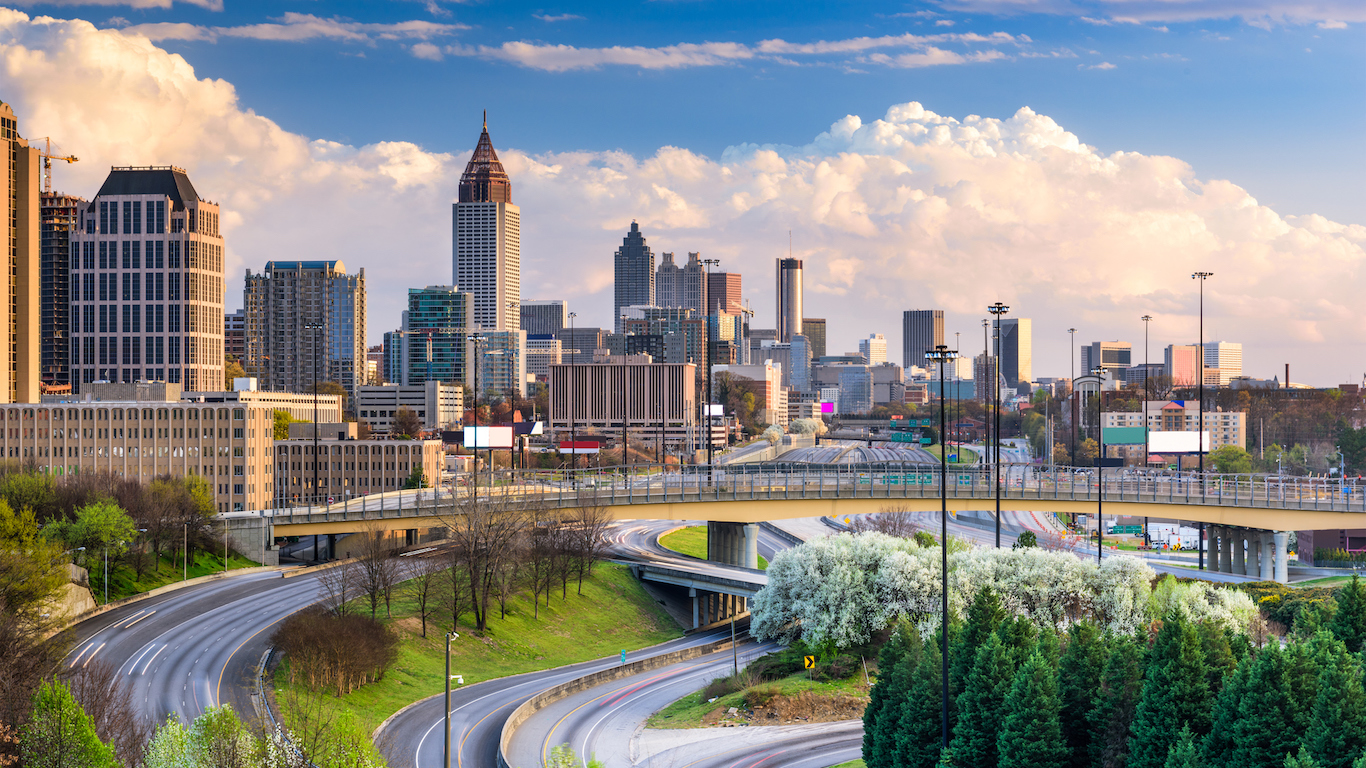
10. Georgia: Atlanta-Sandy Springs-Roswell
> Cost of living in Atlanta-Sandy Springs-Roswell: 3.7% less expensive than avg.
> Cost of living in Georgia: 7.9% less expensive than avg.
> Poverty rate: 13.1%
> Median household income: $62,613
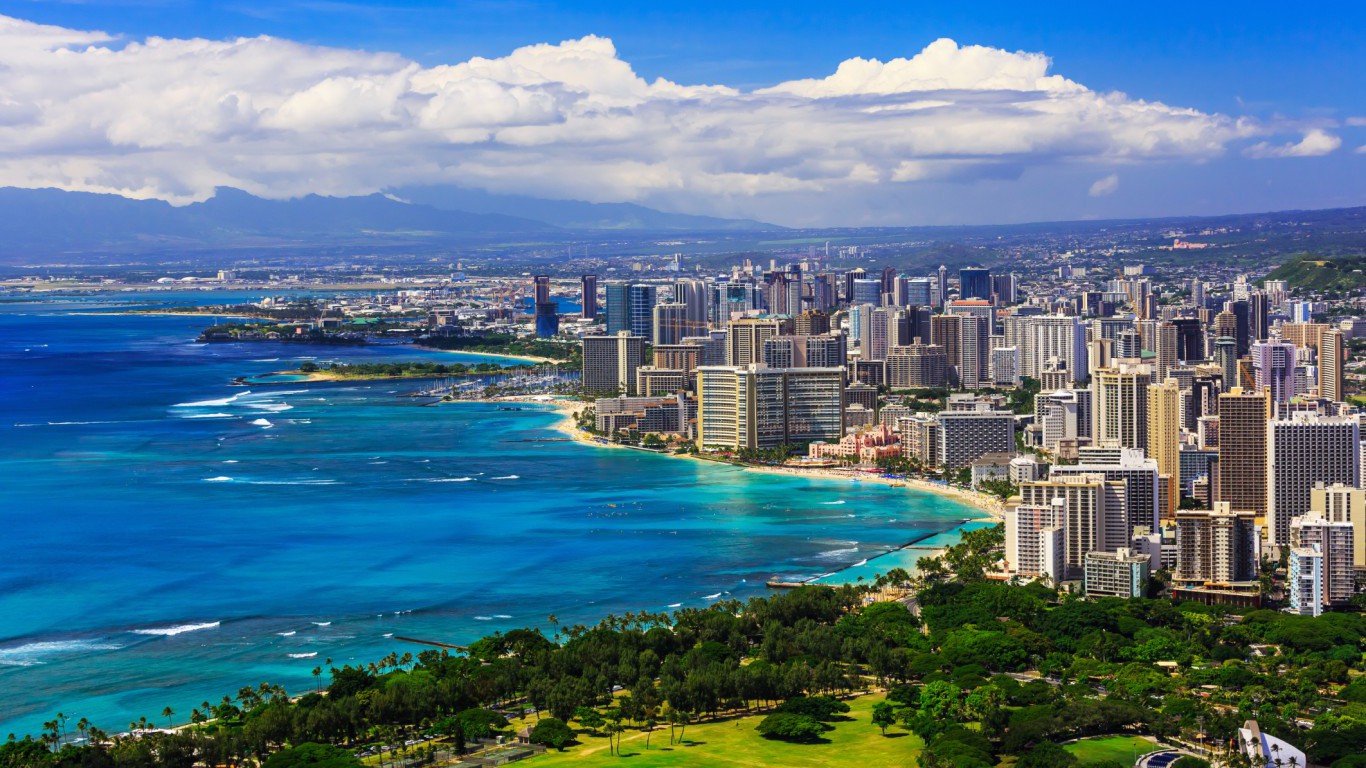
11. Hawaii: Urban Honolulu
> Cost of living in Urban Honolulu: 24.4% more expensive than avg.
> Cost of living in Hawaii: 18.4% more expensive than avg.
> Poverty rate: 8.5%
> Median household income: $80,513
[in-text-ad]

12. Idaho: Boise City
> Cost of living in Boise City: 5.2% less expensive than avg.
> Cost of living in Idaho: 7.0% less expensive than avg.
> Poverty rate: 12.7%
> Median household income: $55,162
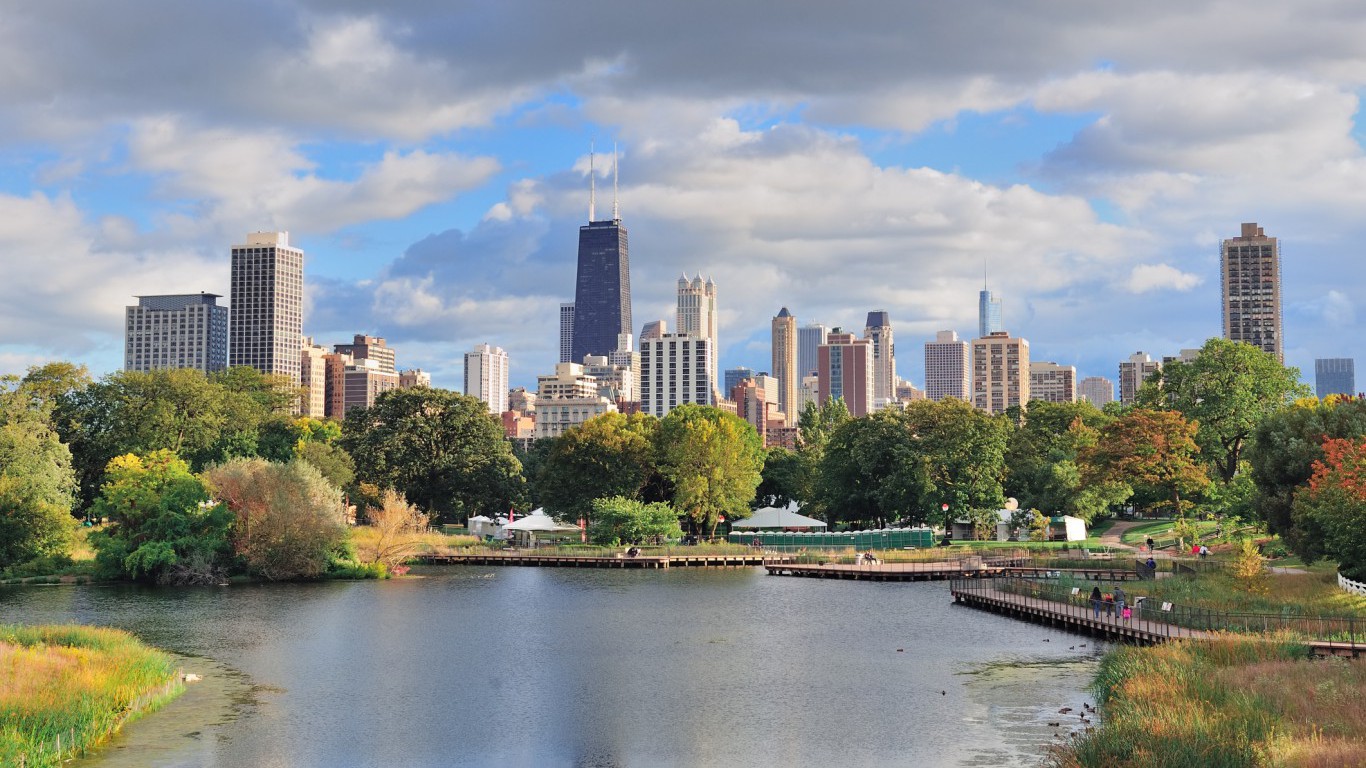
13. Illinois: Chicago-Naperville-Elgin
> Cost of living in Chicago-Naperville-Elgin: 3.8% more expensive than avg.
> Cost of living in Illinois: 1.1% less expensive than avg.
> Poverty rate: 12.4%
> Median household income: $66,020

14. Indiana: Bloomington
> Cost of living in Bloomington: 6.3% less expensive than avg.
> Cost of living in Indiana: 9.7% less expensive than avg.
> Poverty rate: 23.7%
> Median household income: $43,693
[in-text-ad-2]
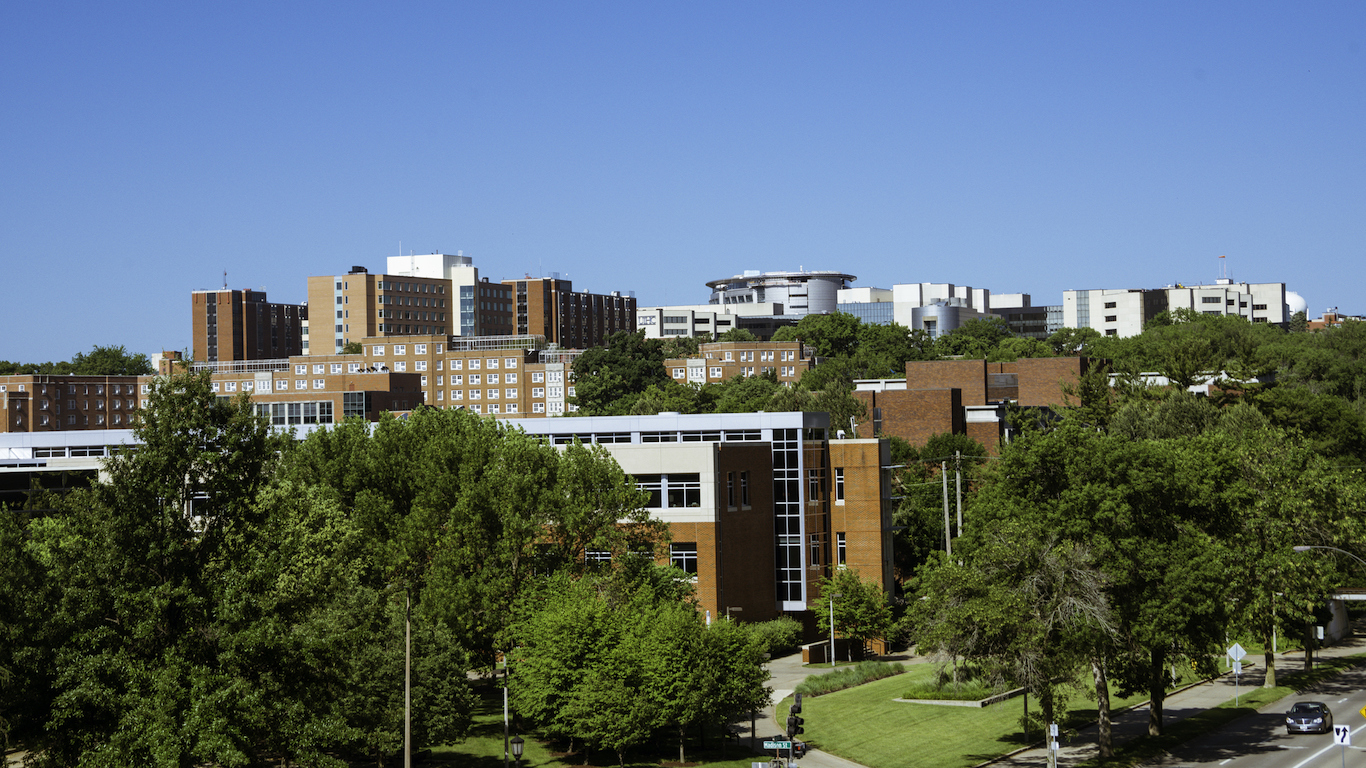
15. Iowa: Iowa City
> Cost of living in Iowa City: 4.3% less expensive than avg.
> Cost of living in Iowa: 9.8% less expensive than avg.
> Poverty rate: 17.7%
> Median household income: $57,777

16. Kansas: Lawrence
> Cost of living in Lawrence: 7.3% less expensive than avg.
> Cost of living in Kansas: 9.5% less expensive than avg.
> Poverty rate: 17.1%
> Median household income: $56,345
[in-text-ad]

17. Kentucky: Lexington-Fayette
> Cost of living in Lexington-Fayette: 8.7% less expensive than avg.
> Cost of living in Kentucky: 12.2% less expensive than avg.
> Poverty rate: 17.1%
> Median household income: $53,769

18. Louisiana: New Orleans-Metairie
> Cost of living in New Orleans-Metairie: 4.8% less expensive than avg.
> Cost of living in Louisiana: 9.6% less expensive than avg.
> Poverty rate: 17.0%
> Median household income: $48,804

19. Maine: Portland-South Portland
> Cost of living in Portland-South Portland: 1.7% more expensive than avg.
> Cost of living in Maine: 1.6% less expensive than avg.
> Poverty rate: 9.1%
> Median household income: $63,422
[in-text-ad-2]

20. Maryland: Baltimore-Columbia-Towson
> Cost of living in Baltimore-Columbia-Towson: 7.2% more expensive than avg.
> Cost of living in Maryland: 9.5% more expensive than avg.
> Poverty rate: 10.4%
> Median household income: $76,788

21. Massachusetts: Boston-Cambridge-Newton
> Cost of living in Boston-Cambridge-Newton: 11.1% more expensive than avg.
> Cost of living in Massachusetts: 7.8% more expensive than avg.
> Poverty rate: 9.6%
> Median household income: $82,380
[in-text-ad]

22. Michigan: Ann Arbor
> Cost of living in Ann Arbor: 1.8% more expensive than avg.
> Cost of living in Michigan: 6.7% less expensive than avg.
> Poverty rate: 14.8%
> Median household income: $65,601

23. Minnesota: Minneapolis-St. Paul-Bloomington
> Cost of living in Minneapolis-St. Paul-Bloomington: 2.3% more expensive than avg.
> Cost of living in Minnesota: 2.5% less expensive than avg.
> Poverty rate: 8.8%
> Median household income: $73,231
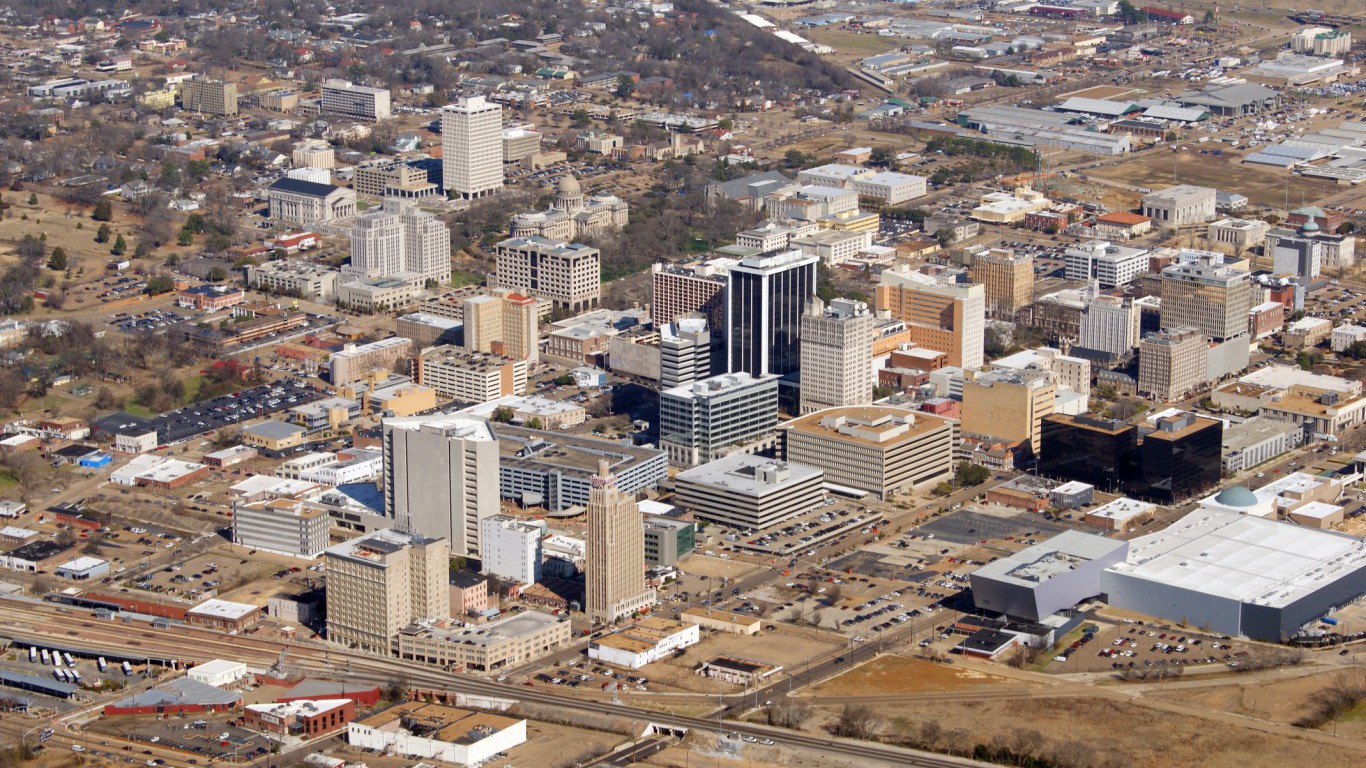
24. Mississippi: Jackson
> Cost of living in Jackson: 9.9% less expensive than avg.
> Cost of living in Mississippi: 13.6% less expensive than avg.
> Poverty rate: 16.2%
> Median household income: $50,632
[in-text-ad-2]

25. Missouri: Kansas City
> Cost of living in Kansas City: 6.3% less expensive than avg.
> Cost of living in Missouri: 10.5% less expensive than avg.
> Poverty rate: 10.9%
> Median household income: $61,385
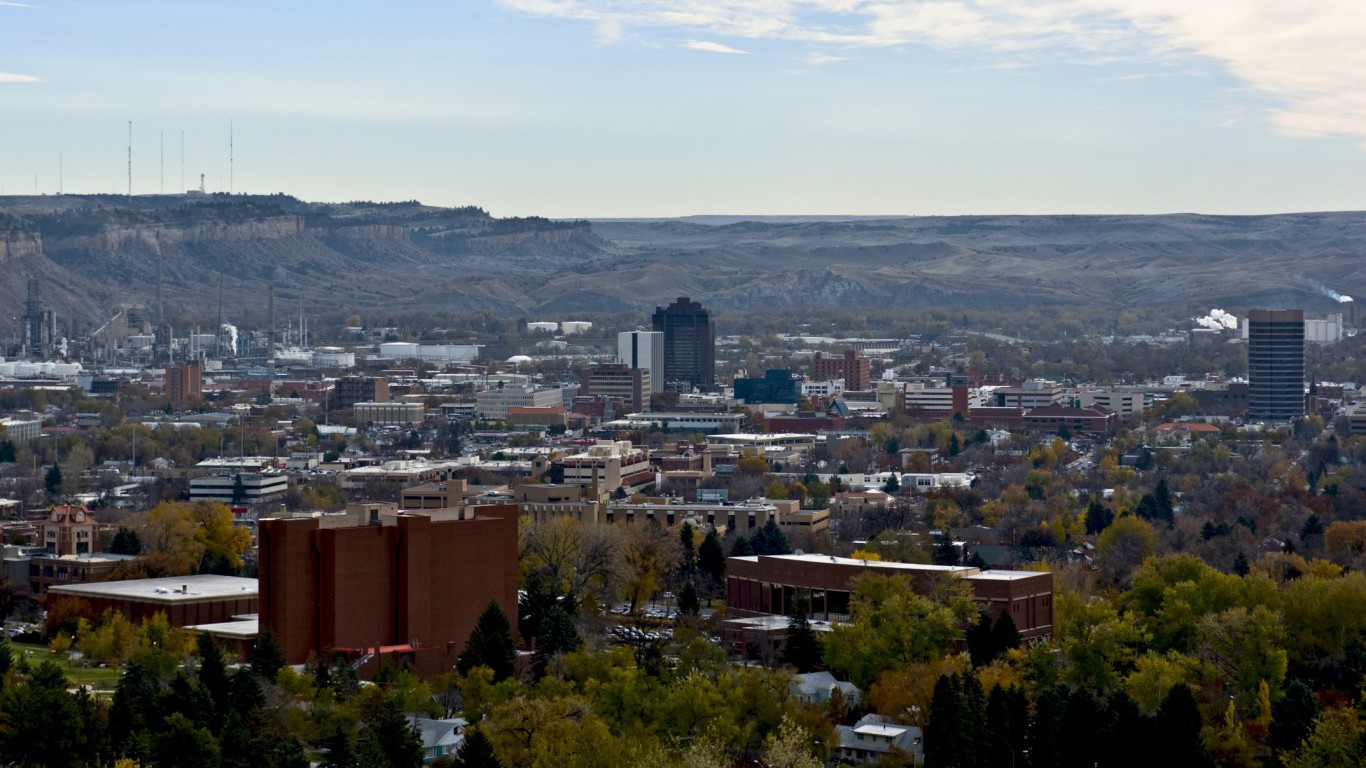
26. Montana: Billings
> Cost of living in Billings: 2.5% less expensive than avg.
> Cost of living in Montana: 5.9% less expensive than avg.
> Poverty rate: 7.3%
> Median household income: $58,037
[in-text-ad]
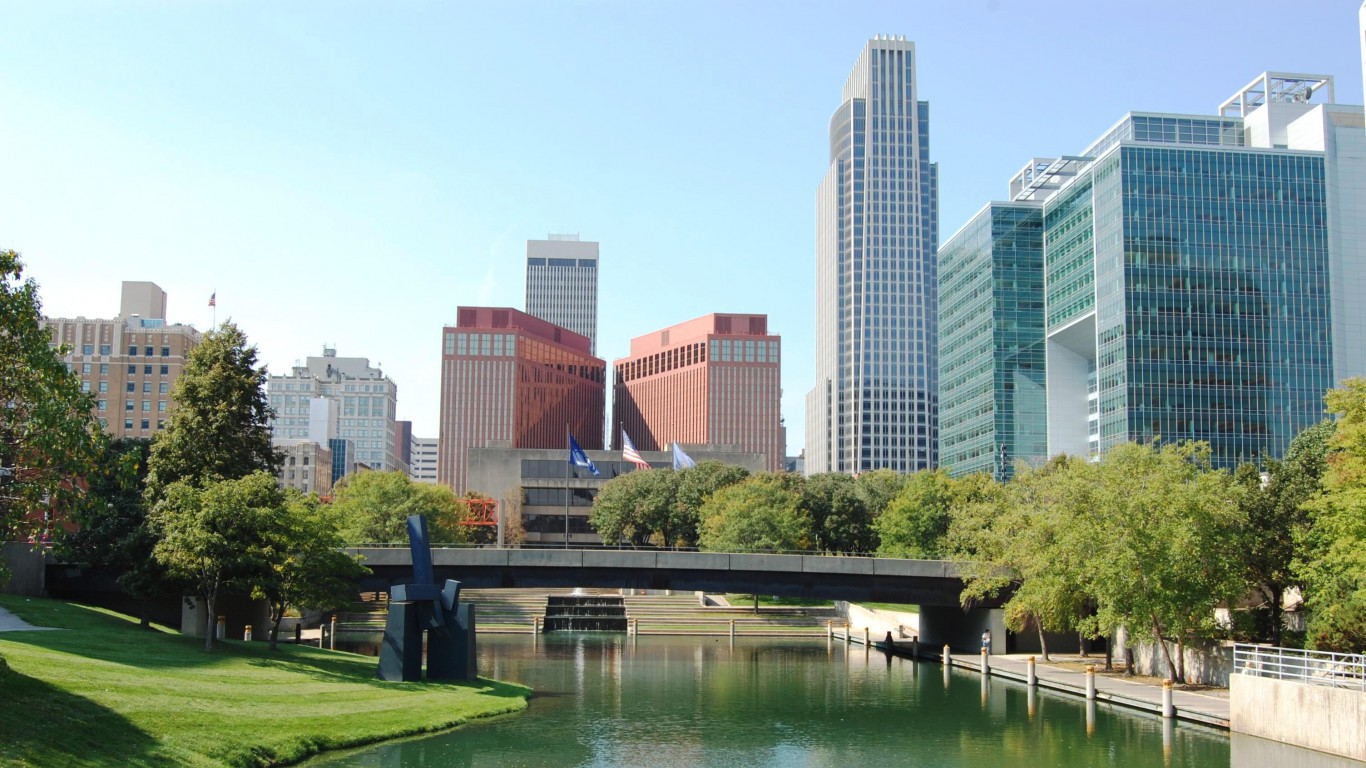
27. Nebraska: Omaha-Council Bluffs
> Cost of living in Omaha-Council Bluffs: 6.6% less expensive than avg.
> Cost of living in Nebraska: 9.5% less expensive than avg.
> Poverty rate: 10.3%
> Median household income: $62,247
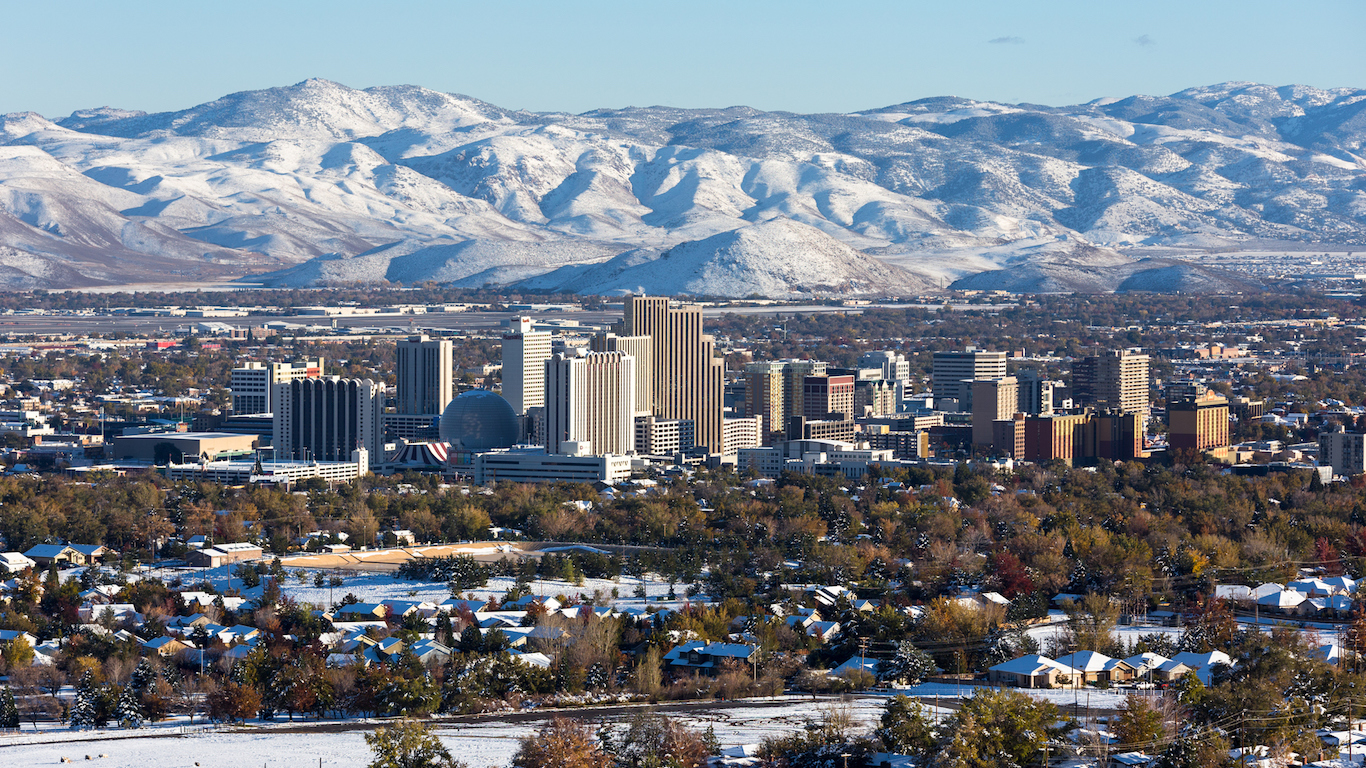
28. Nevada: Reno
> Cost of living in Reno: 1.3% less expensive than avg.
> Cost of living in Nevada: 2.6% less expensive than avg.
> Poverty rate: 12.2%
> Median household income: $58,056

29. New Hampshire: Manchester-Nashua
> Cost of living in Manchester-Nashua: 8.5% more expensive than avg.
> Cost of living in New Hampshire: 5.9% more expensive than avg.
> Poverty rate: 8.2%
> Median household income: $76,254
[in-text-ad-2]
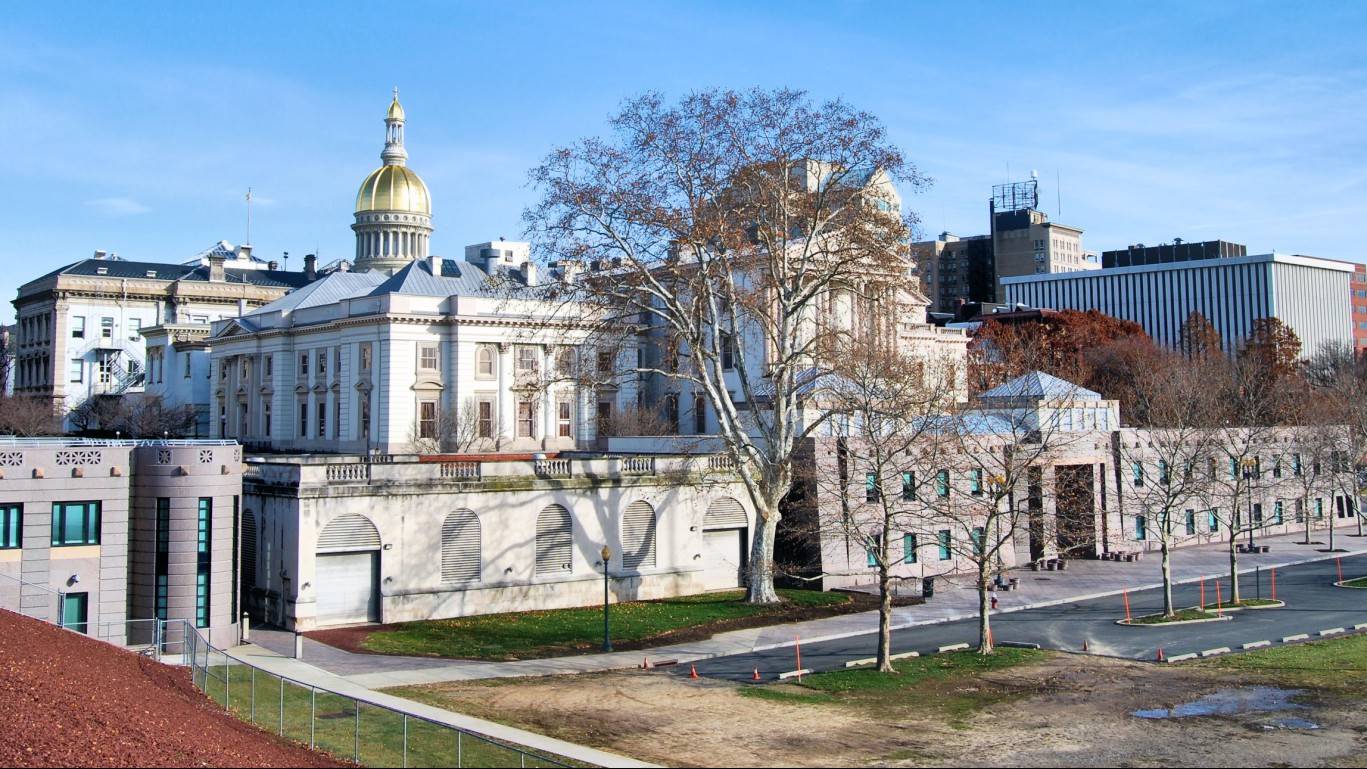
30. New Jersey: Trenton
> Cost of living in Trenton: 11.3% more expensive than avg.
> Cost of living in New Jersey: 13.2% more expensive than avg.
> Poverty rate: 11.1%
> Median household income: $77,650

31. New Mexico: Santa Fe
> Cost of living in Santa Fe: 0.2% less expensive than avg.
> Cost of living in New Mexico: 6.4% less expensive than avg.
> Poverty rate: 14.3%
> Median household income: $57,863
[in-text-ad]

32. New York: New York-Newark-Jersey City
> Cost of living in New York-Newark-Jersey City: 22.0% more expensive than avg.
> Cost of living in New York: 15.6% more expensive than avg.
> Poverty rate: 13.5%
> Median household income: $71,897
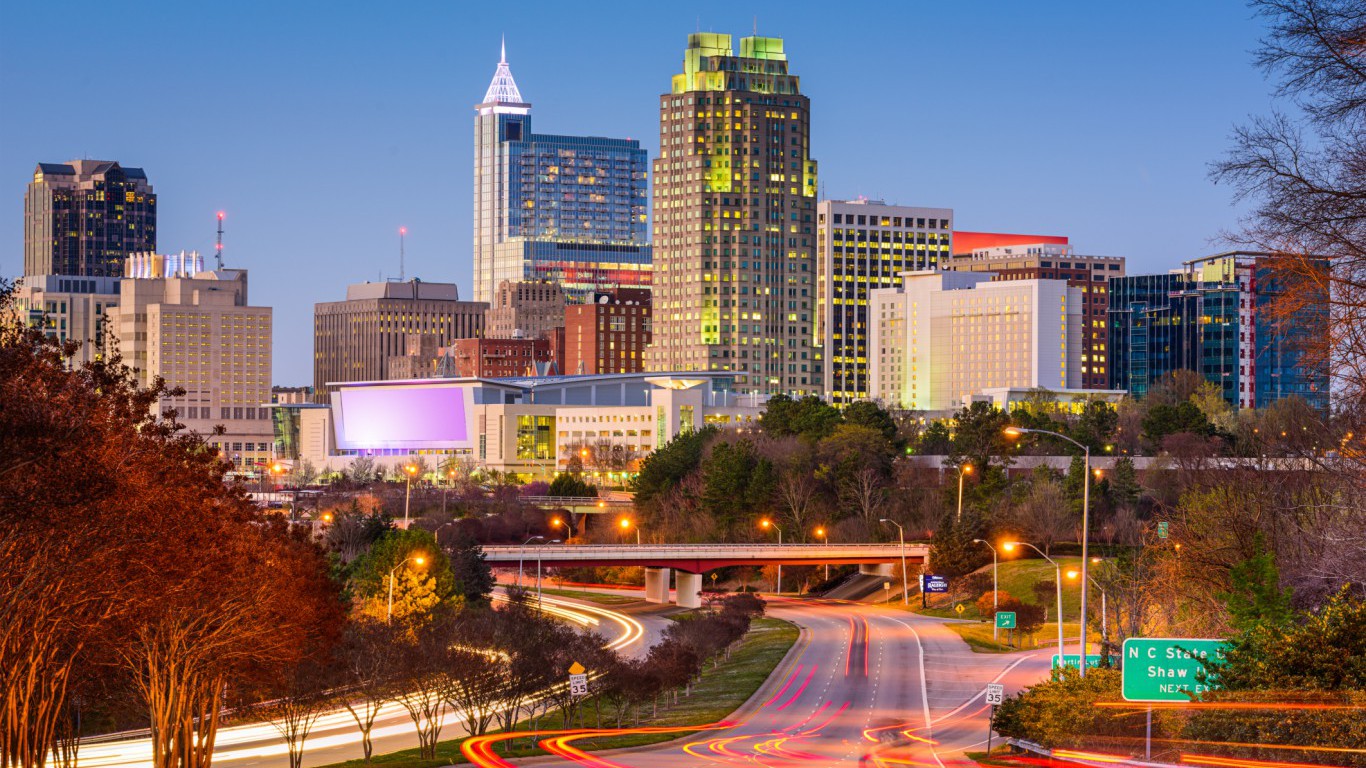
33. North Carolina: Raleigh
> Cost of living in Raleigh: 4.1% less expensive than avg.
> Cost of living in North Carolina: 9.1% less expensive than avg.
> Poverty rate: 10.0%
> Median household income: $71,685
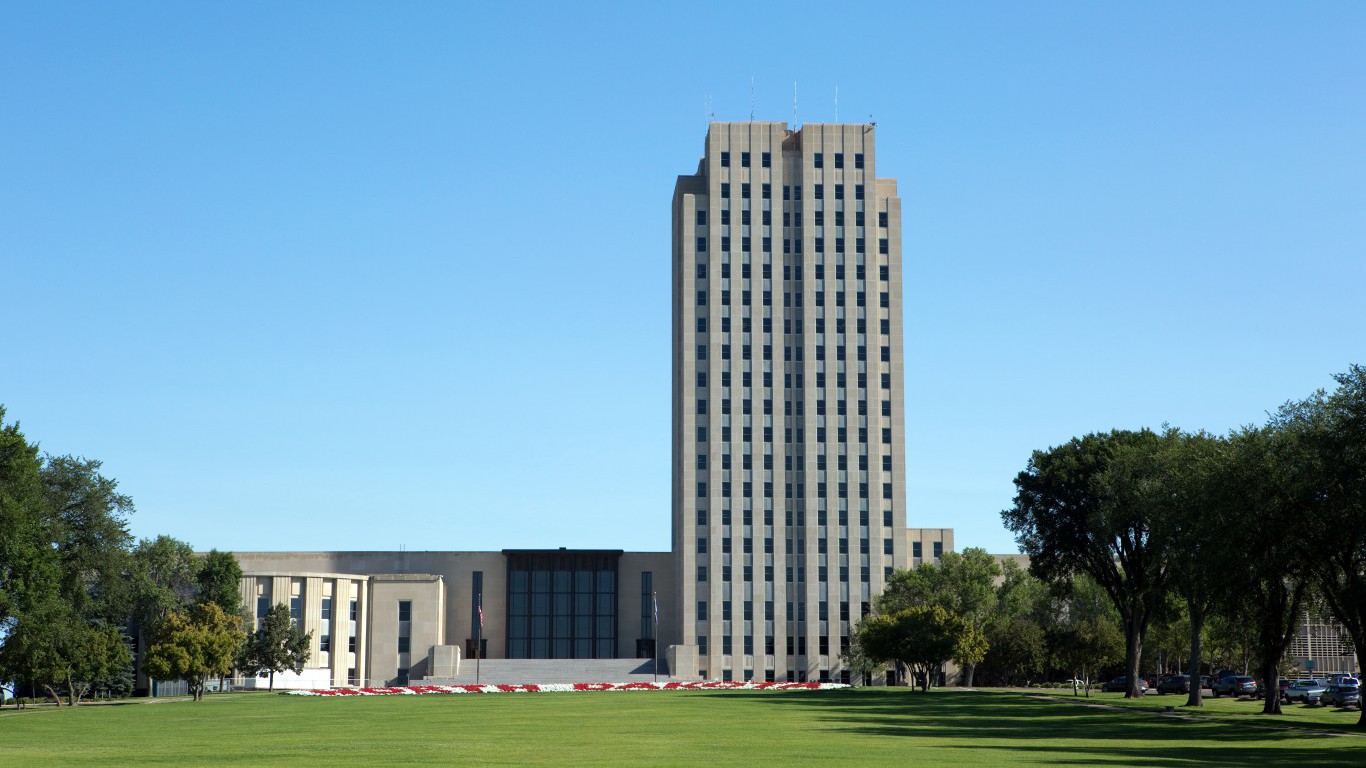
34. North Dakota: Bismarck
> Cost of living in Bismarck: 6.1% less expensive than avg.
> Cost of living in North Dakota: 8.5% less expensive than avg.
> Poverty rate: 9.2%
> Median household income: $65,527
[in-text-ad-2]

35. Ohio: Columbus
> Cost of living in Columbus: 7.0% less expensive than avg.
> Cost of living in Ohio: 10.7% less expensive than avg.
> Poverty rate: 14.2%
> Median household income: $60,294

36. Oklahoma: Oklahoma City
> Cost of living in Oklahoma City: 8.4% less expensive than avg.
> Cost of living in Oklahoma: 11.0% less expensive than avg.
> Poverty rate: 14.7%
> Median household income: $55,065
[in-text-ad]

37. Oregon: Portland-Vancouver-Hillsboro
> Cost of living in Portland-Vancouver-Hillsboro: 1.7% more expensive than avg.
> Cost of living in Oregon: 0.2% less expensive than avg.
> Poverty rate: 10.9%
> Median household income: $68,676

38. Pennsylvania: Philadelphia-Camden-Wilmington
> Cost of living in Philadelphia-Camden-Wilmington: 5.9% more expensive than avg.
> Cost of living in Pennsylvania: 1.6% less expensive than avg.
> Poverty rate: 12.9%
> Median household income: $65,996
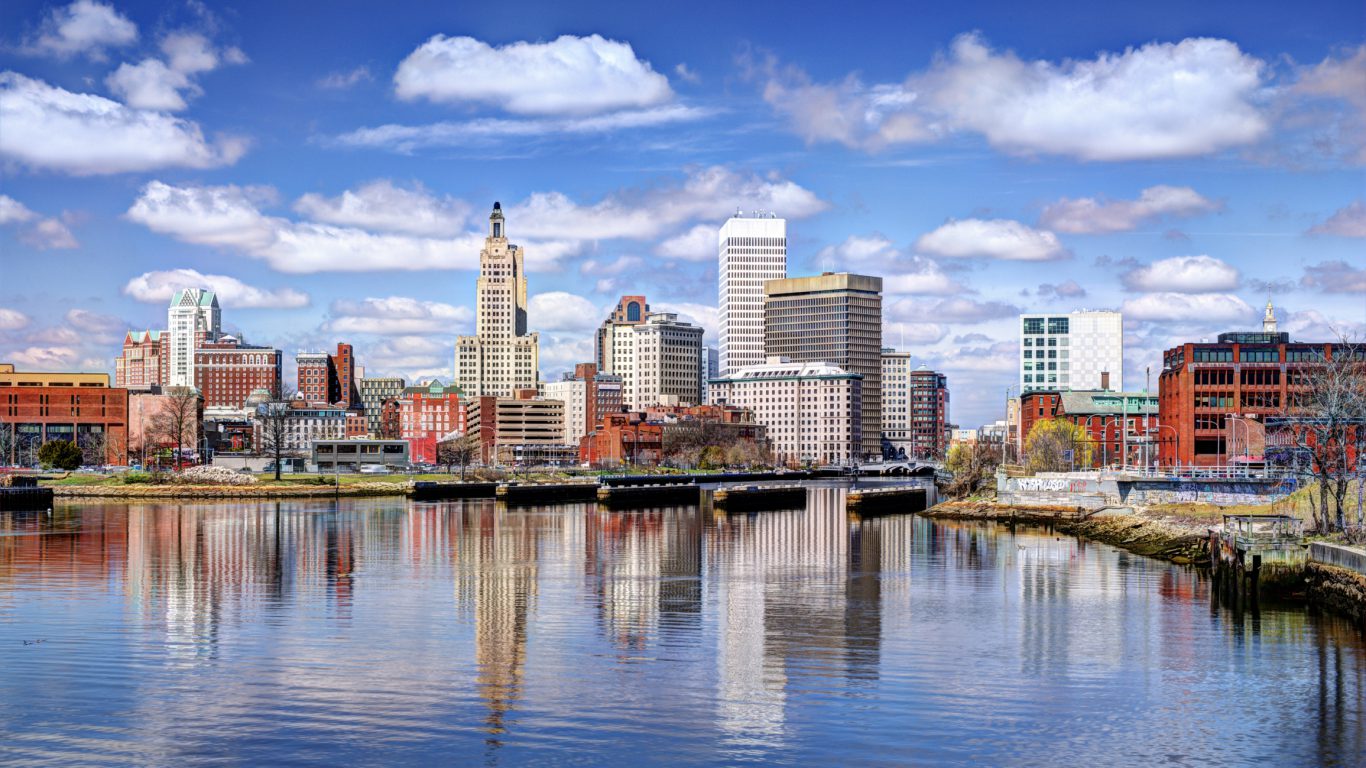
39. Rhode Island: Providence-Warwick
> Cost of living in Providence-Warwick: 0.3% less expensive than avg.
> Cost of living in Rhode Island: 0.4% less expensive than avg.
> Poverty rate: 12.0%
> Median household income: $61,948
[in-text-ad-2]
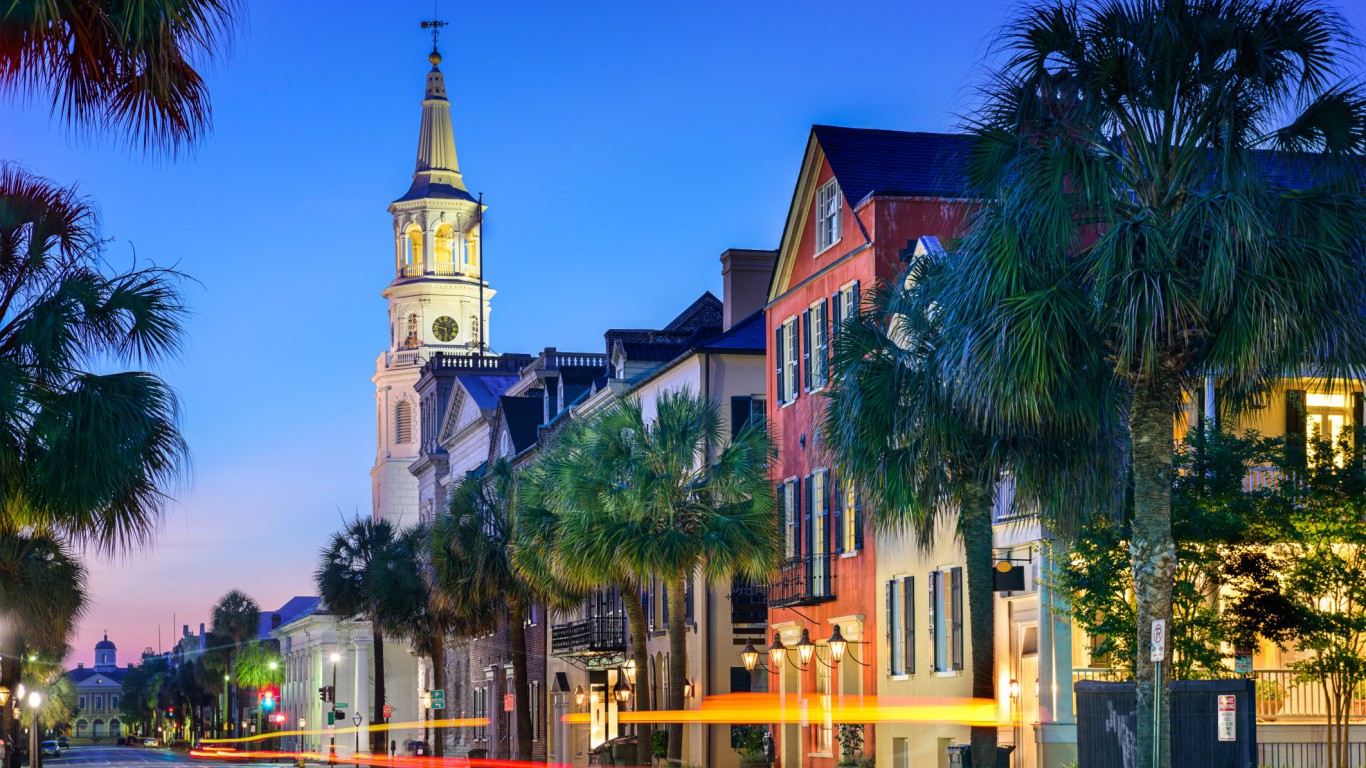
40. South Carolina: Charleston-North Charleston
> Cost of living in Charleston-North Charleston: 3.8% less expensive than avg.
> Cost of living in South Carolina: 9.7% less expensive than avg.
> Poverty rate: 13.0%
> Median household income: $57,659

41. South Dakota: Sioux Falls
> Cost of living in Sioux Falls: 7.6% less expensive than avg.
> Cost of living in South Dakota: 11.7% less expensive than avg.
> Poverty rate: 8.9%
> Median household income: $63,931
[in-text-ad]

42. Tennessee: Nashville-Davidson–Murfreesboro–Franklin
> Cost of living in Nashville-Davidson–Murfreesboro–Franklin: 5.6% less expensive than avg.
> Cost of living in Tennessee: 9.8% less expensive than avg.
> Poverty rate: 11.6%
> Median household income: $60,030
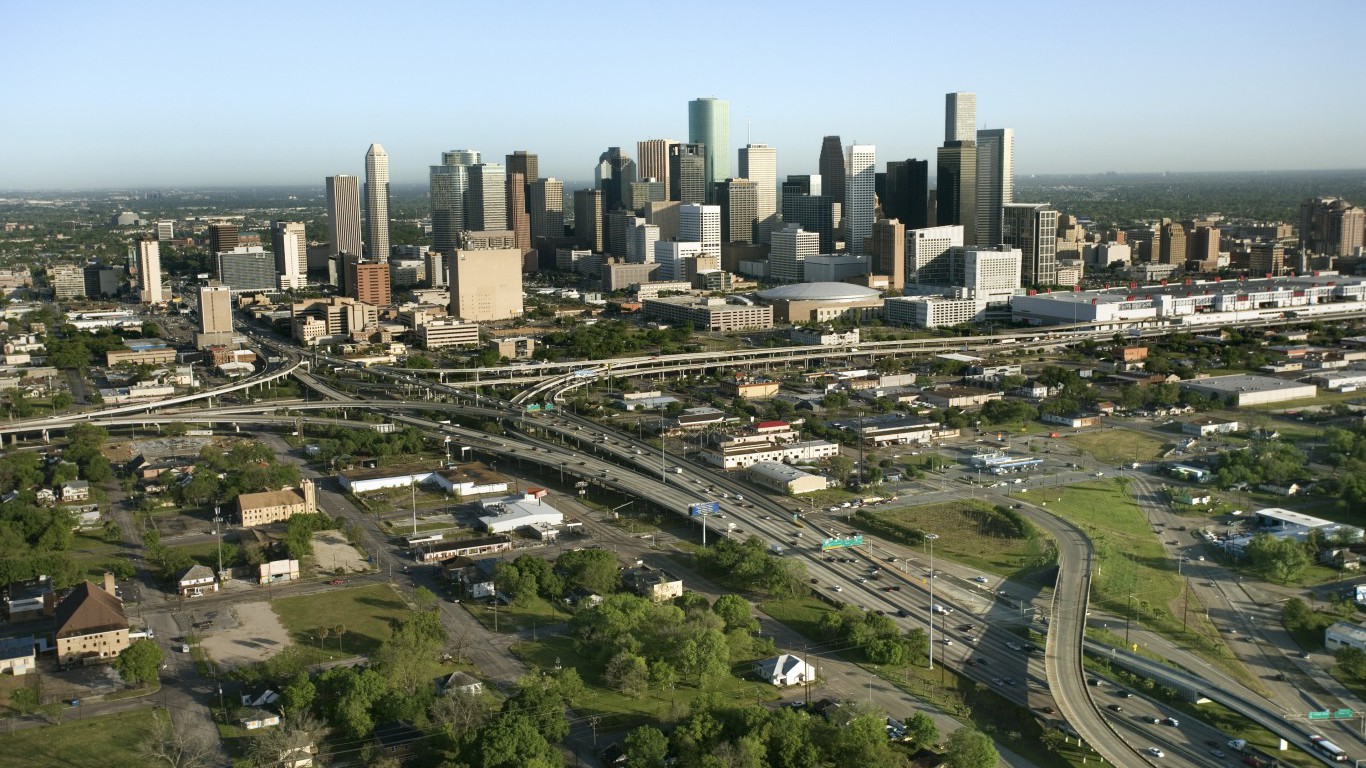
43. Texas: Houston-The Woodlands-Sugar Land
> Cost of living in Houston-The Woodlands-Sugar Land: 1.6% more expensive than avg.
> Cost of living in Texas: 3.1% less expensive than avg.
> Poverty rate: 14.8%
> Median household income: $61,708

44. Utah: Salt Lake City
> Cost of living in Salt Lake City: 0.6% less expensive than avg.
> Cost of living in Utah: 2.7% less expensive than avg.
> Poverty rate: 9.1%
> Median household income: $68,196
[in-text-ad-2]
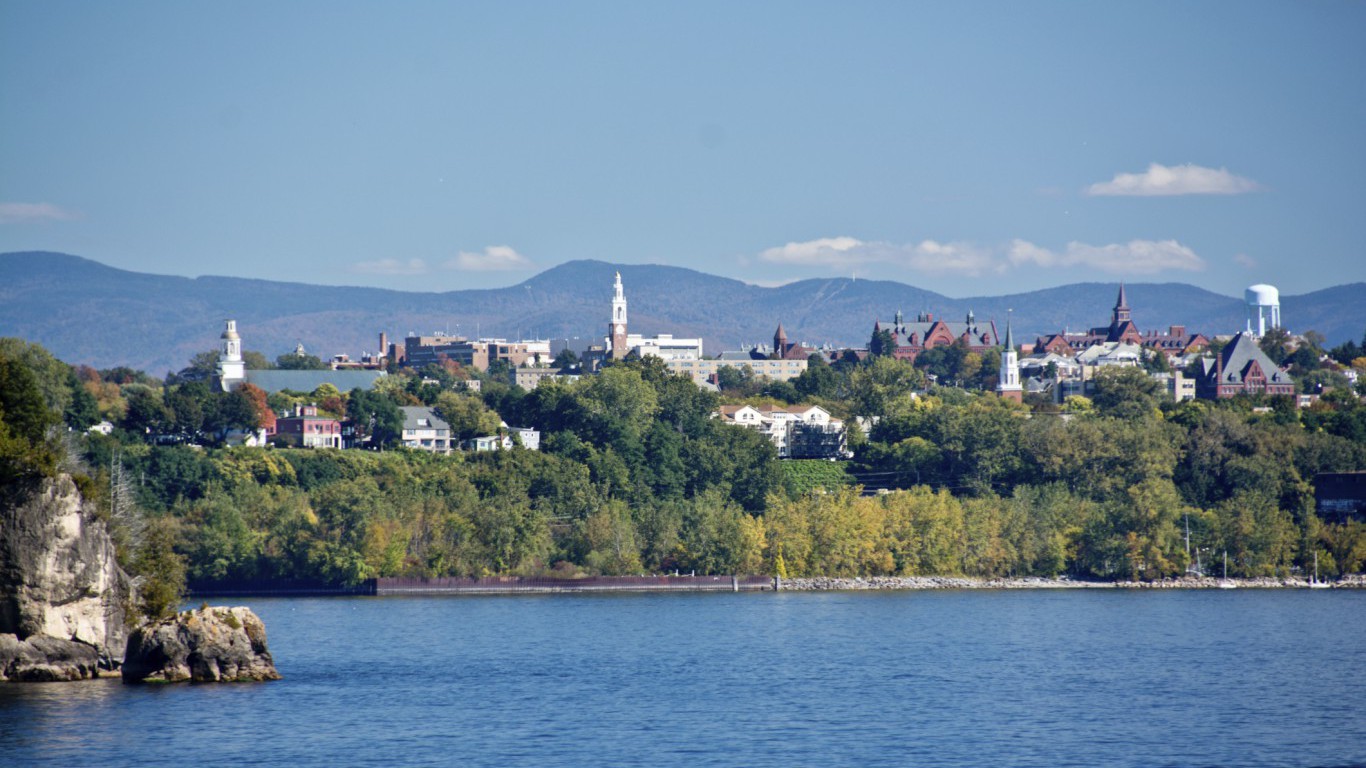
45. Vermont: Burlington-South Burlington
> Cost of living in Burlington-South Burlington: 4.6% more expensive than avg.
> Cost of living in Vermont: 1.6% more expensive than avg.
> Poverty rate: 10.3%
> Median household income: $66,367

46. Virginia: Charlottesville
> Cost of living in Charlottesville: 2.1% less expensive than avg.
> Cost of living in Virginia: 2.3% more expensive than avg.
> Poverty rate: 12.3%
> Median household income: $62,523
[in-text-ad]

47. Washington: Seattle-Tacoma-Bellevue
> Cost of living in Seattle-Tacoma-Bellevue: 10.5% more expensive than avg.
> Cost of living in Washington: 5.5% more expensive than avg.
> Poverty rate: 9.6%
> Median household income: $78,612
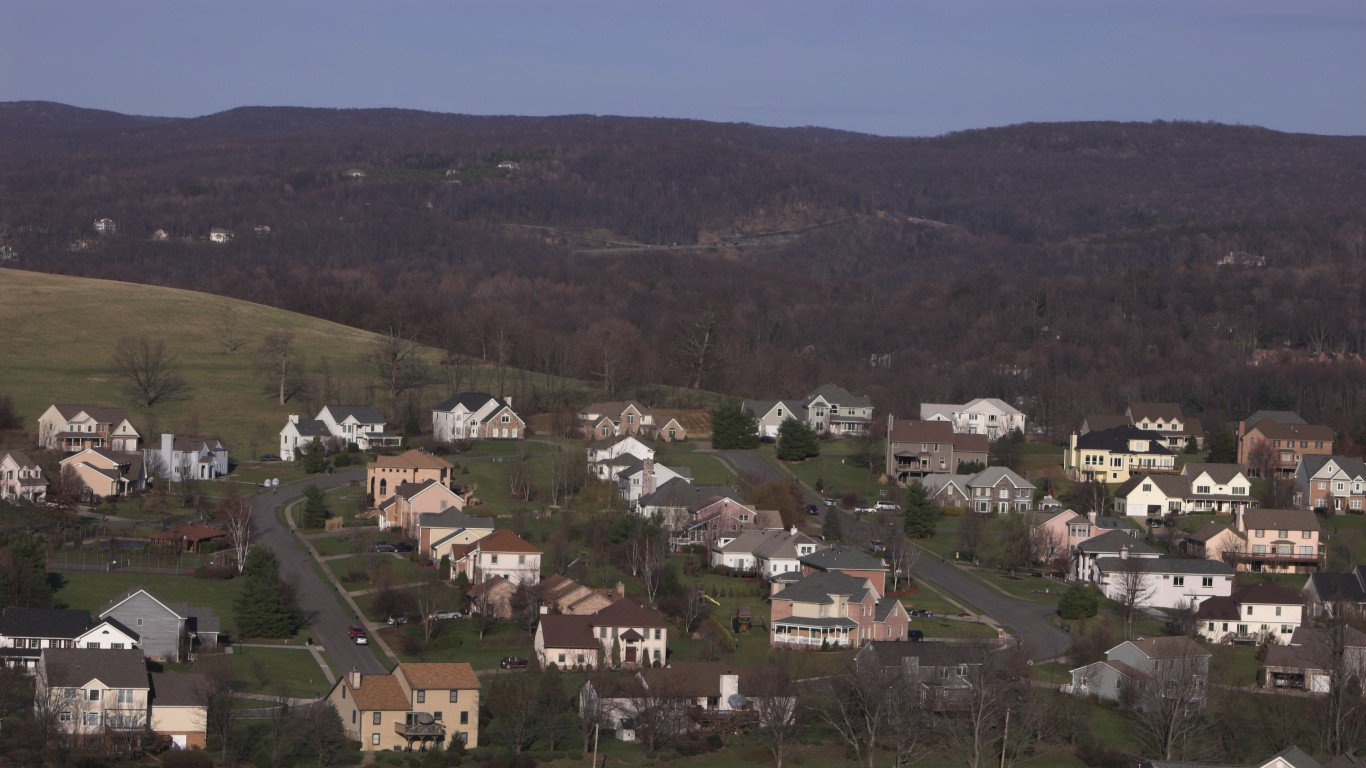
48. West Virginia: Morgantown
> Cost of living in Morgantown: 8.5% less expensive than avg.
> Cost of living in West Virginia: 12.4% less expensive than avg.
> Poverty rate: 20.1%
> Median household income: $50,120
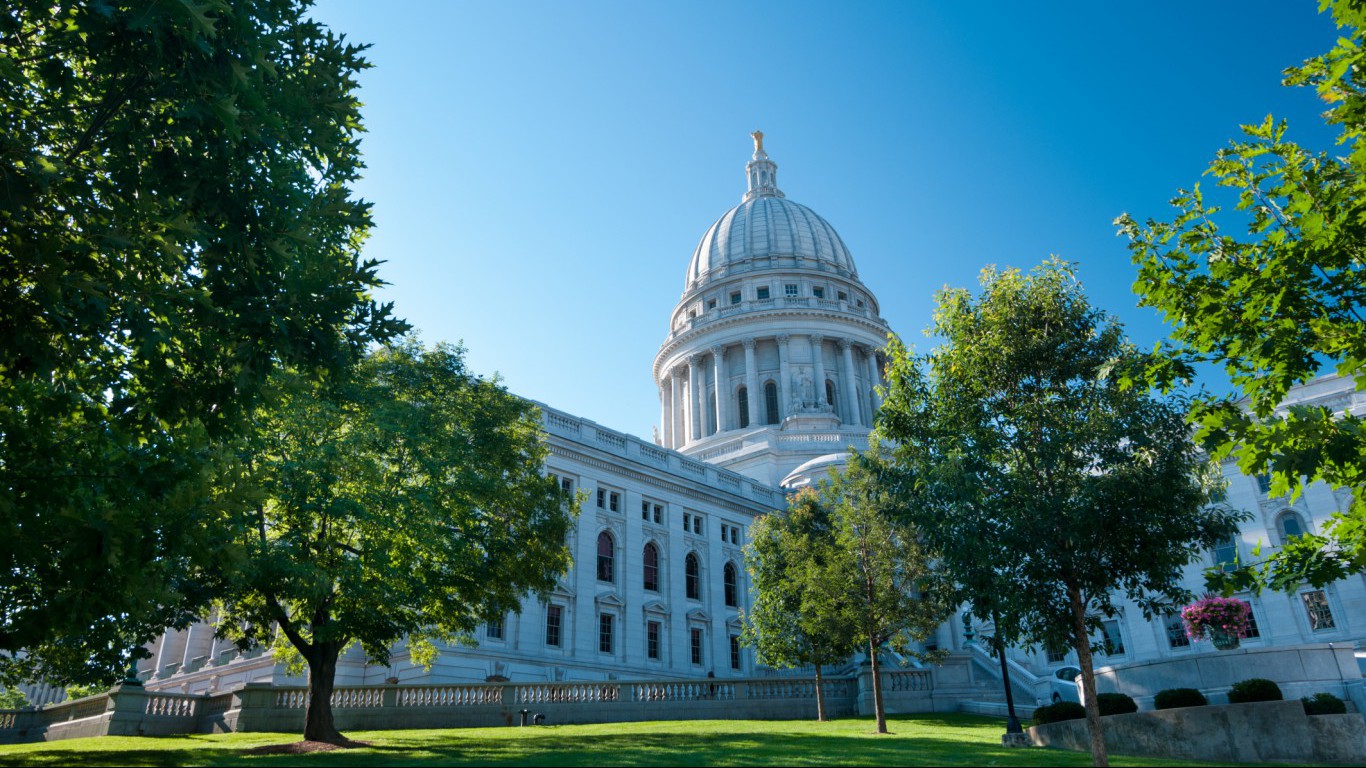
49. Wisconsin: Madison
> Cost of living in Madison: 2.3% less expensive than avg.
> Cost of living in Wisconsin: 7.2% less expensive than avg.
> Poverty rate: 10.6%
> Median household income: $68,497
[in-text-ad-2]

50. Wyoming: Casper
> Cost of living in Casper: 2.4% less expensive than avg.
> Cost of living in Wyoming: 3.3% less expensive than avg.
> Poverty rate: 9.2%
> Median household income: $59,474
Detailed Findings
The cities with highest costs of living in their states also tend to be relatively affluent. In 45 of the 50 cities on this list, the typical household earns more than the typical household does across the state as a whole.
Still, for the cities on this list, the higher incomes are almost always partially — and sometimes completely — offset by higher costs of goods and services. For example, in Miami-Fort Lauderdale-West Palm Beach, the most expensive metro area in Florida, the typical household earns $51,362 a year, slightly more than the median income of $50,860 across the state as a whole. However, goods and services in the metro area are 7.6% more expensive than they are nationwide on average. Meanwhile, goods and services in Florida are 0.3% less expensive than they are on average nationally.
After adjusting for the high cost of living in the Miami metro area, the typical household effectively earns just $47,458 annually, considerably less than the statewide cost-of-living-adjusted median income of $51,013.
Just because a city ranks as the most expensive in a given state does not necessarily mean it is expensive relative to the nation as a whole. In 30 cities on this list, goods and services are actually less expensive than they are on average nationwide.
Cities on this list with a low cost of living relative to the nation are most often in low-cost-of-living states. For example, Jackson is the most expensive city in Mississippi, a state with the lowest cost of living of all states. While goods and services are high in Jackson relative to the state as a whole, they are about 10% less expensive than they are nationwide on average.
In rare cases, the most expensive metro area in a state is actually less expensive than the state as a whole. Delaware, Maryland, New Jersey, and Virginia, which have higher costs of living than the average nationwide, are the only states where the most expensive metro areas have lower cost of living than their respective states as a whole.
Methodology
To determine the most expensive city in each state 24/7 Wall St. reviewed 2016 regional price parities – or cost of living – in each of the nation’s 382 metropolitan statistical areas as calculated by the Bureau of Economic Analysis. RPPs, according to the BEA, “are price indexes that measure geographic price level differences for one period in time within the United States. An RPP is a weighted average of the price level of goods and services for the average consumer in one geographic region compared to all other regions in the U.S.” The cost of living for each state also comes from the BEA. Poverty rates and median household income for each MSA come from the U.S. Census Bureau’s 2016 American Community Survey and are one year estimates.
The Average American Has No Idea How Much Money You Can Make Today (Sponsor)
The last few years made people forget how much banks and CD’s can pay. Meanwhile, interest rates have spiked and many can afford to pay you much more, but most are keeping yields low and hoping you won’t notice.
But there is good news. To win qualified customers, some accounts are paying almost 10x the national average! That’s an incredible way to keep your money safe and earn more at the same time. Our top pick for high yield savings accounts includes other benefits as well. You can earn up to 3.80% with a Checking & Savings Account today Sign up and get up to $300 with direct deposit. No account fees. FDIC Insured.
Click here to see how much more you could be earning on your savings today. It takes just a few minutes to open an account to make your money work for you.
Our top pick for high yield savings accounts includes other benefits as well. You can earn up to 4.00% with a Checking & Savings Account from Sofi. Sign up and get up to $300 with direct deposit. No account fees. FDIC Insured.
Thank you for reading! Have some feedback for us?
Contact the 24/7 Wall St. editorial team.

