In the Donald Trump era, the United States appears to be more politically divided than it has been in decades. Still, there are matters of public policy that most Americans can agree on — chief among them is investment in infrastructure. According to a recent non-partisan Gallup poll, three out of four Americans support the president’s plan of spending more federal money on infrastructure.
The president proposed a $1 trillion plan to improve aging roads, bridges, and tunnels across the country. While funding the project has proven to be a political challenge, broad public support for the plan is rooted in necessity.
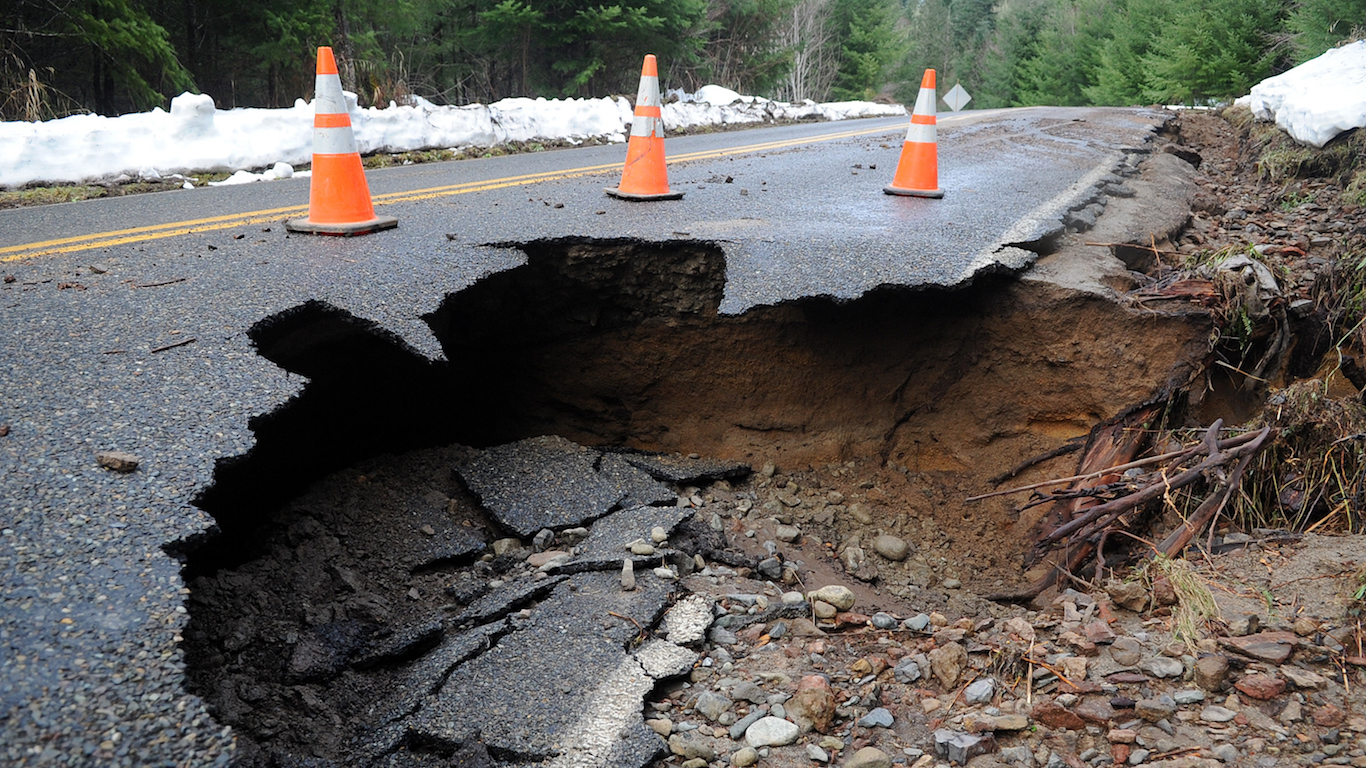
About seven out of every 100 miles of roadway nationwide are in poor condition; 9% of bridges nationwide are structurally deficient, meaning that they are in need of some repair; and 17% of dams in the country have a high hazard potential — meaning a functional failure would result in the loss of life.
For many, the notion of crumbling infrastructure conjures images of a bridge collapsing during rush hour, or a speeding passenger train hurtling off a faulty track. While such tragedies occur on occasion, they are relatively rare. Most people are affected by aging infrastructure on a daily basis in a number of more subtle ways including traffic congestion, public transportation delays, and vehicle damage.
Kristina Swallow, 2018 president of the American Society of Civil Engineers, explained the extent to which poor infrastructure affects our lives. “It’s hurting our economy, it’s hurting our communities’ ability to grow, it’s hurting our quality of life, and in some cases, there are public safety concerns,” Swallow said. “Our infrastructure is not meeting our needs.”
24/7 Wall St. created an index using the share of bridges, roads, and dams that are in a state of disrepair or potentially hazardous, to identify the states with the best and worst infrastructure. States are ranked on infrastructure from best to worst.
Click here to see the states that are falling apart.
Click here to see our detailed findings and methodology.
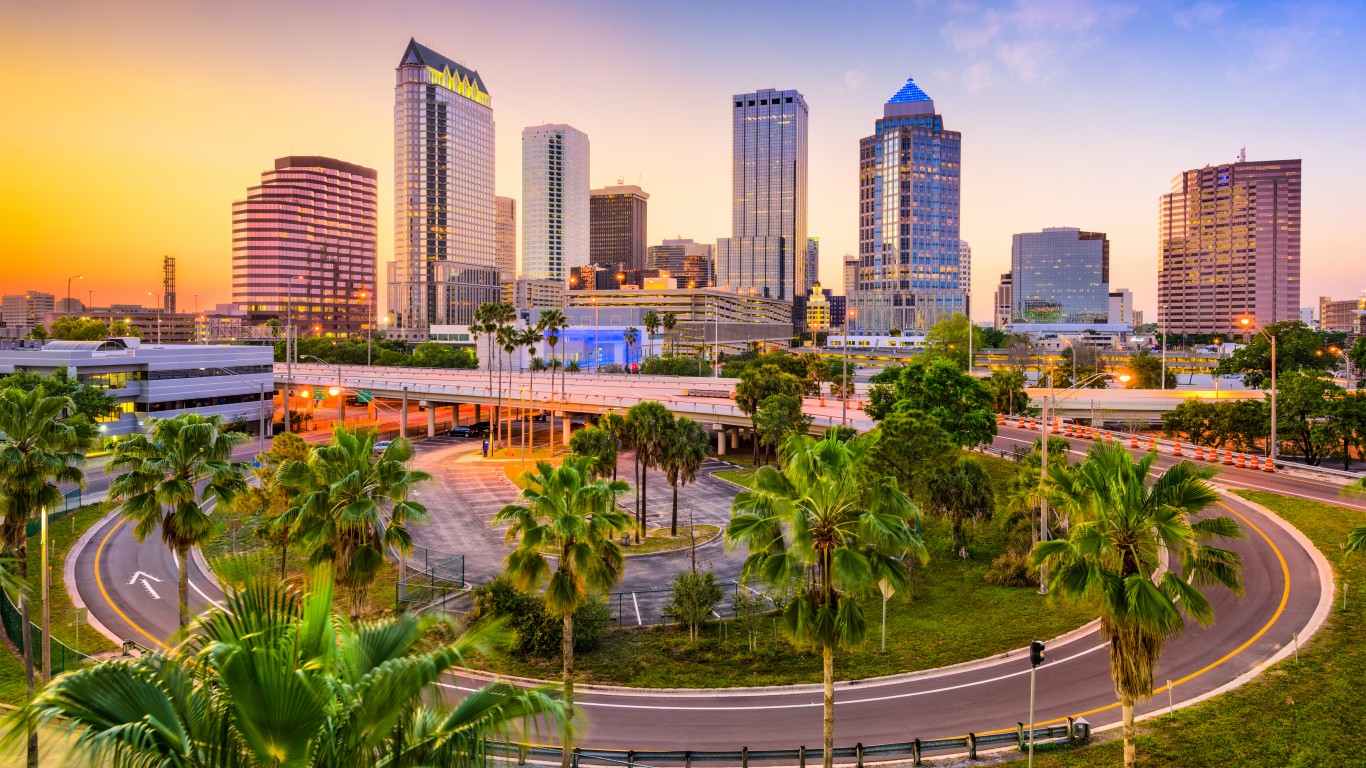
50. Florida
> Roads in poor condition: 1.3% (2nd lowest)
> Deficient bridges: 2.1% (3rd lowest)
> Dams at high hazard risk: 6.3% (9th lowest)
> State highway spending per driver: $457 (22nd lowest)
[in-text-ad]
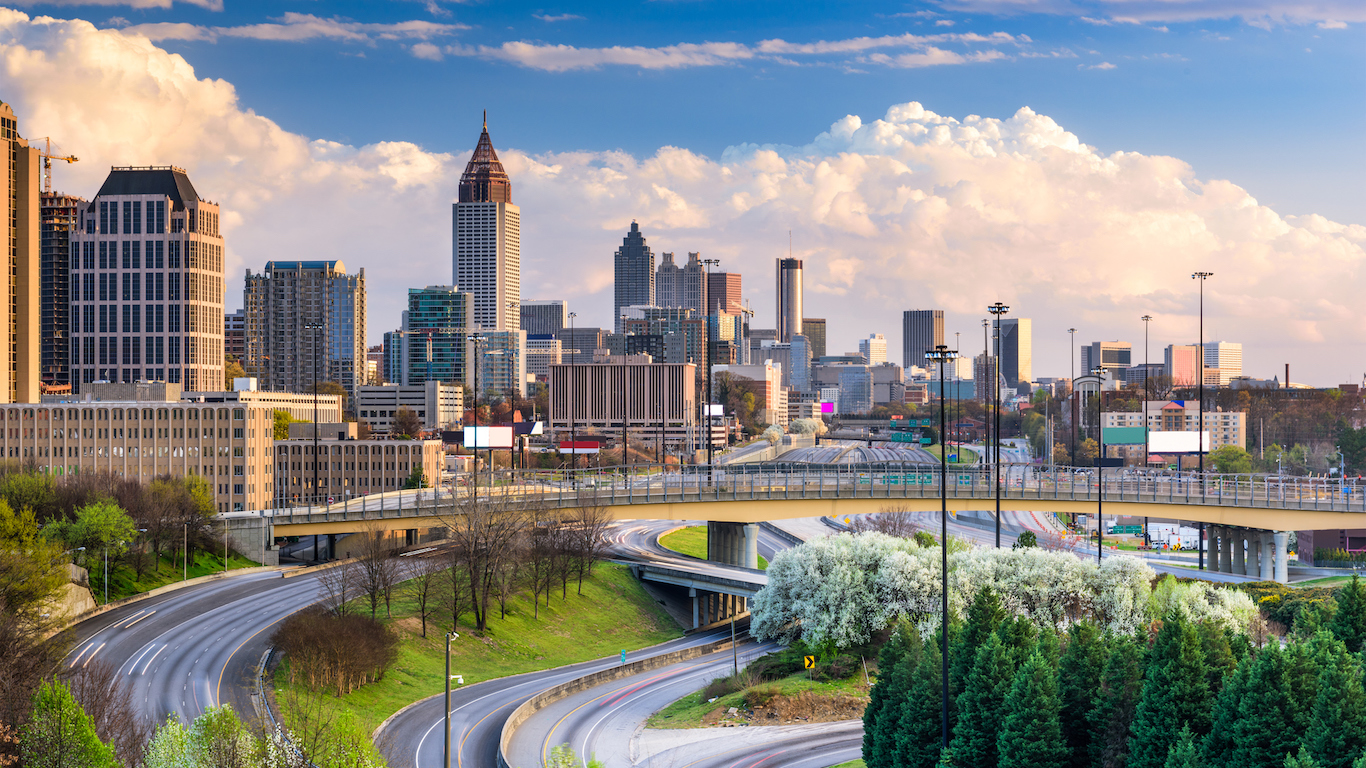
49. Georgia
> Roads in poor condition: 1.9% (5th lowest)
> Deficient bridges: 4.7% (7th lowest)
> Dams at high hazard risk: 11.0% (15th lowest)
> State highway spending per driver: $254 (3rd lowest)
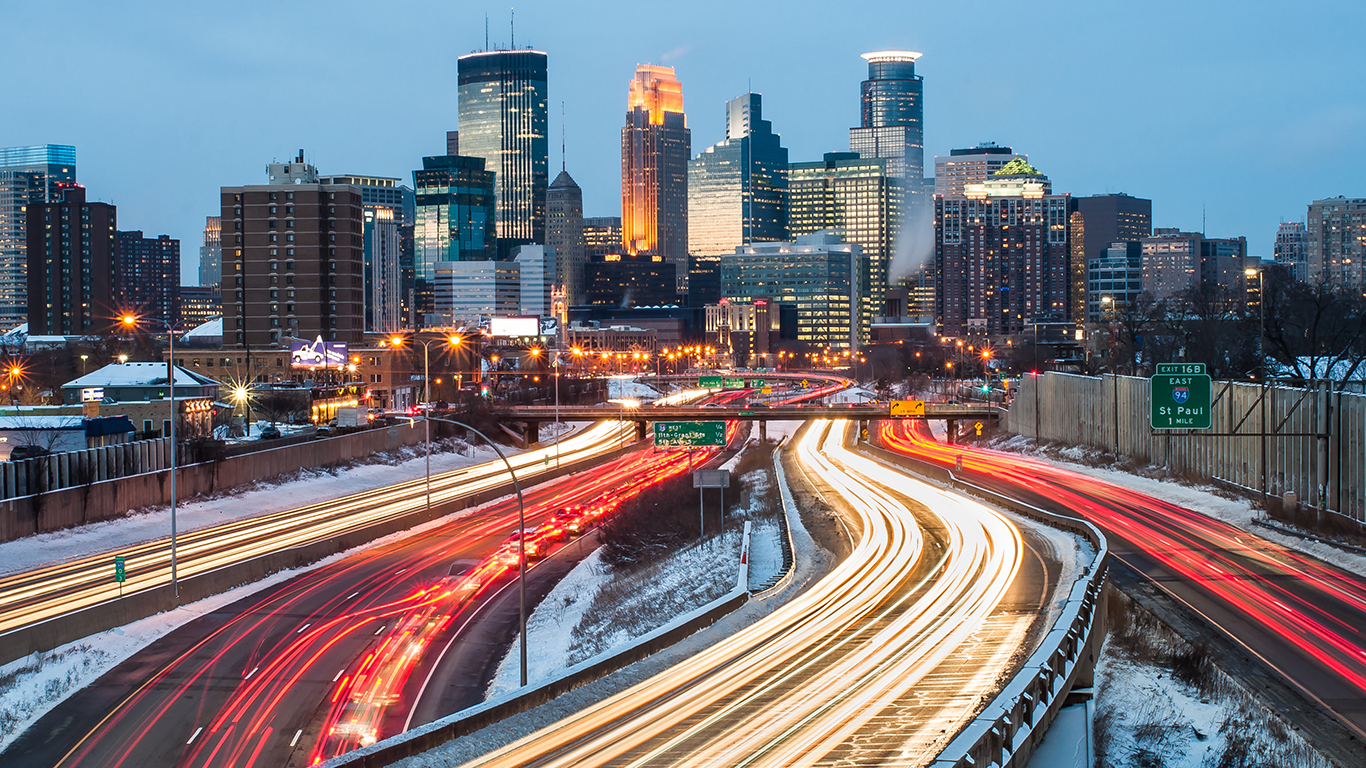
48. Minnesota
> Roads in poor condition: 4.1% (20th lowest)
> Deficient bridges: 5.3% (11th lowest)
> Dams at high hazard risk: 5.1% (5th lowest)
> State highway spending per driver: $555 (18th highest)

47. Nevada
> Roads in poor condition: 2.3% (8th lowest)
> Deficient bridges: 1.6% (2nd lowest)
> Dams at high hazard risk: 28.2% (14th highest)
> State highway spending per driver: $281 (6th lowest)
[in-text-ad-2]

46. Kansas
> Roads in poor condition: 0.9% (the lowest)
> Deficient bridges: 8.5% (25th lowest)
> Dams at high hazard risk: 4.3% (3rd lowest)
> State highway spending per driver: $537 (21st highest)
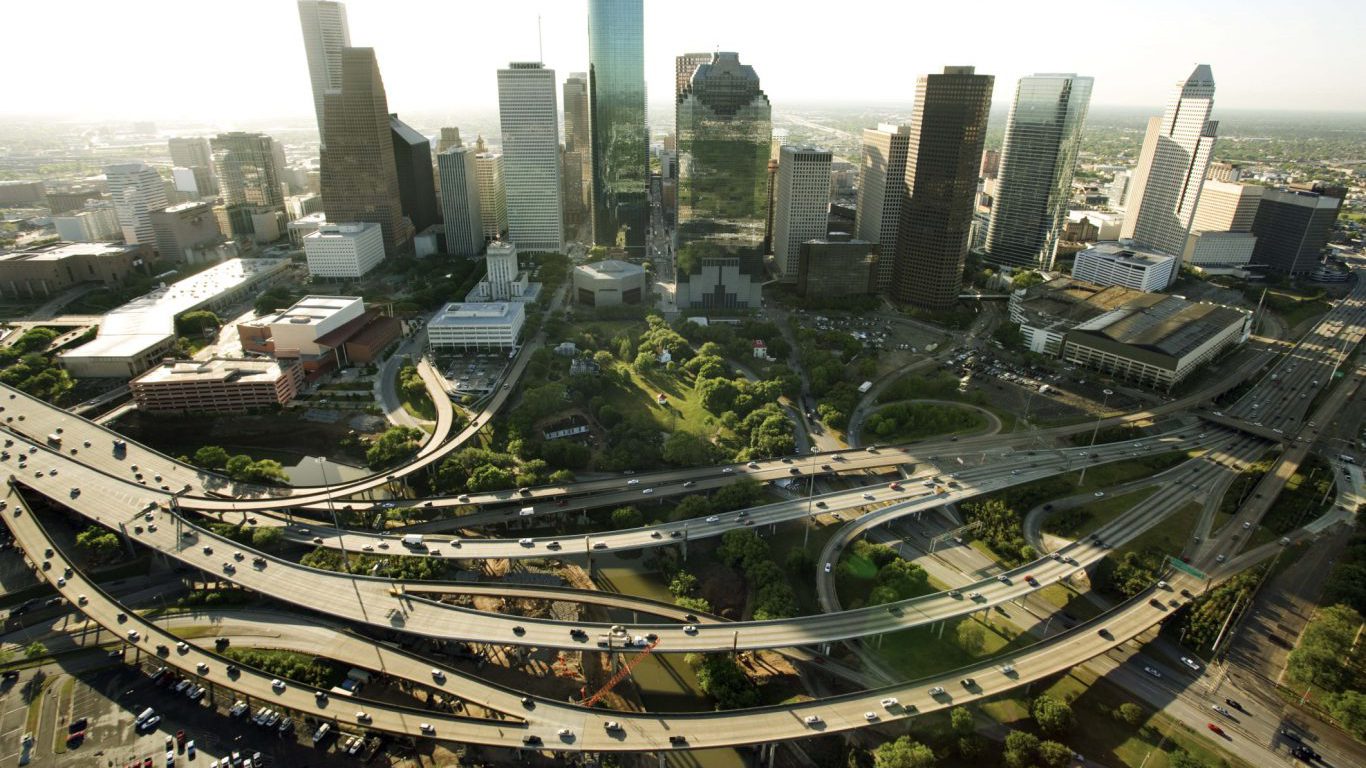
45. Texas
> Roads in poor condition: 5.8% (20th highest)
> Deficient bridges: 1.6% (the lowest)
> Dams at high hazard risk: 16.7% (21st lowest)
> State highway spending per driver: $509 (23rd highest)
[in-text-ad]
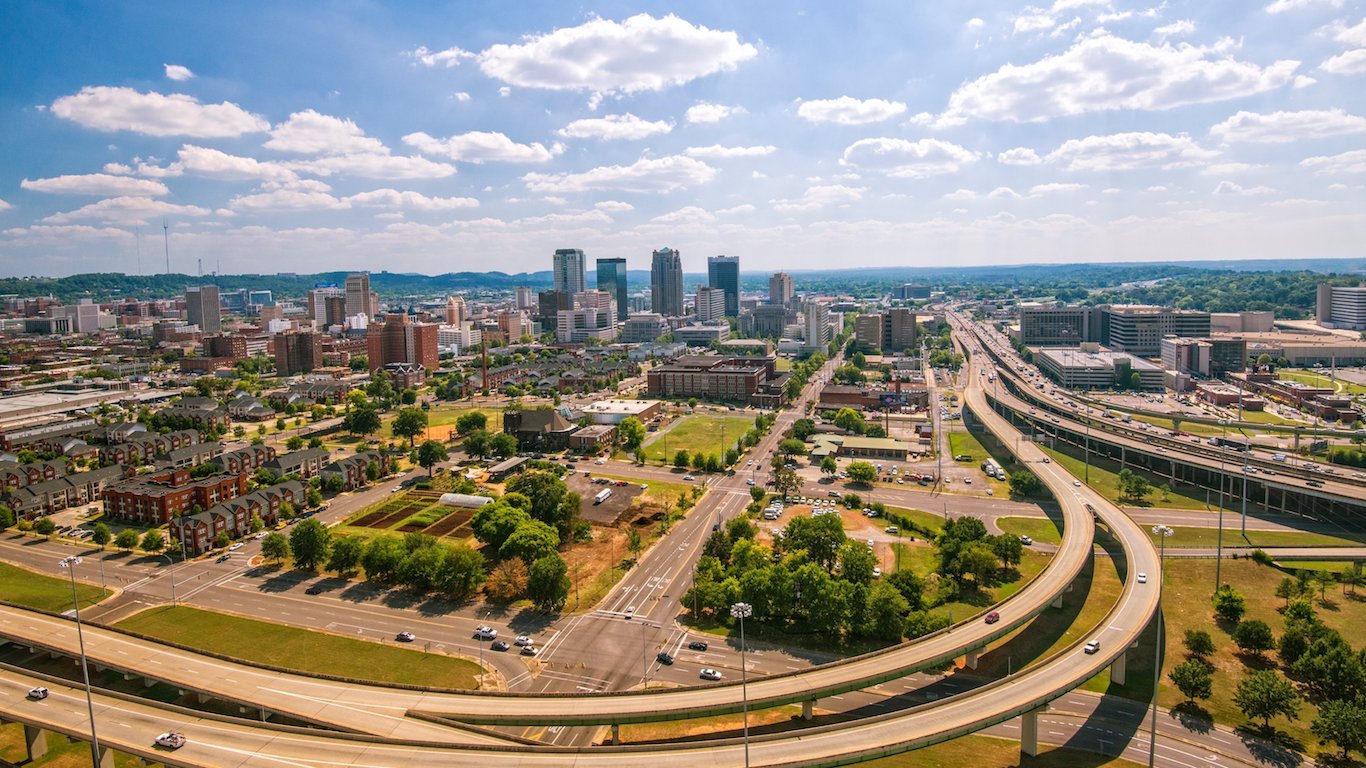
44. Alabama
> Roads in poor condition: 1.8% (4th lowest)
> Deficient bridges: 7.4% (22nd lowest)
> Dams at high hazard risk: 10.0% (14th lowest)
> State highway spending per driver: $405 (15th lowest)
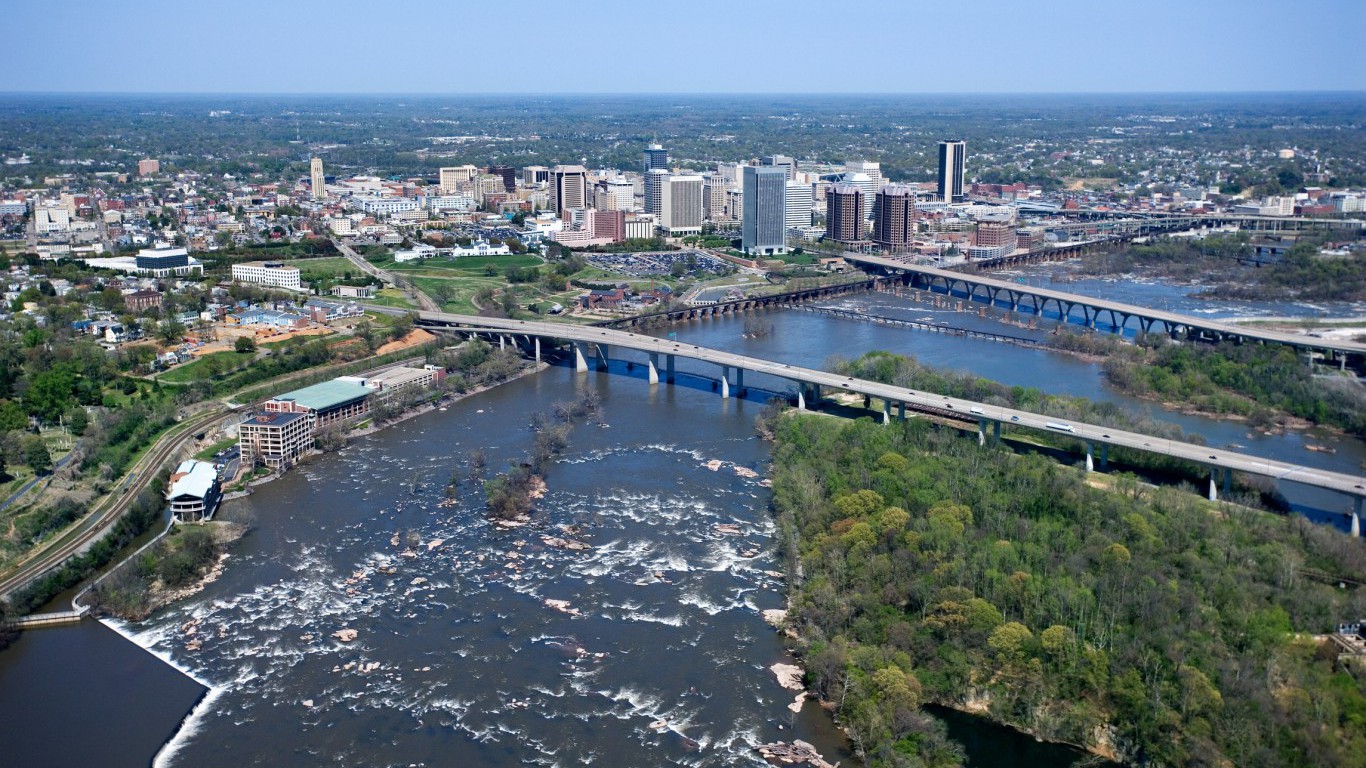
43. Virginia
> Roads in poor condition: 3.0% (11th lowest)
> Deficient bridges: 5.9% (16th lowest)
> Dams at high hazard risk: 16.0% (19th lowest)
> State highway spending per driver: $541 (20th highest)
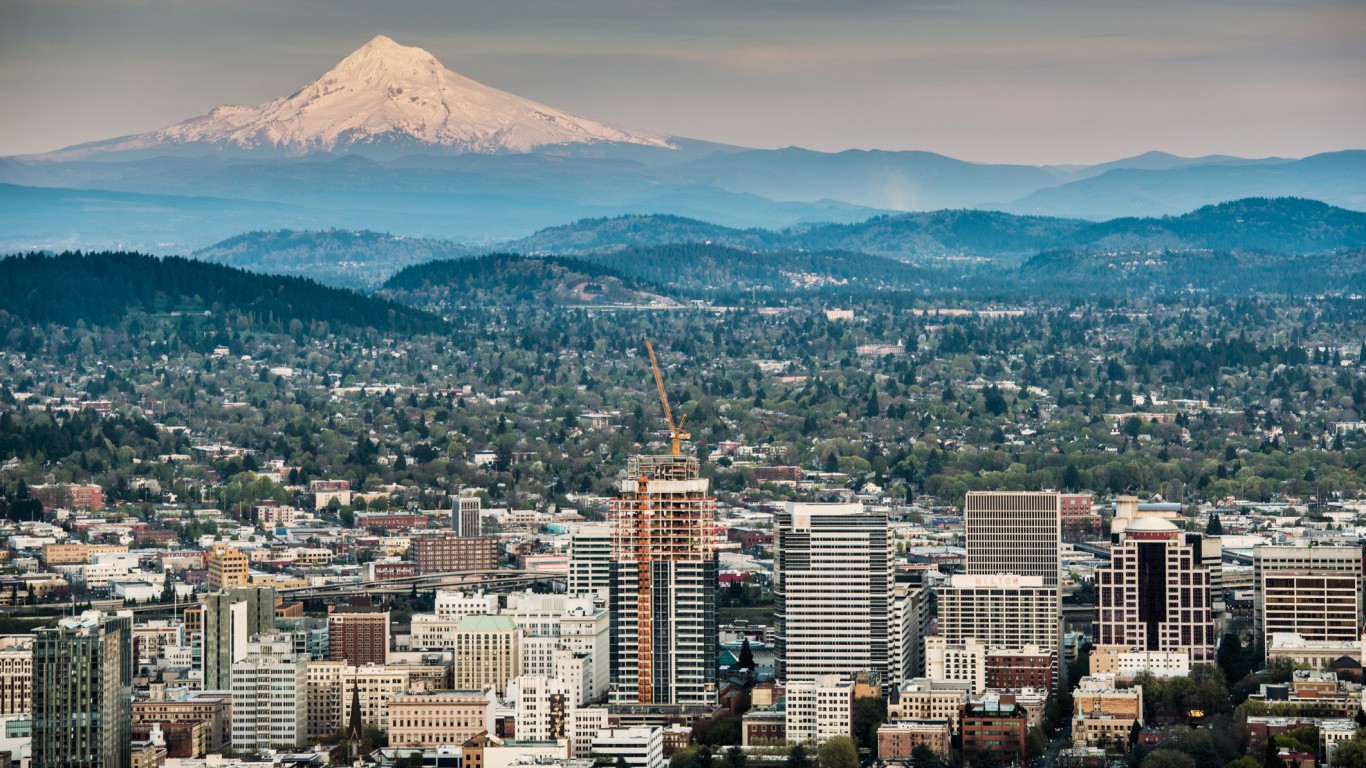
42. Oregon
> Roads in poor condition: 3.2% (13th lowest)
> Deficient bridges: 5.4% (12th lowest)
> Dams at high hazard risk: 18.0% (23rd lowest)
> State highway spending per driver: $318 (10th lowest)
[in-text-ad-2]
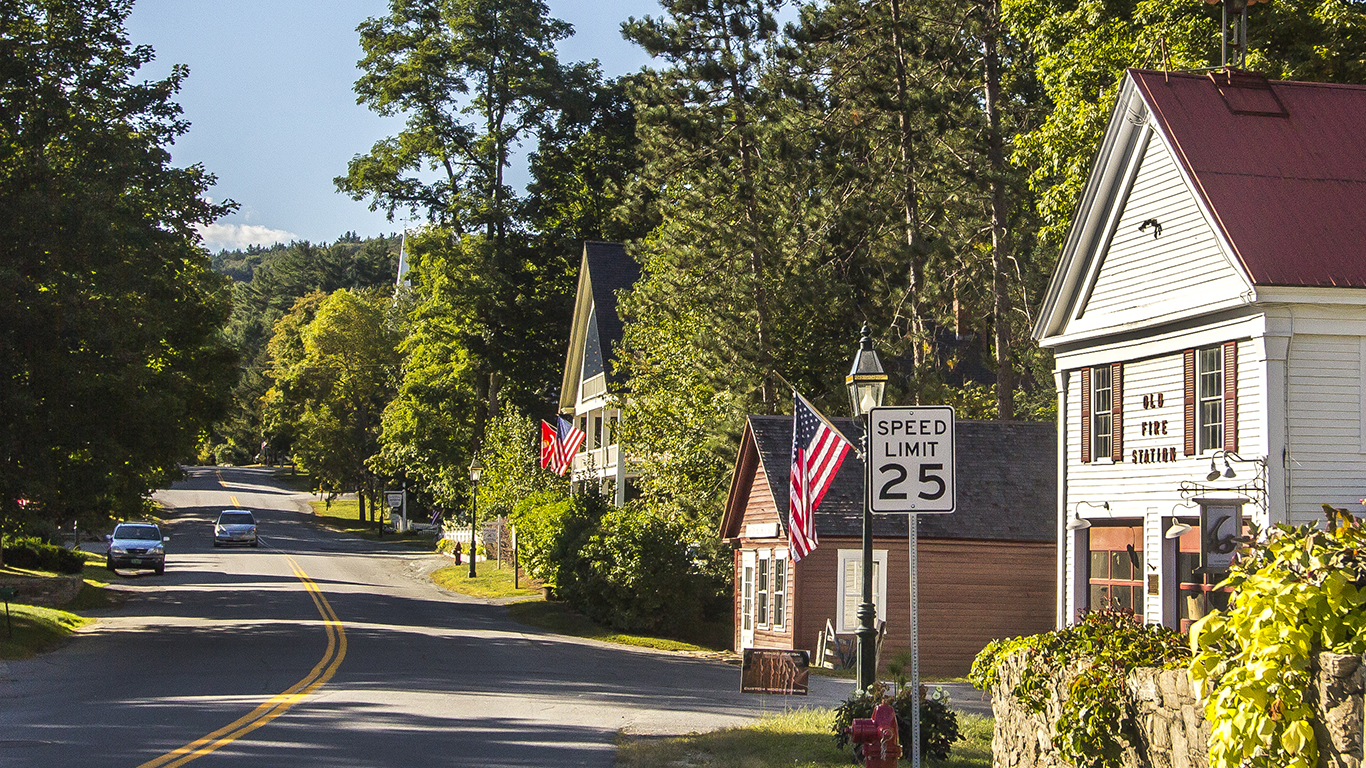
41. Vermont
> Roads in poor condition: 4.1% (19th lowest)
> Deficient bridges: 5.2% (10th lowest)
> Dams at high hazard risk: 16.2% (20th lowest)
> State highway spending per driver: $906 (6th highest)
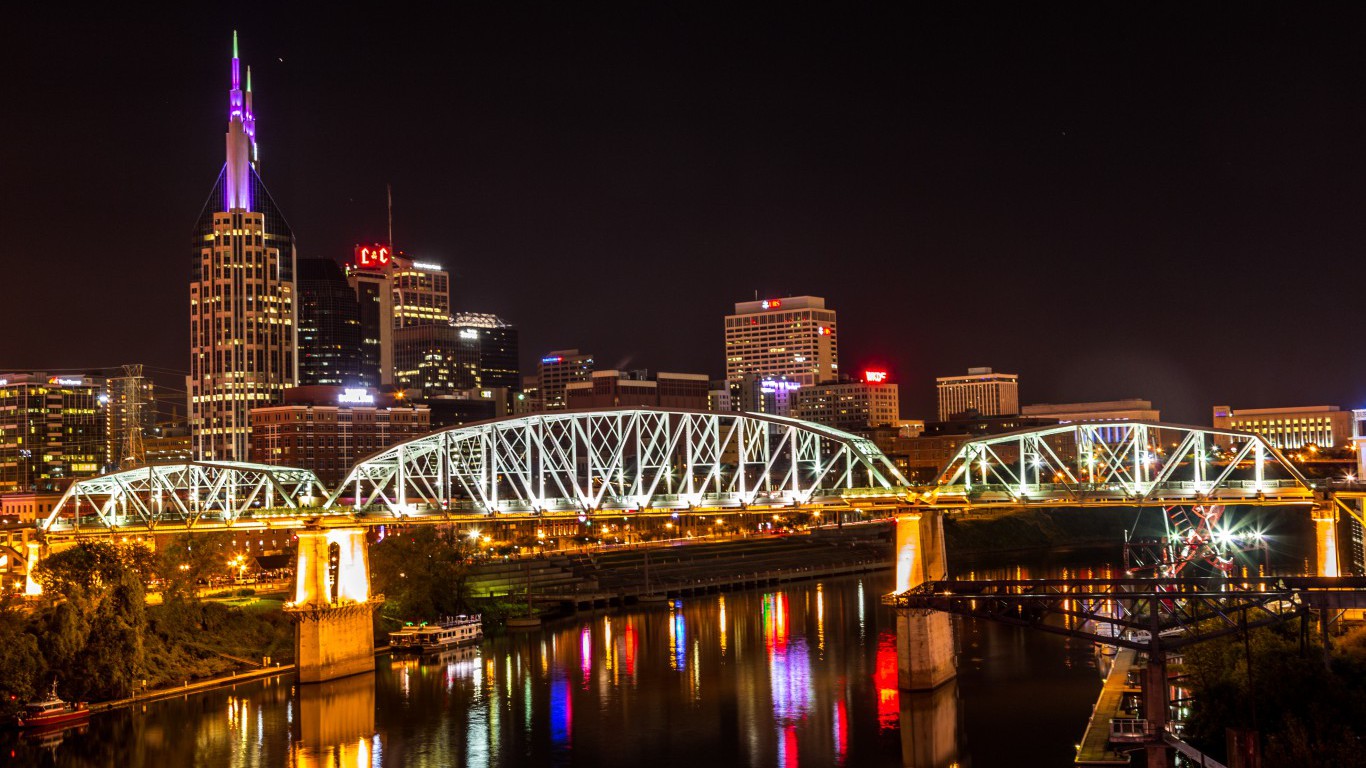
40. Tennessee
> Roads in poor condition: 3.3% (15th lowest)
> Deficient bridges: 4.7% (8th lowest)
> Dams at high hazard risk: 22.2% (24th highest)
> State highway spending per driver: $270 (5th lowest)
[in-text-ad]

39. Wyoming
> Roads in poor condition: 2.4% (9th lowest)
> Deficient bridges: 9.9% (18th highest)
> Dams at high hazard risk: 6.0% (8th lowest)
> State highway spending per driver: $1,241 (3rd highest)

38. Utah
> Roads in poor condition: 4.2% (21st lowest)
> Deficient bridges: 2.9% (5th lowest)
> Dams at high hazard risk: 29.1% (12th highest)
> State highway spending per driver: $399 (14th lowest)
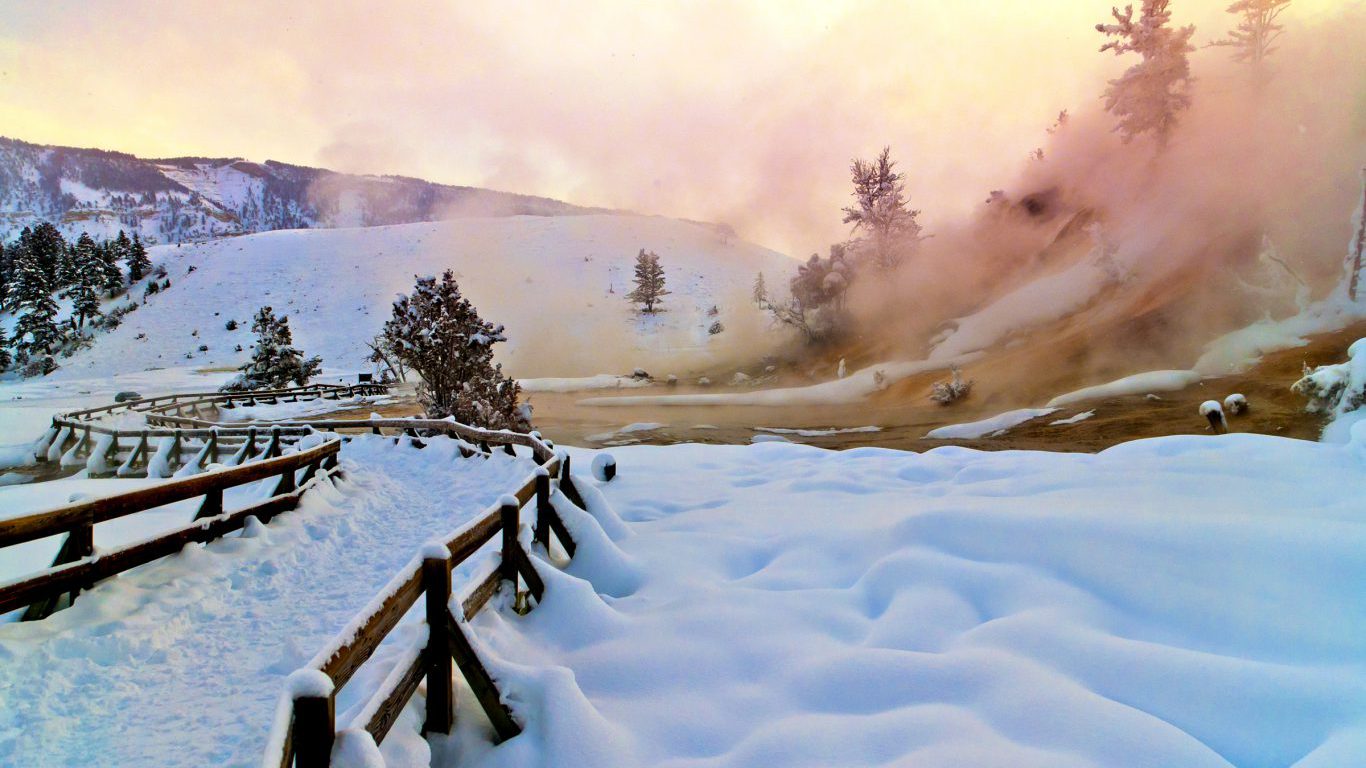
37. Montana
> Roads in poor condition: 3.2% (12th lowest)
> Deficient bridges: 9.7% (20th highest)
> Dams at high hazard risk: 6.6% (10th lowest)
> State highway spending per driver: $934 (4th highest)
[in-text-ad-2]
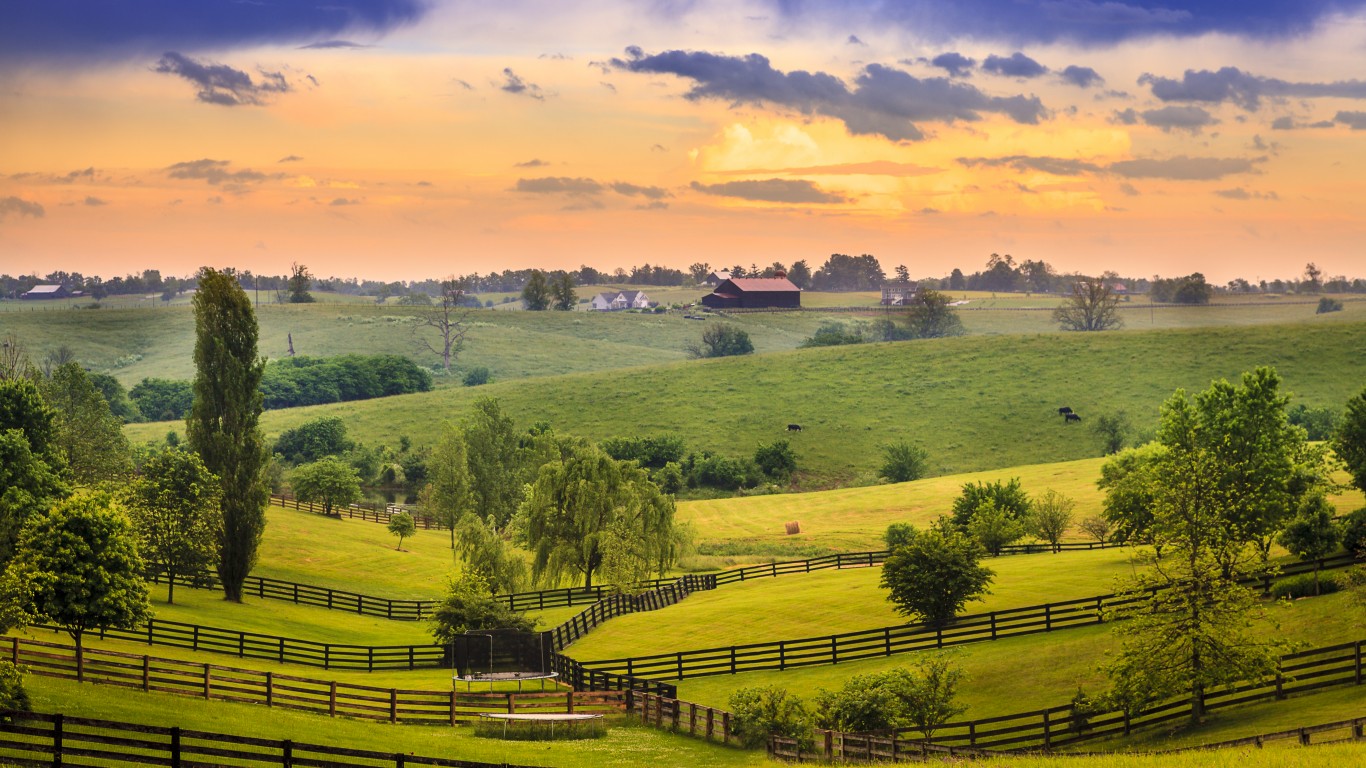
36. Kentucky
> Roads in poor condition: 1.7% (3rd lowest)
> Deficient bridges: 7.8% (23rd lowest)
> Dams at high hazard risk: 24.8% (19th highest)
> State highway spending per driver: $825 (8th highest)
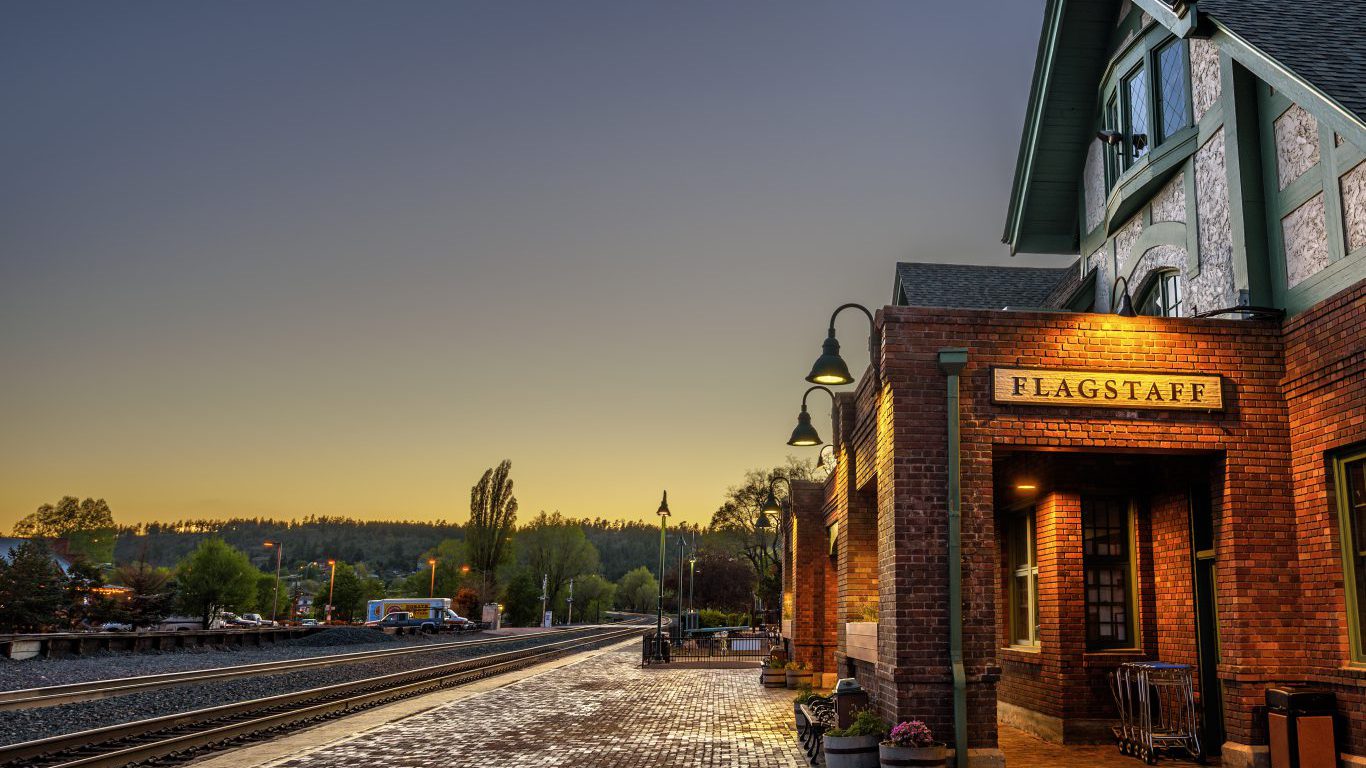
35. Arizona
> Roads in poor condition: 2.8% (10th lowest)
> Deficient bridges: 2.5% (4th lowest)
> Dams at high hazard risk: 44.5% (8th highest)
> State highway spending per driver: $239 (2nd lowest)
[in-text-ad]
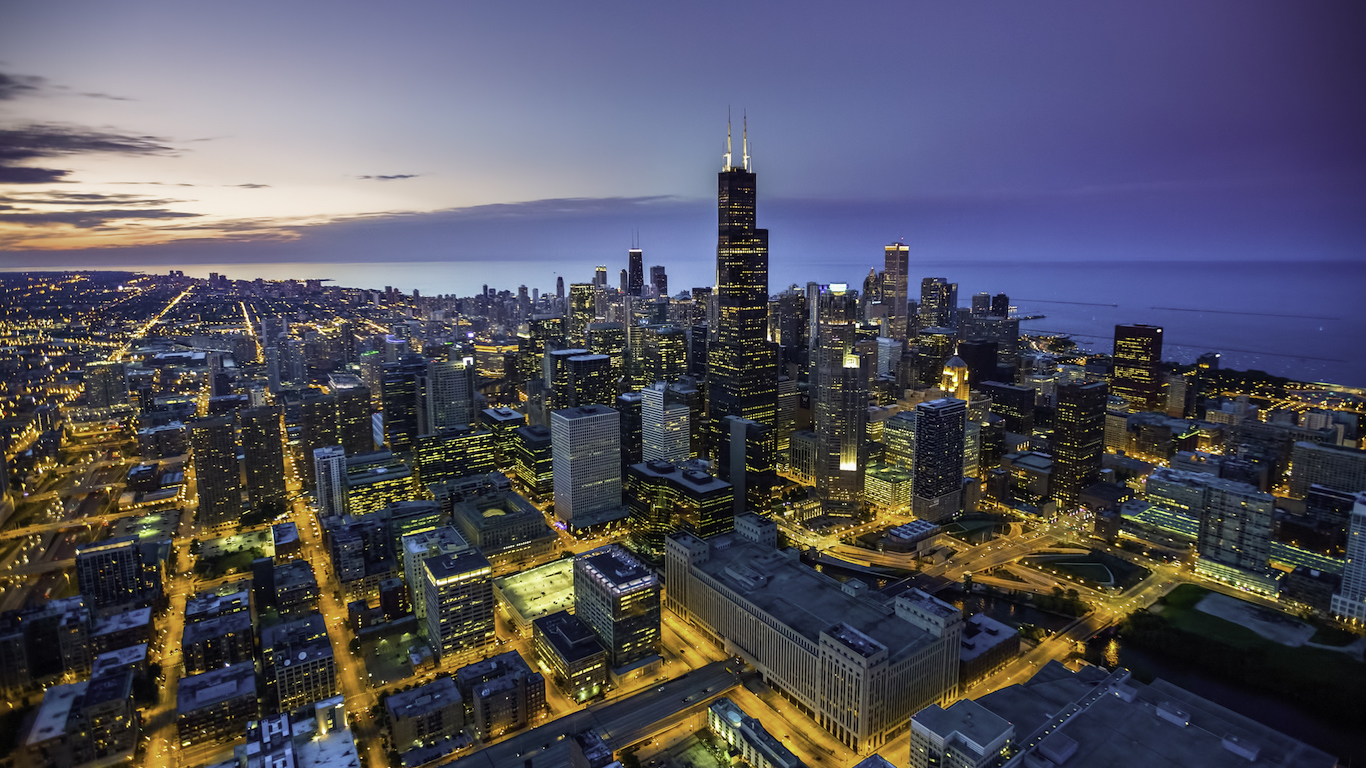
34. Illinois
> Roads in poor condition: 5.0% (25th highest)
> Deficient bridges: 8.6% (25th highest)
> Dams at high hazard risk: 14.4% (17th lowest)
> State highway spending per driver: $723 (10th highest)
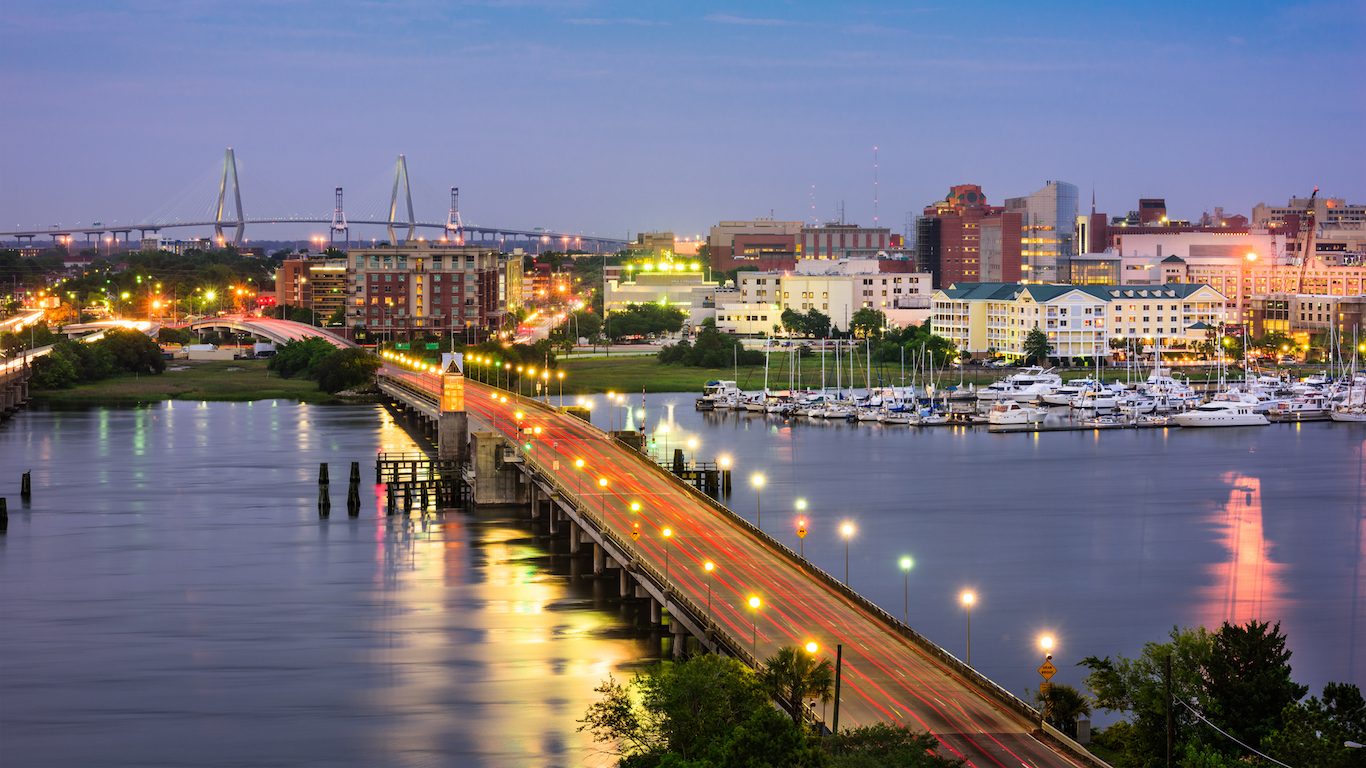
33. South Carolina
> Roads in poor condition: 5.7% (22nd highest)
> Deficient bridges: 9.9% (19th highest)
> Dams at high hazard risk: 8.6% (11th lowest)
> State highway spending per driver: $313 (8th lowest)
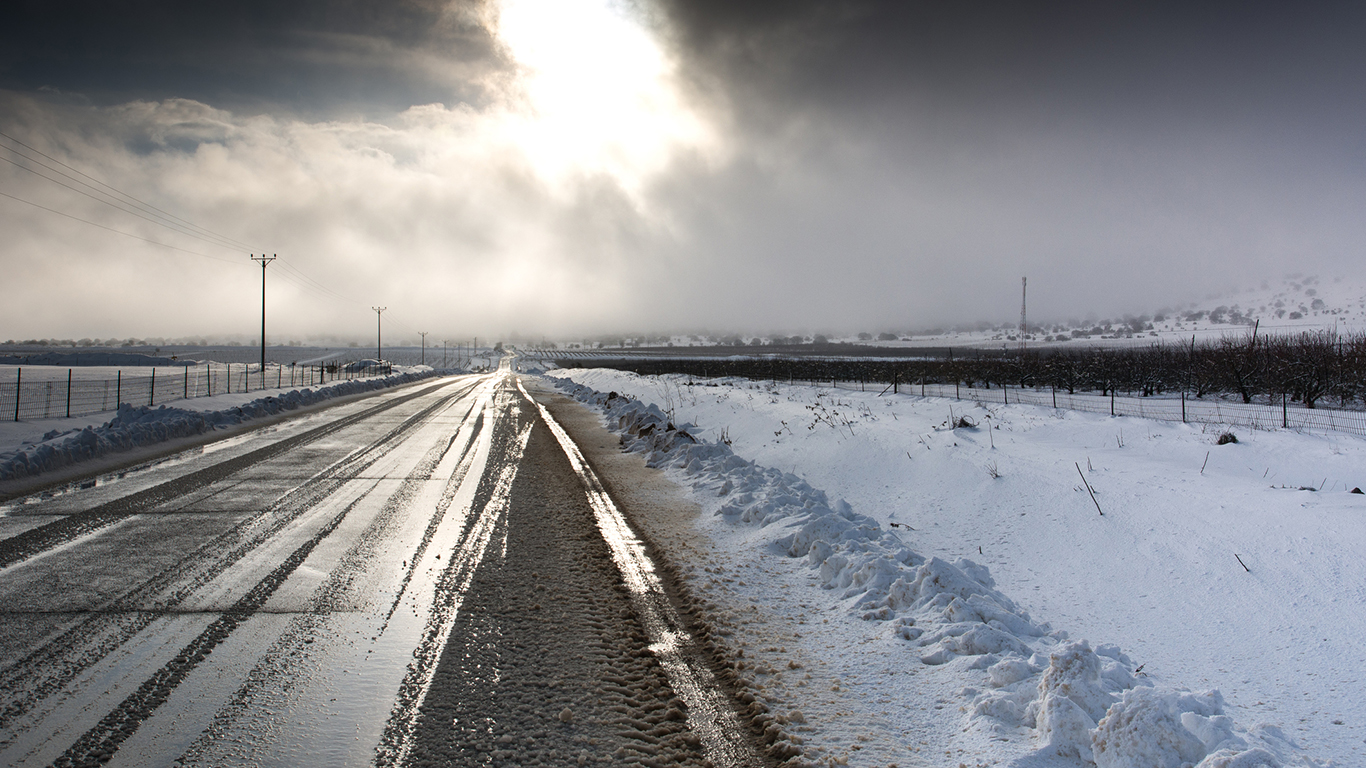
32. North Dakota
> Roads in poor condition: 2.2% (7th lowest)
> Deficient bridges: 14.0% (8th highest)
> Dams at high hazard risk: 5.5% (6th lowest)
> State highway spending per driver: $1,743 (2nd highest)
[in-text-ad-2]
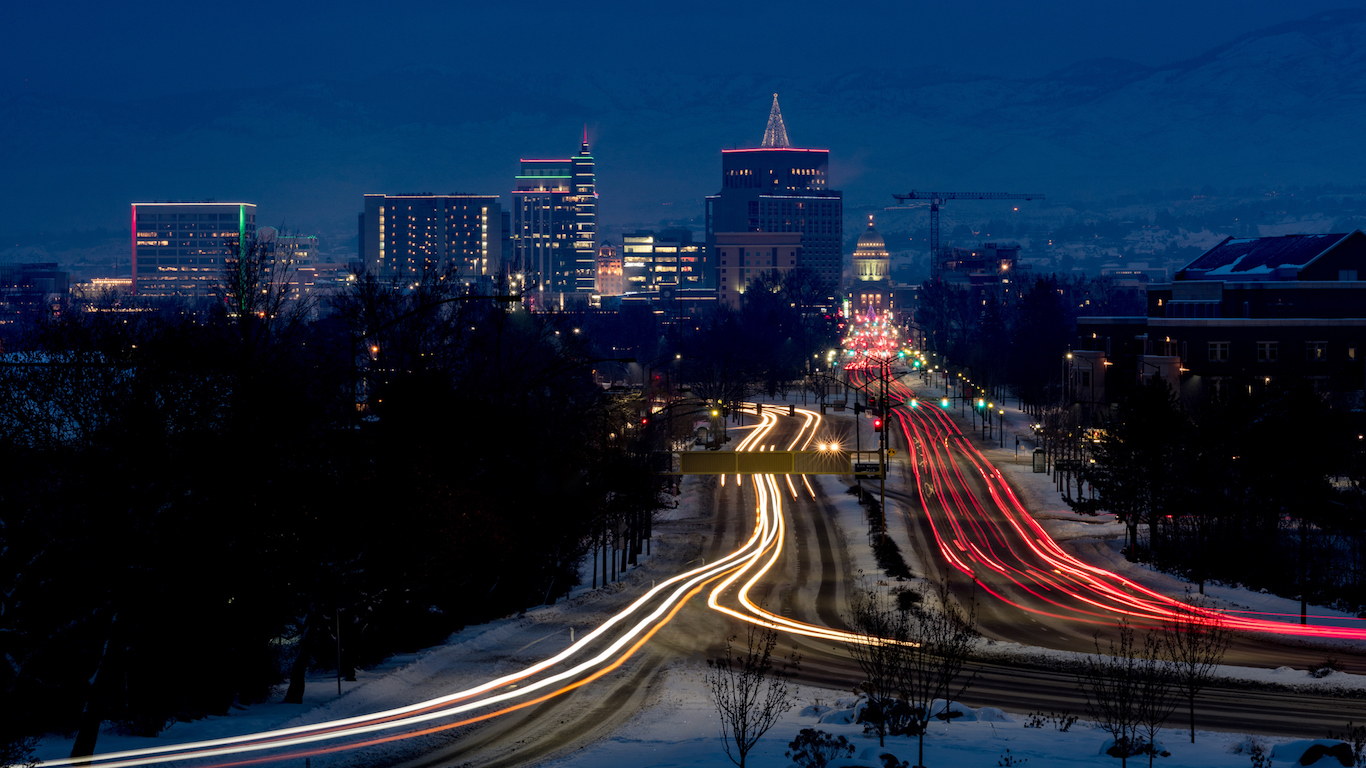
31. Idaho
> Roads in poor condition: 3.3% (14th lowest)
> Deficient bridges: 8.7% (23rd highest)
> Dams at high hazard risk: 24.1% (21st highest)
> State highway spending per driver: $500 (24th highest)

30. Colorado
> Roads in poor condition: 6.8% (18th highest)
> Deficient bridges: 5.6% (13th lowest)
> Dams at high hazard risk: 24.5% (20th highest)
> State highway spending per driver: $305 (7th lowest)
[in-text-ad]
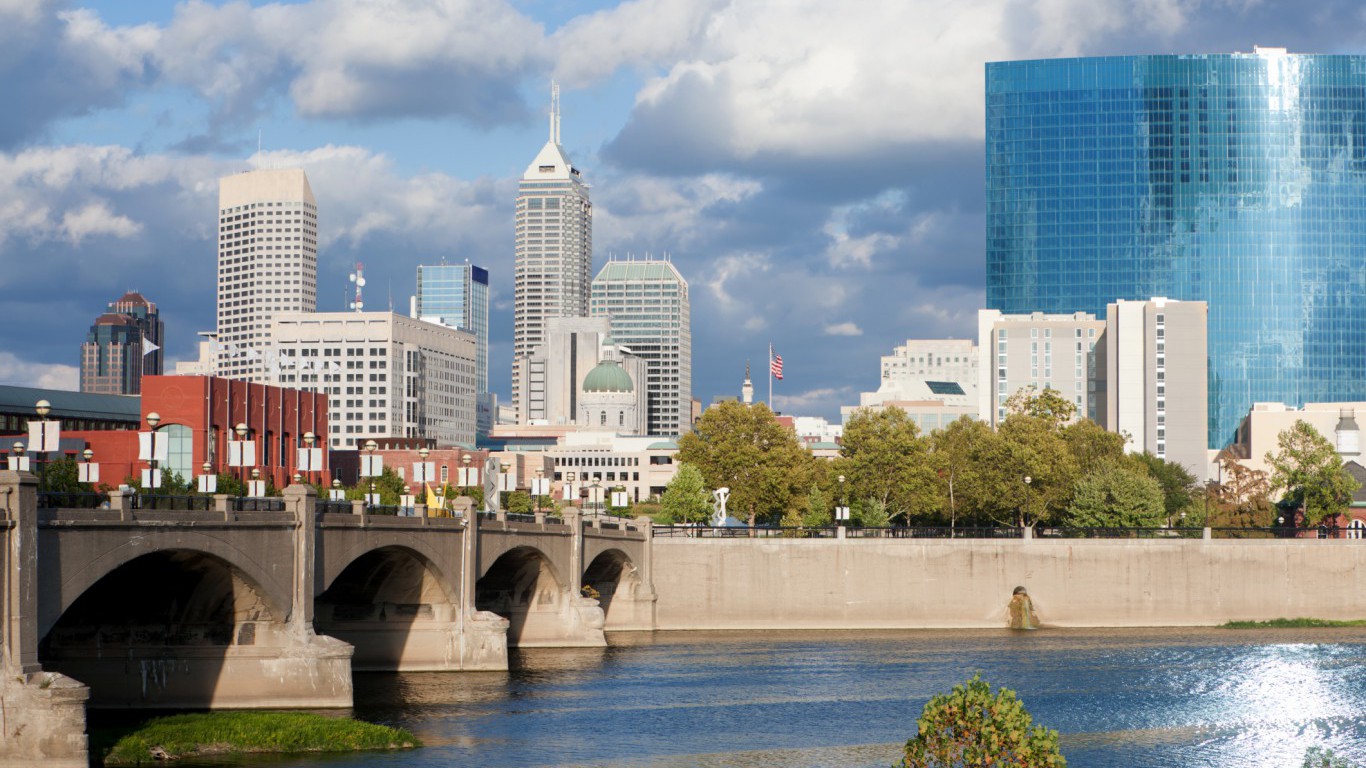
29. Indiana
> Roads in poor condition: 4.5% (23rd lowest)
> Deficient bridges: 7.4% (21st lowest)
> Dams at high hazard risk: 28.7% (13th highest)
> State highway spending per driver: $383 (12th lowest)

28. Maryland
> Roads in poor condition: 8.2% (13th highest)
> Deficient bridges: 5.6% (14th lowest)
> Dams at high hazard risk: 22.8% (23rd highest)
> State highway spending per driver: $548 (19th highest)
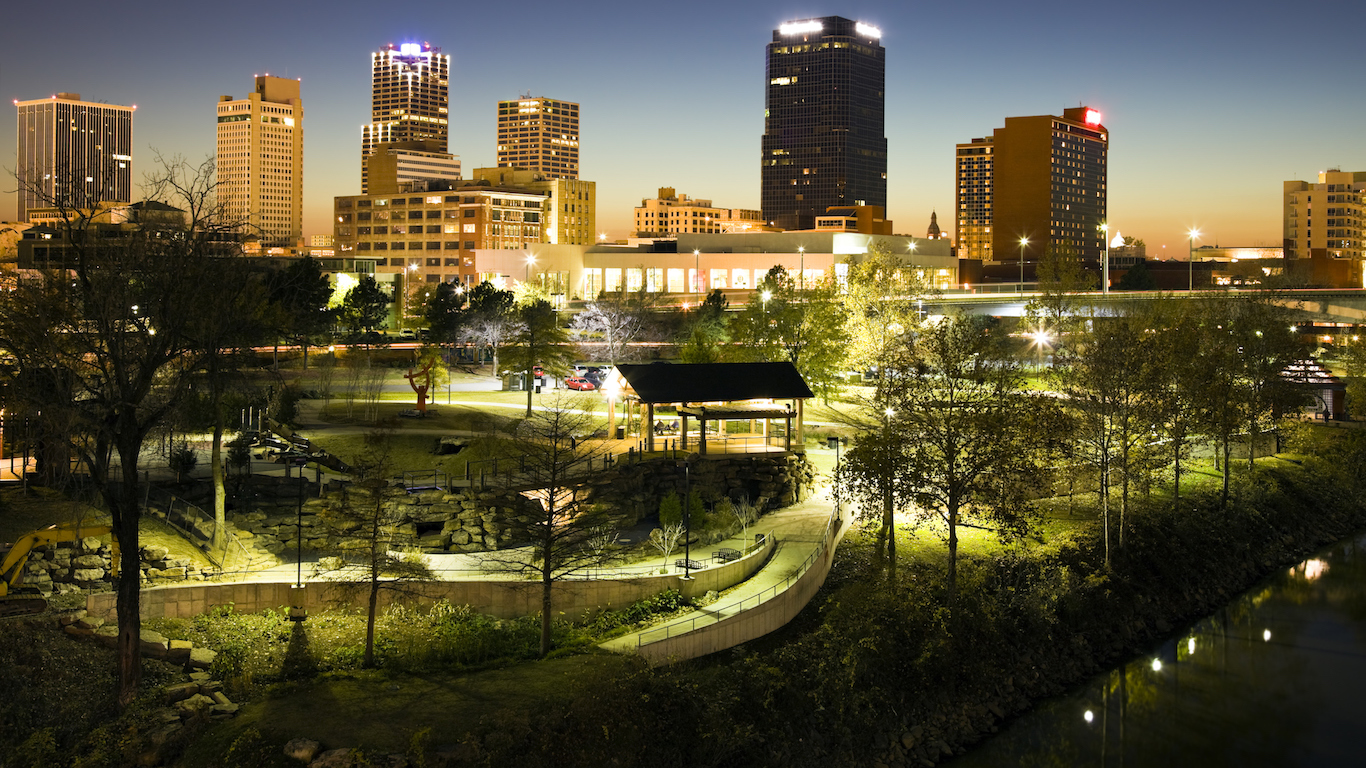
27. Arkansas
> Roads in poor condition: 10.2% (10th highest)
> Deficient bridges: 5.9% (17th lowest)
> Dams at high hazard risk: 15.2% (18th lowest)
> State highway spending per driver: $495 (25th lowest)
[in-text-ad-2]
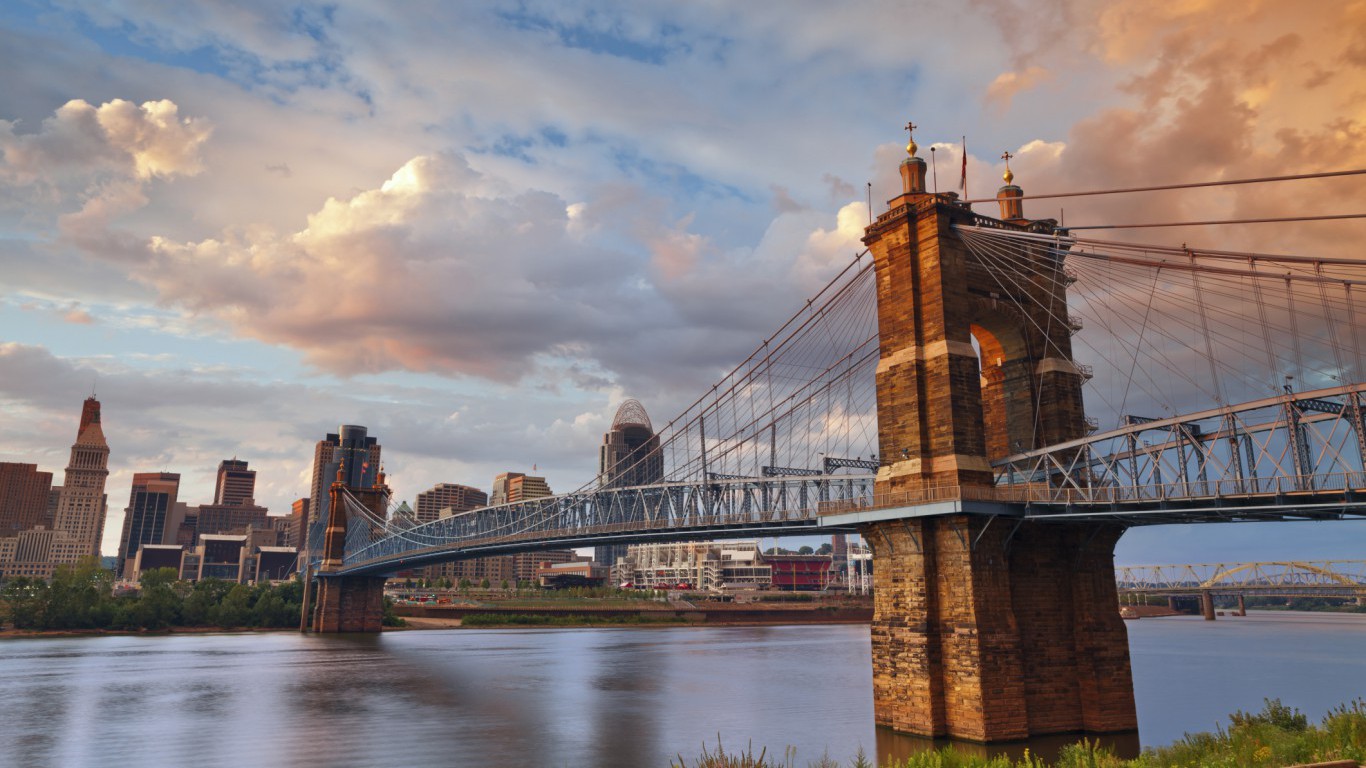
26. Ohio
> Roads in poor condition: 6.9% (17th highest)
> Deficient bridges: 6.0% (18th lowest)
> Dams at high hazard risk: 27.7% (15th highest)
> State highway spending per driver: $415 (17th lowest)
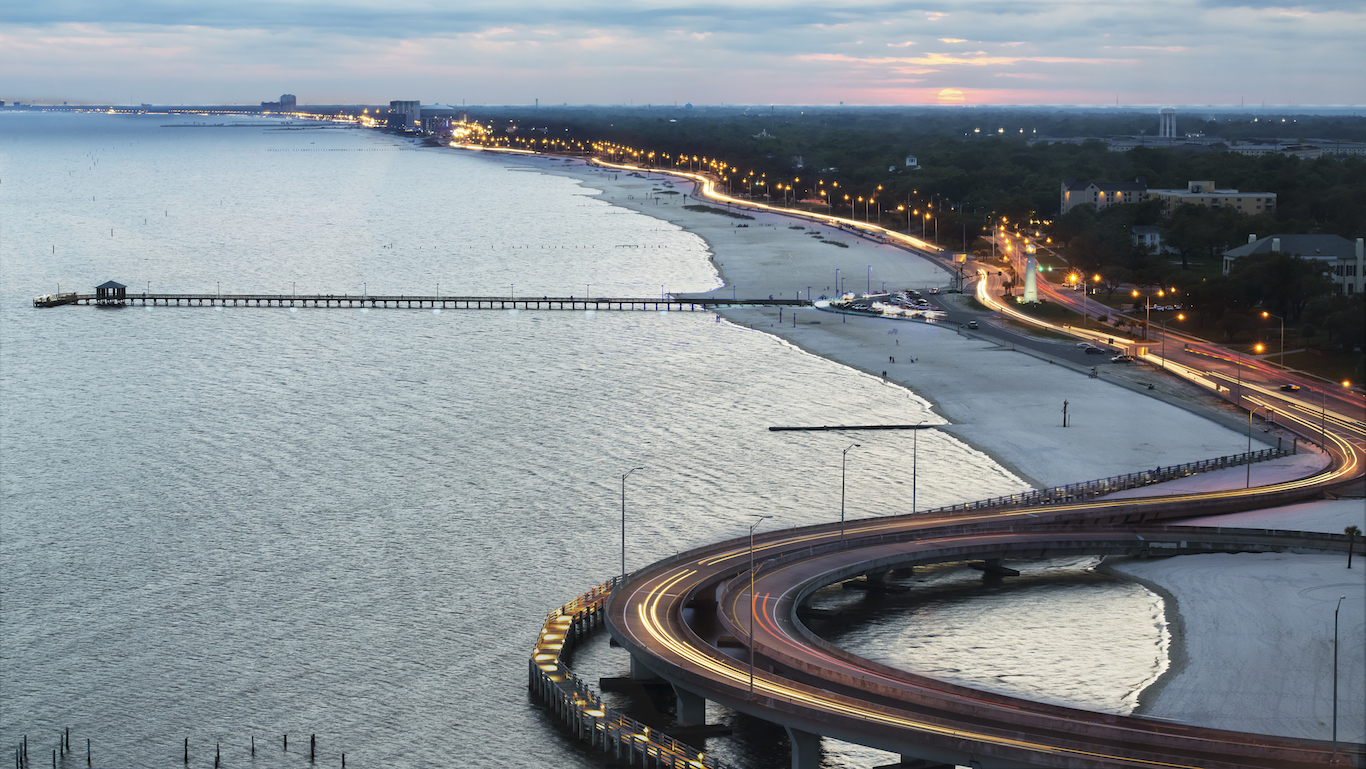
25. Mississippi
> Roads in poor condition: 6.7% (19th highest)
> Deficient bridges: 11.8% (12th highest)
> Dams at high hazard risk: 5.8% (7th lowest)
> State highway spending per driver: $468 (23rd lowest)
[in-text-ad]
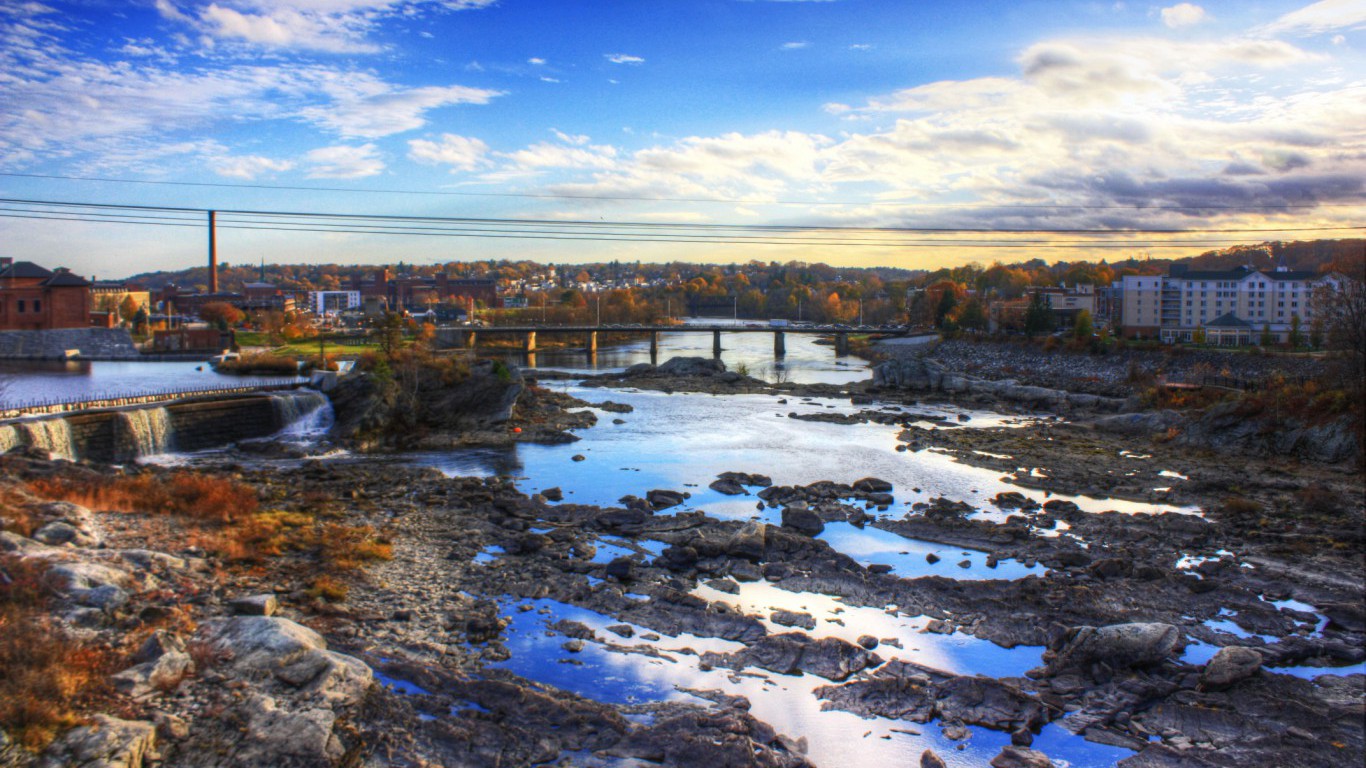
24. Maine
> Roads in poor condition: 4.4% (22nd lowest)
> Deficient bridges: 13.3% (10th highest)
> Dams at high hazard risk: 11.6% (16th lowest)
> State highway spending per driver: $610 (15th highest)
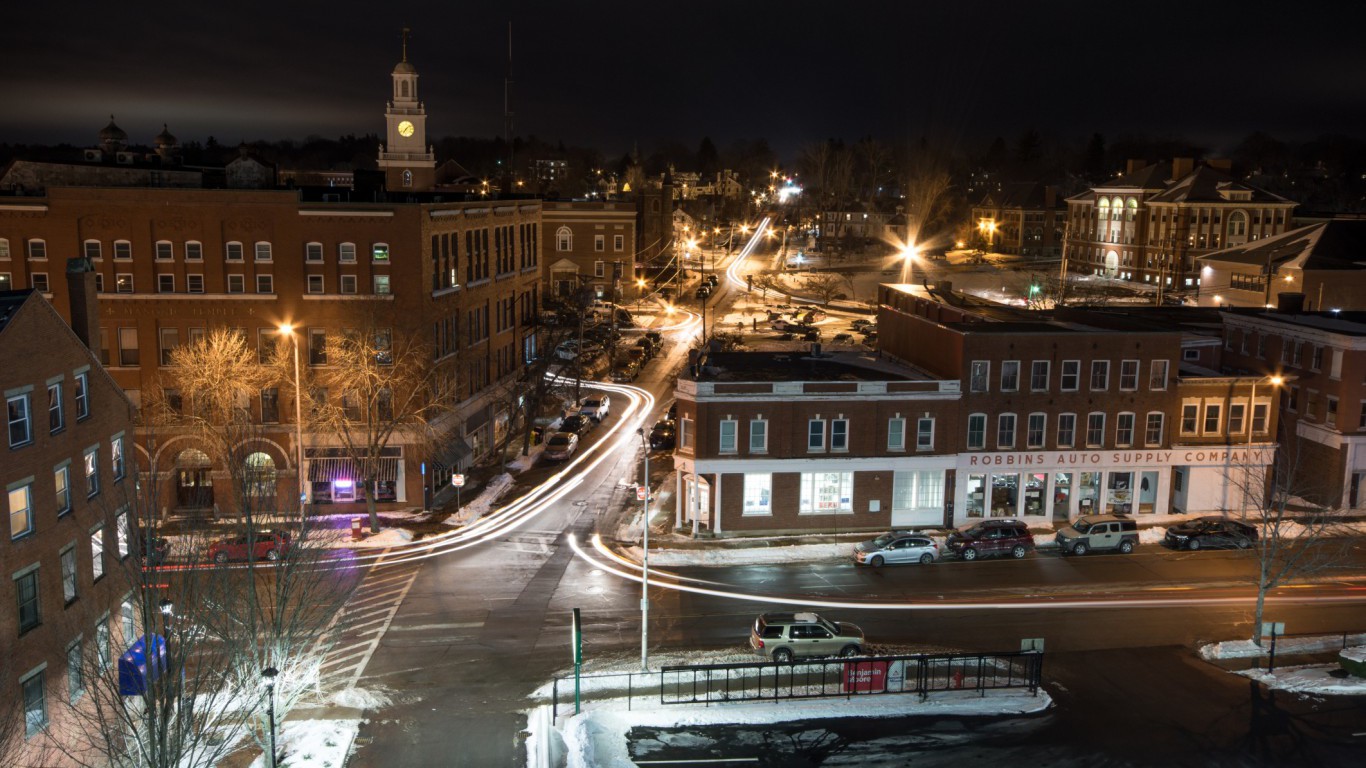
23. New Hampshire
> Roads in poor condition: 5.0% (24th highest)
> Deficient bridges: 10.9% (13th highest)
> Dams at high hazard risk: 21.2% (25th lowest)
> State highway spending per driver: $422 (18th lowest)
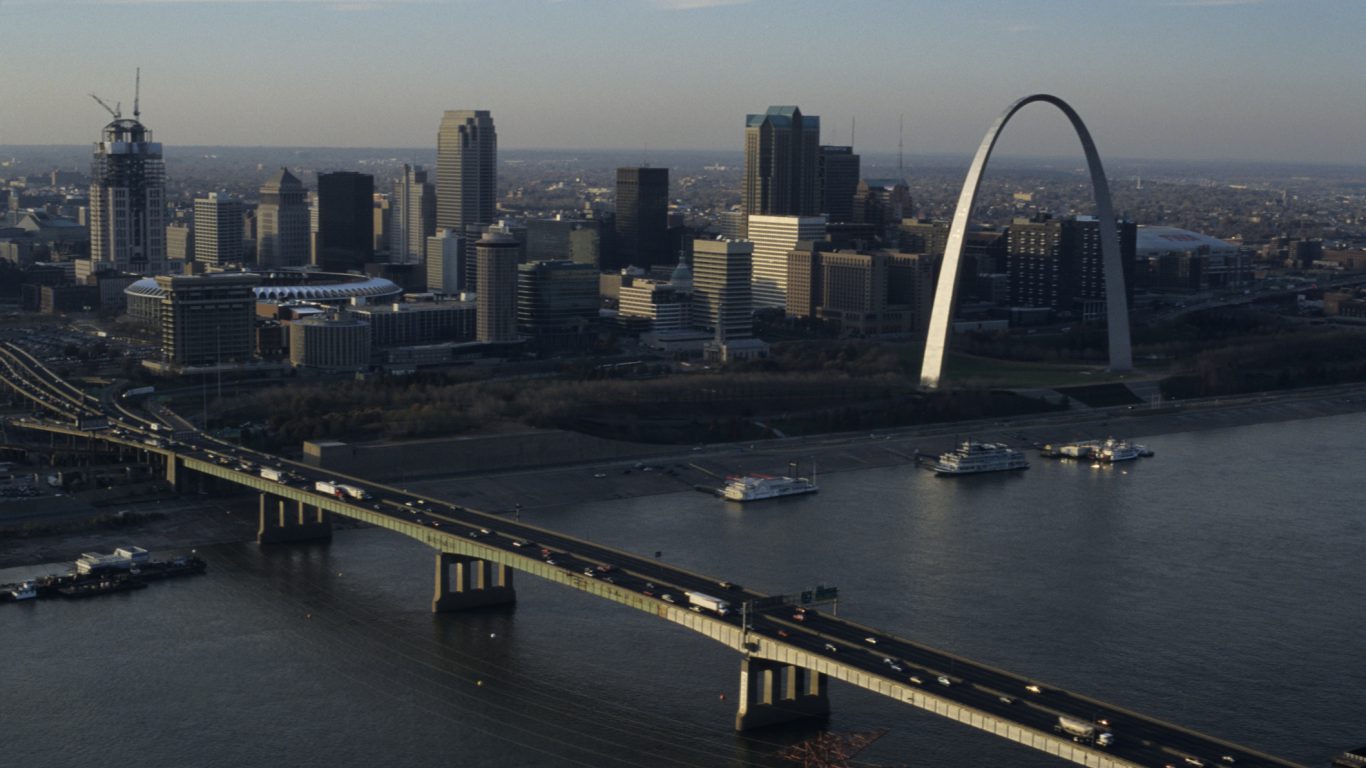
22. Missouri
> Roads in poor condition: 2.2% (6th lowest)
> Deficient bridges: 12.6% (11th highest)
> Dams at high hazard risk: 27.2% (17th highest)
> State highway spending per driver: $314 (9th lowest)
[in-text-ad-2]
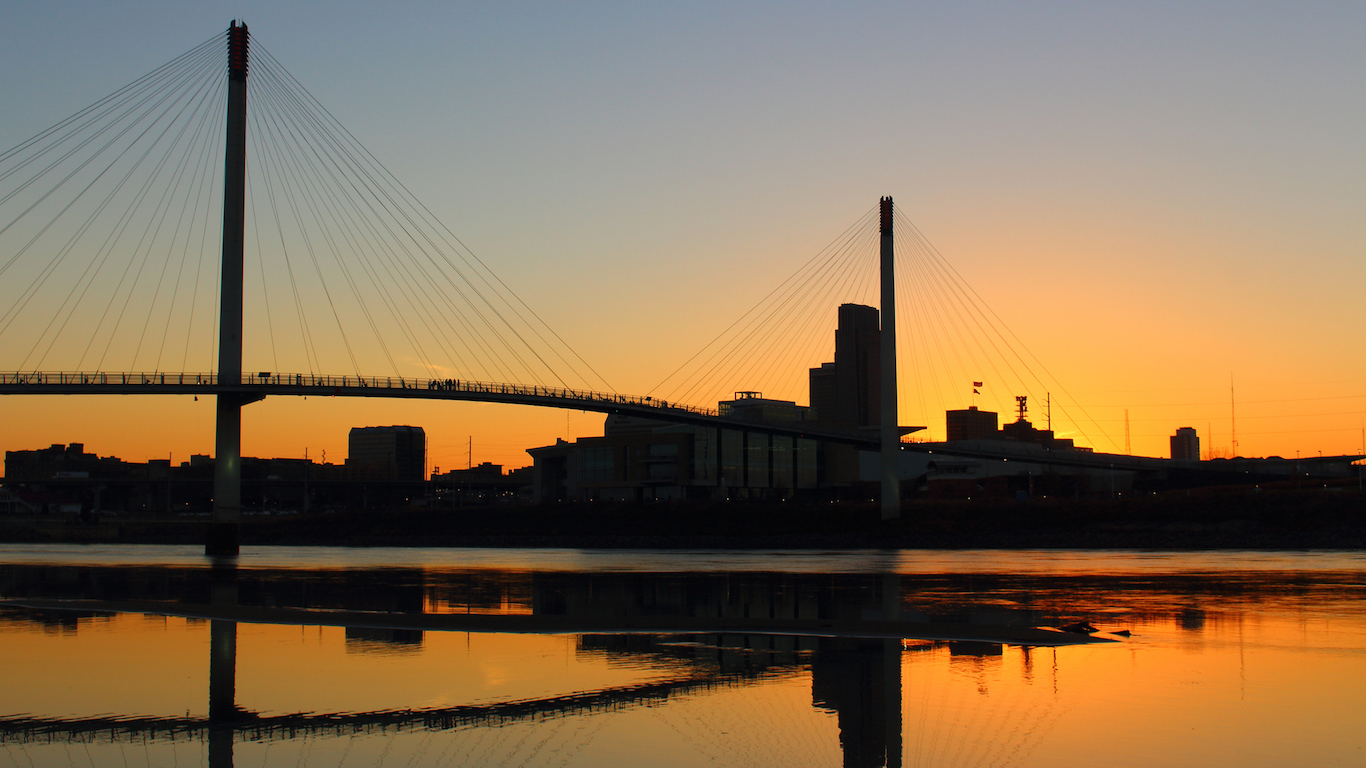
21. Nebraska
> Roads in poor condition: 5.7% (21st highest)
> Deficient bridges: 14.7% (6th highest)
> Dams at high hazard risk: 4.8% (4th lowest)
> State highway spending per driver: $561 (17th highest)
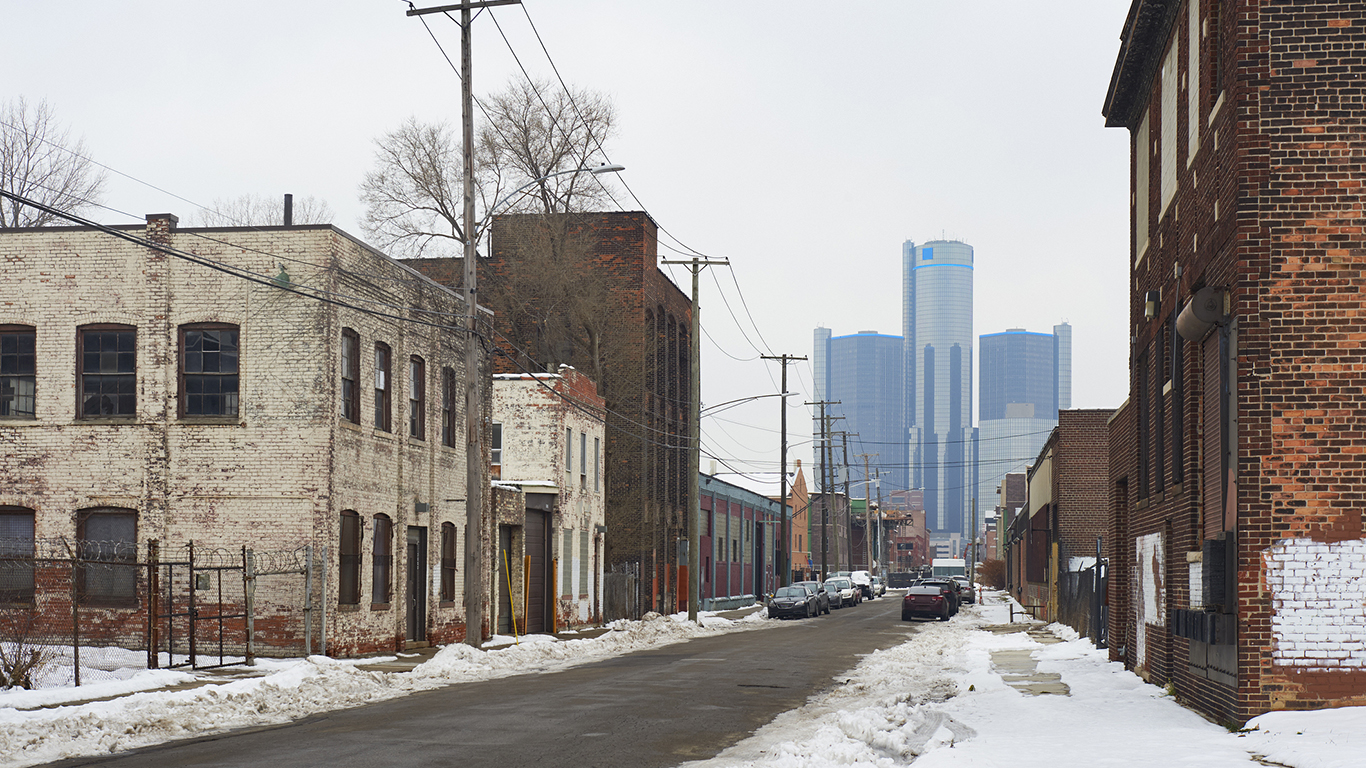
20. Michigan
> Roads in poor condition: 7.6% (14th highest)
> Deficient bridges: 10.5% (16th highest)
> Dams at high hazard risk: 16.9% (22nd lowest)
> State highway spending per driver: $172 (the lowest)
[in-text-ad]

19. Washington
> Roads in poor condition: 10.5% (9th highest)
> Deficient bridges: 4.8% (9th lowest)
> Dams at high hazard risk: 31.0% (11th highest)
> State highway spending per driver: $385 (13th lowest)
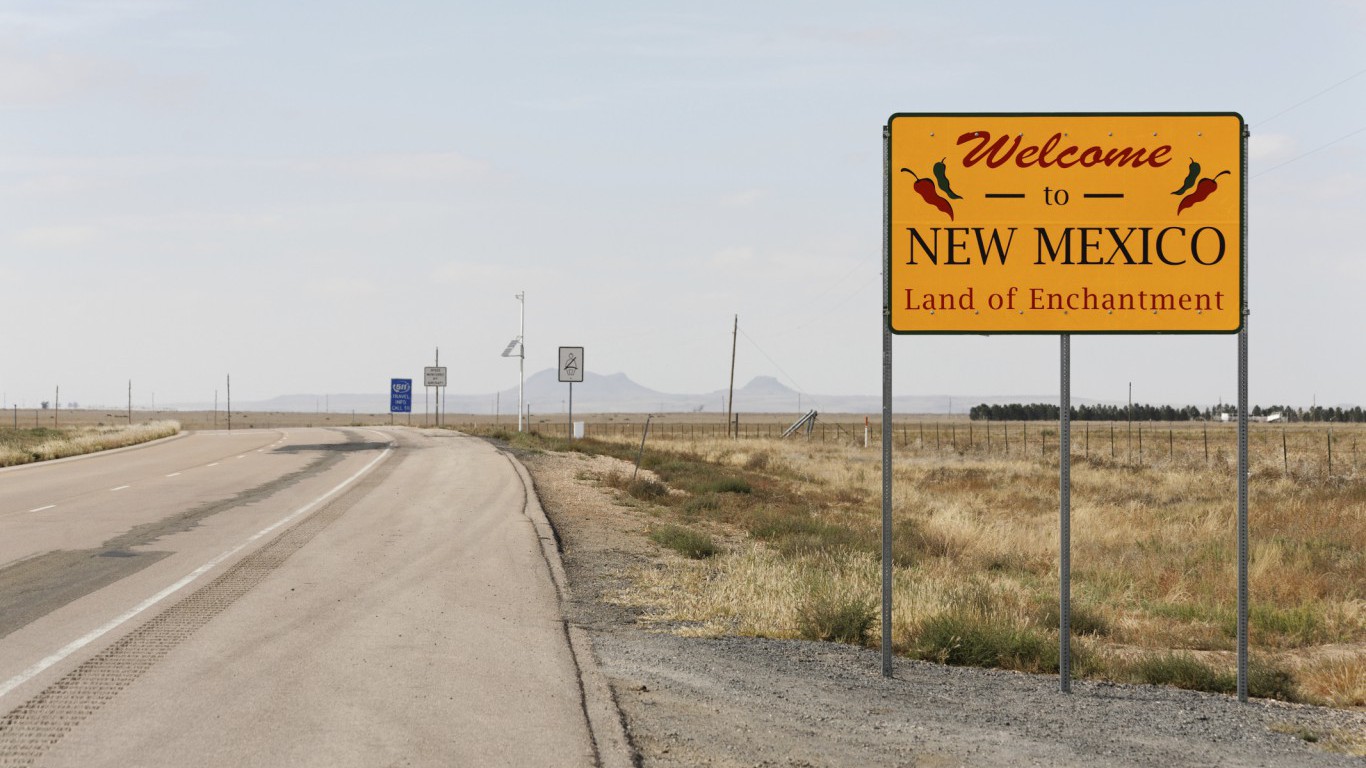
18. New Mexico
> Roads in poor condition: 3.7% (16th lowest)
> Deficient bridges: 6.3% (20th lowest)
> Dams at high hazard risk: 52.0% (7th highest)
> State highway spending per driver: $662 (14th highest)
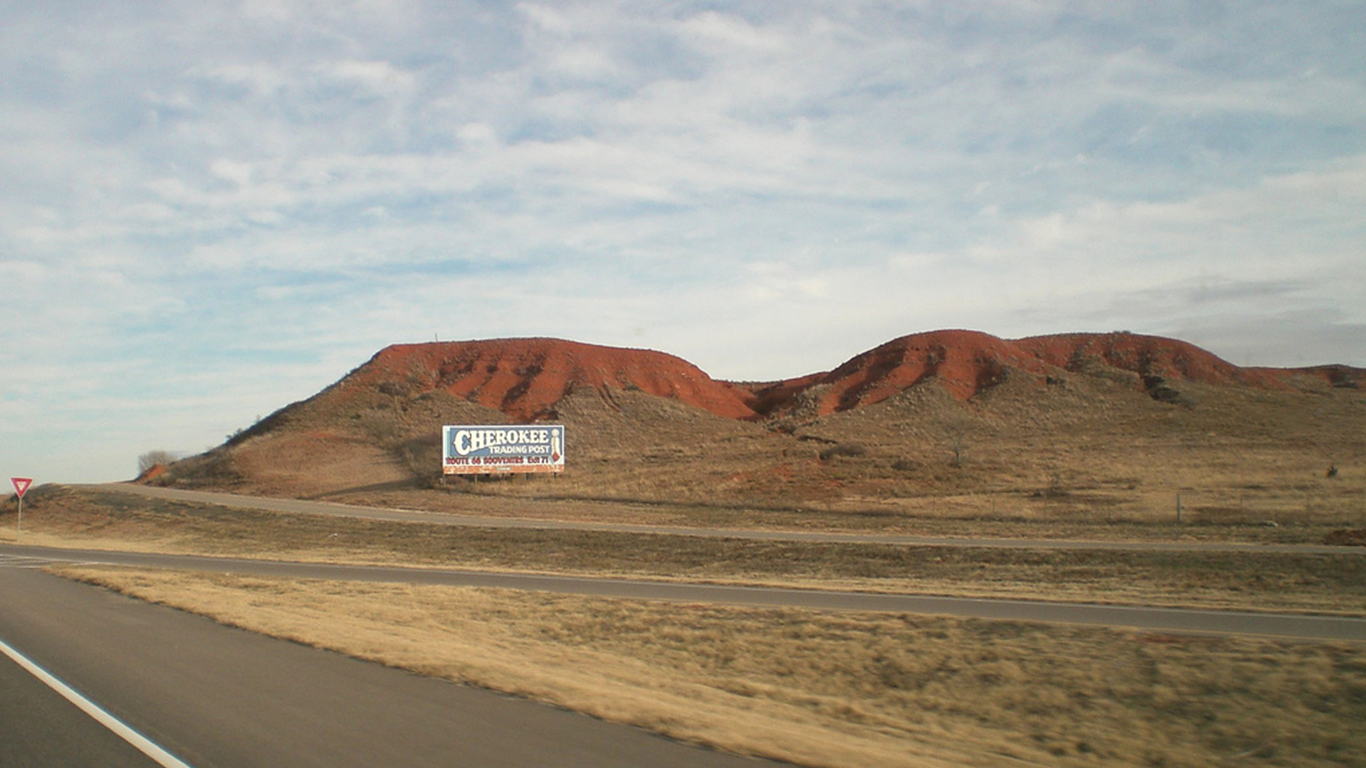
17. Oklahoma
> Roads in poor condition: 7.1% (16th highest)
> Deficient bridges: 14.0% (9th highest)
> Dams at high hazard risk: 8.8% (13th lowest)
> State highway spending per driver: $689 (11th highest)
[in-text-ad-2]
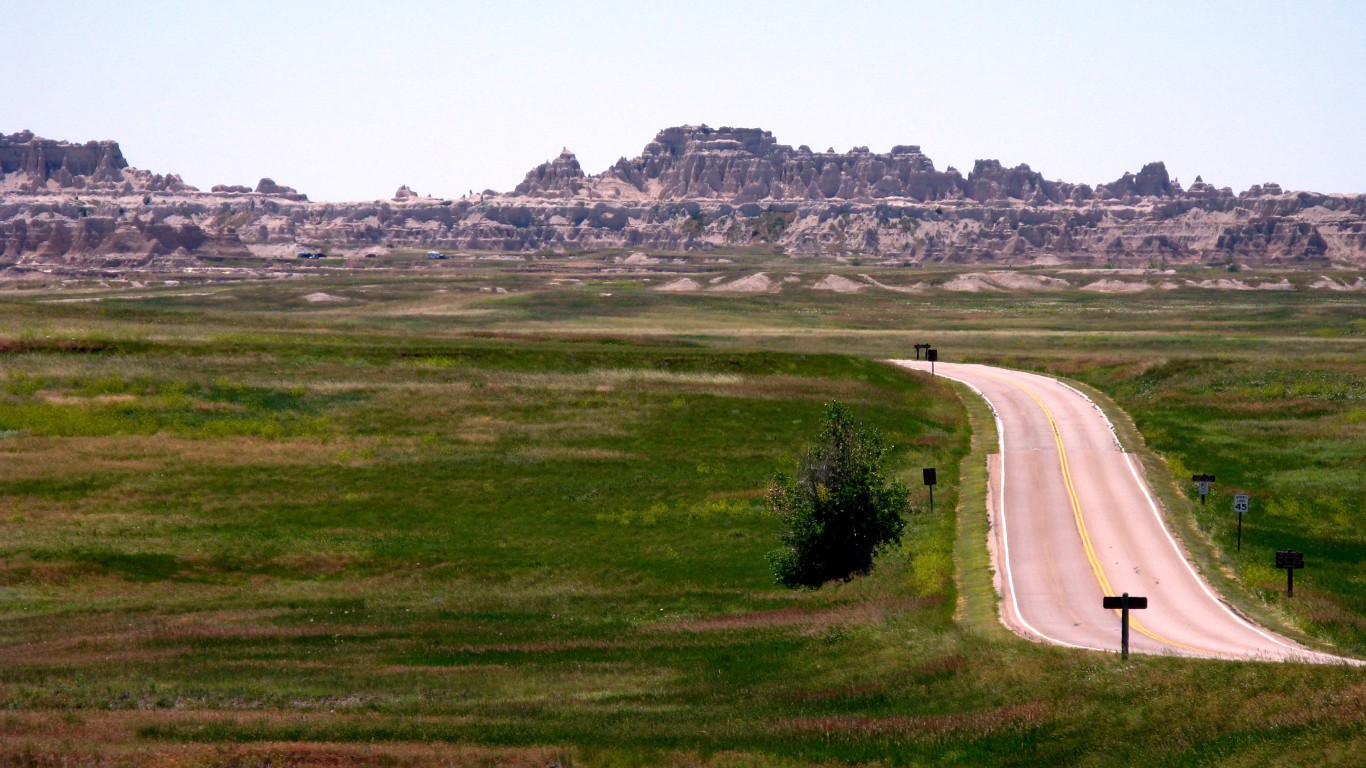
16. South Dakota
> Roads in poor condition: 4.8% (24th lowest)
> Deficient bridges: 18.6% (4th highest)
> Dams at high hazard risk: 1.2% (the lowest)
> State highway spending per driver: $878 (7th highest)
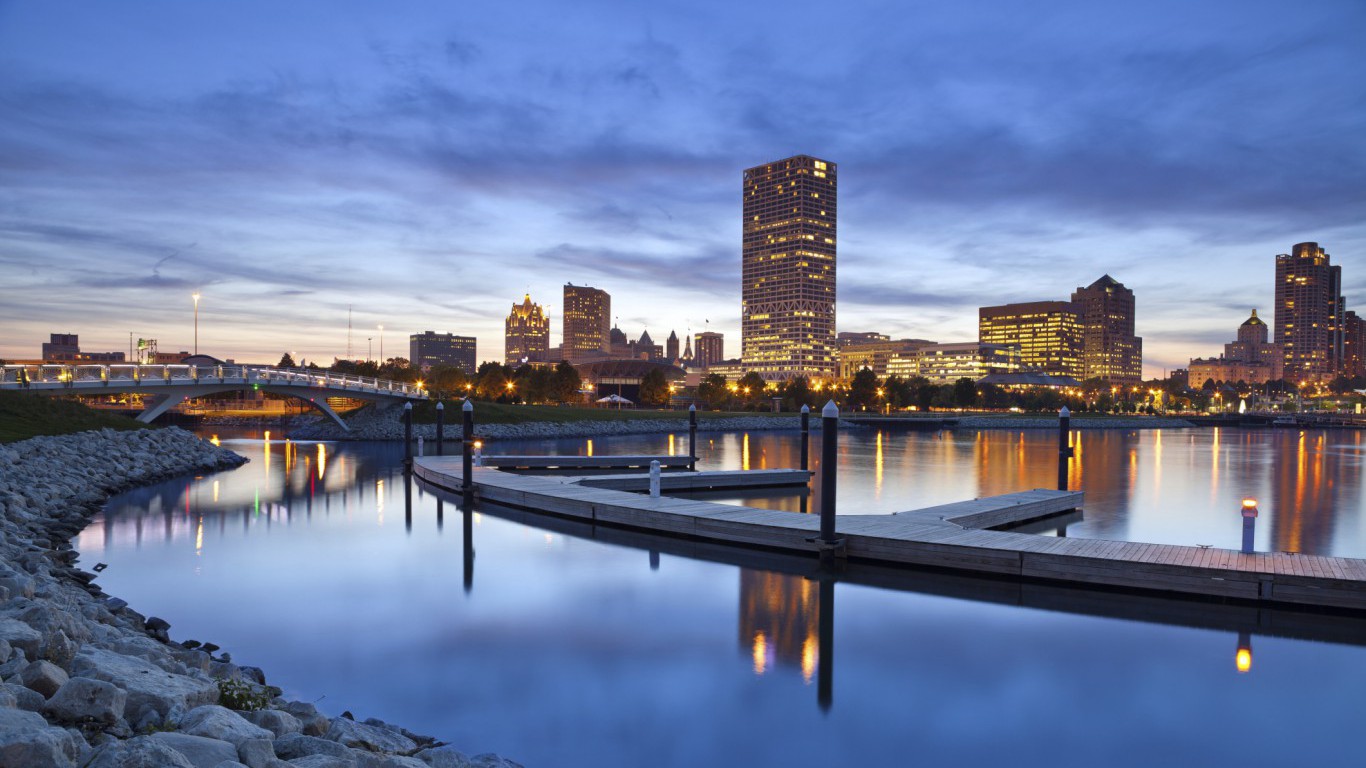
15. Wisconsin
> Roads in poor condition: 11.0% (8th highest)
> Deficient bridges: 8.7% (24th highest)
> Dams at high hazard risk: 20.3% (24th lowest)
> State highway spending per driver: $449 (20th lowest)
[in-text-ad]
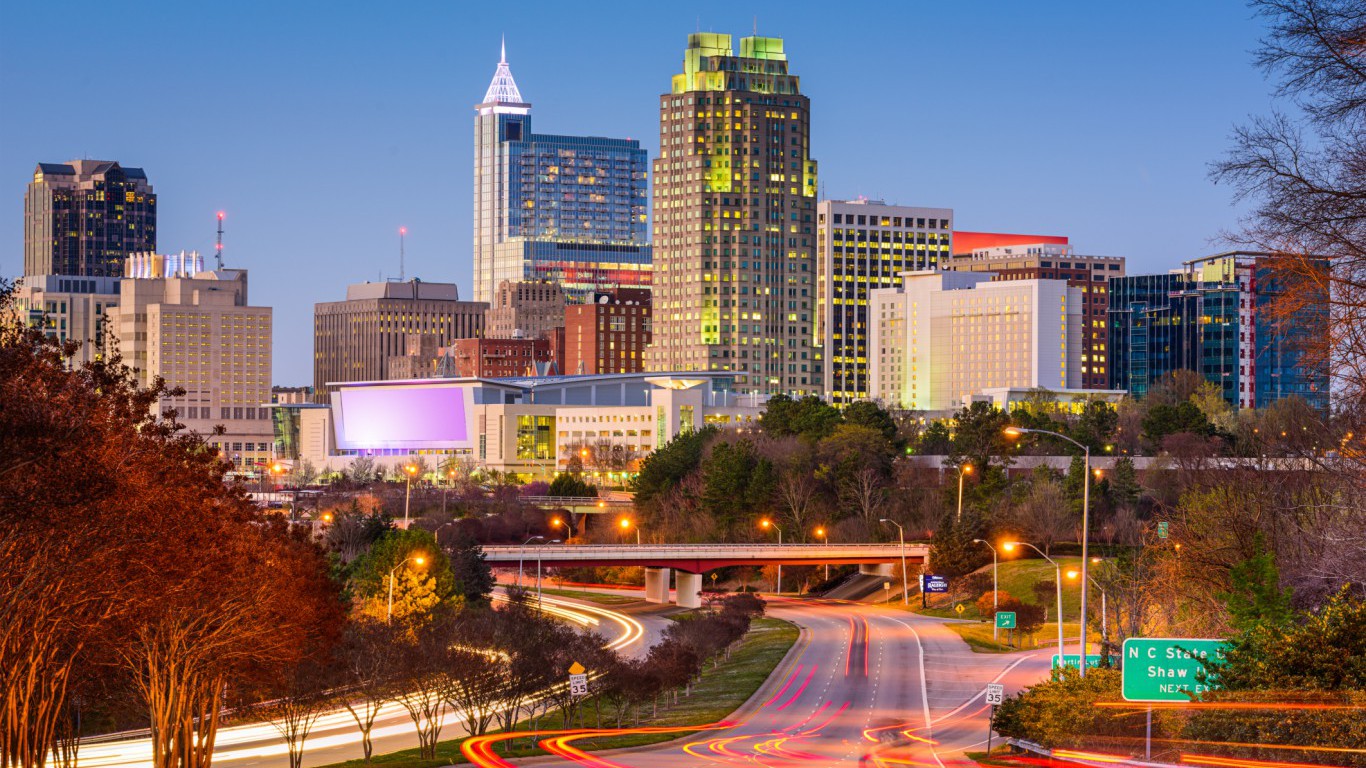
14. North Carolina
> Roads in poor condition: 3.9% (18th lowest)
> Deficient bridges: 10.2% (17th highest)
> Dams at high hazard risk: 42.0% (10th highest)
> State highway spending per driver: $480 (24th lowest)
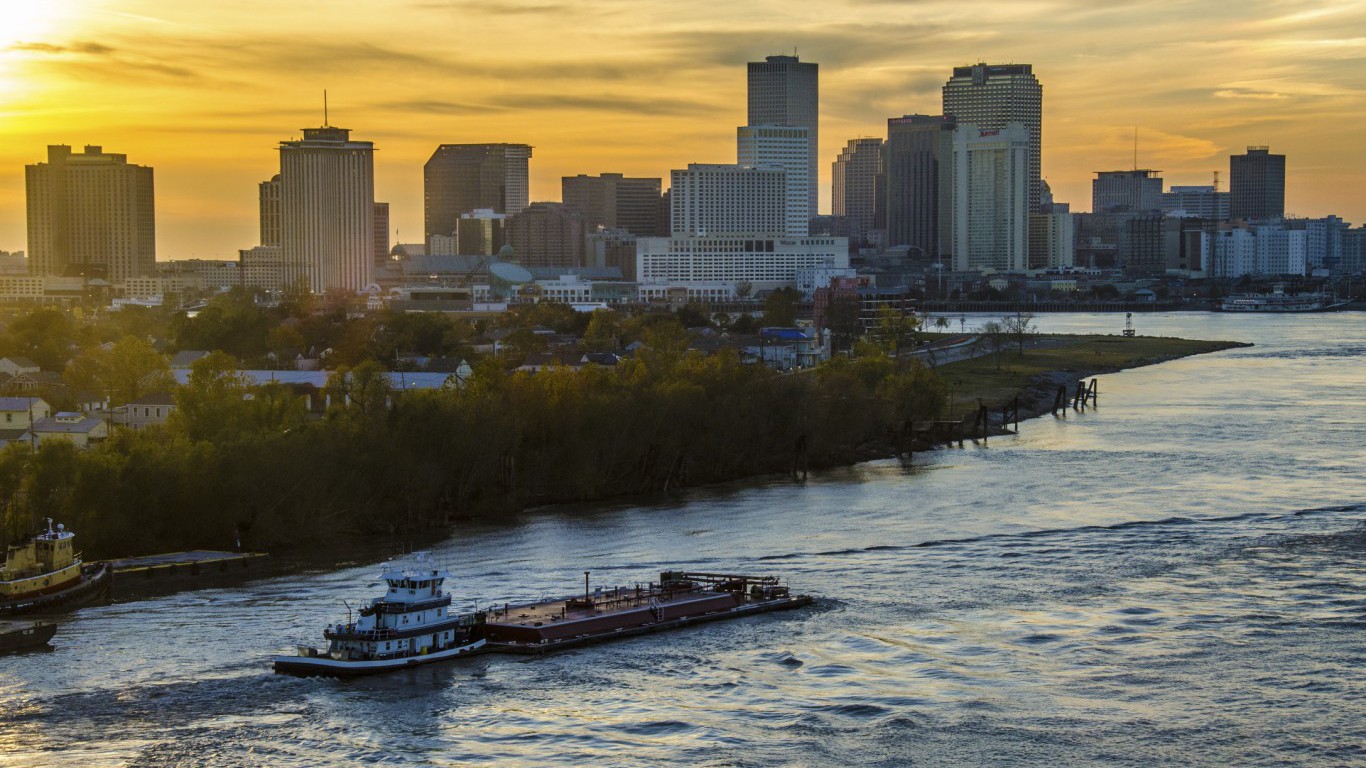
13. Louisiana
> Roads in poor condition: 8.6% (12th highest)
> Deficient bridges: 14.1% (7th highest)
> Dams at high hazard risk: 8.6% (12th lowest)
> State highway spending per driver: $450 (21st lowest)
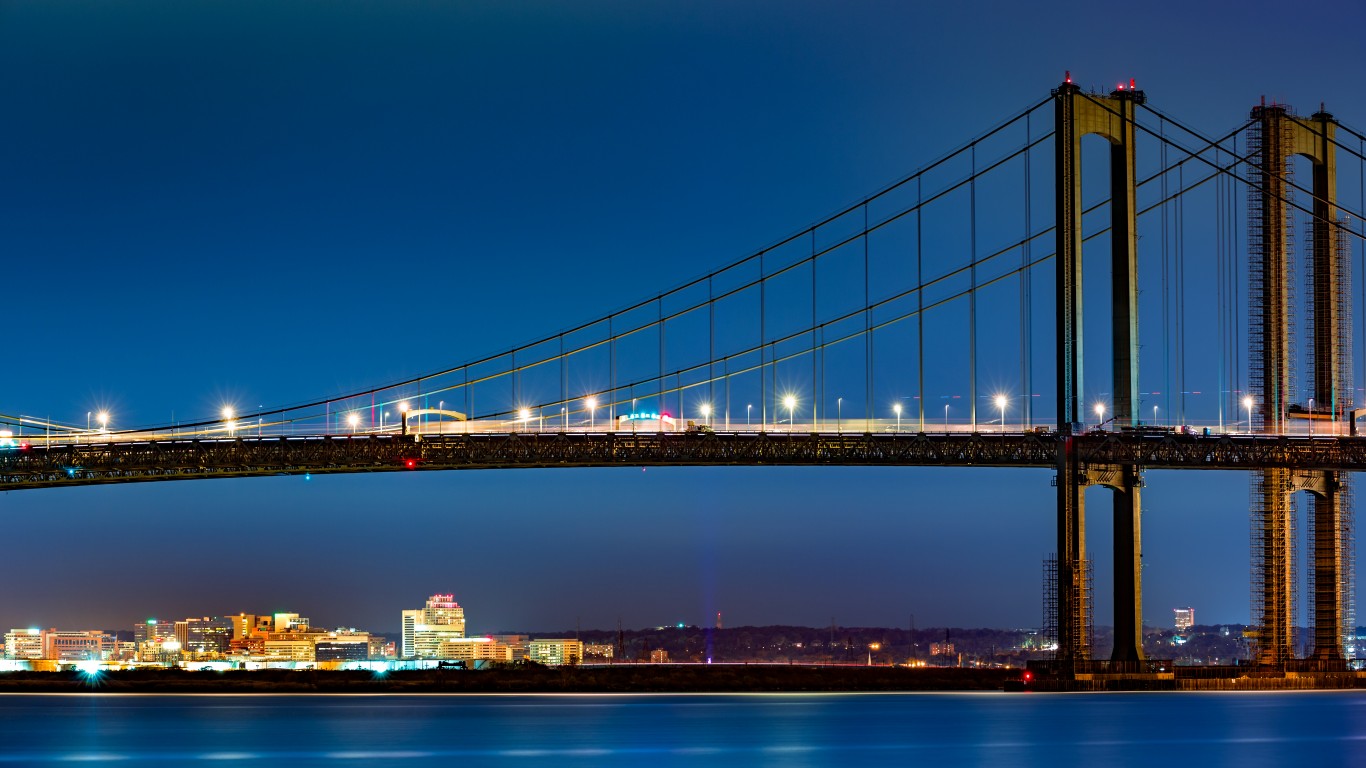
12. Delaware
> Roads in poor condition: 3.9% (17th lowest)
> Deficient bridges: 4.4% (6th lowest)
> Dams at high hazard risk: 75.9% (2nd highest)
> State highway spending per driver: $671 (13th highest)
[in-text-ad-2]

11. New York
> Roads in poor condition: 12.0% (7th highest)
> Deficient bridges: 10.5% (14th highest)
> Dams at high hazard risk: 21.6% (25th highest)
> State highway spending per driver: $366 (11th lowest)
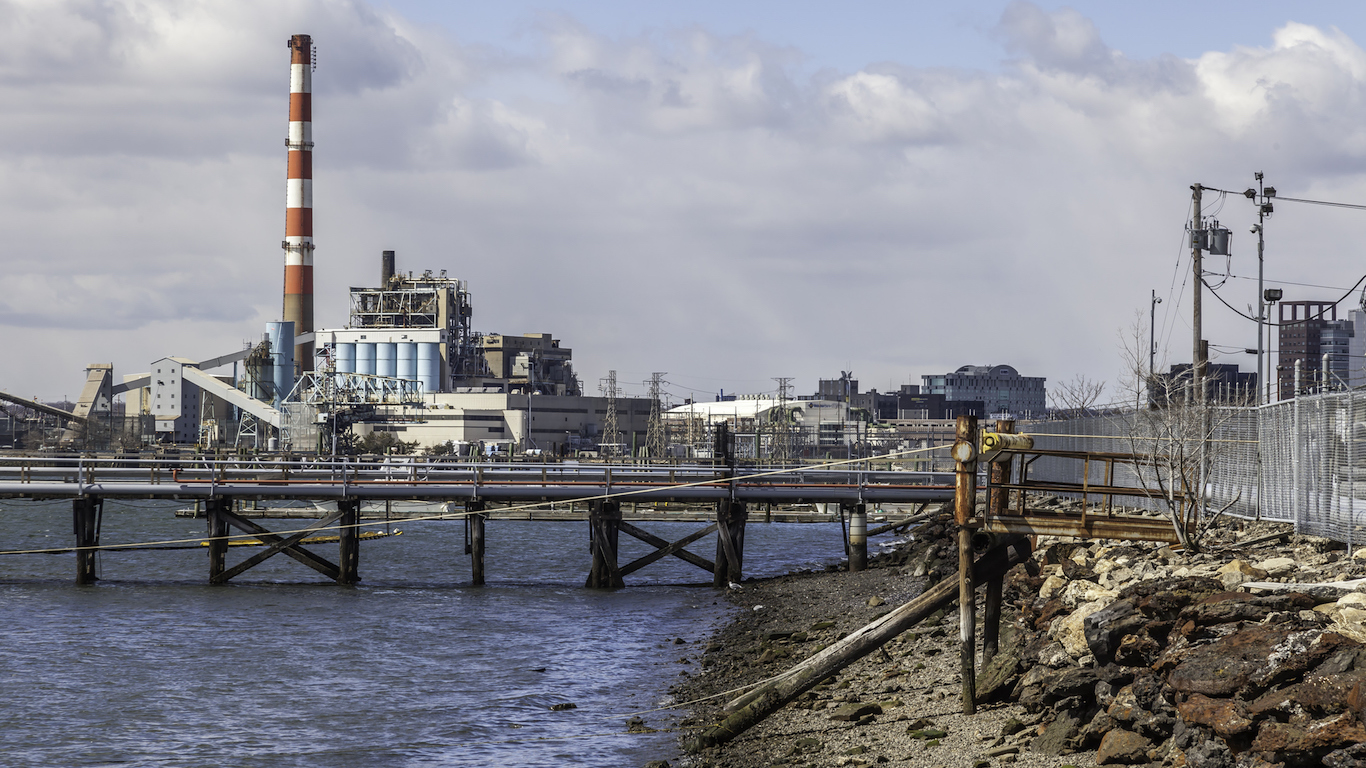
10. Connecticut
> Roads in poor condition: 5.6% (23rd highest)
> Deficient bridges: 7.8% (24th lowest)
> Dams at high hazard risk: 58.0% (4th highest)
> State highway spending per driver: $446 (19th lowest)
[in-text-ad]

9. Iowa
> Roads in poor condition: 8.9% (11th highest)
> Deficient bridges: 20.9% (2nd highest)
> Dams at high hazard risk: 2.6% (2nd lowest)
> State highway spending per driver: $684 (12th highest)

8. Massachusetts
> Roads in poor condition: 17.4% (3rd highest)
> Deficient bridges: 9.3% (21st highest)
> Dams at high hazard risk: 22.9% (22nd highest)
> State highway spending per driver: $495 (25th highest)
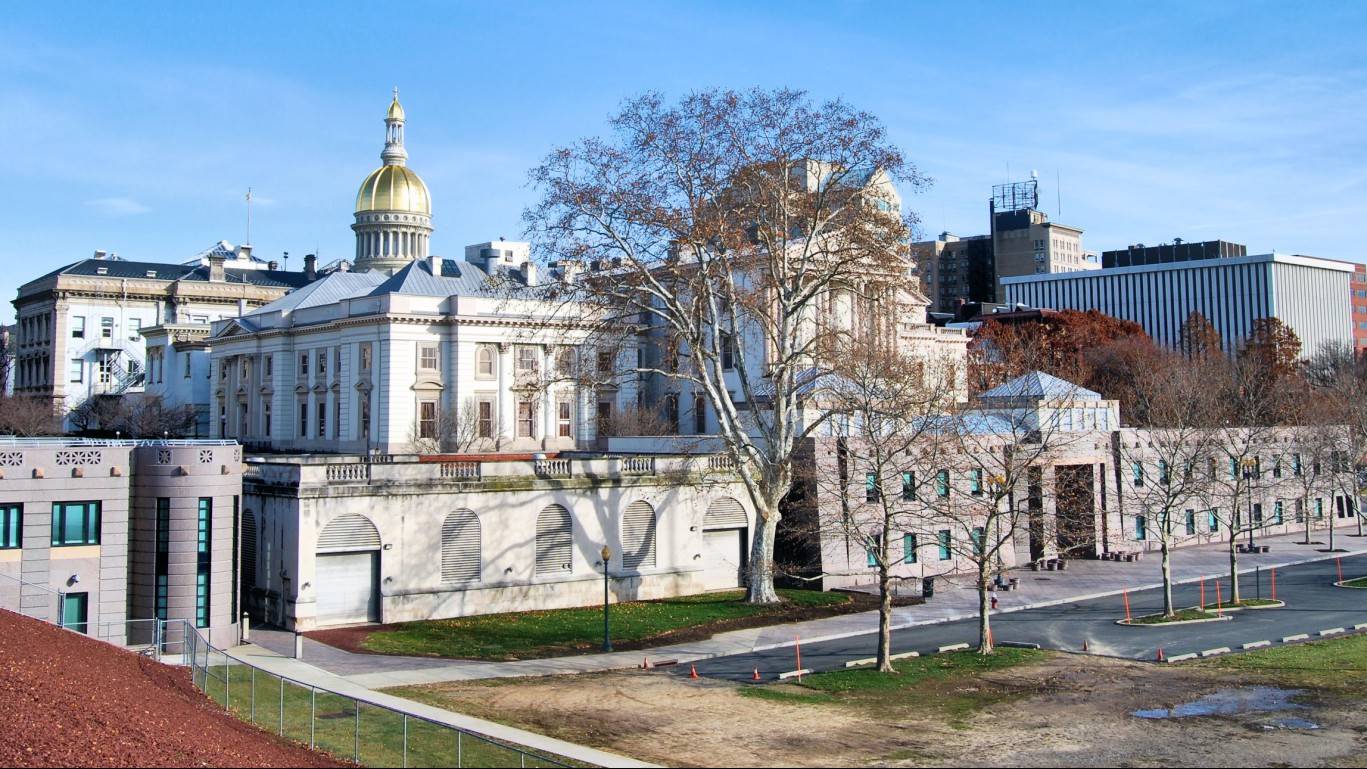
7. New Jersey
> Roads in poor condition: 17.3% (4th highest)
> Deficient bridges: 8.8% (22nd highest)
> Dams at high hazard risk: 27.3% (16th highest)
> State highway spending per driver: $516 (22nd highest)
[in-text-ad-2]
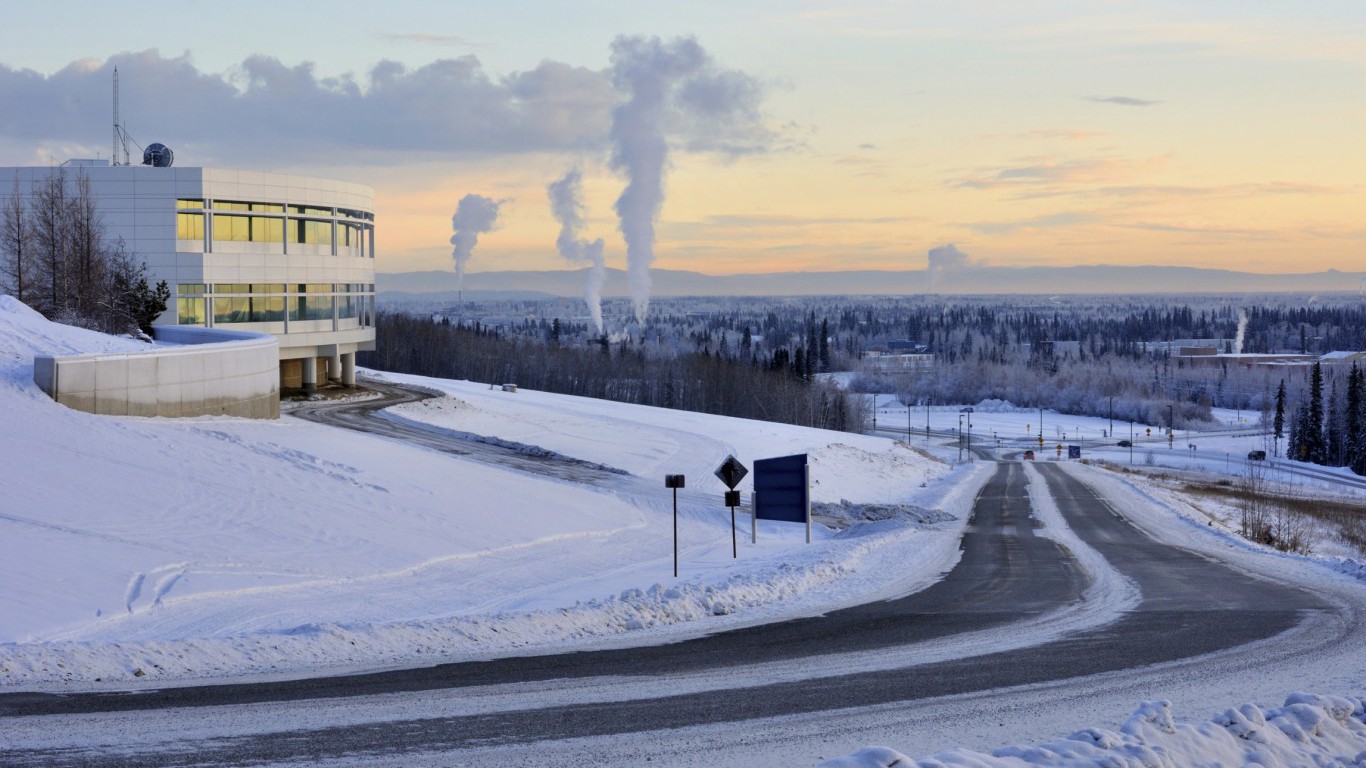
6. Alaska
> Roads in poor condition: 18.9% (2nd highest)
> Deficient bridges: 10.5% (15th highest)
> Dams at high hazard risk: 26.2% (18th highest)
> State highway spending per driver: $2,374 (the highest)
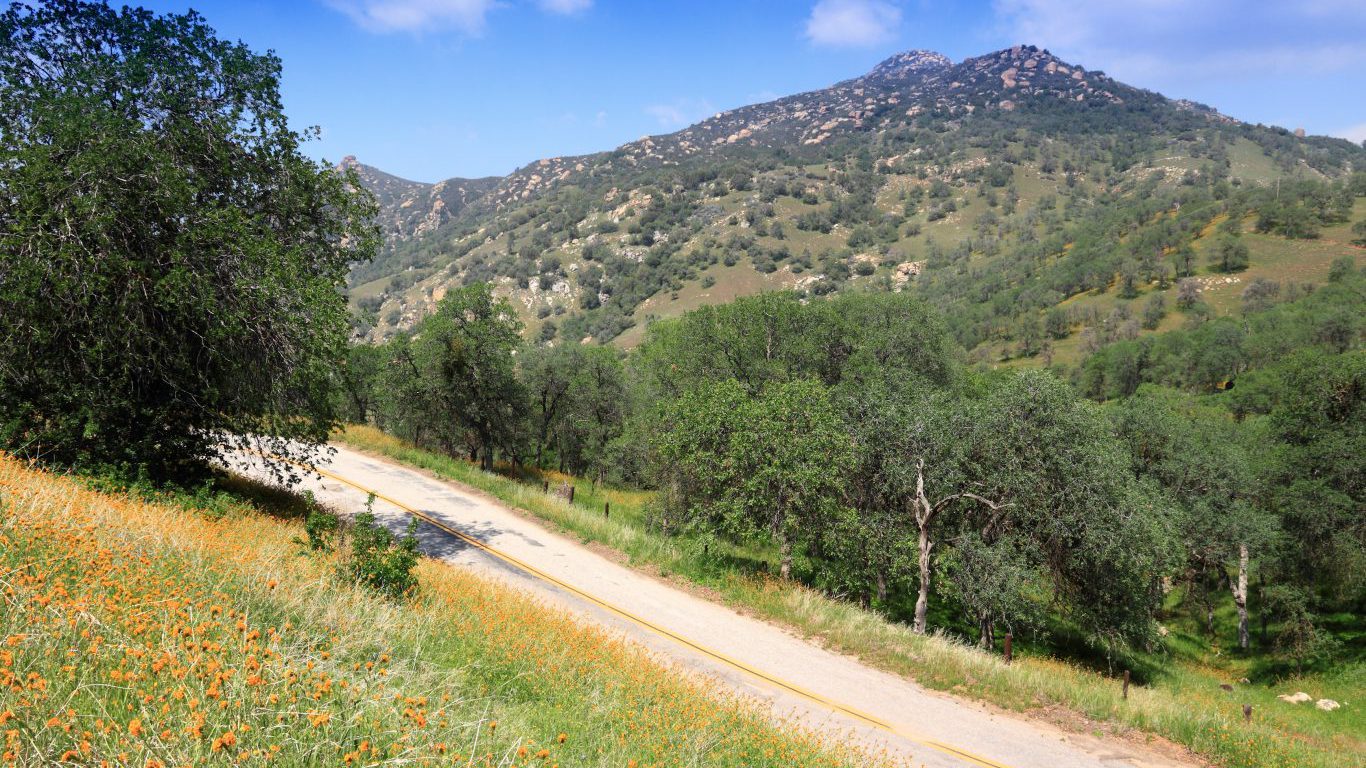
5. California
> Roads in poor condition: 16.9% (5th highest)
> Deficient bridges: 6.2% (19th lowest)
> Dams at high hazard risk: 52.6% (6th highest)
> State highway spending per driver: $269 (4th lowest)
[in-text-ad]

4. Pennsylvania
> Roads in poor condition: 7.4% (15th highest)
> Deficient bridges: 18.3% (5th highest)
> Dams at high hazard risk: 53.0% (5th highest)
> State highway spending per driver: $773 (9th highest)
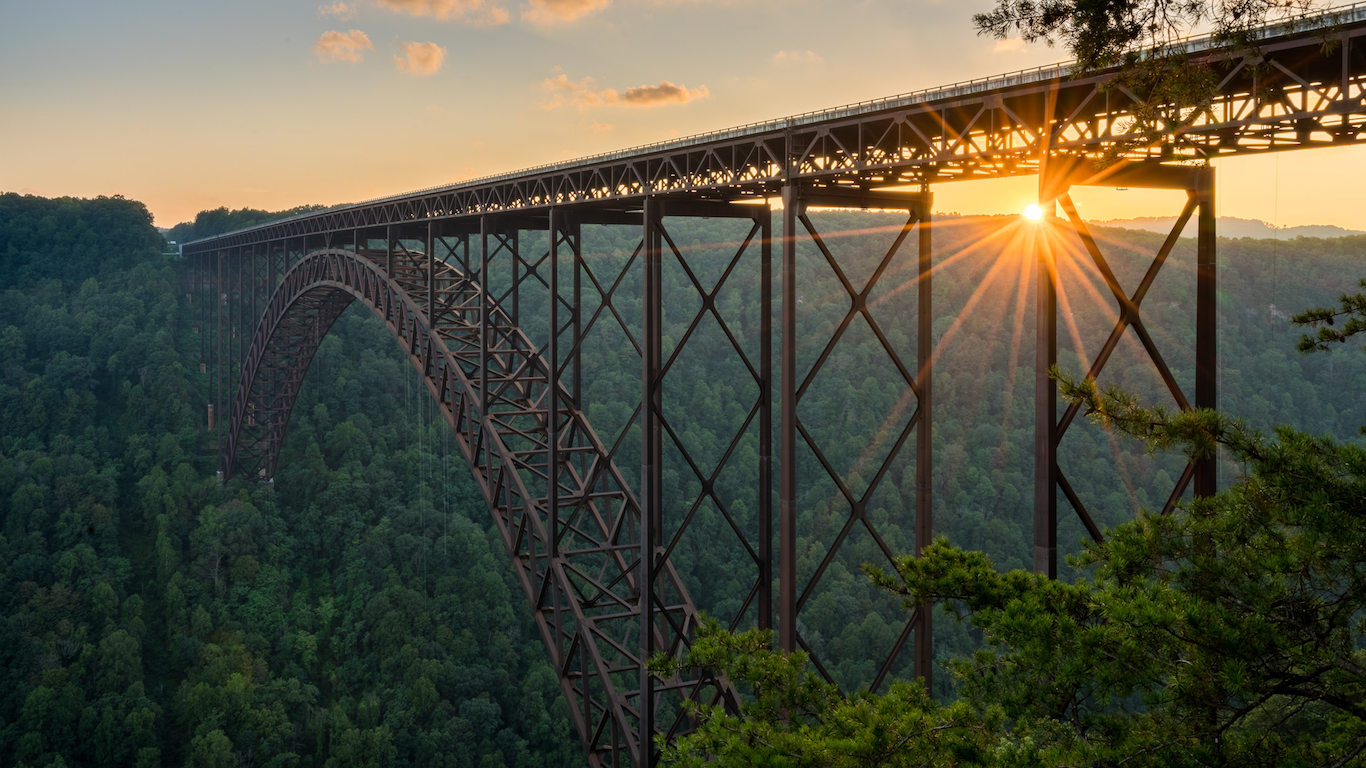
3. West Virginia
> Roads in poor condition: 4.9% (25th lowest)
> Deficient bridges: 19.0% (3rd highest)
> Dams at high hazard risk: 71.0% (3rd highest)
> State highway spending per driver: $910 (5th highest)

2. Hawaii
> Roads in poor condition: 16.1% (6th highest)
> Deficient bridges: 5.8% (15th lowest)
> Dams at high hazard risk: 93.2% (the highest)
> State highway spending per driver: $590 (16th highest)
[in-text-ad-2]
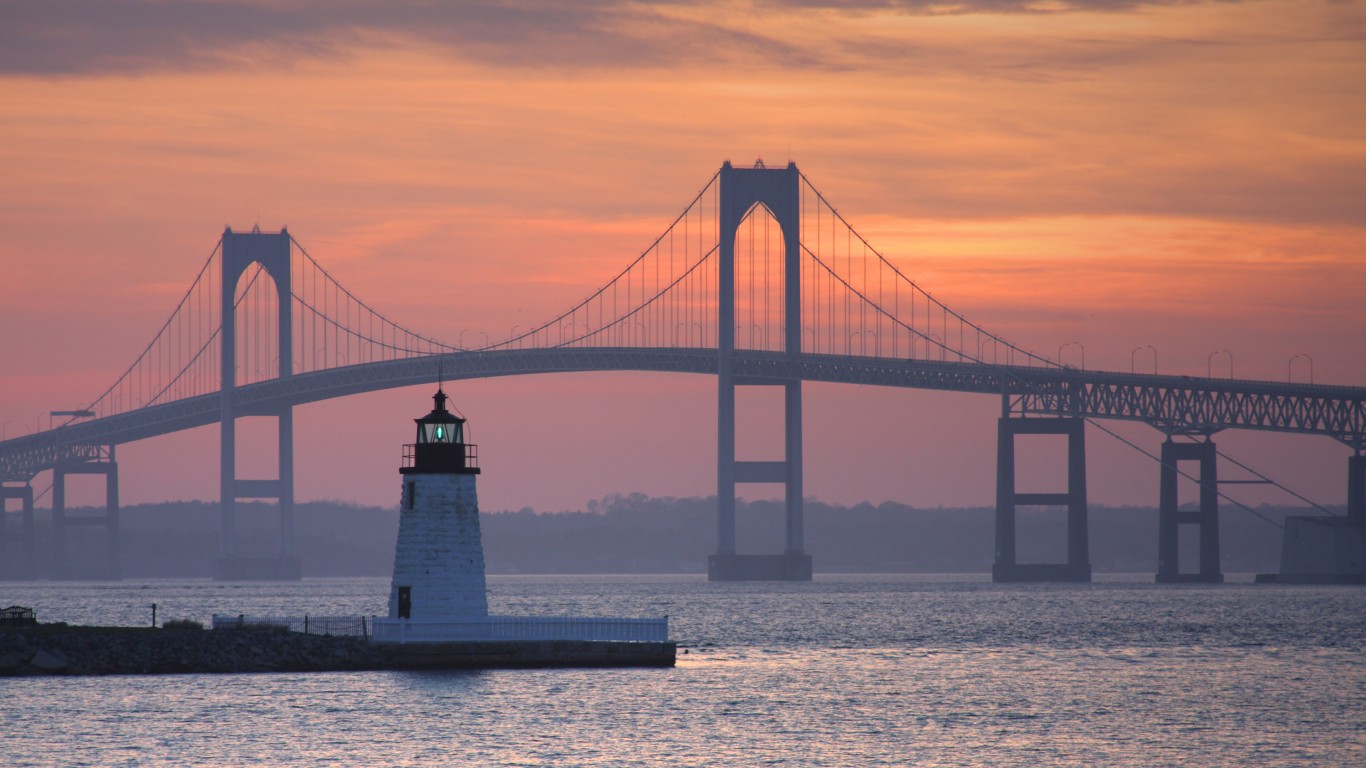
1. Rhode Island
> Roads in poor condition: 24.6% (the highest)
> Deficient bridges: 23.3% (the highest)
> Dams at high hazard risk: 42.3% (9th highest)
> State highway spending per driver: $408 (16th lowest)
Detailed Findings
The condition of a given state’s infrastructure is contingent on a number of factors, including weather. When asphalt freezes and thaws, it can crack and begin to crumble, losing its integrity. As a result, road maintenance is required more regularly in states that face harsh winters. Seven of the 10 states with the largest share of roadway in poor condition are in the Northeast, Midwest, and other regions that experience freezing temperatures.
Perhaps the most germane factor, however, is the age of a system or structure. Much of our country’s infrastructure was built over a century ago. “[These systems] were never really designed to meet the demands of today,” Swallow said.
Ultimately, the only way to repair roadways, bridges, tunnels, and railways is through investment on the federal, state and local levels. “If we don’t increase the investment, we will continue to see our infrastructure maintain or deteriorate,” Swallow said. “If we do increase investment, we will start to see changes.”
Methodology
To identify the states with the worst infrastructure, 24/7 Wall St. created an index accounting for the share in each state of roads in poor condition, the share of bridges classified as structurally deficient, and the share of dams at high hazard risk. The share of roadways in poor condition and the share of bridges considered structurally deficient came from the Federal Highway Administration’s report Highway Statistics 2016. The share of dams classified as high hazard potential came from the National Inventory of Dams, a database maintained by the U.S. Army Corps of Engineers and the Association of State Dam Officials. Highway spending as a share of total government spending came from the U.S. Census Bureau’s 2015 Annual Survey of State Government Finances.
Get Ready To Retire (Sponsored)
Start by taking a quick retirement quiz from SmartAsset that will match you with up to 3 financial advisors that serve your area and beyond in 5 minutes, or less.
Each advisor has been vetted by SmartAsset and is held to a fiduciary standard to act in your best interests.
Here’s how it works:
1. Answer SmartAsset advisor match quiz
2. Review your pre-screened matches at your leisure. Check out the advisors’ profiles.
3. Speak with advisors at no cost to you. Have an introductory call on the phone or introduction in person and choose whom to work with in the future
Thank you for reading! Have some feedback for us?
Contact the 24/7 Wall St. editorial team.
 24/7 Wall St.
 24/7 Wall St.
 24/7 Wall St.
 24/7 Wall St.
 24/7 Wall St.
