Special Report
The States With the Best and Worst Economies

Published:
Last Updated:

By several measures, the national economy is the strongest it has been in decades. The U.S. monthly unemployment rate now sits comfortably below 4%, and we are in the second longest period of GDP growth since World War II.
In most states, unemployment has improved in recent years as well, but that is not to say every state economy is equally healthy. Some states are experiencing an economic boom, while others continue to struggle with job losses, poor GDP growth, and poverty.
Economic vitality is as much about growth as it is about a state’s ability to support its population — with jobs, education, and economic opportunities. In turn, employed, better-paid, and better-educated residents contribute to economic growth.
24/7 Wall St. reviewed economic growth, poverty, unemployment, job growth, and college attainment rates to compare and rank state economies. The best ranked states tend to have fast-growing economies, low poverty and unemployment rates, high job growth, and a relatively well-educated workforce, while the opposite is generally the case among states with the worst ranked economies.
Residents of top-ranked state economies tend to be relatively affluent. Though the median household income was not used to rank states, it exceeds the national median in 9 of the 10 best state economies. A population with greater disposable income may be more able to purchase goods and services, which helps the success of local business.
“The national economy is continuing to recover, and some sectors are doing better than others,” Martin Kohli, chief regional economist at the Bureau of Labor Statistics, explained in a conversation with 24/7 Wall St. “Nationally, we’ve consistently seen relatively large job growth in health care, and relatively large growth in leisure and hospitality, and strong growth in professional and business services.” Many of the states with growing economies have outsized concentration of employment or strong growth in these industries.
Click here to see the best and worst state economies
Click here to read our methodology
Jobs in many high-paying industries require college education. And states with well-educated labor forces often attract businesses in such industries. According to Kohli, occupations that are expected to grow the most over the next several decades are also the ones that tend to require more education.
“I think it is well-known historically that higher levels of education are associated with lower levels of unemployment and higher earnings,” Kohli said. “Many of the sectors that are growth sectors … typically require people with higher levels of education.”
People with higher educational attainment also are more likely to have greater job stability and higher incomes, each of which are boons for a region’s economy.
Many of the states with contracting economies have a high reliance on jobs in energy extraction industries like coal mining and oil production. Four of the five worst ranked states on this list — Louisiana, West Virginia, Alaska, and New Mexico — also have among the largest mining sectors relative to total state employment.
When the price of oil collapsed beginning in 2014, many oil-dependent state economies suffered as a result. “These are states that are very reliant on energy — either coal mining or oil drilling — and they’re not as diversified as the states at the top of the list,” Kohli said.

1. Colorado
> 5 yr. GDP annual growth rate: +2.7% (4th largest increase)
> 2017 GDP: $302.9 billion (18th largest)
> June 2018 Unemployment: 2.7% (tied — 3rd lowest)
> 5 yr. annual employment growth: +2.4% (5th largest increase)
As was the case last year, Colorado’s economy ranks as the best in the country, due largely to its GDP and job growth, which each ranks among the top five nationwide. The state economy has expanded by an average annual rate of 2.7% over the last five years, and employment has increased by an annual average of 2.4% over the same period, compared to national growth rates of 1.7% and 1.5%, respectively. Nationwide, many of the jobs in the fastest growing industries require a postsecondary education, and in Colorado, nearly 40% of the adult population has a bachelor’s degree, the second highest share in the country. College-educated adults are more likely to have greater job security, which may help explain Colorado’s relatively low 2.7% unemployment rate.
[in-text-ad]

2. Utah
> 5 yr. GDP annual growth rate: +2.8% (3rd largest increase)
> 2017 GDP: $141.1 billion (20th smallest)
> June 2018 Unemployment: 3.0% (11th lowest)
> 5 yr. annual employment growth: +2.7% (the largest increase)
Utah’s economy grew at an average annual rate of 2.8%, the third highest annual growth rate of all states. The state’s information sector was the largest contributor to this growth, likely due in large part to the expansion of the tech sector in the Salt Lake City, Provo, and Park City region of the state, an area known collectively as the Silicon Slopes. The information sector added jobs at a 3.4% annual growth rate over the last five years, the fastest job growth of any state’s information sector. Across all sectors, employment in Utah grew at an annual rate of 2.7%, the largest overall employment growth of any state.

3. Massachusetts
> 5 yr. GDP annual growth rate: +1.6% (20th largest increase)
> 2017 GDP: $456.2 billion (11th largest)
> June 2018 Unemployment: 3.5% (tied — 17th lowest)
> 5 yr. annual employment growth: +1.4% (15th largest increase)
Massachusetts has the most highly educated population in the country. Among state adults, 42.7% have at least a bachelor’s degree, more than 10 percentage points above the national share. The highly educated population has a positive effect on the state economy in several ways. Those with a college degree tend to earn higher incomes, which then means more disposable income spent on local businesses. The state’s median annual household income of $75,297 is the fourth highest among states. College-educated adults are also more likely to have stable employment and health insurance, which in turn translates to more financially stable households. Just 2.5% of the state’s residents lack health insurance, the lowest share of any state.

4. New Hampshire
> 5 yr. GDP annual growth rate: +1.6% (21st largest increase)
> 2017 GDP: $70.5 billion (12th smallest)
> June 2018 Unemployment: 2.7% (tied — 3rd lowest)
> 5 yr. annual employment growth: +1.1% (24th largest increase)
New Hampshire’s state economy ranks fourth best in the nation, not as much for economic growth — its GDP growth was slightly slower than national average over the last five years — but rather due to general prosperity and stability. The state has a nation-lowest poverty rate at 7.3%, which is just over half the national poverty rate. Unemployment is one of the major drivers of poverty, and the state’s unemployment rate of 2.7% is among the lowest of any state.
[in-text-ad-2]

5. Washington
> 5 yr. GDP annual growth rate: +3.0% (the largest increase)
> 2017 GDP: $439.4 billion (14th largest)
> June 2018 Unemployment: 4.7% (tied — 4th highest)
> 5 yr. annual employment growth: +2.2% (7th largest increase)
Washington state’s economy is not perfect across all measures included in this index. Notably, the state’s unemployment rate as of June 2018 of 4.7% is tied for the fourth highest among states. However, the state economy makes up for the less than ideal labor market by ranking well in other key factors. Specifically, the state’s average annual GDP growth of 3.0% over the last half decade is the highest of any state and nearly double the comparable national pace.

6. Hawaii
> 5 yr. GDP annual growth rate: +1.5% (23rd largest increase)
> 2017 GDP: $75.5 billion (13th smallest)
> June 2018 Unemployment: 2.1% (the lowest)
> 5 yr. annual employment growth: +1.2% (19th largest increase)
Hawaii is an expensive place to live. With its idyllic location driving up property values, Hawaii has the most expensive real estate in the country. However, it also has one of the most affluent populations in the country. The median household income of $74,511 a year is close to $17,000 higher than the national median income. The state also benefits from a strong job market. As of June, the state had the nation’s lowest unemployment rate at just 2.1%. Also, just 3.5% of the state’s population lacks health insurance, second lowest of any state and far less than the national uninsured rate of 8.6%.
[in-text-ad]

7. Minnesota
> 5 yr. GDP annual growth rate: +1.7% (14th largest increase)
> 2017 GDP: $305.6 billion (17th largest)
> June 2018 Unemployment: 3.1% (12th lowest)
> 5 yr. annual employment growth: +1.2% (20th largest increase)
Low-income Americans are far less likely to have disposable income, and states with lower poverty rates benefit from having more residents who are able to spend more on goods and services. Minnesota’s poverty rate of 9.9% is tied with Alaska for the fifth lowest in the country.
Minnesota also has the third highest homeownership rate in the country, at 71.3%, compared to a national homeownership rate of 63.1%, a sign of high financial stability among residents.
8. California
> 5 yr. GDP annual growth rate: +2.9% (2nd largest increase)
> 2017 GDP: $2.4 trillion (the largest)
> June 2018 Unemployment: 4.2% (tied — 18th highest)
> 5 yr. annual employment growth: +2.2% (8th largest increase)
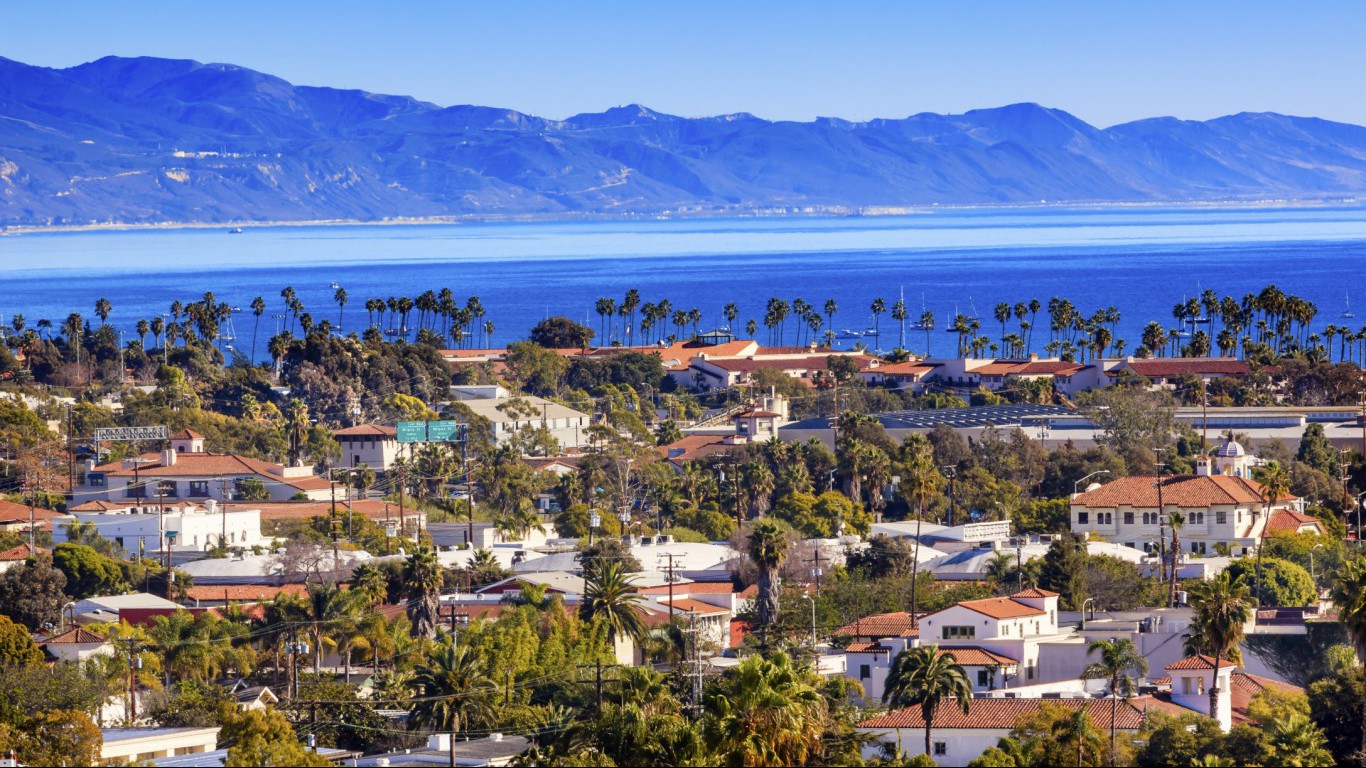
California’s economy grew at an annual rate of 2.9% from 2012 through 2017, the second fastest pace of any state. The largest source of growth was the state’s information industry, which includes tech giants of silicon valley such as Apple, Google, and Facebook. However, compared to most of the highest ranked state economies, California’s unemployment rate is relatively high, at 4.2%, compared to a national unemployment rate of 3.8%.

9. Idaho
> 5 yr. GDP annual growth rate: +2.4% (6th largest increase)
> 2017 GDP: $62.6 billion (10th smallest)
> June 2018 Unemployment: 2.9% (tied — 7th lowest)
> 5 yr. annual employment growth: +2.4% (4th largest increase)
States with relatively affluent populations tend to prosper. Among the states with the 10 highest ranked economies, Idaho is the only one with a median household income that trails the national median. The typical state household has an income of $51,807 a year, compared to a national median household income of $57,617.
However, the state makes up for its low incomes by ranking among the best states in the country in GDP and employment growth, as well as by having one of the lower unemployment rates in the country. Between 2012 and 2017, state GDP and employment each grew at an average annual rate of well over 2%. The state’s 2.9% unemployment rate is nearly a full percentage point below the national rate of 3.8%.
[in-text-ad-2]

10. Maryland
> 5 yr. GDP annual growth rate: +1.2% (19th smallest increase)
> 2017 GDP: $341.2 billion (15th largest)
> June 2018 Unemployment: 4.3% (tied — 13th highest)
> 5 yr. annual employment growth: +0.9% (16th smallest increase)
In measures of economic growth and job market health, Maryland only ranks average compared to other states. However, due to he relative affluence of its population, the state ranks among the 10 best economies. The state’s median household income of $78,945 a year is the highest of all states and more than $21,000 higher than the national median. The state is also one of just six to report a poverty rate below 10%.
Maryland’s population is also one of the better educated in the country, which helps explain the state’s high incomes, and also is a sign of the general financial stability of its residents. Just under 40% of the state’s adult population has a bachelor’s degree, the third highest share among states.

11. Virginia
> 5 yr. GDP annual growth rate: +0.7% (10th smallest increase)
> 2017 GDP: $441.5 billion (12th largest)
> June 2018 Unemployment: 3.2% (tied — 14th lowest)
> 5 yr. annual employment growth: +0.9% (18th smallest increase)
Like its neighbor, Maryland — the state that pushes it out of the top 10 — Virginia’s economy benefits from its proximity to Washington, D.C., which is a source of many high-paying, professional jobs. This helps explain the state’s highly educated and relatively affluent population. Virginia’s median household income of $68,114 a year is well above the national median of $57,617. Among state adults, 38.1% have a bachelor’s degree, compared to the national share of 31.3%. Americans with a college degree tend to have less trouble finding steady employment, and Virginia’s 3.2% June unemployment rate compares favorably to the national rate of 3.8%.
[in-text-ad]
12. Oregon
> 5 yr. GDP annual growth rate: +1.7% (16th largest increase)
> 2017 GDP: $212.6 billion (24th largest)
> June 2018 Unemployment: 4.0% (tied — 23rd highest)
> 5 yr. annual employment growth: +2.2% (6th largest increase)
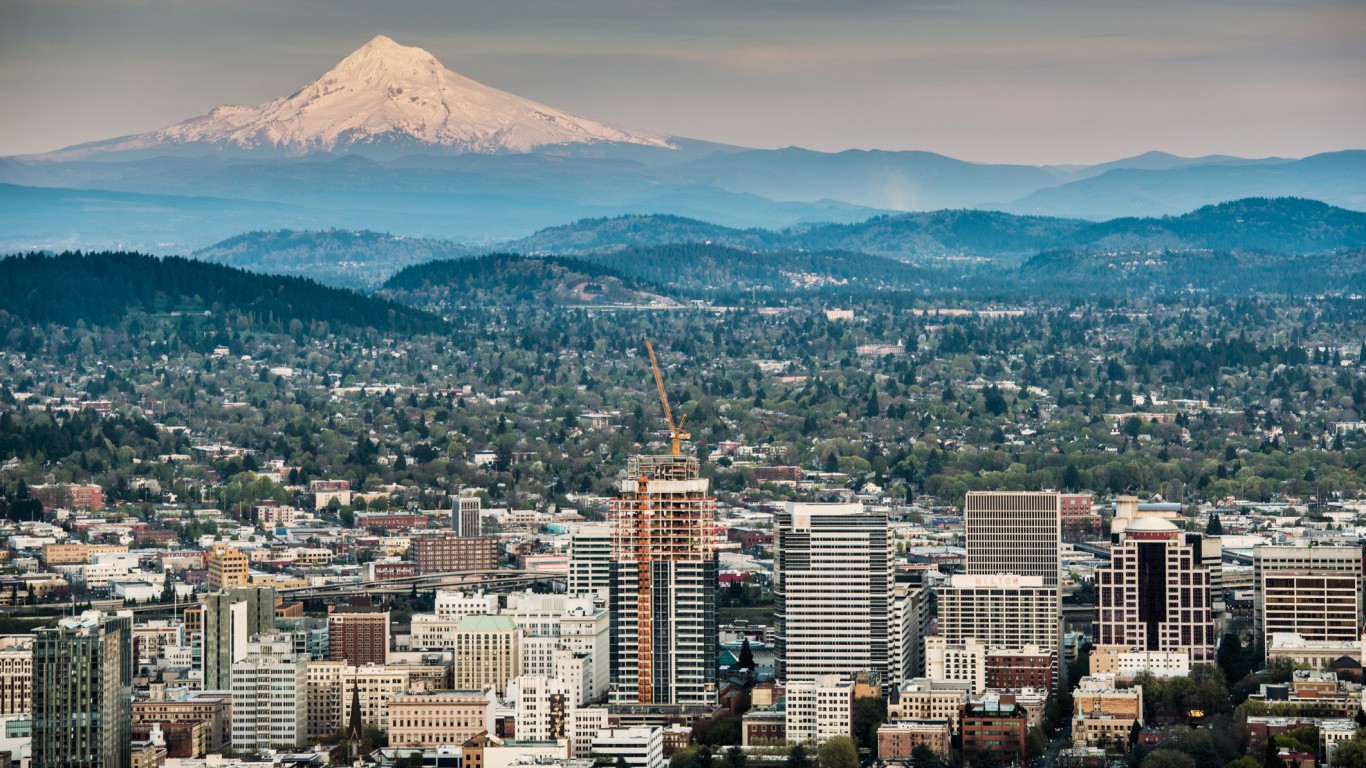
Though it ranks just outside of the the top 10 state economies, Oregon ranks average or above average in most measures of economic prosperity. What pushes the state’s economy rank higher is its high job growth. Oregon’s employment increased at an annualized average of 2.2% each year from 2012 through 2017. The nation’s job growth, by comparison, increased at a 1.5% pace over that same period. Job growth was not confined to one or two industries, rather most major industries in the state had healthy job growth.

13. Florida
> 5 yr. GDP annual growth rate: +2.3% (7th largest increase)
> 2017 GDP: $836.1 billion (4th largest)
> June 2018 Unemployment: 3.8% (tied — 21st lowest)
> 5 yr. annual employment growth: +2.5% (3rd largest increase)
Just like a state’s economy contributes to the population’s wealth, a wealthy population can bolster an economy. and median household incomes in nearly every state among the most affluent economies are comparable to or above the national median income. While there are several exceptions, the biggest by far is Florida, where the typical household earns $50,860 a year, roughly $6,800 below the national median household income.
The state ranks as high as it does as a result of reporting some of the strongest economic growth figures over the past half decade. From 2012 through 2017, the state’s employment grew at an annual rate of 2.5% and GDP grew at an annual rate of 2.3% compared to national growth rates of 2.5% and 1.7, respectively, over the same period.
14. Nebraska
> 5 yr. GDP annual growth rate: +1.9% (12th largest increase)
> 2017 GDP: $104.9 billion (16th smallest)
> June 2018 Unemployment: 2.9% (tied — 7th lowest)
> 5 yr. annual employment growth: +0.8% (13th smallest increase)
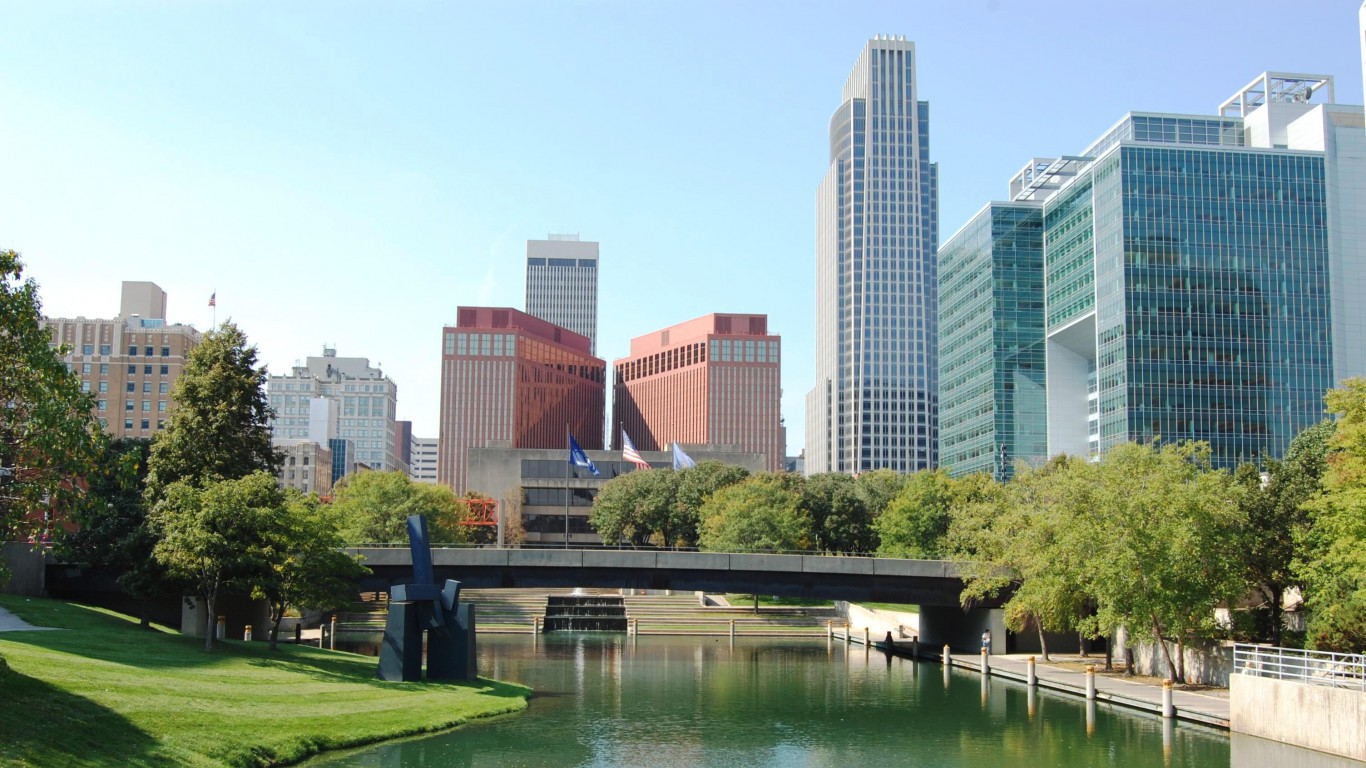
Most of the better ranked state economies boast an affluent population and high home prices. A less expensive housing market relative to regional incomes can free up more disposable income for residents. In Nebraska, the typical household earns $56,927 a year, roughly in line with the national median household income of $57,617. Relative to that income, home prices are quite affordable, equivalent to 2.6 times the state median income — the third most affordable housing market in the country. Unemployment is also quite low in the state, at 2.9%, compared to the national unemployment rate of 3.8%.
[in-text-ad-2]

15. New Jersey
> 5 yr. GDP annual growth rate: +0.7% (9th smallest increase)
> 2017 GDP: $511.3 billion (8th largest)
> June 2018 Unemployment: 4.3% (tied — 13th highest)
> 5 yr. annual employment growth: +1.0% (21st smallest increase)
New Jersey has one of the highest unemployment rates for a state with an economy ranking in the top 20. The state’s June jobless rate of 4.3% is tied for 13th highest among states, and is 0.5 percentage points higher than the national rate. The state’s low poverty levels and high educational attainment push it higher up the list. Roughly 39% of the state’s adult population has a bachelor’s degree, the fourth highest share among states. Just 10.2% of the state’s residents live in poverty, the ninth lowest poverty rate of all states.
16. Vermont
> 5 yr. GDP annual growth rate: +0.6% (5th smallest increase)
> 2017 GDP: $28.0 billion (the smallest)
> June 2018 Unemployment: 2.8% (6th lowest)
> 5 yr. annual employment growth: +0.5% (5th smallest increase)
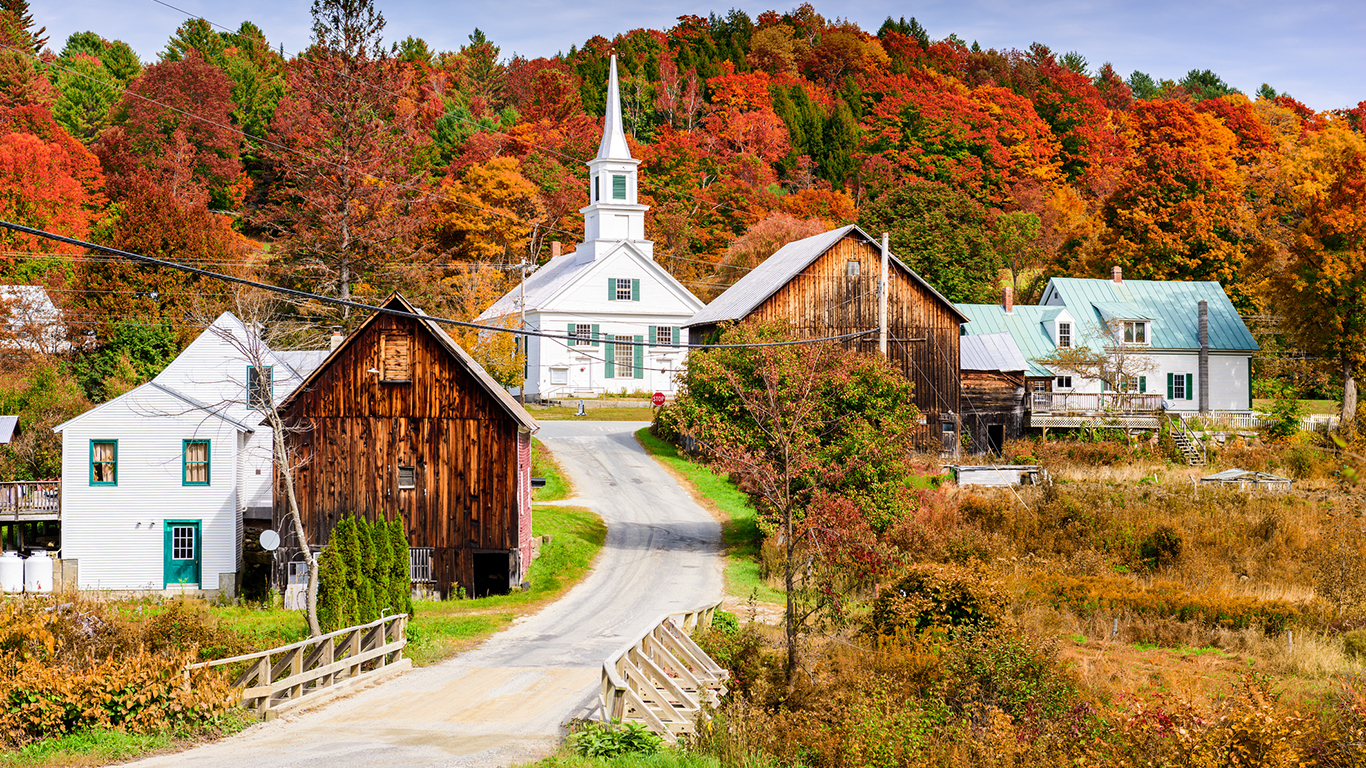
Vermont’s economy benefits from a relatively highly educated population — the state ranks among the 10 states with the highest adult high school and college attainment rates. It also has relatively few people in the labor force who are out of work. The state’s June unemployment rate of 2.8% is the sixth lowest among states.
Vermont only ranks 16th on this list due to relatively stagnant economic growth. Between 2012 and 2017, employment in the state grew at an annual rate of just 0.52%, far below the national annual growth rate of 1.49% over the last half decade. Vermont’s average annual GDP growth of 0.61% over the same five years was barely one-third the comparable national growth rate.
[in-text-ad]

17. Wisconsin
> 5 yr. GDP annual growth rate: +1.4% (23rd smallest increase)
> 2017 GDP: $282.0 billion (20th largest)
> June 2018 Unemployment: 2.9% (tied — 7th lowest)
> 5 yr. annual employment growth: +1.0% (19th smallest increase)
AS the 17th best state economy, Wisconsin ranks roughly average by many measures of economic health. The state’s poverty rate is just over 2 percentage points below the national poverty rate of 14%. The state’s adult bachelor’s attainment rate of 29.5% is slightly below the comparable national rate of 31.3%. The strongest point of Wisconsin’s economy is its relatively low jobless rate. The state’s June unemployment rate of 2.9% is tied for seventh lowest among states.

18. Iowa
> 5 yr. GDP annual growth rate: +1.8% (13th largest increase)
> 2017 GDP: $164.5 billion (21st smallest)
> June 2018 Unemployment: 2.7% (tied — 3rd lowest)
> 5 yr. annual employment growth: +0.7% (10th smallest increase)
Iowa was one of the few states to weather the housing crisis and Great Recession relatively unharmed, consistently reporting among the lowest unemployment rates in the country over that period. Unemployment remains a non-issue in the state. As of June, the state’s 2.7% rate was tied for the third lowest in the country.
Though unemployment is relatively low, the state has not added meaningfully to employment over the last five years, either. From 2012 through 2017, state employment increased at an annual average rate of just 0.7%, less than half the comparable national growth rate over the same period.

Due to its highly permissive business laws, over half of all publicly traded U.S. companies are registered in Delaware. This is despite the fact that the state is the sixth least populous in the country, with fewer than a million residents. While state policies towards businesses were not considered in this index of economic health, Delaware ranks roughly average in most of the measures considered.
[in-text-ad-2]
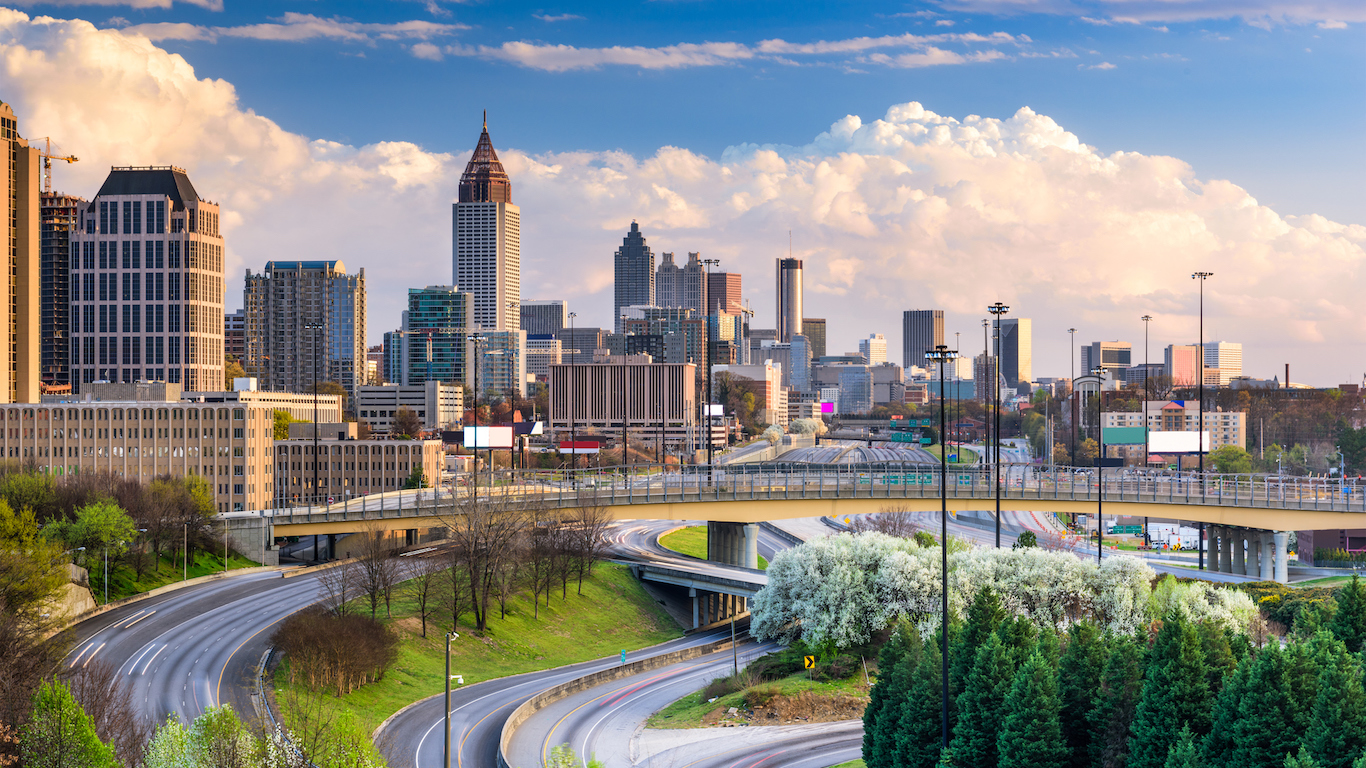
20. Georgia
> 5 yr. GDP annual growth rate: +2.3% (8th largest increase)
> 2017 GDP: $479.0 billion (9th largest)
> June 2018 Unemployment: 4.1% (tied — 21st highest)
> 5 yr. annual employment growth: +2.0% (9th largest increase)
Georgia ranks as the 20th best state economy in the country. And compared to its neighbors in the deep South, it compares even more favorably. The state’s poverty rate of 16.0% is the 10th highest among states and certainly represents a drag on the state economy. However, of the five states that comprise the deep South, only South Carolina has a lower poverty rate. The state’s job market also grew relatively rapidly over the past five years. From 2012 through 2017, total employment grew at an annualized rate of 2.0%, about half a percentage point higher than the comparable national growth rate over the same period.

21. Texas
> 5 yr. GDP annual growth rate: +2.5% (5th largest increase)
> 2017 GDP: $1.5 trillion (2nd largest)
> June 2018 Unemployment: 4.0% (tied — 23rd highest)
> 5 yr. annual employment growth: +1.9% (12th largest increase)
Unlike many other U.S. states with substantial exports, the economy of Texas is relatively diverse. Despite weak oil prices for most of the last five years, state GDP still increased at an annual average rate of 2.5%, fifth best in the nation.
Having the fifth fastest economic growth was not enough to push Texas into the ranks of the 20 best economies, largely because it has a below average adult educational attainment rate and one of the higher poverty rates among states.
[in-text-ad]

22. South Carolina
> 5 yr. GDP annual growth rate: +2.1% (9th largest increase)
> 2017 GDP: $189.1 billion (25th smallest)
> June 2018 Unemployment: 3.8% (tied — 21st lowest)
> 5 yr. annual employment growth: +1.9% (11th largest increase)
Like many of the states that rank close to the middle of this list, South Carolina has both positive and negative characteristics. The state GDP and job market have both improved substantially in the past half decade. From 2012 through 2017, state GDP increased at an annual average rate of 2.1%, while employment rose at a 1.9% annual pace, compared to national figures of 1.7% and 1.5%, respectively.
However, the state economy suffers from a less affluent and less educated population. The state’s adult college attainment and poverty each ranks worse than the majority of states.

23. Nevada
> 5 yr. GDP annual growth rate: +2.0% (10th largest increase)
> 2017 GDP: $134.3 billion (18th smallest)
> June 2018 Unemployment: 4.7% (tied — 4th highest)
> 5 yr. annual employment growth: +2.7% (2nd largest increase)
Nevada’s economy is improving faster than most states — it ranks 10th among states for GDP growth over the last five years and second for employment growth over the same period.
Nevada is one of a number of states on this list that have shown signs of economic improvement but remain with underlying consumer base that is far from ideal. A highly educated population is more likely to attract businesses looking for more skilled workers, and are also more likely to have disposable income to feed the economy. In Nevada, just 23.5% of the adult population has a bachelor’s degree, the sixth lowest share and far less than the national share of 31.3%.
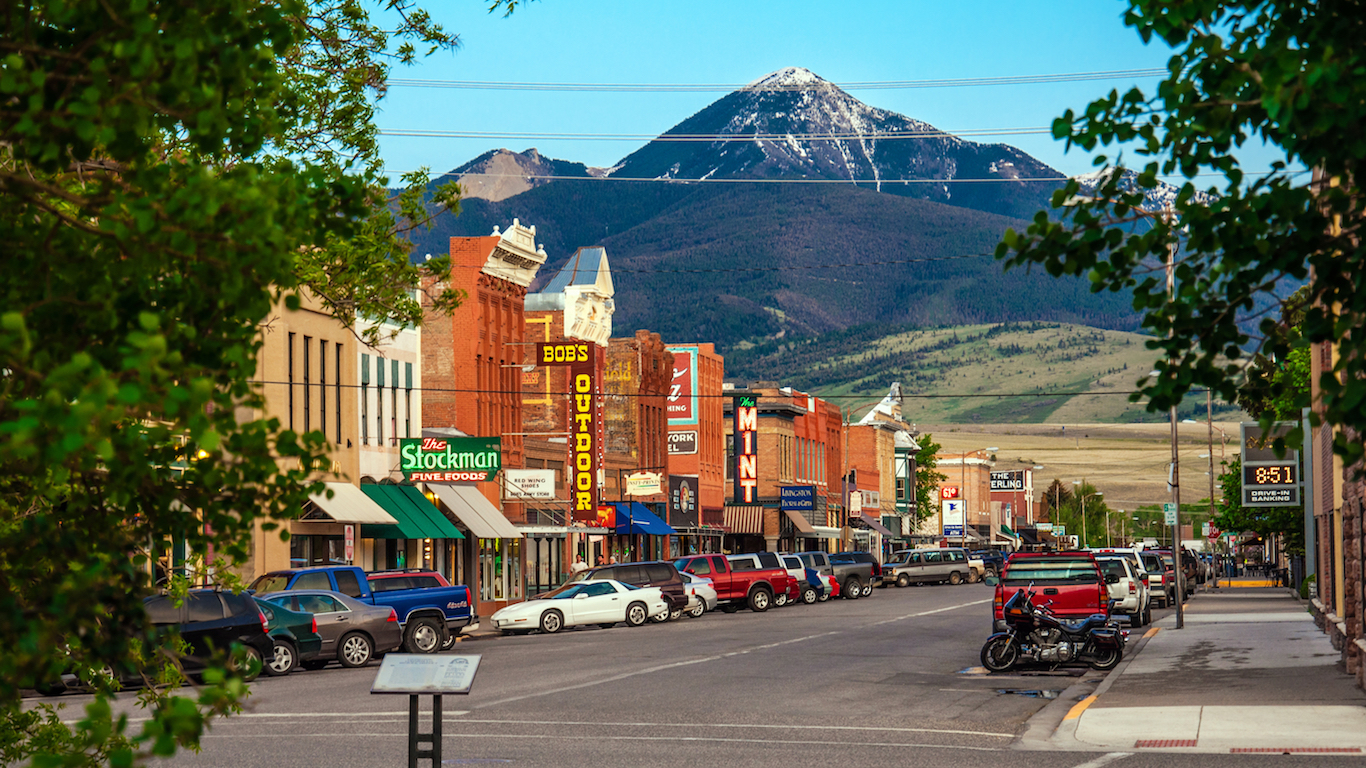
24. Montana
> 5 yr. GDP annual growth rate: +1.3% (21st smallest increase)
> 2017 GDP: $41.8 billion (4th smallest)
> June 2018 Unemployment: 3.8% (tied — 21st lowest)
> 5 yr. annual employment growth: +1.2% (21st largest increase)
Ranked as the 24th best economy, Montana is comparatively average in most measures of economic quality considered. The state ranks between 20th and 30th overall in each of the components of our index — GDP growth, adult educational attainment, employment growth, and unemployment. The state’s June unemployment rate of 3.8% is the same as that of the United States as a whole.
[in-text-ad-2]

25. Kansas
> 5 yr. GDP annual growth rate: +0.9% (14th smallest increase)
> 2017 GDP: $138.2 billion (19th smallest)
> June 2018 Unemployment: 3.4% (16th lowest)
> 5 yr. annual employment growth: +0.6% (7th smallest increase)
In measures of prosperity and educational attainment, the population of Kansas is slightly above average. The state’s unemployment rate of 3.4% is slightly better than the U.S. rate of 3.8%. The state’s poverty rate of 12.1% also falls below the national rate of 14%. However, Kansas’ economy has grown relatively slowly over the past few years. From 2012 through 2017, the state’s GDP rose at an average annual rate of 0.9%, a smaller increase than in most states, and well below the comparable 1.7% average annual growth nationwide over the same period.
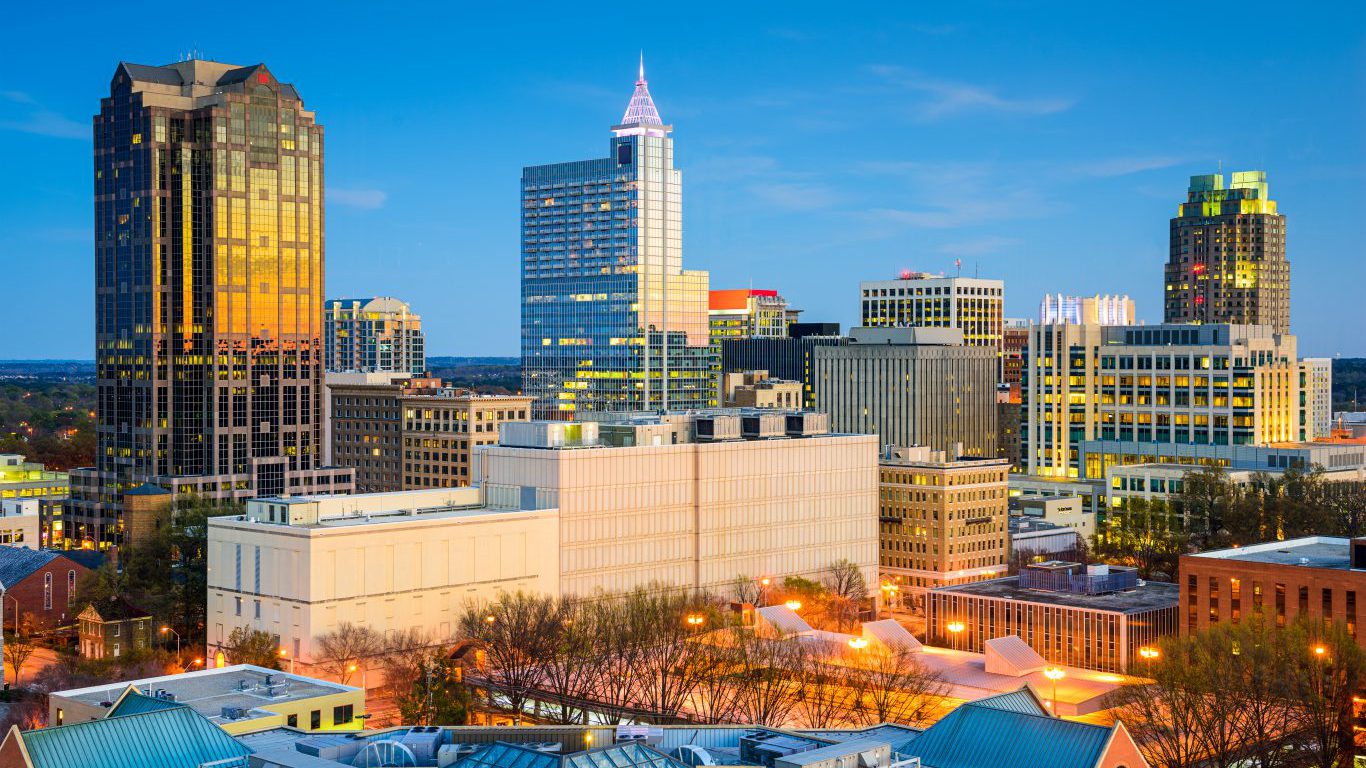
26. North Carolina
> 5 yr. GDP annual growth rate: +1.7% (15th largest increase)
> 2017 GDP: $459.3 billion (10th largest)
> June 2018 Unemployment: 4.2% (tied — 18th highest)
> 5 yr. annual employment growth: +1.7% (14th largest increase)
North Carolina ranks towards the middle of the country in a number of measures of economic health. State GDP grew at an average rate of 1.7% a year from 2012 to 2017, in line with the national growth rate. The sector with the largest contribution to GDP growth last year was nondurable goods manufacturing. Like the nation as a whole, the largest drag on the economy was the finance and insurance sector. The Charlotte metro area in particular reported a large decline in its substantial banking sector over the past five years.
While steady economic growth has helped reduce unemployment in North Carolina over the past several years, the share of unemployed workers in the state remains slightly above the national average. Some 4.2% of the N.C. workforce is unemployed, compared to the 3.8% national unemployment rate.
[in-text-ad]

27. Maine
> 5 yr. GDP annual growth rate: +0.9% (16th smallest increase)
> 2017 GDP: $52.8 billion (8th smallest)
> June 2018 Unemployment: 2.9% (tied — 7th lowest)
> 5 yr. annual employment growth: +0.7% (9th smallest increase)
Maine ranks in the bottom half of states for its overall economic health. Job growth is an important indicator of an economy’s ability to attract new businesses, but Maine’s employment grew at a 0.9% annual average rate over the last five years, barely half the national annual growth rate over the last half decade. The lack of job growth in the area accompanies a relatively small population increase in the state. Since 2010, the state’s population has risen by just 0.6%, the sixth smallest increase in the country over that time.
Despite slower than typical growth, a relatively small share of Maine’s workforce are out of a job. The state’s 2.9% unemployment rate is one of the lowest of any states and well below the 3.8% national rate.

28. Connecticut
> 5 yr. GDP annual growth rate: -0.3% (2nd largest decrease)
> 2017 GDP: $224.7 billion (23rd largest)
> June 2018 Unemployment: 4.4% (12th highest)
> 5 yr. annual employment growth: +0.4% (3rd smallest increase)
Connecticut’s GDP contracted by an average of 0.26% a year from 2012 to 2017, the second largest decline of any state. Meanwhile, economic output across the United States as a whole climbed by an average of 1.69% a year over the same period. The state’s declining economic output is partially attributable to population decline. Over the last half decade, the state’s population contracted by 0.3%, one of the steepest declines of any state. Today, Connecticut’s 4.4% unemployment rate is higher than the 3.8% national jobless rate.
Despite negative growth and high unemployment, Connecticut is a relatively affluent state. The typical household in the state earns $73,433 a year, nearly $16,000 more than the typical American household.

29. Tennessee
> 5 yr. GDP annual growth rate: +2.0% (11th largest increase)
> 2017 GDP: $297.8 billion (19th largest)
> June 2018 Unemployment: 3.5% (tied — 17th lowest)
> 5 yr. annual employment growth: +1.7% (13th largest increase)
Over the last five years, the Tennessee economy grew at an average rate of 2.0% a year, faster than the 1.7% national growth rate and the 11th fastest of any state. The rapid economic growth has likely helped reduce unemployment in the state. The share of unemployed workers in Tennessee declined steadily over the past five years and has been below the national rate since January 2017. Currently, 3.5% of the state workforce is unemployed, below the 3.8% national unemployment rate.
While steady economic growth has helped push unemployment below the national average, Tennessee lags behind a majority of states in individual wealth and educational attainment. An estimated 15.8% of state residents live in poverty, and 26.1% of adults have a bachelor’s degree, compared to the national poverty rate of 14.0% and college attainment rate of 31.3%.
[in-text-ad-2]

30. Rhode Island
> 5 yr. GDP annual growth rate: +0.9% (15th smallest increase)
> 2017 GDP: $51.2 billion (7th smallest)
> June 2018 Unemployment: 4.3% (tied — 13th highest)
> 5 yr. annual employment growth: +1.0% (22nd smallest increase)
Rhode Island has a relatively highly educated population, as 34.1% of adults in the state have at least a bachelor’s degree, compared to the 31.3% of adults who do nationwide. The state’s poverty rate is also slightly below the national average.
However, Rhode Island ranks worse than the majority of states in several other measures of economic strength. For example, state GDP grew at an average annual rate of just 0.9% per year between 2012 and 2017, compared to a national growth rate of 1.7% per year over the same period. A sign of the state’s relatively stagnant economy is its low population growth. Rhode Island’s population has increased by just 0.6% since 2010, compared to the comparable national population increase of 5.3%.

31. New York
> 5 yr. GDP annual growth rate: +0.8% (13th smallest increase)
> 2017 GDP: $1.3 trillion (3rd largest)
> June 2018 Unemployment: 4.5% (tied — 9th highest)
> 5 yr. annual employment growth: +1.3% (18th largest increase)
New York is one of many Northeastern states suffering from economic decline as many of its younger, more educated residents relocate to warmer states in the South and West Coast. New York’s population grew at less than one-third the U.S. growth rate from 2012 to 2017 — it was surpassed by Florida as the fourth most populous state in 2014. Just 1.7% of U.S. adults who moved to New York in 2016 had a bachelor’s degree, the second smallest share of any state. Slow population growth has likely hindered economic activity. New York’s GDP grew at an average annual rate of just 0.8% from 2012 to 2017, less than half the 1.7% national GDP growth rate over that time.
[in-text-ad]

32. Illinois
> 5 yr. GDP annual growth rate: +0.8% (12th smallest increase)
> 2017 GDP: $705.4 billion (5th largest)
> June 2018 Unemployment: 4.3% (tied — 13th highest)
> 5 yr. annual employment growth: +0.9% (15th smallest increase)
While population change was not one of the measures included in this index of state economic health, declining populations are usually a sign of weak job markets and of places generally unattractive to new business. Illinois is one of just three states where the population has declined since 2010. Both employment and overall economic growth tend to mirror population changes, as has been the case in Illinois. Between 2012 and 2017, both the state’s GDP and employment have increased at an annual average rate roughly half that of the comparable U.S. figures.

33. South Dakota
> 5 yr. GDP annual growth rate: +1.1% (17th smallest increase)
> 2017 GDP: $41.7 billion (3rd smallest)
> June 2018 Unemployment: 3.2% (tied — 14th lowest)
> 5 yr. annual employment growth: +0.8% (12th smallest increase)
South Dakota’s population is growing rapidly. Over the last five years, the state’s population expanded by 4.5%, faster than the U.S. population growth of 3.7%. Economic growth, however, was not as rapid. The state’s five-year average annual GDP growth rate of just 1.1% trails the 1.7% average annual national economic expansion over that time. Over the last year, the agriculture, forestry, fishing, and hunting industry, as well as the finance and insurance industry, were substantial drags on economic growth.
Currently, South Dakota’s economy appears to be doing relatively well. Due in part to rapid hiring in the construction industry over the last half decade, just 3.2% of workers in the state are out of a job, well below the 3.8% U.S. unemployment rate.
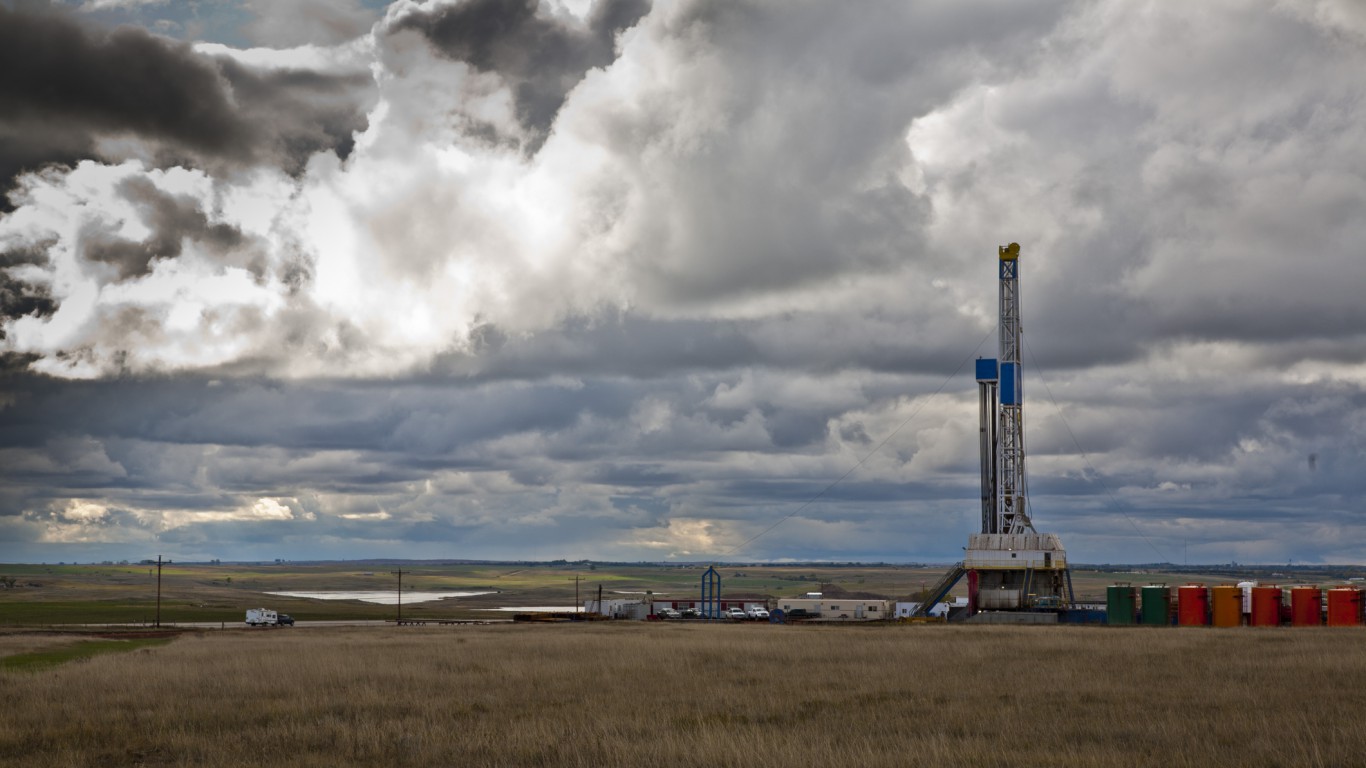
34. North Dakota
> 5 yr. GDP annual growth rate: +0.4% (3rd smallest increase)
> 2017 GDP: $49.0 billion (6th smallest)
> June 2018 Unemployment: 2.6% (2nd lowest)
> 5 yr. annual employment growth: +0.1% (the smallest increase)
North Dakota’s economy is largely dependent on the mining sector. While thanks to an oil boom the state boasted the largest GDP growth in the country in 2014, falling oil prices from mid-2014 to 2016 caused the economy to contract the following two years. Over the past five years, North Dakota’s economy grew at an annual average rate of 0.4%, the sixth slowest rate of any state — including those with contracting economies.
Despite slow economic growth, North Dakota leads much of the country in measures of wealth and labor utilization. Just 10.7% of the state’s population lives in poverty, and 2.6% of the workforce is unemployed — the 10th lowest poverty rate and second lowest unemployment rate of any state.
[in-text-ad-2]

35. Indiana
> 5 yr. GDP annual growth rate: +1.6% (19th largest increase)
> 2017 GDP: $309.5 billion (16th largest)
> June 2018 Unemployment: 3.3% (15th lowest)
> 5 yr. annual employment growth: +1.1% (22nd largest increase)
Apart from its unemployment rate, which at 3.3% is slightly better than the national rate of 3.8%, Indiana compares worse than average across most measures of economic health. A highly educated population is often a sign of good economic health as a highly skilled workforce is more likely to attract new businesses. In Indiana, barely one in four adults has a bachelor’s degree, one of the lowest shares in the country. Those with college degrees are also more likely to find steady, higher paying work and have more disposable income. The median household income in Indiana of $52,314 a year is roughly $5,300 below the national median household income.

36. Arizona
> 5 yr. GDP annual growth rate: +1.6% (18th largest increase)
> 2017 GDP: $277.7 billion (21st largest)
> June 2018 Unemployment: 4.7% (tied — 4th highest)
> 5 yr. annual employment growth: +2.0% (10th largest increase)
Few states are growing as rapidly as Arizona. Over the last half decade, the number of people living in the state climbed by 7.2%, nearly double the 3.7% national population growth. While job growth in Arizona has also been relatively strong over the same period, unemployment remains high. Arizona’s 4.7% jobless rate is among the highest of any state and well above the 3.8% national unemployment rate.
Arizona residents are also more likely to be poor and less likely to be wealthy than the typical American. The state’s 16.4% poverty rate is among the highest of all states and well above the 14.0% national poverty rate. Additionally, less than 5% of Arizona households earn $200,000 or more a year compared to 6.4% of U.S. households.
[in-text-ad]

37. Pennsylvania
> 5 yr. GDP annual growth rate: +1.5% (24th largest increase)
> 2017 GDP: $663.8 billion (6th largest)
> June 2018 Unemployment: 4.3% (tied — 13th highest)
> 5 yr. annual employment growth: +0.6% (8th smallest increase)
Pennsylvania is one of many Northeastern states struggling to attract and retain a young, educated workforce. The population of Pennsylvania grew by just 0.3% from 2012 to 2017, the seventh lowest growth rate of any state. Just 2.4% of adults who moved to Pennsylvania from within the United States in the past year had a bachelor’s degree, one of the smaller shares of any state. The slow population growth and slow college-educated population growth has not likely helped boost economic growth. Pennsylvania’s GDP grew at an average annual rate of 1.5% from 2012 to 2017, less than the 1.7% national figure.
Despite declining steadily over the past eight years, Pennsylvania’s unemployment rate has only recently returned to its pre-recession levels, and it remains higher than a majority of states. Currently, 4.3% of the state’s workforce is unemployed, higher than the 3.8% national unemployment rate.

38. Missouri
> 5 yr. GDP annual growth rate: +0.7% (7th smallest increase)
> 2017 GDP: $263.1 billion (22nd largest)
> June 2018 Unemployment: 3.5% (tied — 17th lowest)
> 5 yr. annual employment growth: +1.1% (23rd largest increase)
The Missouri economy grew at an average annual rate of just 0.7% from 2012 to 2017, the 10th slowest economic growth of any state — including those with shrinking economies. Over the same period, the national GDP increased at an average annual rate of 1.7%. One factor hindering economic activity in Missouri is likely the state’s sluggish population growth. The state’s population grew by just 1.5% over the past five years, less than half the 3.7% national figure.
In other measures of economic health, Missouri lags behind the nation as a whole. For example, 28.5% of adults in the state have a bachelor’s degree, far less than the 31.3% national college attainment rate.

39. Michigan
> 5 yr. GDP annual growth rate: +1.6% (17th largest increase)
> 2017 GDP: $440.3 billion (13th largest)
> June 2018 Unemployment: 4.5% (tied — 9th highest)
> 5 yr. annual employment growth: +1.3% (17th largest increase)
Michigan’s 4.5% June unemployment rate is higher than that of most states and well above the 3.8% U.S. unemployment rate. The relatively high unemployment is partially attributable to longer term employment declines in certain industries. Over the last five years, the state’s mining and logging industry, as well as the other services industry and government sector, have each shed jobs.
Incomes are relatively low in Michigan. The typical household in the state earns $52,492 a year, about $5,000 less than the typical American household.
[in-text-ad-2]

40. Ohio
> 5 yr. GDP annual growth rate: +1.3% (22nd smallest increase)
> 2017 GDP: $561.8 billion (7th largest)
> June 2018 Unemployment: 4.5% (tied — 9th highest)
> 5 yr. annual employment growth: +1.0% (23rd smallest increase)
Along with states like Michigan, Indiana, and Illinois, Ohio is one of several Midwestern states to have felt the decline of American manufacturing the most. While conditions have improved in some parts of the Rust Belt, unemployment remains relatively high in most of these states, including Ohio. The state’s unemployment rate as of June of 4.5% was tied with two other states — including Michigan for ninth worst in the country. Further evidence of the state’s ongoing economic difficulties, Ohio’s employment and GDP annual average growth rates were below the comparable national average over the last half decade.
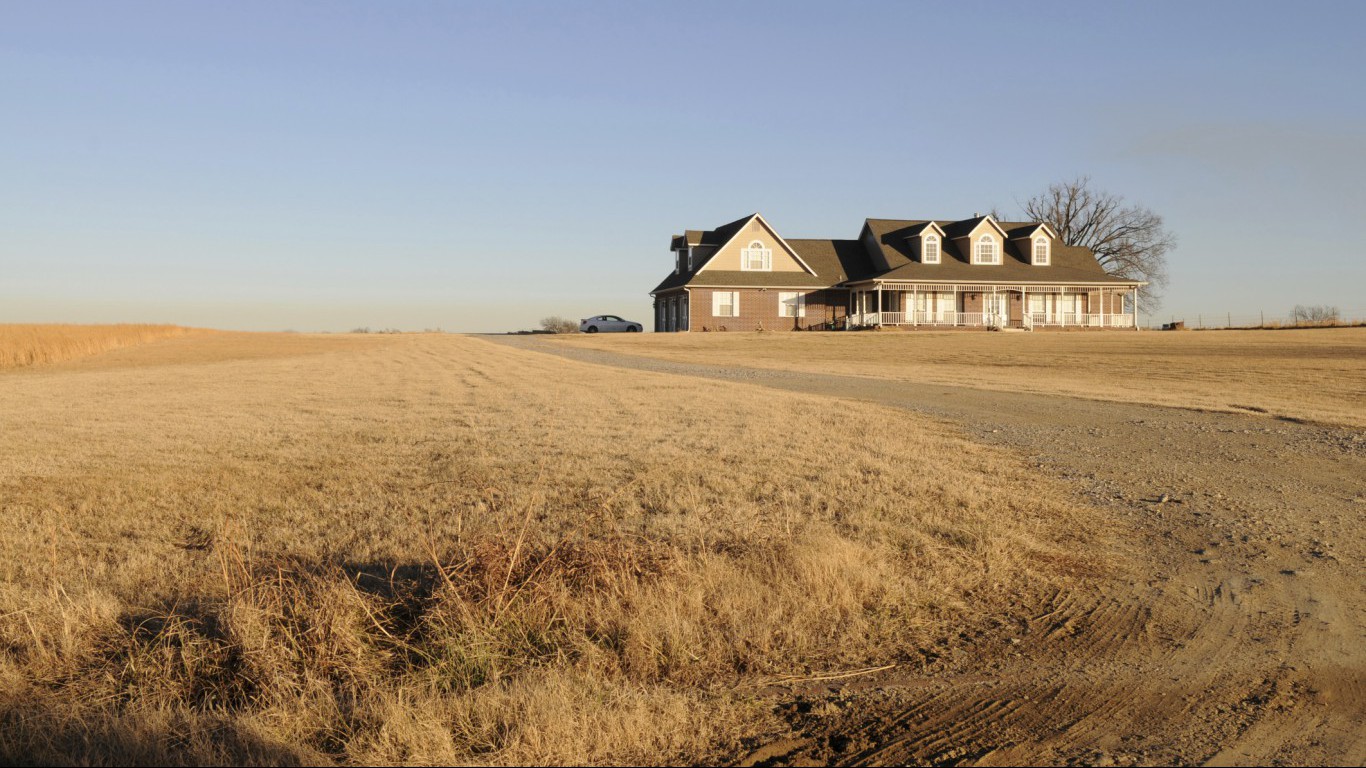
41. Oklahoma
> 5 yr. GDP annual growth rate: +1.5% (22nd largest increase)
> 2017 GDP: $175.1 billion (23rd smallest)
> June 2018 Unemployment: 3.9% (tied — 25th highest)
> 5 yr. annual employment growth: +0.5% (4th smallest increase)
The typical household in Oklahoma earns $49,176 a year, about $8,400 less than the median income nationwide. Adults without a college education are less likely to have a well paying job, and in Oklahoma, just 25.2% of the adult population has a four-year college education. Nationwide, 31.3% of adults have a bachelor’s degree.
Over the last five years, Oklahoma’s population grew by 3.0%, nearly in line with the 3.7% national population growth. Job growth in the state did not keep pace, however. In the last half decade, employment in in Oklahoma climbed just 0.5% per year on average, well below the 1.5% average annual national job growth over the same period.
[in-text-ad]
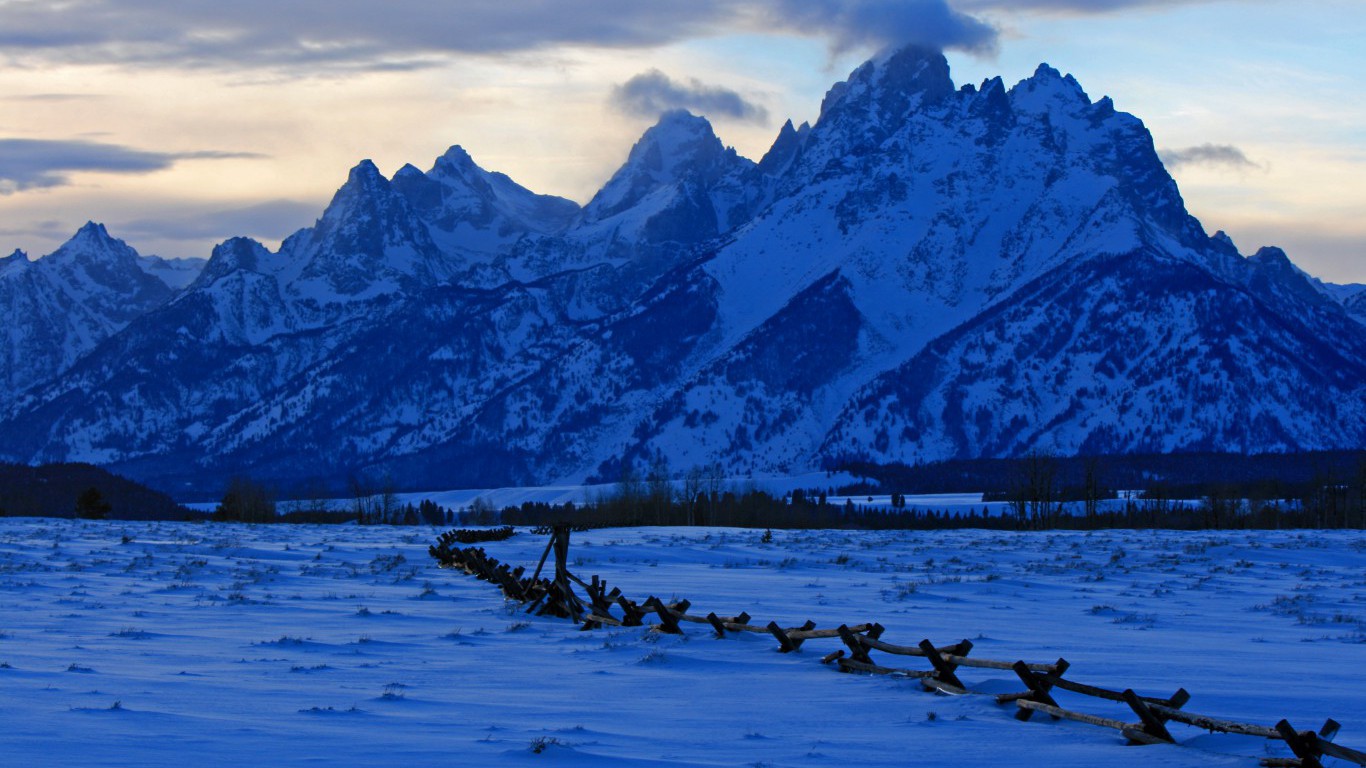
42. Wyoming
> 5 yr. GDP annual growth rate: +0.2% (the smallest increase)
> 2017 GDP: $35.4 billion (2nd smallest)
> June 2018 Unemployment: 3.7% (20th lowest)
> 5 yr. annual employment growth: -0.6% (the largest decrease)
The population of Wyoming increased by just 0.5% from 2012 to 2017, the eighth smallest increase of any state. Over the same period, the U.S. population increased by 3.7%. The sluggish population growth has likely hindered economic growth in Wyoming. The state’s GDP has grown at an average annual rate of just 0.2% over the past five years, a fraction of the 1.7% national growth rate and the smallest increase of any state.
In other measures of economic health, Wyoming ranks slightly above the majority of states. For example, an estimated 11.3% of residents live in poverty, below the 14.0% of Americans nationwide who live in poverty.

43. Arkansas
> 5 yr. GDP annual growth rate: +1.1% (18th smallest increase)
> 2017 GDP: $110.3 billion (17th smallest)
> June 2018 Unemployment: 3.8% (tied — 21st lowest)
> 5 yr. annual employment growth: +0.9% (14th smallest increase)
Arkansas is one of a number of Southern states with the worst economies in the country. The state’s educational attainment rate among adults is indicative of the economic problem Arkansas and many of its neighbors face — a relatively lower-skilled population with less disposable income. Just 22.4% of the state’s adults have a bachelor’s degree, the third lowest share among states. Arkansas’ poverty rate of 17.2% is the sixth highest among states and 3.2 percentage points above the national poverty rate.
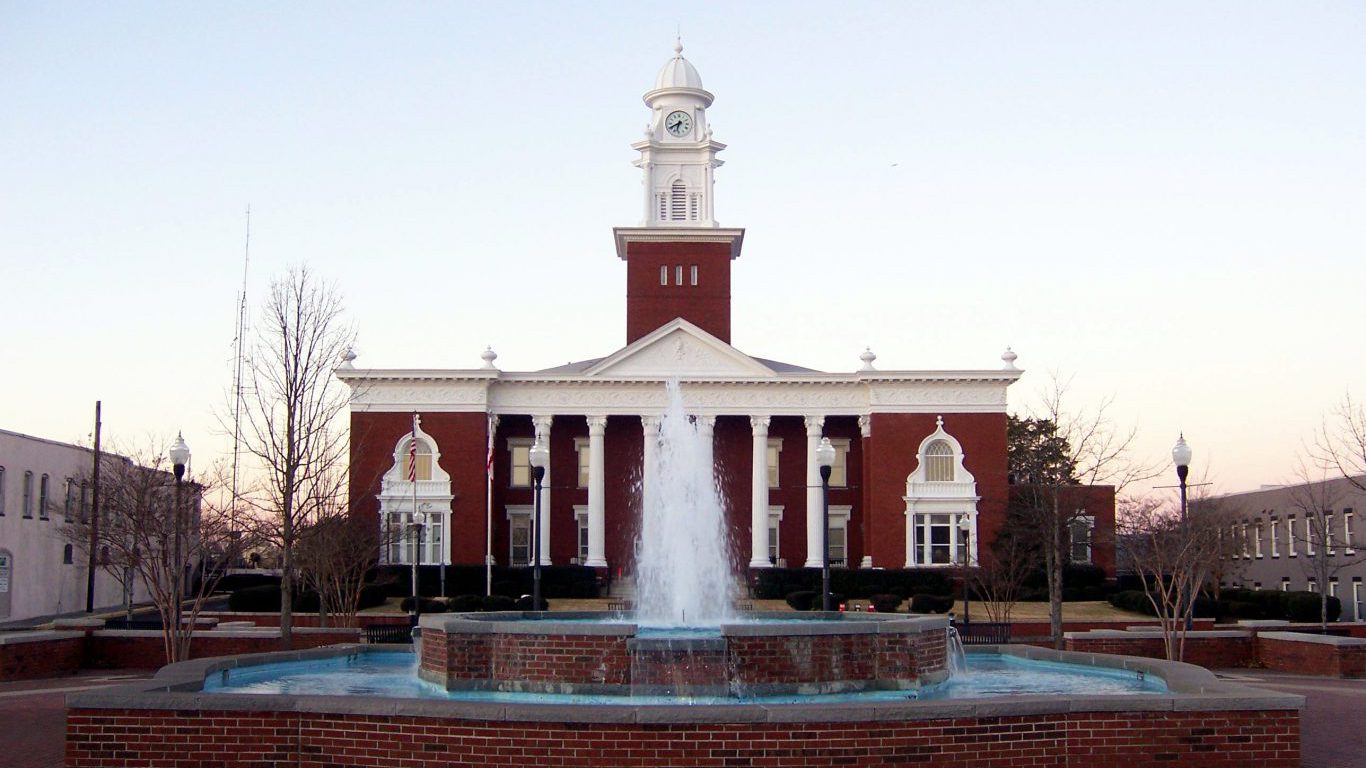
44. Alabama
> 5 yr. GDP annual growth rate: +0.7% (8th smallest increase)
> 2017 GDP: $182.8 billion (24th smallest)
> June 2018 Unemployment: 4.1% (tied — 21st highest)
> 5 yr. annual employment growth: +0.9% (17th smallest increase)
Alabama’s average annual GDP and employment growth rates were below those of most other states over the last five years. The state’s relatively slow growth is the least of its issues relative to economic health. The state’s population is relatively poor, uninsured, and among the most likely to be unemployed, all of which are indicators of a less than ideal consumer base.
State residents likely have relatively little disposable income to spend on nonessential items. The typical household in the state has an annual income of $46,257, roughly $11,000 below the national median household income.
[in-text-ad-2]

45. Kentucky
> 5 yr. GDP annual growth rate: +0.8% (11th smallest increase)
> 2017 GDP: $174.9 billion (22nd smallest)
> June 2018 Unemployment: 4.2% (tied — 18th highest)
> 5 yr. annual employment growth: +1.0% (20th smallest increase)
Over the last five years, Kentucky’s GDP grew by an annual average of just 0.8%, less than half the comparable 1.7% national GDP growth. This relatively slow economic growth is due in part to slow population growth. The state’s population expanded by just 1.6% in the last five years, less than half the 3.7% national population growth. Joblessness is also a problem for a larger than typical share of state residents. Some 4.2% of Kentucky’s labor force is unemployed, well above the 3.8% national unemployment rate. Over the last five years, the state’s mining and logging industry shed more than 10% of it’s jobs per year on average. The information industry as well as the government sector also reported falling employment over the same period.
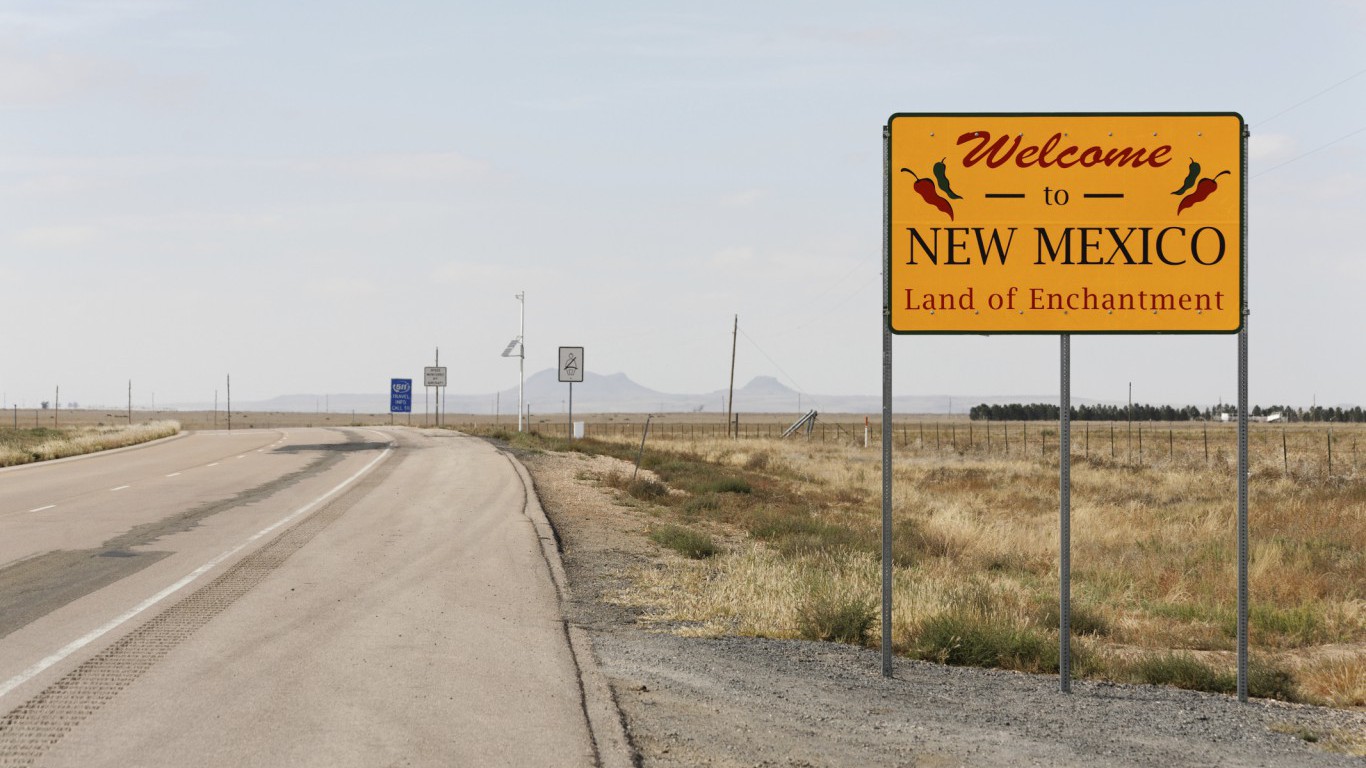
46. New Mexico
> 5 yr. GDP annual growth rate: +0.7% (6th smallest increase)
> 2017 GDP: $86.9 billion (14th smallest)
> June 2018 Unemployment: 4.9% (3rd highest)
> 5 yr. annual employment growth: +0.5% (6th smallest increase)
Nearly one in four New Mexico residents live in poverty, the third highest poverty rate of any U.S. state. One of the major causes of high poverty is high unemployment, and this might be the the case in this state. As of June 2018, New Mexico had an unemployment rate of 4.9%, the third highest unemployment rate in the country. The state’s poor job market has shown no sign of improvement in recent years. State employment grew at an annual average of just 0.53% from 2012 through 2017, barely one-third the national annual average employment growth rate of 1.49% over the same period.
[in-text-ad]
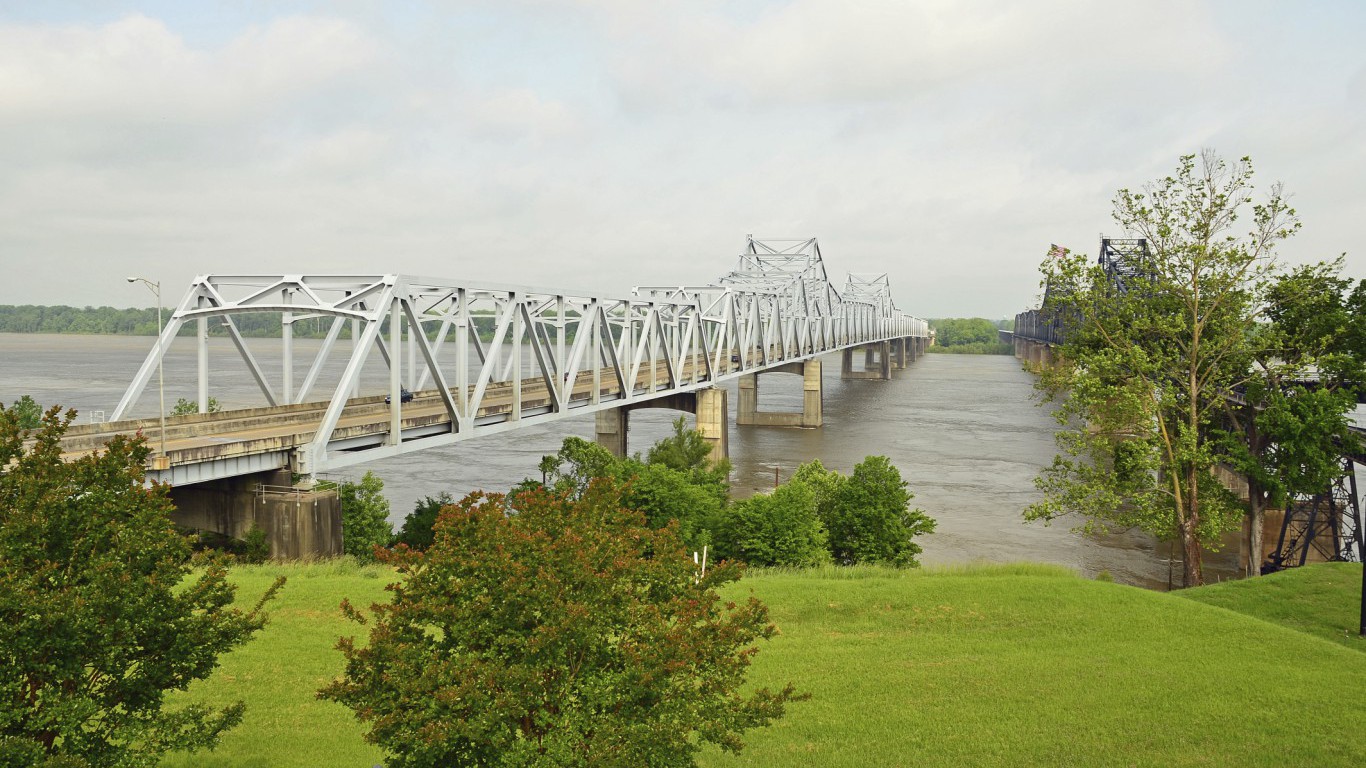
47. Mississippi
> 5 yr. GDP annual growth rate: +0.3% (2nd smallest increase)
> 2017 GDP: $96.8 billion (15th smallest)
> June 2018 Unemployment: 4.7% (tied — 4th highest)
> 5 yr. annual employment growth: +0.7% (11th smallest increase)
Mississippi’s population has remained effectively flat over the last five years. Partially as a result, economic growth in the state has been slow. The state’s GDP grew at annual average rate of just 0.3% from 2012 to 2017, five times slower than U.S. GDP growth rate over the same period. During the last five years, several industries in the state — including construction, mining and logging, and information — have shed jobs. Today, 4.7% of the state’s labor force is unemployed, well above the 3.8% U.S. unemployment rate.
Mississippi is the poorest state in the country — with both the lowest median household income and highest poverty rate among states. The typical household in Mississippi earns just $41,754 a year, nearly $16,000 less than the typical American household, and more than one in every five state residents lives in poverty. Nationwide, 14.0% of the population lives below the poverty line.

48. Louisiana
> 5 yr. GDP annual growth rate: -0.1% (3rd largest decrease)
> 2017 GDP: $207.9 billion (25th largest)
> June 2018 Unemployment: 4.7% (tied — 4th highest)
> 5 yr. annual employment growth: +0.4% (2nd smallest increase)
Louisiana is one of several states with largely resource-based economies to rank among the bottom five. The state’s employment in resource extraction is higher than the average nationwide, and petroleum refining and petroleum and coal products are far and away the state’s largest exports. The global dip in oil prices in 2014 that continued through 2016 likely hindered economic growth in the state. Over the last five years, the state’s GDP declined by an annual average of 0.1% — the third lowest five-year change of all states. The decline in economic output came despite a 1.8% population increase over the same period.
Joblessness is a considerable problem in Louisiana. The state’s 4.7% unemployment rate is among the highest in the country and well above the 3.8% U.S. unemployment rate.
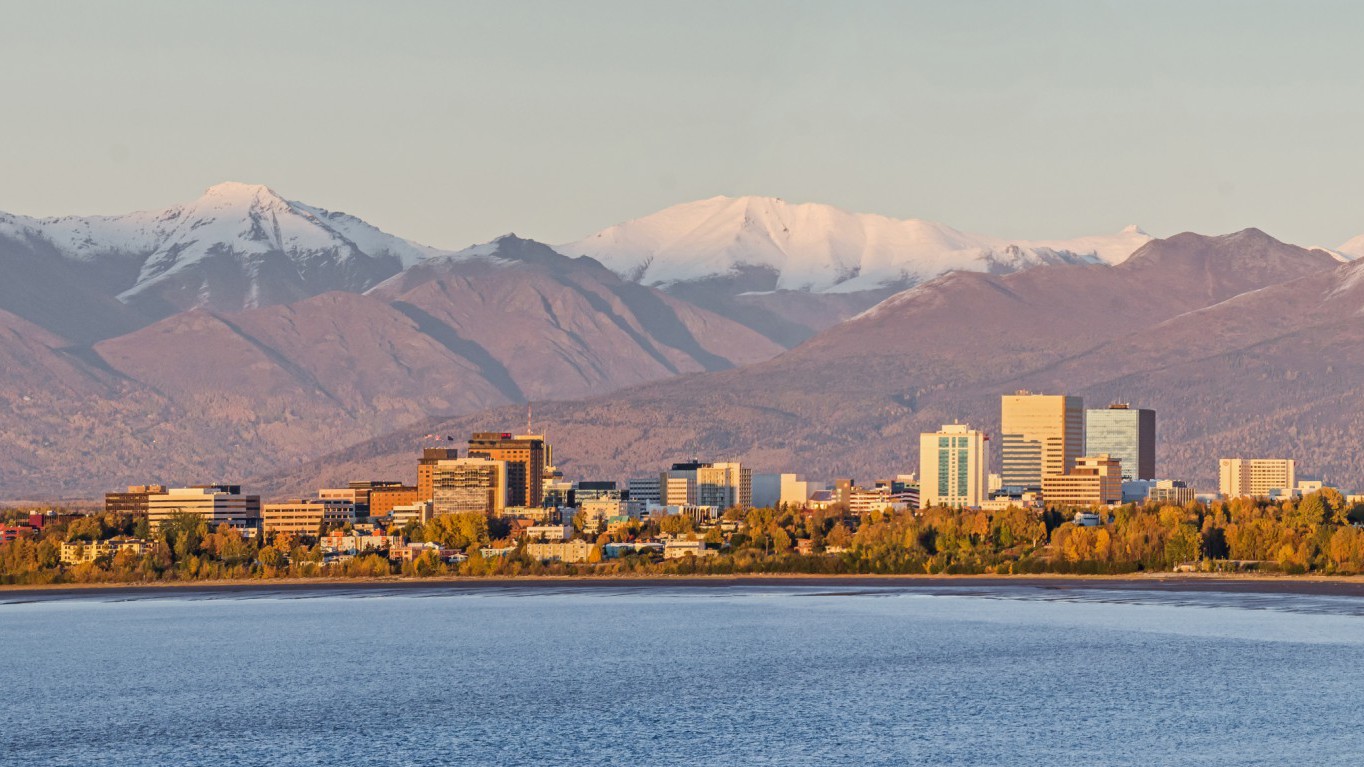
49. Alaska
> 5 yr. GDP annual growth rate: -2.2% (the largest decrease)
> 2017 GDP: $47.1 billion (5th smallest)
> June 2018 Unemployment: 7.1% (the highest)
> 5 yr. annual employment growth: -0.3% (3rd largest decrease)
Between 2014 and 2016, the price of a barrel of oil fell by over 50%. For Alaska, a state with some of the largest U.S. oil fields, the economic implications have been huge. Due to unfavorable economic conditions, an oil refinery near Fairbanks, once the largest in the state, was shut down in 2014. Over the last half decade, resource extraction shed a larger share of its workforce every year on average than any other industry in the state. Over the same period, Alaska’s economy contracted at an average rate of 2.2% a year, the largest decline of all states. For reference, U.S. GDP expanded at an average rate of 1.7% a year over the same period. Currently, 7.1% of Alaska’s workforce is unemployed, the highest unemployment rate of any state.
[in-text-ad-2]
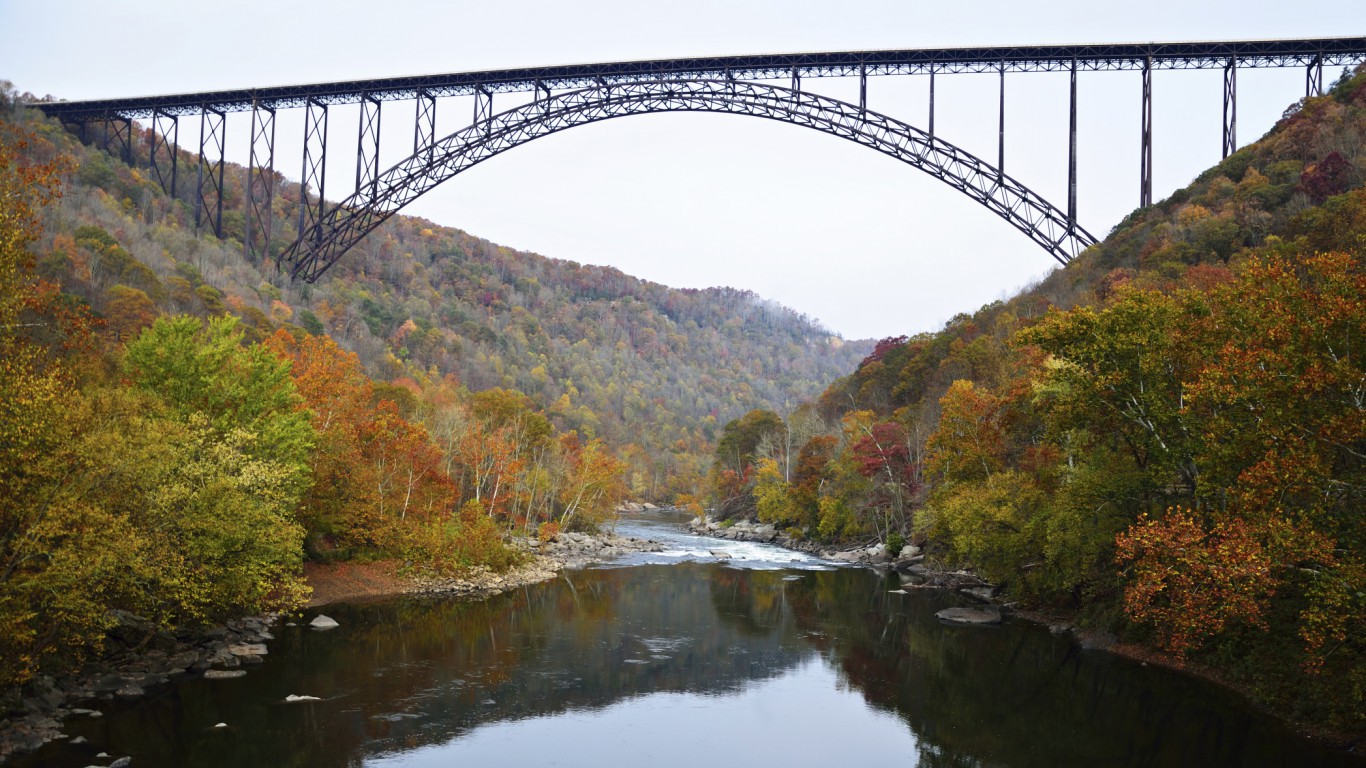
50. West Virginia
> 5 yr. GDP annual growth rate: +0.5% (4th smallest increase)
> 2017 GDP: $67.8 billion (11th smallest)
> June 2018 Unemployment: 5.3% (2nd highest)
> 5 yr. annual employment growth: -0.4% (2nd largest decrease)
No state population is shrinking faster than West Virginia’s.The state has lost some 2.1% of its population since 2012. A shrinking population can have considerable economic implications — not the least of which is decreased consumer spending. Partially as a result, West Virginia’s GDP has grown at an average annual rate of 0.5% over the last five years, well below the 1.7% average annual growth nationwide.
West Virginia’s relatively high unemployment rate — the 5.3% June rate was the second highest of any state in the country — is due in part to long term employment declines in several industries. For example, employment in the state’s construction industry fell by an annual average of 4.2% in the last five years. Similarly, mining and logging shed an average of 7.1% of its workforce annually since 2012. Wholesale trade and information were also among the industries cutting jobs in the state.
Methodology
To identify the states with the best and worst economies, 24/7 Wall St. reviewed for each state average annual GDP growth between 2012 and 2017 from the Bureau of Economic Analysis, the poverty rate from the U.S. Census Bureau’s 2016 American Community Survey, the unemployment rate in June 2018 from the Bureau of Labor Statistics, average annual employment growth rates between 2012 and 2017, and the percentage of adults (age 25+) with at least a bachelor’s degree.
In addition to the components of the ranking, we considered additional state data. GDP in 2017 and industry contribution to each state economy came from the BEA. Exports as a percentage of GDP, the homeownership rate, the median household income, median home value, and uninsured rate came from the U.S. Census Bureau’s 2016 American Community Survey. The affordability ratio of median home value to median household income is a 24/7 Wall St.
Retirement can be daunting, but it doesn’t need to be.
Imagine having an expert in your corner to help you with your financial goals. Someone to help you determine if you’re ahead, behind, or right on track. With SmartAsset, that’s not just a dream—it’s reality. This free tool connects you with pre-screened financial advisors who work in your best interests. It’s quick, it’s easy, so take the leap today and start planning smarter!
Don’t waste another minute; get started right here and help your retirement dreams become a retirement reality.
Thank you for reading! Have some feedback for us?
Contact the 24/7 Wall St. editorial team.