Special Report
Cities Where Incomes Are Growing the Fastest

Published:
Last Updated:

Income in the United States tends to grow more rapidly in and around major cities than in more rural areas. Real personal income in U.S. metro areas increased by 1.3% in 2016, six times the 0.2% growth in non-metro areas.
Urban economies vary by size, industrial composition, and presence of natural resources, and are each unique. And as such, income growth is not even from city to city.
Across the United States — in both urban and rural areas — per capita income climbed 0.4% in 2016. In some cities, however, per capita income growth topped 3% — with one metro area reporting per capita income growth above 6%.
24/7 Wall St. reviewed one-year change in per capita incomes in U.S. metro areas to identify the cities where incomes are growing the fastest. Per capita income is total personal income divided by the population.
Rapid per capita income growth does not necessarily mean these cities are thriving economically. Of the 25 cities on this list, only five have a higher per capita income than the United States as a whole. Additionally, despite climbing per capita income, most cities on this list have a higher unemployment rate than the national rate.
Click here to see the cities where incomes are growing the fastest.
Click here to see our detailed findings and methodology.
Correction: A previous version of this article erroneously referred to Jackson, Michigan as Jackson, Mississippi. That error has been corrected.

25. Lima, OH
> Per capita income growth in 2016: 3.0%
> 5 yr. per capita income growth: 8.0%
> Per capita income: $40,481
> May 2018 unemployment: 4.4%
Per capita income in the Lima, Ohio metro area grew 3.0% in 2016, from $39,315 to $40,481. Over the same period, U.S. income per capita rose from $44,255 to $44,450, a 0.4% increase. Like many cities where incomes are rising, Lima had major employment growth in advanced, high-wage industries over the past year. The number of professional and technical services jobs rose by 6.7% in 2016, more than twice the 2.5% growth in the sector nationwide. SImilarly, employment in real estate and rental and leasing grew by 7.8% in Lima, while sector employment grew 3.5% nationwide. The average annual wage increased by $1,828 in the professional and technical services sector and $3,088 in the real estate sector.

24. Provo-Orem, UT
> Per capita income growth in 2016: 3.0%
> 5 yr. per capita income growth: 24.8%
> Per capita income: $33,905
> May 2018 unemployment: 2.6%
Per capita income in the Provo-Orem metro area rose 3.0%, from $32,926 per capita in 2015 to $33,905 in 2016. Meanwhile, the U.S. income per capita rose from $44,255 to $44,450, a 0.4% increase. Income growth in the area may be due in part to falling unemployment. Since May 2015, the unemployment rate in Provo has fallen from 3.3% to 2.6%, nearly the lowest point in three decades.
One factor contributing to low unemployment and rising per capita income in Provo is the city’s strong tech sector. Provo is home to SIlicon Slopes, a growing cluster of technology companies that, together with Salt Lake City’s tech industry, led to Utah having the fastest tech job growth of any state over the past year. Today Vivint and Ancestry.com — two tech companies in Silicon Slope.– are the third and fourth largest employers in Provo.
23. Madera, CA
> Per capita income growth in 2016: 3.0%
> 5 yr. per capita income growth: 21.5%
> Per capita income: $35,954
> May 2018 unemployment: 7.0%
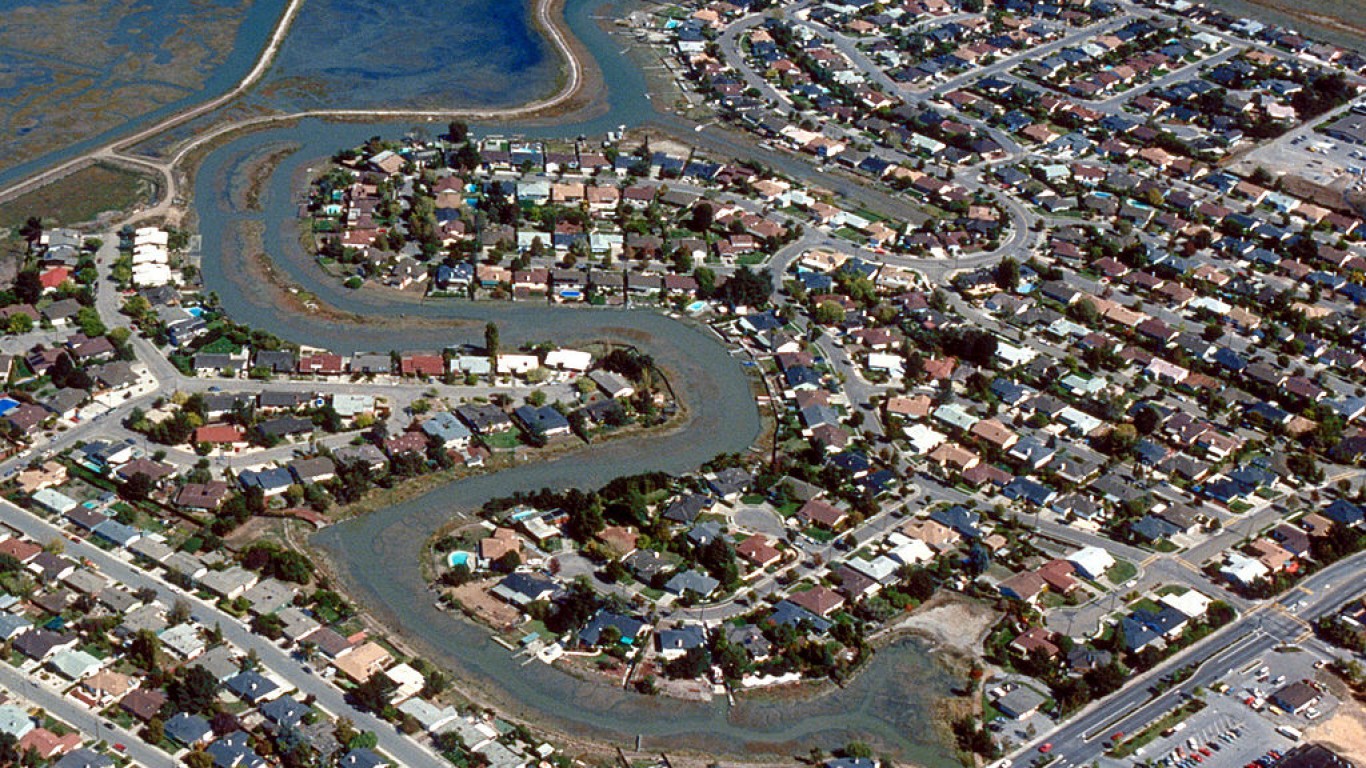
Incomes in the Madera metro area have increased steadily over the past decade. Per capita income rose 3.0%, from $34,894 in 2015 to $35,954 in 2016, nearly seven times the 0.4% national increase. Since 2009 income per capita in Madera has risen by 34.6%, the fifth largest increase of any metro area during that time.
Income growth in Madera is partially due to the metro area’s budding construction boom. Under the Rio Mesa Area Plan, Madera County has made made provisions for the construction of as many as 30,000 new homes over 30 years and a new city-sized development on the west side of Highway 41. Employment in the construction sector increased by 28.1% in 2016, and the average annual wage in the sector rose by $4,214, each among the largest increase of any metro area.

22. Lake Charles, LA
> Per capita income growth in 2016: 3.0%
> 5 yr. per capita income growth: 18.8%
> Per capita income: $46,070
> May 2018 unemployment: 3.7%
Per capita income in the Lake Charles metro area increased 3.0%, from $44,709 in 2015 to $46,070 in 2016, one of the largest spikes of any U.S. city. Over the same period, the national income per capita rose from $44,255 to $44,450, a 0.4% increase.
Income growth in the Lake Charles metro area is partially due to the area’s construction boom. The city has been the site of significant industrial investment in recent years, including gas-to-liquids refineries and the Golden Nugget Lake Charles casino. Employment in the construction sector rose by 32.7% in 2016, the largest increase of any city. The average annual wage in the Lake Charles construction sector rose $2,193, a larger increase than in a majority of cities.

21. Grand Forks, ND-MN
> Per capita income growth in 2016: 3.1%
> 5 yr. per capita income growth: 10.8%
> Per capita income: $46,306
> May 2018 unemployment: 2.6%
The 3.1% per capita income growth in the Grand Forks metropolitan area in 2016 represents a major improvement for the area, where per capita income declined in 2013 and 2014 and increased far less than the national economy did in 2015.
Grand Forks also has one of the healthiest job markets in the country. The state’s oil boom helped shield Grand Forks from the worst effects of the Great Recession, and unemployment in the metro area has continued to decline since peaking at 5.0% in September 2011. Today some 2.6% of the workforce is unemployed, far less than the 3.8% national rate and one of the lowest unemployment rates of any U.S. metro.
20. Atlantic City-Hammonton, NJ
> Per capita income growth in 2016: 3.1%
> 5 yr. per capita income growth: 8.2%
> Per capita income: $38,808
> May 2018 unemployment: 5.8%
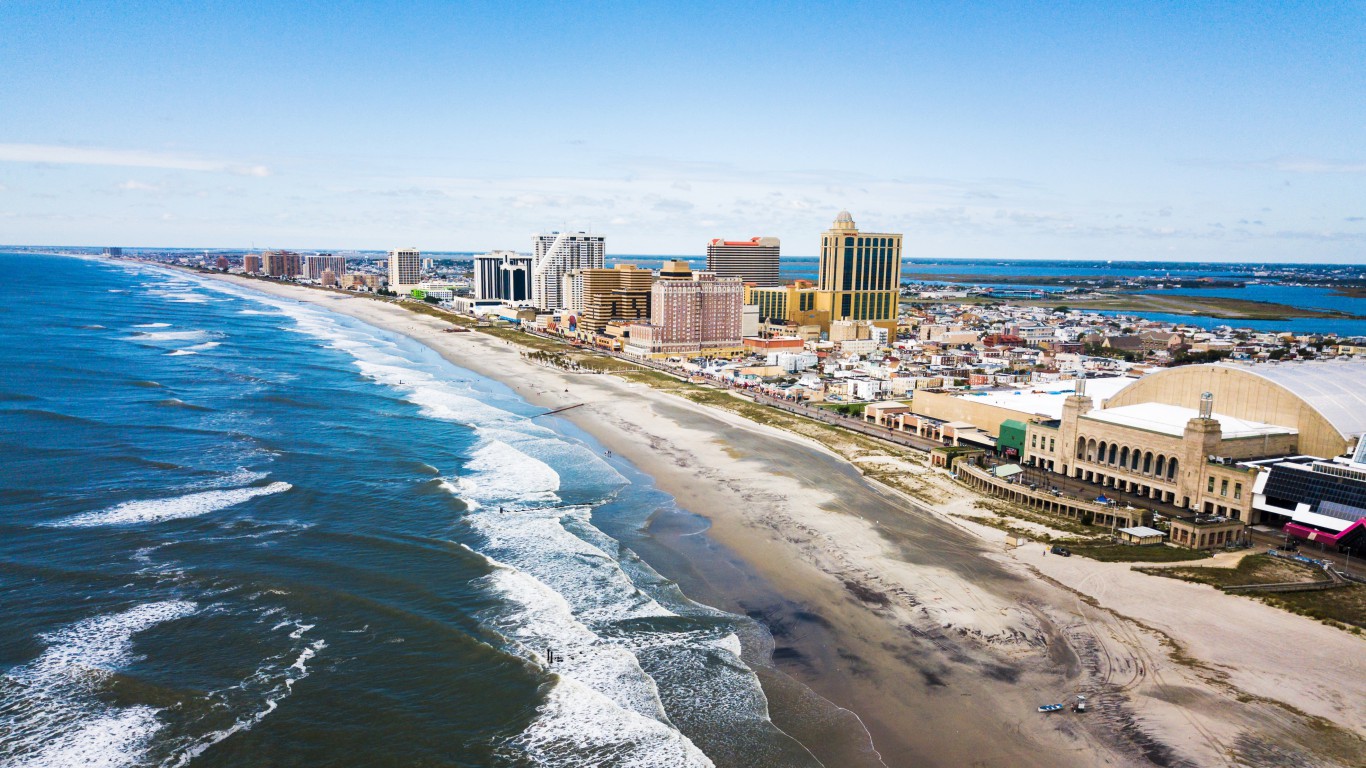
For the second straight year, the Atlantic City metro area’s income per capita grew by more than 3% in 2016. At the heart of the city’s economy is its entertainment and casino industry, and if its casinos’ revenue figures are any indication of overall income growth, the city’s 2017 figures will be as positive as those in 2016. According to preliminary reports, the city’s seven casinos reported a nearly $133 million increase in gross profit from 2016 to 2017 — despite the fact that one of the city’s largest casino resorts closed in October 2016.
[in-text-ad]

19. Dalton, GA
> Per capita income growth in 2016: 3.1%
> 5 yr. per capita income growth: 20.9%
> Per capita income: $36,820
> May 2018 unemployment: 4.6%
The origin of an estimated 85% of all carpets sold in the United States, the Dalton metro area — known as the “Carpet Capital of the World” — is largely dependent on the manufacturing industry. Some 38.0% of the Dalton workforce is currently employed in manufacturing, the second largest share of any U.S. metro area and more than four times the 8.6% share nationwide. While Dalton’s economy struggled as the national manufacturing industry contracted during the Great Recession — the unemployment rate rose from 4.2% in March 2007 to a peak of 13.4% in April 2009 — the metro area has experienced a resurgence in manufacturing activity in recent years.
High-tech carpet manufacturers such as Engineered Floors have made major investments in the area, creating thousands of new jobs. Employment in the manufacturing sector increased by 12.0% in 2016, the third most of any city, and income per capita rose by 3.1% — the 19th largest increase nationwide.

18. Niles-Benton Harbor, MI
> Per capita income growth in 2016: 3.1%
> 5 yr. per capita income growth: 11.6%
> Per capita income: $44,886
> May 2018 unemployment: 4.5%
Per capita income growth in the Niles-Benton Harbor metropolitan area, located in the southwestern corner of Michigan, has outpaced national income growth in each of the last four years. In 2016 per capita income grew 3.1% from $43,540 to $44,886, surpassing the U.S. per capita income of $44,450.
Some of the increase in per capita income in the metro area is not due to improving wages but to a population decline. As total income earned in Niles-Benton Harbor rose 2.7% between 2015 and 2016, the population of Niles fell by 0.4%.

17. Albany, GA
> Per capita income growth in 2016: 3.2%
> 5 yr. per capita income growth: 4.0%
> Per capita income: $38,933
> May 2018 unemployment: 4.5%
Per capita income in Albany, Georgia, climbed by 3.2% in 2016, eight times the national income growth that year. The rising per capita income in the metro area is due in part to population decline. While total incomes grew by 2.3%, the number of people living in Albany fell by 2.9%. Longer term per capita income growth is lagging in the metro area. Over the last five years, per capita income rose by just 4.0% in Albany, less than half the 9.0% increase nationwide.
The area’s rapid one-year per capita income growth has had a meaningful impact for a large share of Albany residents. For example, the percentage of households earning less than $10,000 fell from 15.3% in 2015 to 9.8% in 2016.
[in-text-ad-2]

16. Bloomsburg-Berwick, PA
> Per capita income growth in 2016: 3.2%
> 5 yr. per capita income growth: 5.9%
> Per capita income: $40,383
> May 2018 unemployment: 4.1%
In many of the metropolitan areas where per capita income increased in 2016, the increase was due not just to improving incomes, but to declining populations. The number of people living in the Bloomsburg-Berwick metropolitan area fell by about 0.5% in 2016, even as the national population grew by 0.5% over the same period. Stil, overall income in Bloomsburg increased by about 3% over the same period, about three times the national income growth in 2016. With rising incomes and a contracting population, income per capita increased 3.2% in the Bloomsburg-Berwick metro area in 2016.

15. Yakima, WA
> Per capita income growth in 2016: 3.4%
> 5 yr. per capita income growth: 15.9%
> Per capita income: $39,344
> May 2018 unemployment: 6.4%
The Yakima economy is largely centered around agriculture. Some 26.6% of the Yakima workforce is employed in agriculture, forestry, fishing, and hunting, the largest sector employment of any U.S. city other than Salinas, California. Income per capita has risen steadily in Yakima over the last half decade, and by 3.4% in 2016 — more than eight times the 0.4% national income per capita growth. Some factors contributing to economic growth in Yakima are the city’s budding wine industry and the good weather that extends the work period for seasonal agricultural workers.
[in-text-ad]

14. Monroe, LA
> Per capita income growth in 2016: 3.4%
> 5 yr. per capita income growth: 9.1%
> Per capita income: $40,614
> May 2018 unemployment: 5.1%
Per capita income climbed for the third consecutive year in Monroe, Louisiana, in 2016. After increasing by 3.4% in 2016, per capita income in the metro area stood at $40,614, crossing the $40,000 threshold for the first time.
Per capita income growth was driven partially by employment and wage growth in one of the metro area’s most dominant industries. Nearly one in every five private sector workers work in health care and social assistance. The industry’s 2.4% wage growth and its 1.2% employment growth from 2015 to 2016 likely contributed to the Monroe’s per capita income growth. Additionally, while the metro area’s 5.1% unemployment rate is high relative to the country as a whole, it is an improvement from its 2015 high of 7.4%.

13. Napa, CA
> Per capita income growth in 2016: 3.4%
> 5 yr. per capita income growth: 24.0%
> Per capita income: $48,988
> May 2018 unemployment: 3.1%
Across all private sector industries in the Napa metro area, wages climbed by 3.6% in 2016 — far faster than the 0.6% uptick in overall employment. Management, administrative, and educational services jobs reported some of the strongest wage growth in the metro area in 2016. Partially as a result, income per capita increased 3.4% the same year, more than in all but a dozen other metro areas nationwide. The 2016 income growth fits in with the longer term trend in the metro area as over the last half decade, income per capita grew by 24.0%. In comparison, per capita income nationwide grew by 9.0% over the last five years.

12. Pocatello, ID
> Per capita income growth in 2016: 3.4%
> 5 yr. per capita income growth: 12.3%
> Per capita income: $35,449
> May 2018 unemployment: 2.7%
Income per capita climbed in Pocatello, Idaho, from $34,268 in 2015 to $35,449 in 2016. The 3.4% increase was among the largest of any U.S. metro area and eight times the 0.4% national per capita income growth. The higher per capita income was driven in large part by private sector wage growth. Total wages across all private sector industries in Pocatello climbed 4.6% in 2016 — more than double the 2.2% employment growth.
The rising incomes played a considerable role in lifting metro area residents out of poverty. Pocatello’s poverty rate fell substantially from 25.3% in 2015 to 16.7% in 2016.
[in-text-ad-2]

11. Jackson, MI
> Per capita income growth in 2016: 3.5%
> 5 yr. per capita income growth: 13.2%
> Per capita income: $38,812
> May 2018 unemployment: 4.2%
Per capita income rose 3.5% in the Jackson metro area in 2016, a larger increase than in all but 10 other metro areas. 2016 was the fourth consecutive year of per capita income growth in the metro area, and as a result, per capita income increased 13.2% over the last half decade in the metro area, a greater increase than the 9.0% nationwide increase.
Income growth in Jackson was largely driven by the metro area’s private sector. Wages across all private sector industries climbed 4.4% in 2016, well more than double the 1.7% private sector employment growth over that period.

10. Kahului-Wailuku-Lahaina, HI
> Per capita income growth in 2016: 3.6%
> 5 yr. per capita income growth: 15.5%
> Per capita income: $37,909
> May 2018 unemployment: 2.1%
Employment in the Kahului-Wailuku-Lahaina metro area’s private sector climbed by 1.8% in 2016, while total wages increased 4.4%. Partially as a result, the metro area has one of the lowest unemployment rates in country at just 2.1%. Similarly, the metro area’s 3.6% per capita income growth in 2016 was faster than all but nine other U.S. metro areas.
Recent per capita income growth is a part of a longer term trend in Kahului-Wailuku-Lahaina. Over the last half decade, income per capita grew 15.5% — well above the 9.0% national growth over that time. Still, the metro area’s per capita income of $37,909 remains below the per capita income nationwide of $44,450.
[in-text-ad]

9. Lafayette-West Lafayette, IN
> Per capita income growth in 2016: 3.7%
> 5 yr. per capita income growth: 7.1%
> Per capita income: $35,808
> May 2018 unemployment: 3.2%
Lafayette-West Lafayette is one of four Indiana metro areas to report near nation-leading per capita income growth in 2016. Per capita income climbed 3.7%, from $34,540 in 2015 to $35,808 in 2016. Though the metro area’s per capita income has grown in each of the last three years, its five year per capita income growth of 7.1% lags behind the national growth of 9.0%.
As is the case in the other Indiana metro areas on this list, Lafayette-West Lafayette is a major manufacturing hub and home to facilities of several major companies including, Caterpillar, General Electric, and Subaru.

8. Bay City, MI
> Per capita income growth in 2016: 3.7%
> 5 yr. per capita income growth: 9.2%
> Per capita income: $41,160
> May 2018 unemployment: 5.1%
Bay City is one of three Michigan metro areas that had near nation-leading growth in per capita income in 2016. Per capita income in the metro area rose to $41,160 in 2016, up 3.7% from $39,675 in 2015. For comparison, per capita income climbed just 0.4% nationwide the same year. Despite the relatively rapid increase in 2016, over the last five years, the per capita income increase in Bay City of 9.2% closely aligns with the nationwide increase of 9.0%.
Like many other Midwestern metro areas on this list, Bay City has a substantial manufacturing sector. The area’s per capita wage growth was partially driven by manufacturing as wages in the industry increased by 5.0% in 2016, more than double the industry’s 1.9% employment growth that year.

7. Elkhart-Goshen, IN
> Per capita income growth in 2016: 3.8%
> 5 yr. per capita income growth: 24.7%
> Per capita income: $41,982
> May 2018 unemployment: 2.4%
Known as the “RV Capital of the World,” Elkhart is responsible for producing the majority of the world’s RVs. Some 50.7% of the Elkhart-Goshen workforce is employed in manufacturing, the largest share of any city. Elkhart’s economy struggled during the Great Recession as the national manufacturing industry contracted — the area’s unemployment rate rose from 4.3% in June 2007 to a recessionary peak of 19.6% in April 2009. However, thanks to a rebounding RV market there has been a resurgence in manufacturing activity in the metro area in recent years.
According to the Recreational Vehicle Industry Association, the number of RV shipments more than tripled from 165,700 in 2009 to 504,600 in 2017, the highest number on record. The average annual wage in the Elkhart manufacturing sector rose by $3,607 in 2016, more than six times the national wage growth. Overall per capita income rose by 3.8%, the seventh most of any U.S. metro area. The unemployment stands at just 2.4% as of May, nearly the lowest in the country.
[in-text-ad-2]

6. Bloomington, IN
> Per capita income growth in 2016: 3.8%
> 5 yr. per capita income growth: 11.9%
> Per capita income: $35,772
> May 2018 unemployment: 3.7%
Like a number of Indiana metropolitan areas, Bloomington had one of the largest increases in income per capita in the country in 2016 at 3.8%. It was the second straight year that per capita income grew by at least that much. In 2015, per capita income increased by 4.9%. Per capita income growth was driven in large part by rapid wage growth in the private sector. Wages climbed 3.8% across all private sector industries in the metro area in 2016, far outpacing 0.2% employment growth the same year.
The vast majority of metro areas with growing incomes are in places with relatively low educational attainment rates, but Bloomington is a notable exception. Nearly 40% of the metro area’s adults have a bachelor’s degree, compared to 31.3% of adults nationwide. Bloomington is home to the flagship campus of Indiana University, which, with close to 50,000 enrolled students, is one of the largest universities in the country.

5. Morristown, TN
> Per capita income growth in 2016: 4.1%
> 5 yr. per capita income growth: 9.7%
> Per capita income: $39,351
> May 2018 unemployment: 3.6%
Some 25.4% of Morristown’s workforce is employed in manufacturing, one of the largest shares of any U.S. city. Like many cities dependent on manufacturing, Morristown suffered substantial economic decline during the Great Recession. Unemployment rose from 4.3% in June 2007 to 13.3% in June 2009.
In recent years, however, Morristown has made a substantial comeback. Per capita income in the area rose by 4.1%, from $37,814 in 2015 to $39,351 in 2016, the fifth largest increase of any city. Unemployment has also fallen to 3.6%, now lower than the national unemployment rate of 3.8%.
[in-text-ad]

4. East Stroudsburg, PA
> Per capita income growth in 2016: 4.5%
> 5 yr. per capita income growth: 11.8%
> Per capita income: $36,534
> May 2018 unemployment: 4.9%
Per capita income growth has been has been inconsistent in the East Stroudsburg metropolitan area. Total area income per resident fell more than in most other metro areas in 2010 and 2012, but rose the eighth most of any metro area in 2013, and the fourth most in 2016. Overall, however, per capita income is up by 11.8% over the five years ending in 2016. The region, which comprises Monroe county in Pennsylvania, is one of the few with rising per capita incomes and below average poverty rates. Just 11.4% of area residents live below the poverty line, compared to 14.0% of Americans who do.

3. Muncie, IN
> Per capita income growth in 2016: 4.8%
> 5 yr. per capita income growth: 15.6%
> Per capita income: $35,993
> May 2018 unemployment: 3.9%
Muncie is one of many Rust Belt cities in which the growth of new industries and the shift from manufacturing to education, health care, and other service-driven sectors has contributed to economic recovery and income growth. While unemployment in Munie rose from 5.1% in June 2007 to a post-recession peak of 12.2% in March 2010, the share of unemployed workers has since fallen to 3.9% — in line with the 3.8% national jobless rate.
In addition to a strengthening job market, a shrinking population helped boost per capita income on Muncie. The metro area’s population contracted 1.1% in 2016 as total personal income climbed 4.5%. Partially as a result, per capita income rose 4.8%, from $34,333 in 2015 to $35,993 in 2016, the third largest increase of any U.S. city.

2. Yuma, AZ
> Per capita income growth in 2016: 5.0%
> 5 yr. per capita income growth: 17.1%
> Per capita income: $33,140
> May 2018 unemployment: 16.2%
Yuma, Arizona’s 5.0% increase in per capita income is the second largest such increase among metropolitan areas in 2016. Even more impressively, the area’s 9.9% per capita income growth in 2015 was the largest such increase among the nation’s metropolitan areas that year.
Despite recent increases in per capita income, Yuma has had one of the least favorable economies in the country for years. Its monthly unemployment rate has averaged over 22% since 1990, and its most recent monthly rate of 16.2% is second highest among metro areas. Even with those per capita income improvements, Yuma’s per capita income of $33,140 is still 10th lowest among metropolitan areas.
[in-text-ad-2]

1. Jacksonville, NC
> Per capita income growth in 2016: 6.5%
> 5 yr. per capita income growth: 1.6%
> Per capita income: $46,514
> May 2018 unemployment: 4.6%
Jacksonville had the largest increase in per capita income growth in the country, but that increase is only effectively a rebound from the preceding half decade. Per capita income in the metropolitan area either declined or trailed national growth each year from 2011 through 2015. Between 2010 and 2016, per capita income in the metro area increased by a net of just 1.6%. Nationwide, per capita income is up 9.0% over the last half decade. Still, unlike most metropolitan areas on this list, Jacksonville’s per capita income of $46,514 exceeds the U.S. figure of $44,450.
Detailed Findings
Many of the cities on this list are able to have nation-leading per capita income growth because per capita incomes there were low to begin with — due in no small part to damage done by the recession. As was the case nationwide, incomes dipped in 20 of the 25 cities on this list in 2009. Additionally, Jacksonville, North Carolina and Napa, California are the only two cities on this list that had higher per capita incomes than the nation as a whole that year.
Many cities on this list, particularly those in the Midwest, have strong manufacturing sectors — an industry that was hit especially hard during the recession. But the sector has rebounded since, and manufacturing hubs like Elkhart-Goshen, Indiana and Dalton, Georgia reported double-digit wage growth in their manufacturing sectors in 2016.
Nationwide, wage growth in the private sector accounted for much of the overall growth in per capita income. In every metro area on this list, wages across all private sector industries rose anywhere from 0.4% to 10.5%. Muncie, Indiana, is the only metro area on this list where private sector employment grew at a faster rate than private sector wages in 2016.
Climbing per capita incomes in major American cities can produce significant, tangible benefits — not the least of which is reducing the poverty rate. In 17 of the 25 cities on this list, the poverty rate fell from 2015 to 2016. In 10 metro areas with rapidly increasing per capita incomes, poverty declined by at least a percentage point. In Pocatello, Idaho, the poverty rate fell by 8.6 percentage points in 2016, the largest improvement of any U.S. metro area.
For the most part, per capita income growth in the cities on this list fit into a long term trend. Every city on this list has positive per capita income growth over the last five years.
Methodology
To identify the cities where incomes are growing the fastest, 24/7 Wall St. reviewed the largest real personal income per capita increases in 2016 among the nation’s 382 metropolitan statistical areas with data from the Bureau of Economic Analysis. Real personal income also came from the BEA. The BEA’s income figures for each year starting in 2008 were reviewed as well, all adjusted for inflation, chained to 2009 dollars. The share of each MSA’s workforce employed in each industry in 2015, 2016, and 2017, as well as average wages by industry for each MSA, came from the Quarterly Census of Employment and Wages, a program of the Bureau of Labor Statistics. Unemployment rates also came from the BLS. Population growth, median household income, poverty rates, the percentage of households earning at least $200,000 and less than $10,000, and SNAP recipiency came from the American Community Survey.
Finding a qualified financial advisor doesn’t have to be hard. SmartAsset’s free tool matches you with up to 3 fiduciary financial advisors in your area in 5 minutes. Each advisor has been vetted by SmartAsset and is held to a fiduciary standard to act in your best interests. If you’re ready to be matched with local advisors that can help you achieve your financial goals, get started now.
Thank you for reading! Have some feedback for us?
Contact the 24/7 Wall St. editorial team.