Special Report
Counties With the Worst Drug Problem in Every State

Published:
Last Updated:
Drug overdoses killed 72,000 Americans last year, a 10% increase from 2016 and the highest death toll from drugs in U.S. history. These preliminary findings from the Centers for Disease Control and Prevention reflect the ongoing public health crisis of the opioid epidemic and the spread of especially dangerous synthetic opioids like fentanyl.
In October 2017, President Donald Trump declared the opioid crisis a national public health emergency. The declaration followed an approximately fivefold increase in drug overdose deaths involving opioids from 2000 to 2016. Over that period, more than 600,000 Americans died from drug overdoses.
The death toll from drug overdoses in 2016 alone surpassed AIDS-related deaths in the epidemic’s worst year in 1995 and the entirety of American lives lost in the Vietnam War. While the opioid epidemic has taken lives and torn through nearly every community in America, some parts of the country have been affected far worse than others. The most vulnerable areas are often those with low incomes and low educational attainment as well as high poverty and unemployment.
To determine the counties with the worst drug problem in every state, 24/7 Wall St. reviewed the number of drug-induced deaths — these include unintentional overdoses, suicide, homicide, and undetermined causes — per 100,000 residents for the period 2012 to 2016 with data from the CDC’s WONDER web application.
Click here to see the full list of list of the counties with the worst drug problem in every state.
Click here to see our detailed findings and methodology.
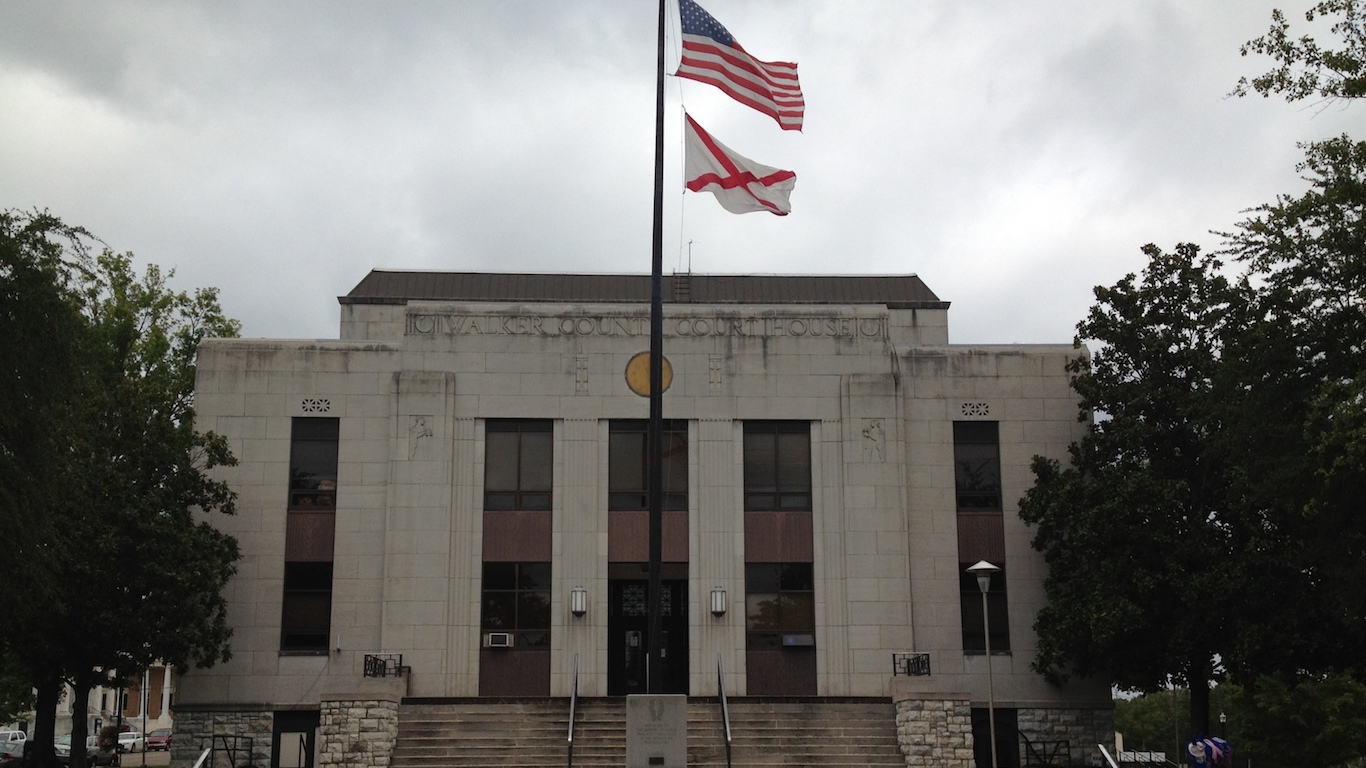
1. Walker County, Alabama
> Annual drug deaths per 100,000 residents: 47.5 (county) 16.0 (state)
> Drug-related deaths, 2012-16: 160 (county) 3,113 (state)
> Poverty rate: 21.9%
> Population 65,593
[in-text-ad]

2. Anchorage Borough, Alaska
> Annual drug deaths per 100,000 residents: 18.2 (county) 17.0 (state)
> Drug-related deaths, 2012-16: 261 (county) 502 (state)
> Poverty rate: 8.1%
> Population 299,321
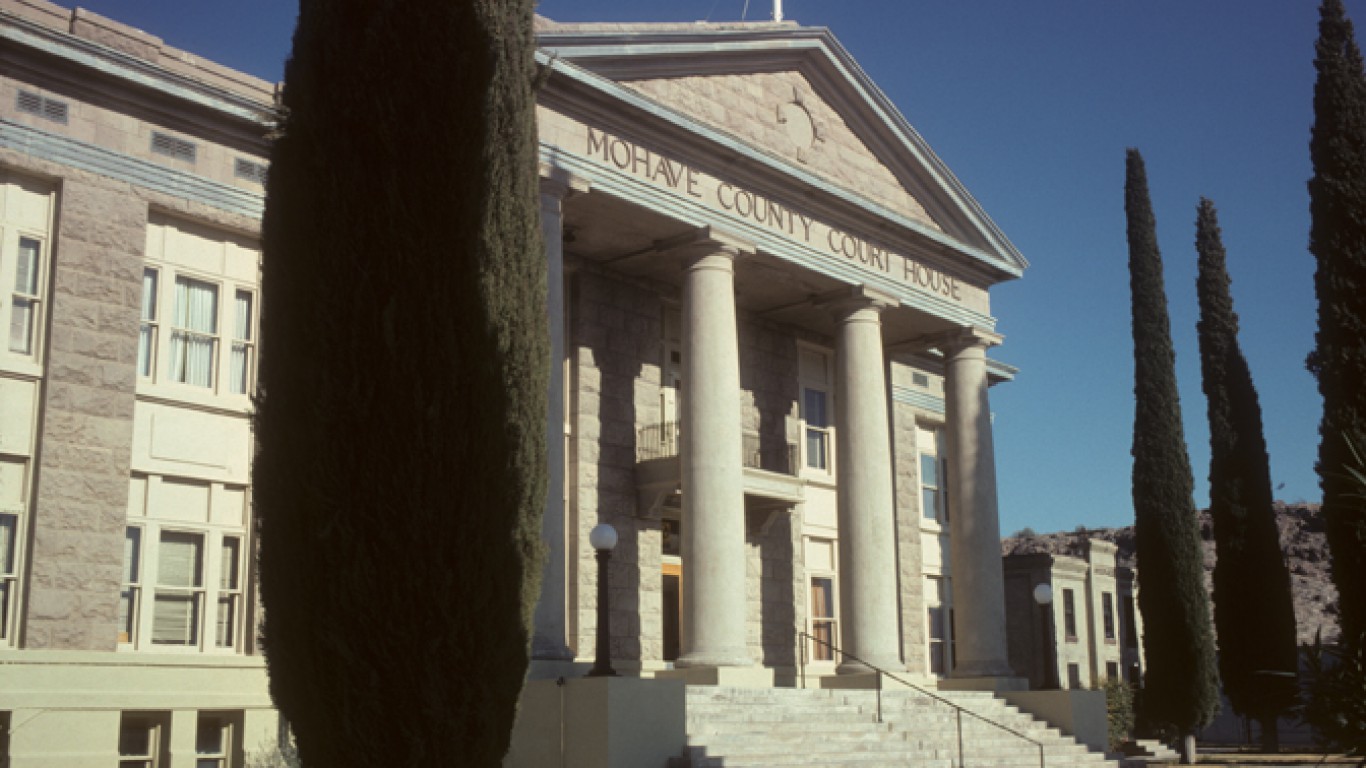
3. Mohave County, Arizona
> Annual drug deaths per 100,000 residents: 24.2 (county) 20.0 (state)
> Drug-related deaths, 2012-16: 243 (county) 5,429 (state)
> Poverty rate: 19.3%
> Population 203,629

[in-text-ad-2]

5. Lake County, California
> Annual drug deaths per 100,000 residents: 43.2 (county) 12.7 (state)
> Drug-related deaths, 2012-16: 139 (county) 19,682 (state)
> Poverty rate: 24.6%
> Population 64,076

6. Denver County, Colorado
> Annual drug deaths per 100,000 residents: 27.0 (county) 16.9 (state)
> Drug-related deaths, 2012-16: 797 (county) 3,647 (state)
> Poverty rate: 16.4%
> Population 663,303
[in-text-ad]

7. New Haven County, Connecticut
> Annual drug deaths per 100,000 residents: 14.4 (county) 21.3 (state)
> Drug-related deaths, 2012-16: 618 (county) 3,063 (state)
> Poverty rate: 12.8%
> Population 860,874

8. Sussex County, Delaware
> Annual drug deaths per 100,000 residents: 16.1 (county) 23.1 (state)
> Drug-related deaths, 2012-16: 156 (county) 870 (state)
> Poverty rate: 12.9%
> Population 211,224
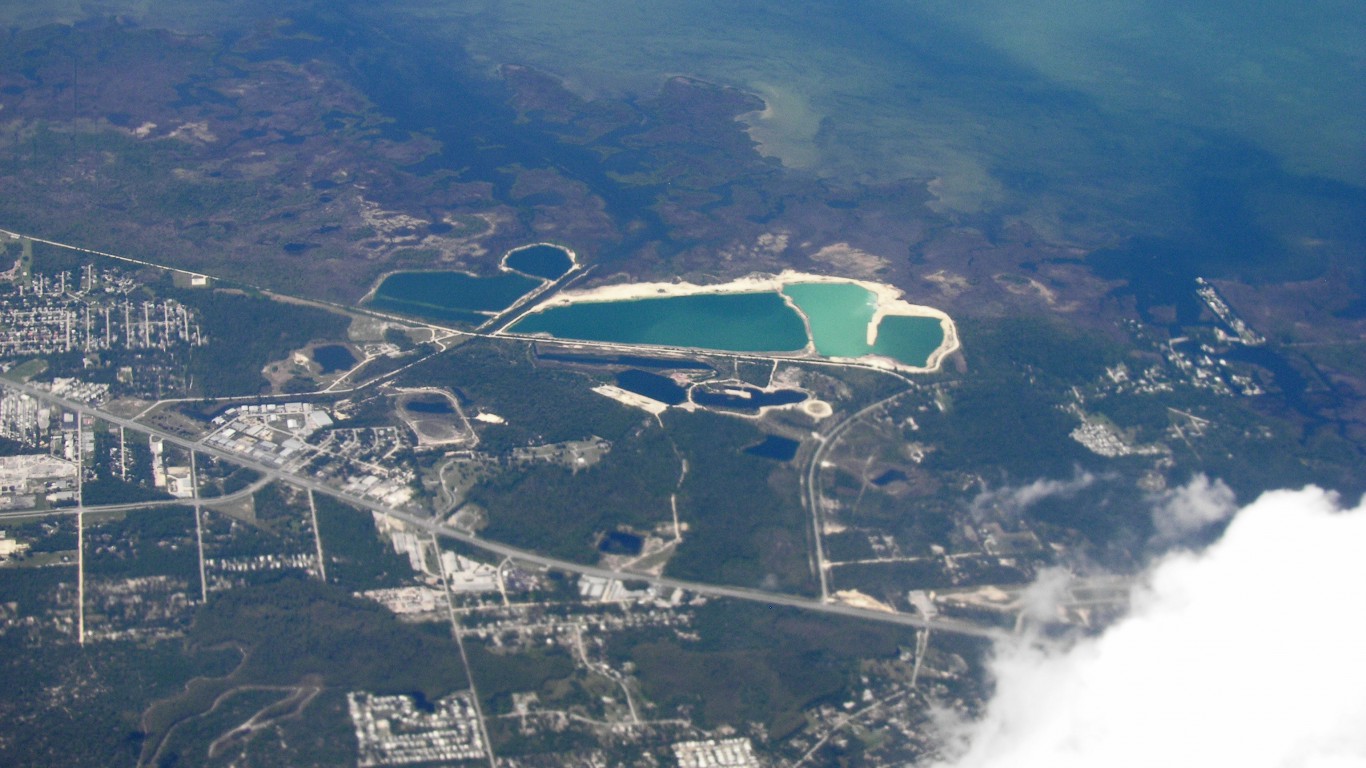
9. Pasco County, Florida
> Annual drug deaths per 100,000 residents: 34.1 (county) 17.1 (state)
> Drug-related deaths, 2012-16: 788 (county) 13,747 (state)
> Poverty rate: 13.6%
> Population 488,310
[in-text-ad-2]

10. Haralson County, Georgia
> Annual drug deaths per 100,000 residents: 34.9 (county) 12.9 (state)
> Drug-related deaths, 2012-16: 50 (county) 5,259 (state)
> Poverty rate: 20.3%
> Population 28,667

11. Hawaii County, Hawaii
> Annual drug deaths per 100,000 residents: 13.0 (county) 12.7 (state)
> Drug-related deaths, 2012-16: 119 (county) 723 (state)
> Poverty rate: 18.7%
> Population 193,680
[in-text-ad]

12. Gem County, Idaho
> Annual drug deaths per 100,000 residents: 25.0 (county) 14.0 (state)
> Drug-related deaths, 2012-16: 21 (county) 919 (state)
> Poverty rate: 22.2%
> Population 16,853
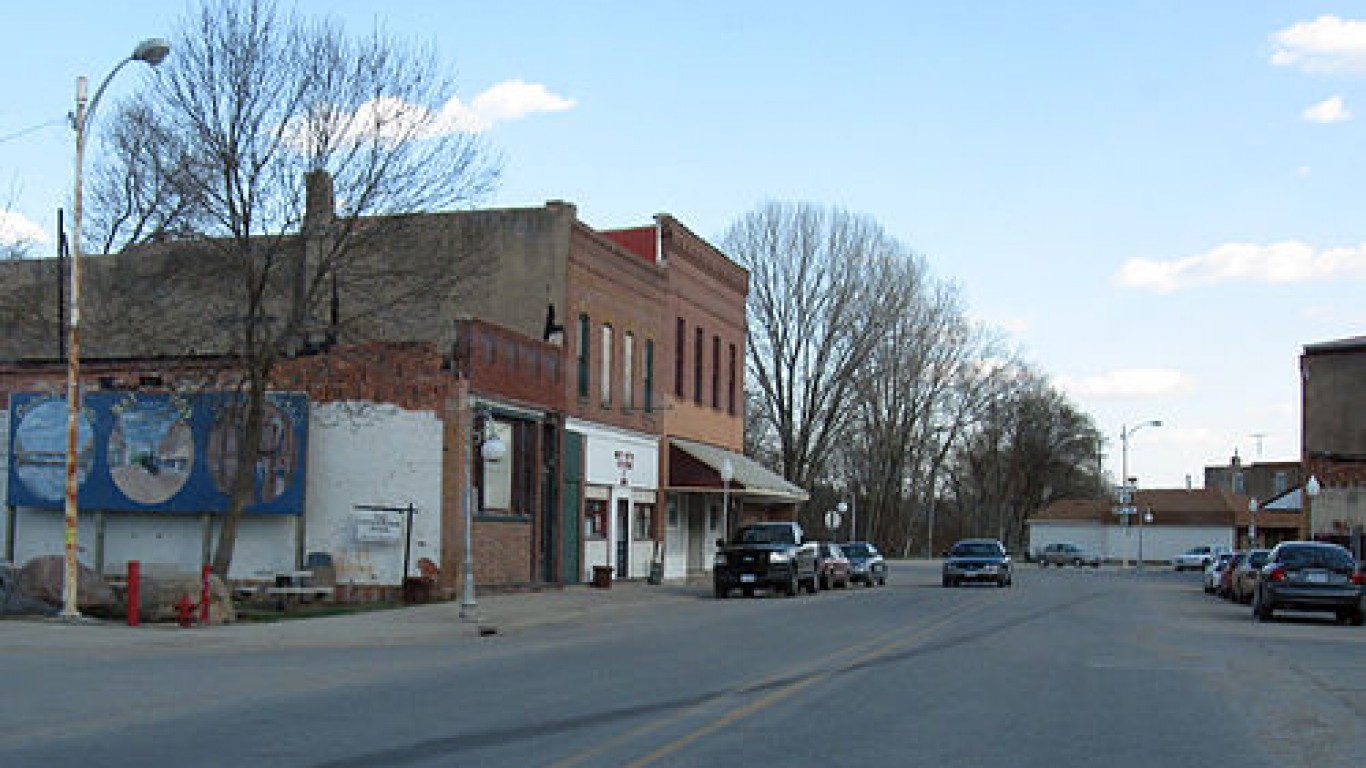
13. Saline County, Illinois
> Annual drug deaths per 100,000 residents: 23.9 (county) 14.9 (state)
> Drug-related deaths, 2012-16: 30 (county) 7,670 (state)
> Poverty rate: 22.3%
> Population 24,659

[in-text-ad-2]
15. Webster County, Iowa
> Annual drug deaths per 100,000 residents: 15.7 (county) 9.9 (state)
> Drug-related deaths, 2012-16: 30 (county) 1,230 (state)
> Poverty rate: 15.7%
> Population 37,050
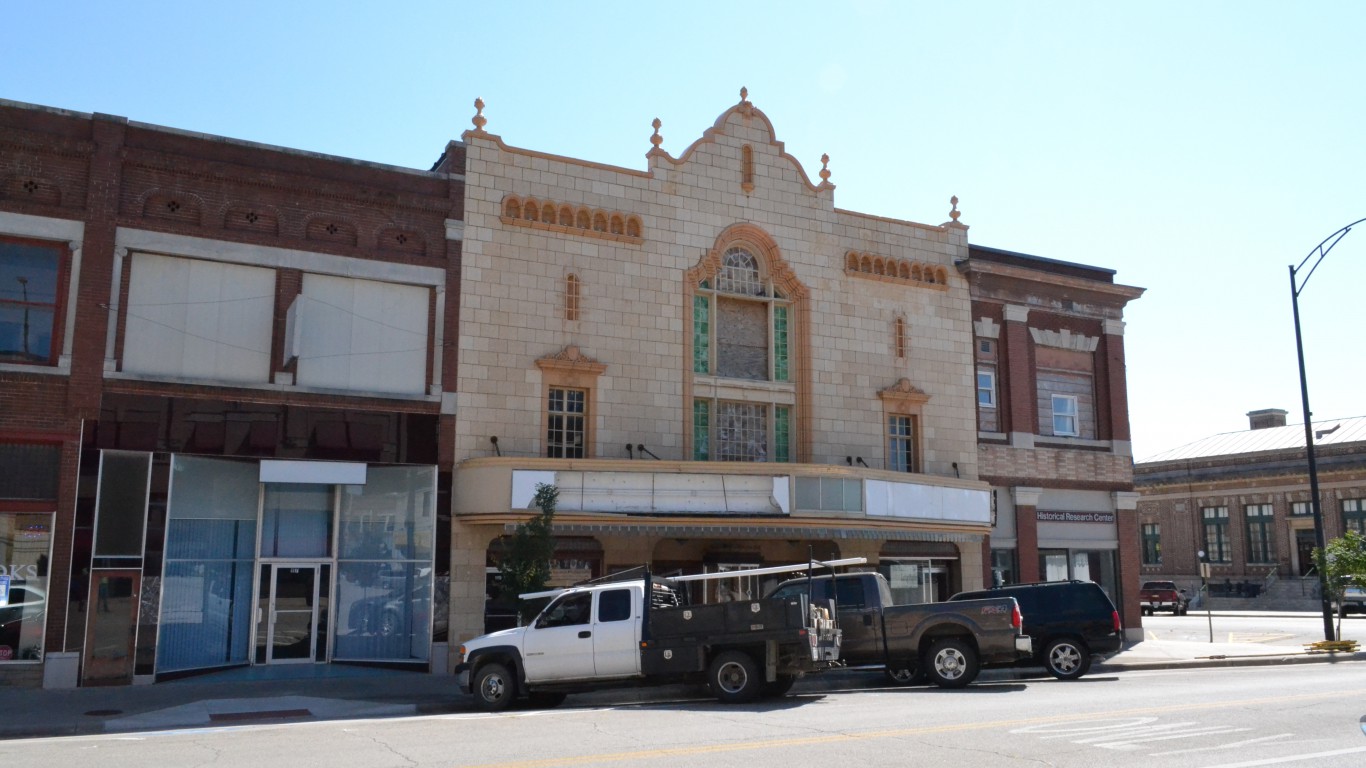
16. Montgomery County, Kansas
> Annual drug deaths per 100,000 residents: 17.5 (county) 11.9 (state)
> Drug-related deaths, 2012-16: 31 (county) 1,387 (state)
> Poverty rate: 19.0%
> Population 33,765
[in-text-ad]
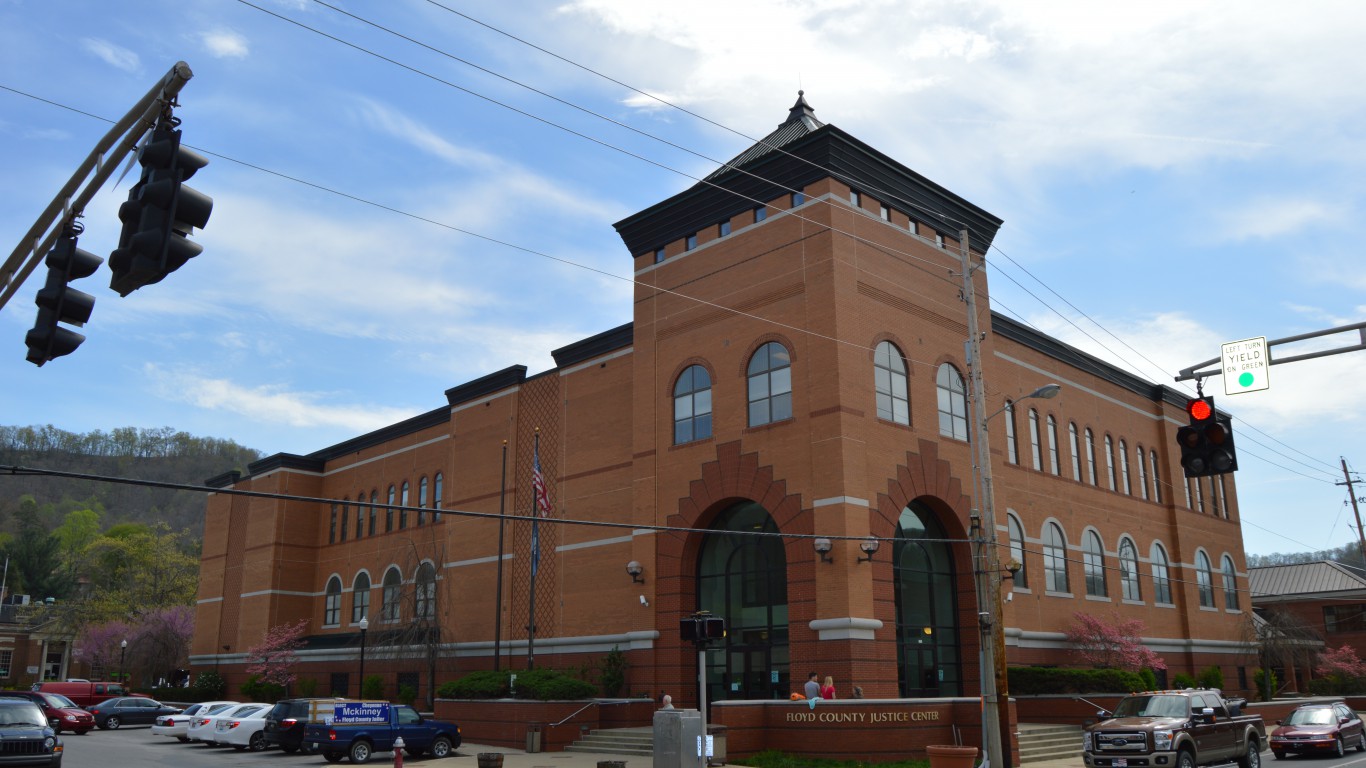
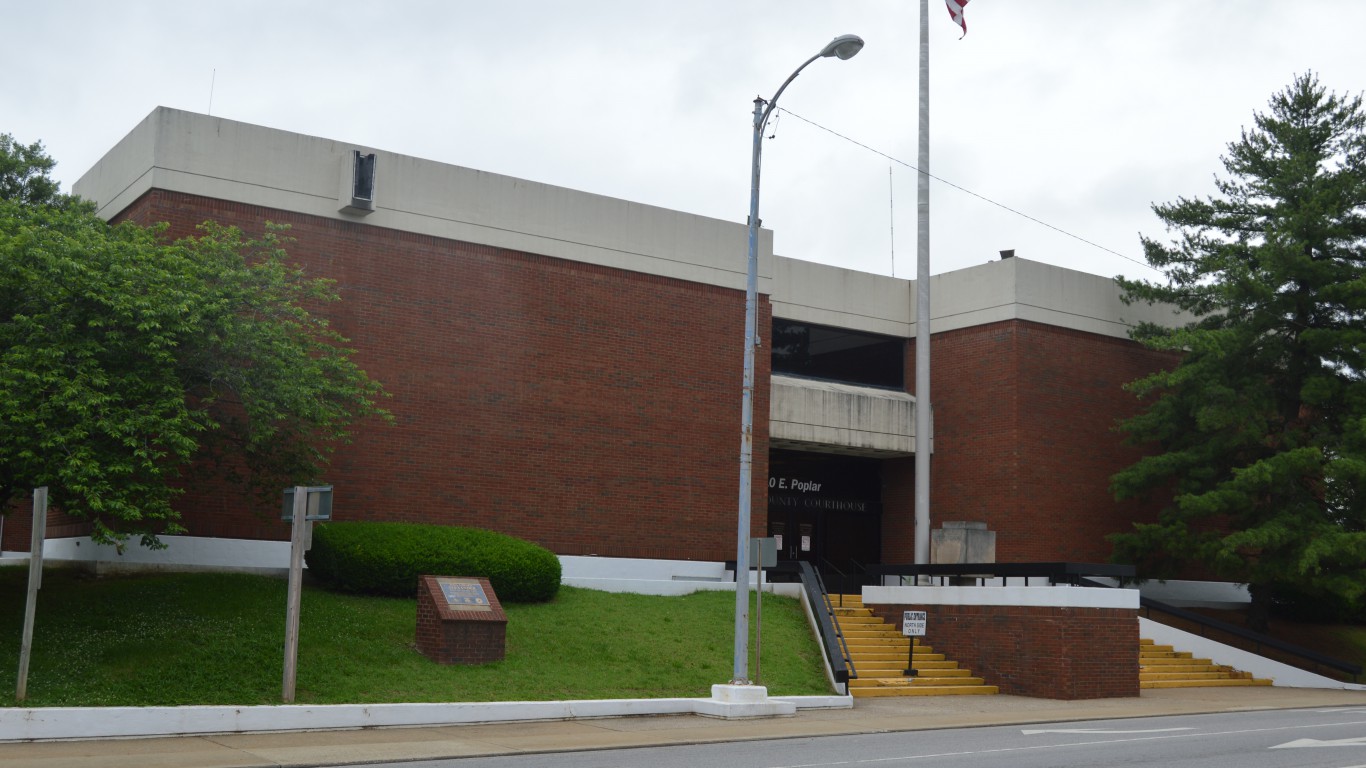
17. Floyd County, Kentucky
> Annual drug deaths per 100,000 residents: 68.5 (county) 28.5 (state)
> Drug-related deaths, 2012-16: 136 (county) 5,034 (state)
> Poverty rate: 30.7%
> Population 38,144
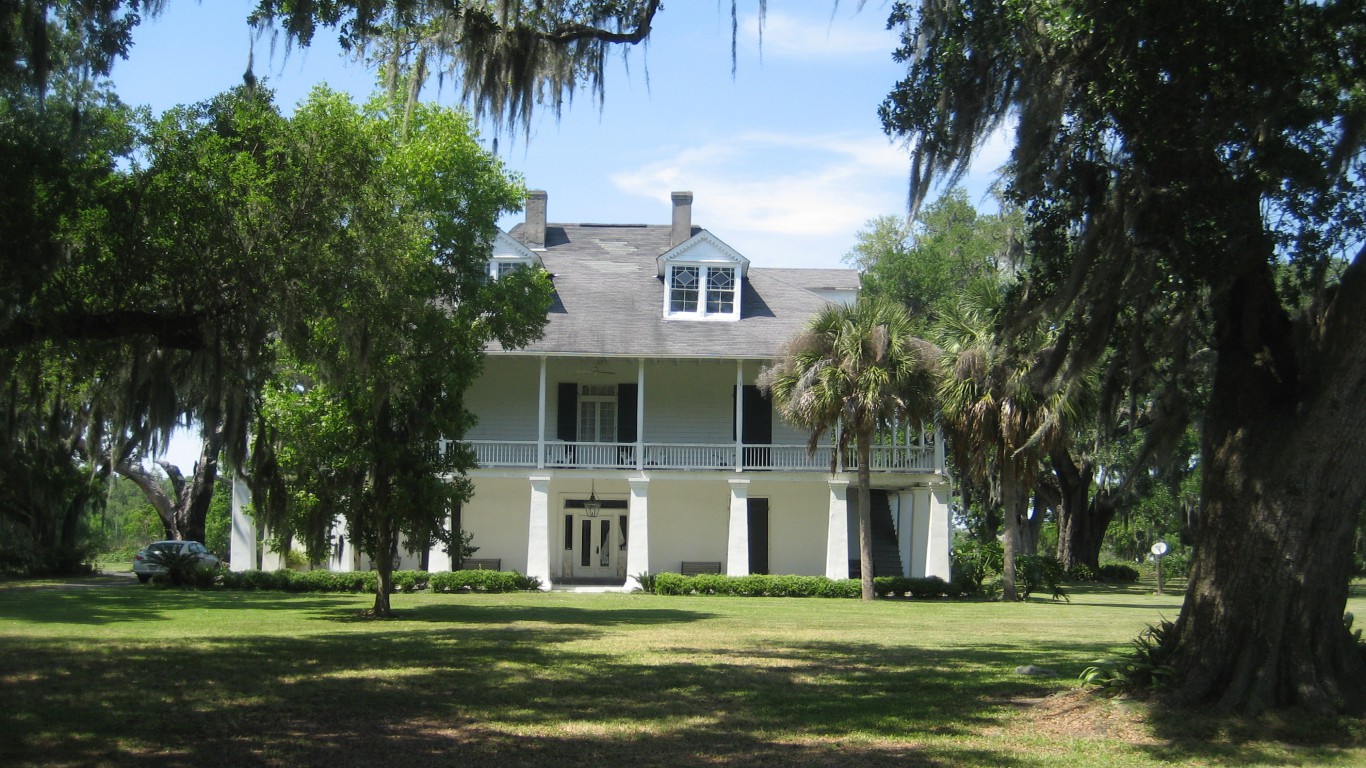
18. St. Bernard Parish, Louisiana
> Annual drug deaths per 100,000 residents: 44.8 (county) 19.2 (state)
> Drug-related deaths, 2012-16: 72 (county) 3,583 (state)
> Poverty rate: 20.1%
> Population 44,091
19. Washington County, Maine
> Annual drug deaths per 100,000 residents: 15.7 (county) 19.9 (state)
> Drug-related deaths, 2012-16: 26 (county) 1,057 (state)
> Poverty rate: 18.0%
> Population 31,925
[in-text-ad-2]

20. Baltimore city, Maryland
> Annual drug deaths per 100,000 residents: 30.1 (county) 22.6 (state)
> Drug-related deaths, 2012-16: 934 (county) 5,412 (state)
> Poverty rate: 23.1%
> Population 621,000

21. Bristol County, Massachusetts
> Annual drug deaths per 100,000 residents: 20.2 (county) 25.3 (state)
> Drug-related deaths, 2012-16: 554 (county) 6,832 (state)
> Poverty rate: 12.5%
> Population 554,868
[in-text-ad]

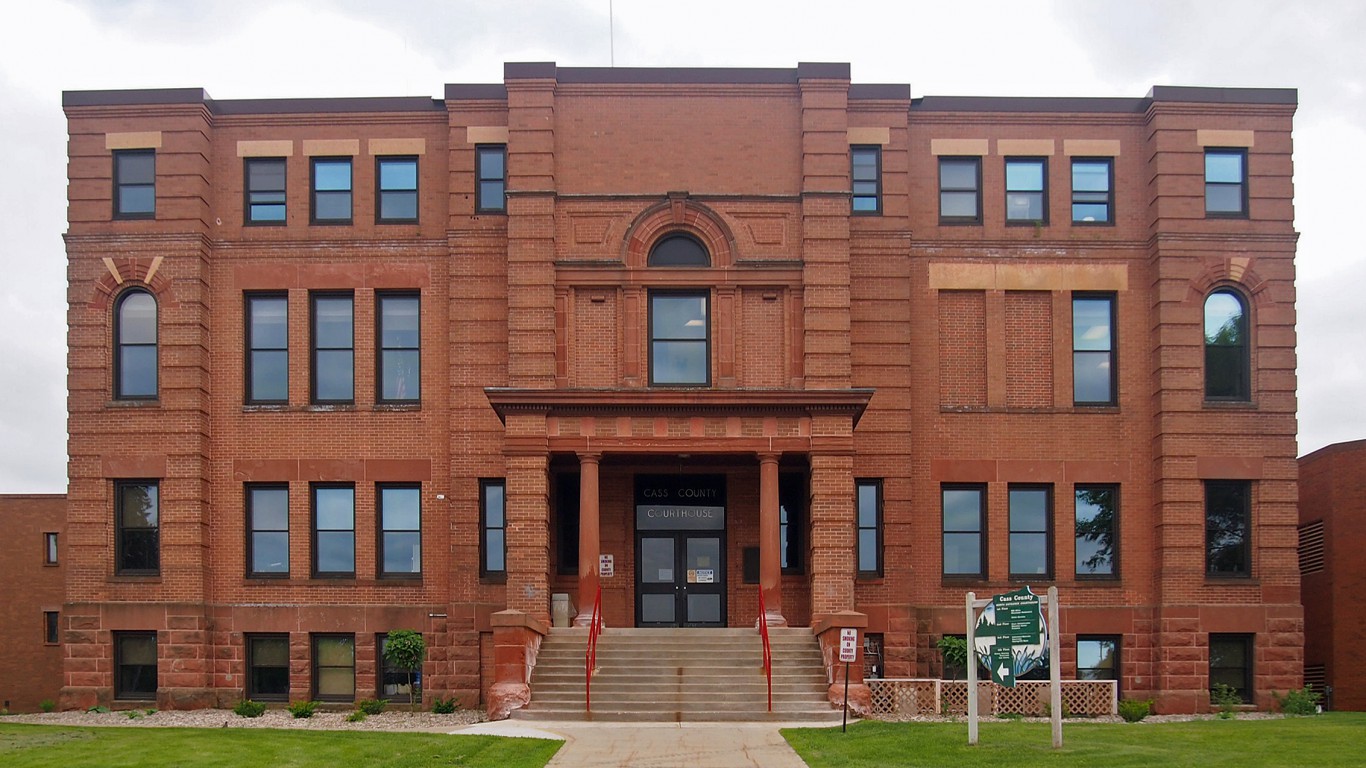
23. Cass County, Minnesota
> Annual drug deaths per 100,000 residents: 14.0 (county) 11.7 (state)
> Drug-related deaths, 2012-16: 20 (county) 2,568 (state)
> Poverty rate: 15.9%
> Population 28,633
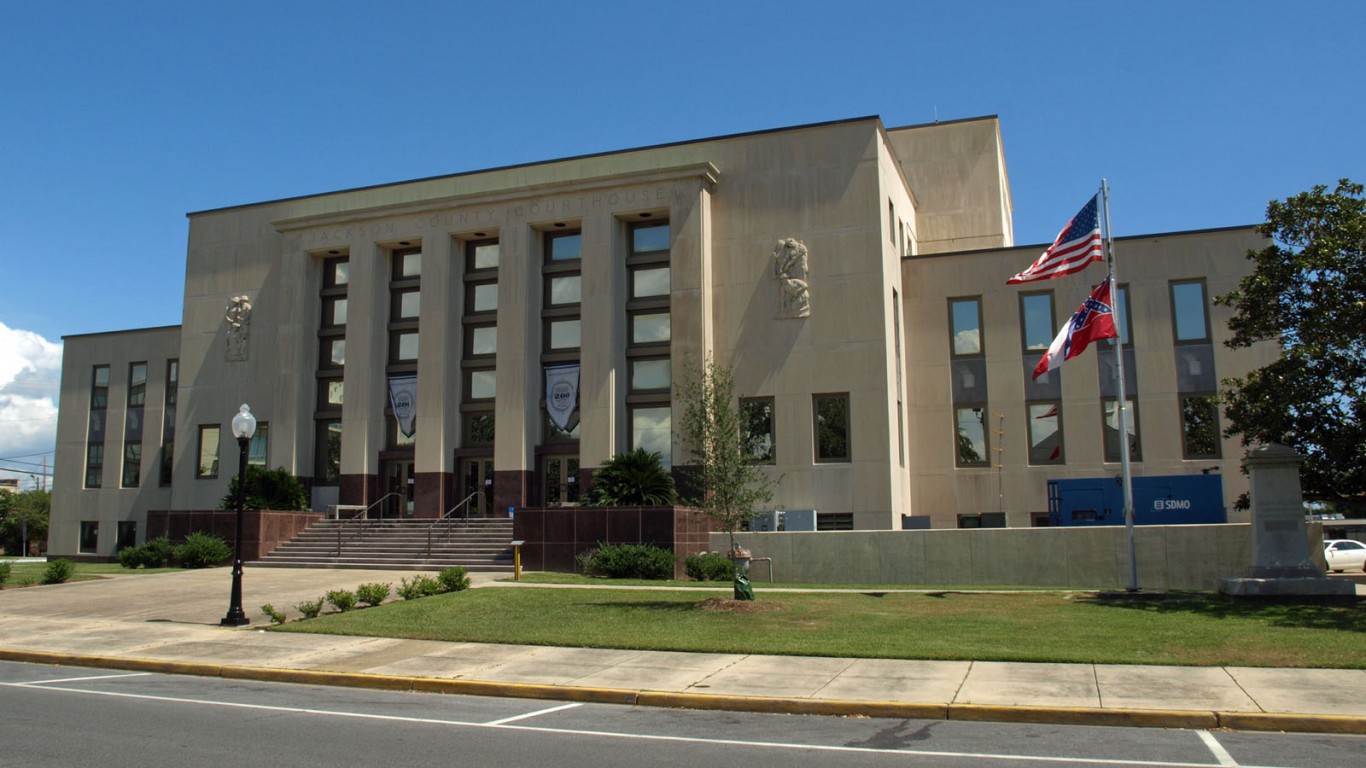
24. Jackson County, Mississippi
> Annual drug deaths per 100,000 residents: 27.3 (county) 12.0 (state)
> Drug-related deaths, 2012-16: 189 (county) 1,431 (state)
> Poverty rate: 15.6%
> Population 140,850
[in-text-ad-2]

25. Pemiscot County, Missouri
> Annual drug deaths per 100,000 residents: 38.0 (county) 19.2 (state)
> Drug-related deaths, 2012-16: 35 (county) 4,664 (state)
> Poverty rate: 29.1%
> Population 17,599

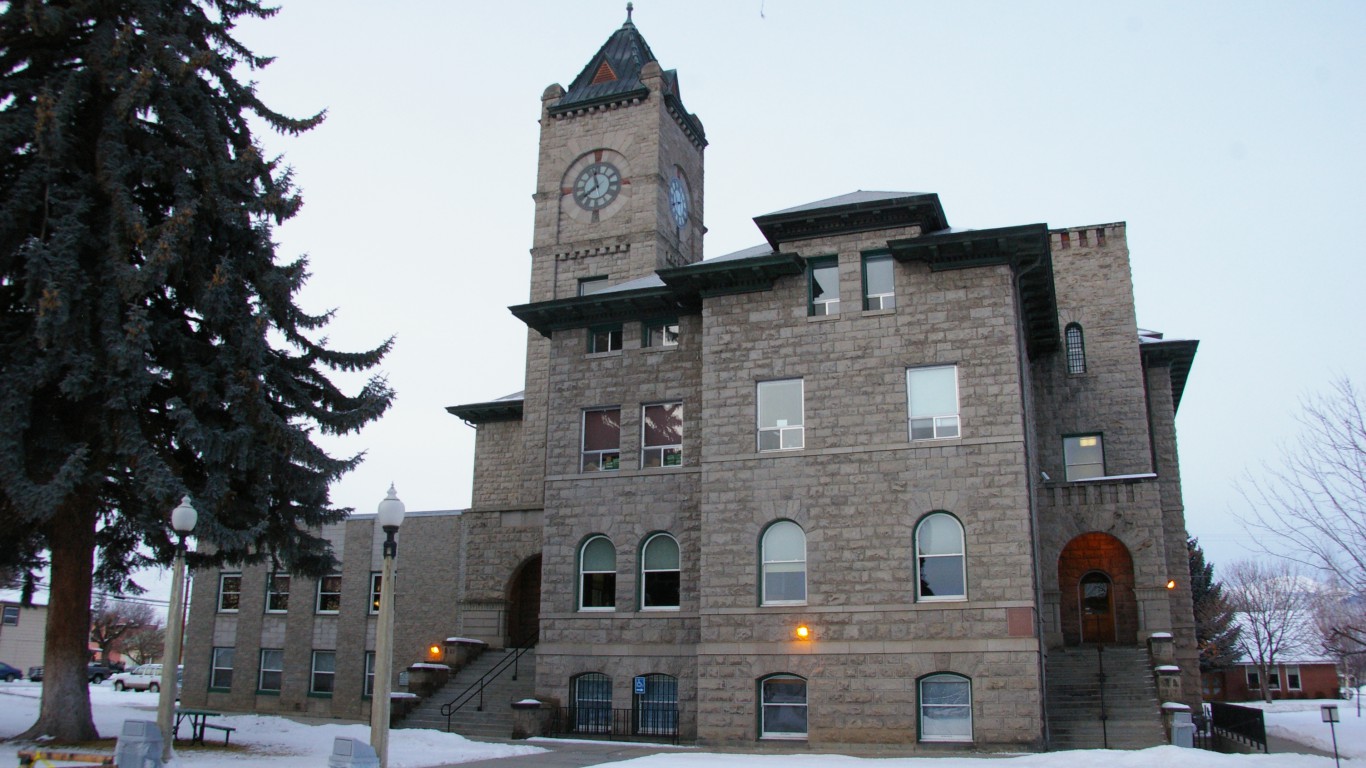
26. Hill County, Montana
> Annual drug deaths per 100,000 residents: 24.9 (county) 14.3 (state)
> Drug-related deaths, 2012-16: 20 (county) 589 (state)
> Poverty rate: 22.0%
> Population 16,529
[in-text-ad]

27. Scotts Bluff County, Nebraska
> Annual drug deaths per 100,000 residents: 12.0 (county) 7.4 (state)
> Drug-related deaths, 2012-16: 22 (county) 562 (state)
> Poverty rate: 13.5%
> Population 36,599

28. Nye County, Nevada
> Annual drug deaths per 100,000 residents: 31.8 (county) 21.7 (state)
> Drug-related deaths, 2012-16: 70 (county) 2,484 (state)
> Poverty rate: 17.2%
> Population 43,198

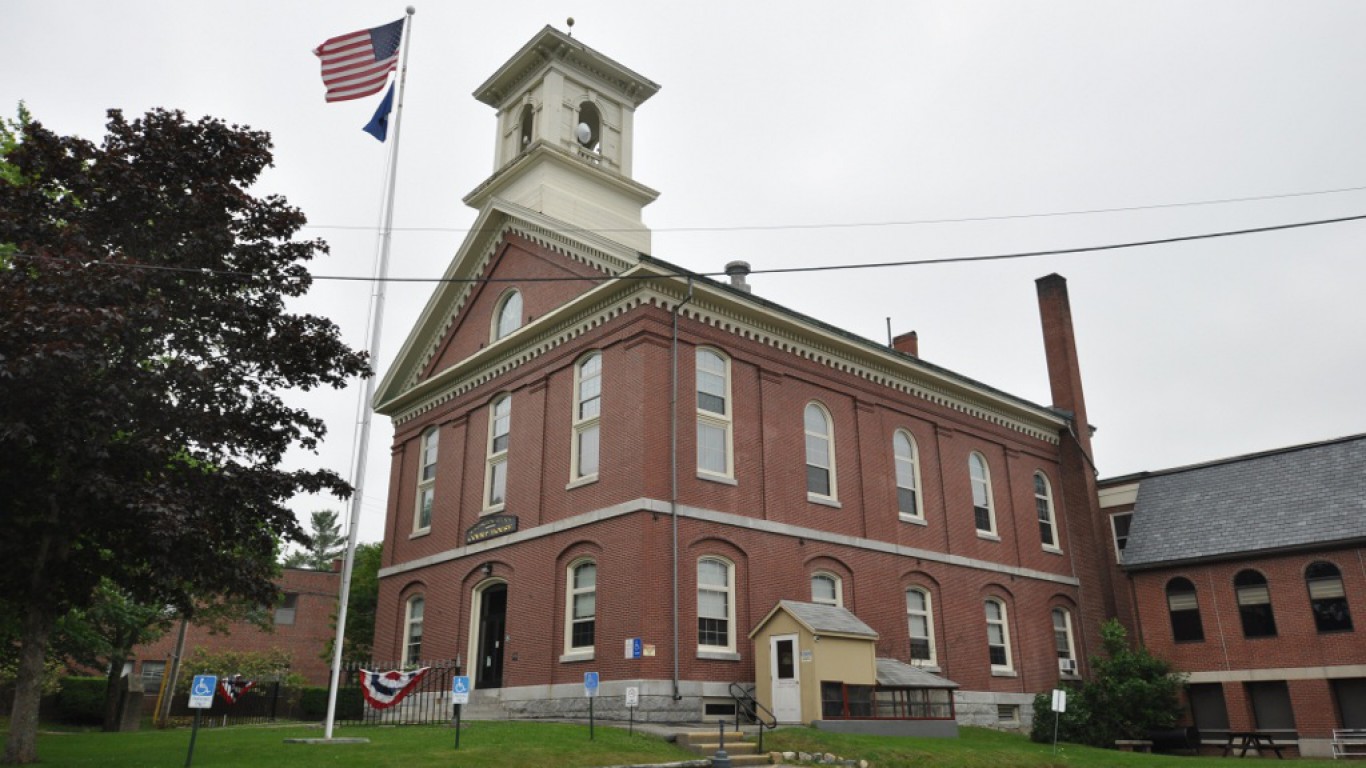
29. Belknap County, New Hampshire
> Annual drug deaths per 100,000 residents: 19.6 (county) 28.1 (state)
> Drug-related deaths, 2012-16: 59 (county) 1,493 (state)
> Poverty rate: 10.3%
> Population 60,392
[in-text-ad-2]
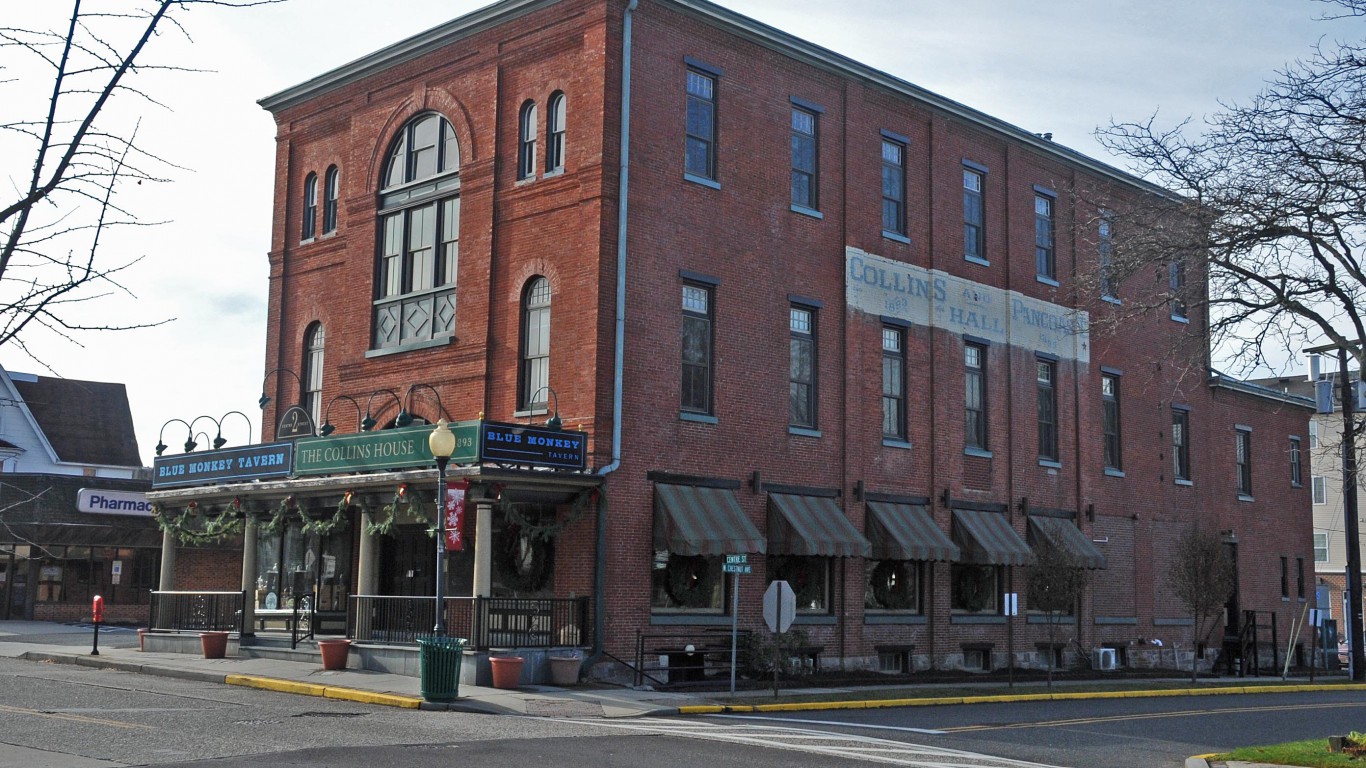
30. Camden County, New Jersey
> Annual drug deaths per 100,000 residents: 19.0 (county) 17.5 (state)
> Drug-related deaths, 2012-16: 489 (county) 6,272 (state)
> Poverty rate: 13.3%
> Population 511,145

31. Rio Arriba County, New Mexico
> Annual drug deaths per 100,000 residents: 60.2 (county) 24.8 (state)
> Drug-related deaths, 2012-16: 121 (county) 2,071 (state)
> Poverty rate: 23.4%
> Population 39,924
[in-text-ad]
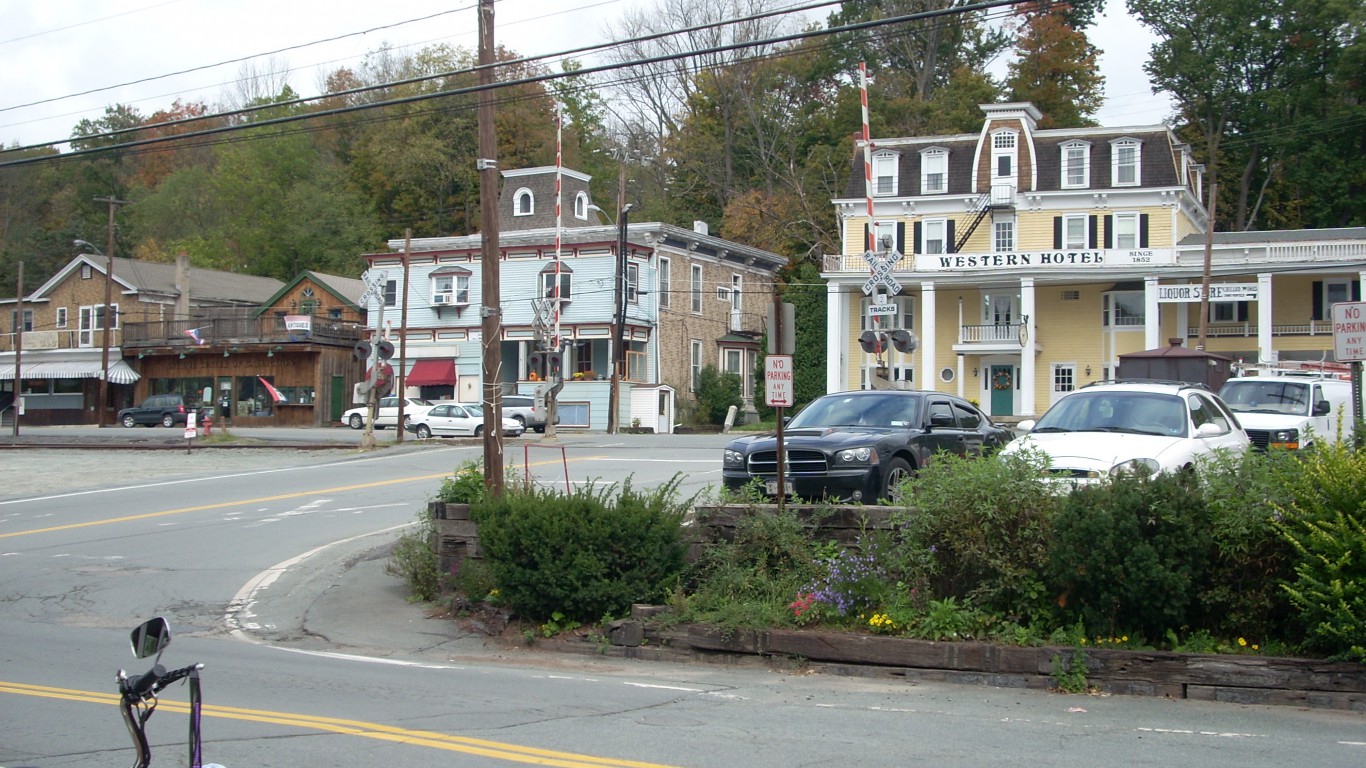
32. Sullivan County, New York
> Annual drug deaths per 100,000 residents: 19.9 (county) 15.1 (state)
> Drug-related deaths, 2012-16: 77 (county) 11,896 (state)
> Poverty rate: 17.1%
> Population 75,818
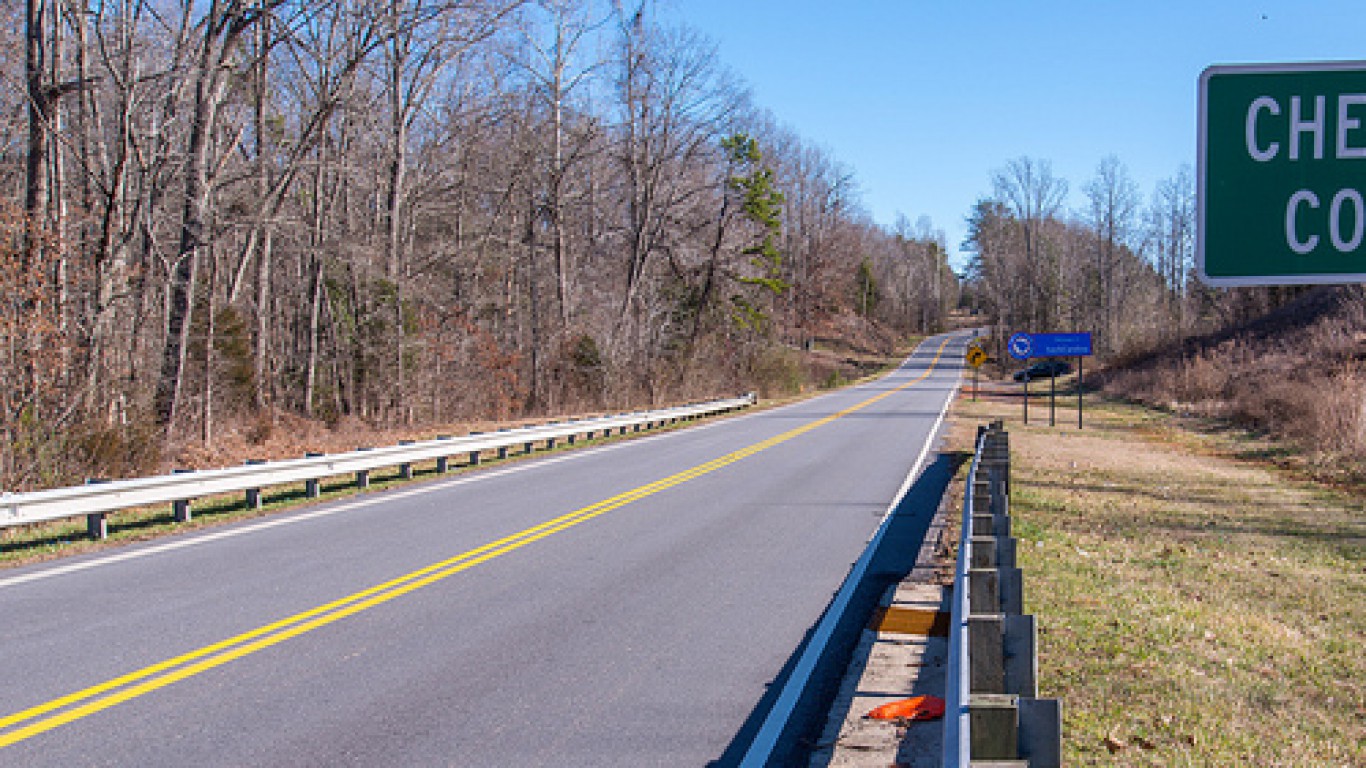
33. Cherokee County, North Carolina
> Annual drug deaths per 100,000 residents: 40.9 (county) 16.1 (state)
> Drug-related deaths, 2012-16: 56 (county) 6,419 (state)
> Poverty rate: 19.5%
> Population 27,226

34. Grand Forks County, North Dakota
> Annual drug deaths per 100,000 residents: 6.6 (county) 7.6 (state)
> Drug-related deaths, 2012-16: 22 (county) 226 (state)
> Poverty rate: 17.7%
> Population 69,793
[in-text-ad-2]
35. Brown County, Ohio
> Annual drug deaths per 100,000 residents: 30.0 (county) 28.4 (state)
> Drug-related deaths, 2012-16: 67 (county) 13,177 (state)
> Poverty rate: 16.7%
> Population 44,059
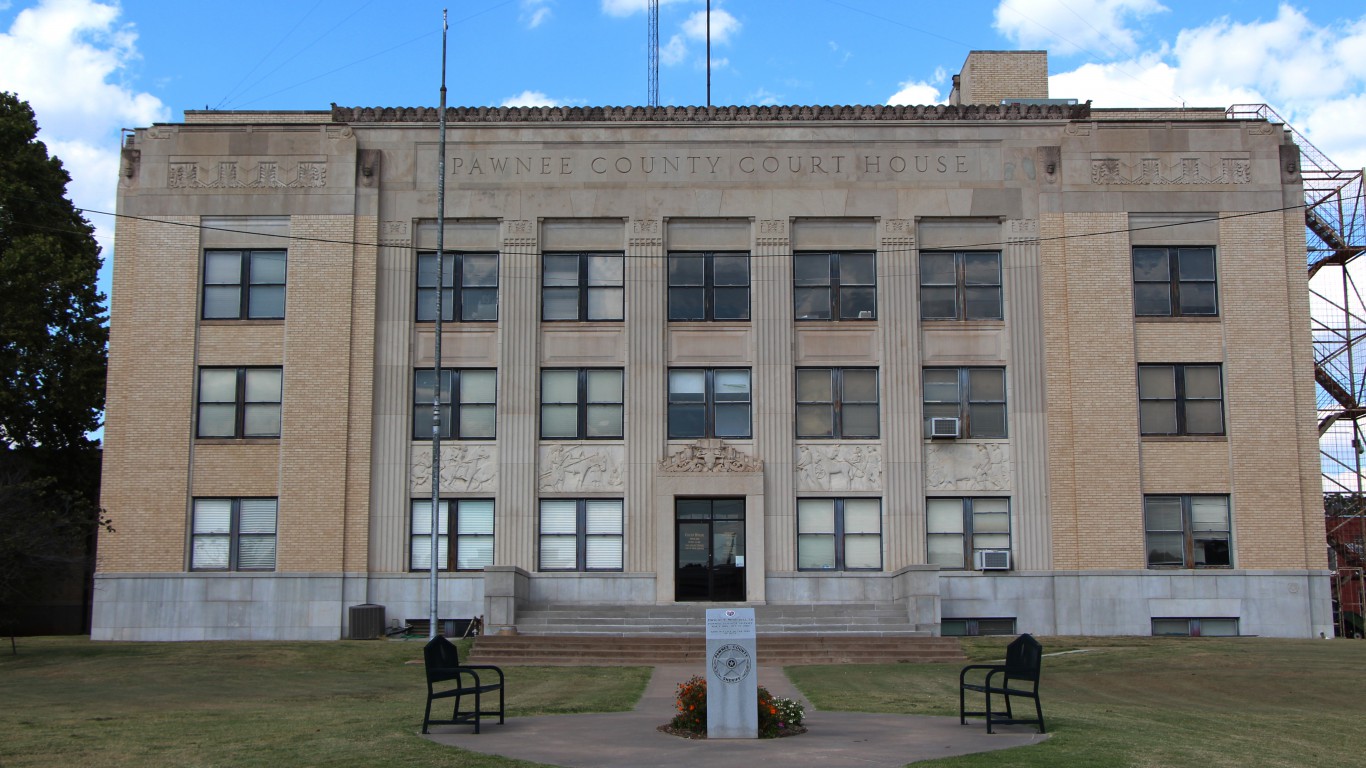
36. Pawnee County, Oklahoma
> Annual drug deaths per 100,000 residents: 36.2 (county) 20.6 (state)
> Drug-related deaths, 2012-16: 30 (county) 3,200 (state)
> Poverty rate: 14.6%
> Population 16,444
[in-text-ad]
37. Baker County, Oregon
> Annual drug deaths per 100,000 residents: 24.8 (county) 15.1 (state)
> Drug-related deaths, 2012-16: 20 (county) 2,422 (state)
> Poverty rate: 15.1%
> Population 16,030

38. Philadelphia County, Pennsylvania
> Annual drug deaths per 100,000 residents: 25.2 (county) 26.4 (state)
> Drug-related deaths, 2012-16: 1,910 (county) 13,492 (state)
> Poverty rate: 25.9%
> Population 1,559,938

39. Kent County, Rhode Island
> Annual drug deaths per 100,000 residents: 18.5 (county) 27.3 (state)
> Drug-related deaths, 2012-16: 154 (county) 1,153 (state)
> Poverty rate: 8.2%
> Population 164,886
[in-text-ad-2]

40. Oconee County, South Carolina
> Annual drug deaths per 100,000 residents: 26.4 (county) 15.9 (state)
> Drug-related deaths, 2012-16: 97 (county) 3,094 (state)
> Poverty rate: 18.5%
> Population 75,375
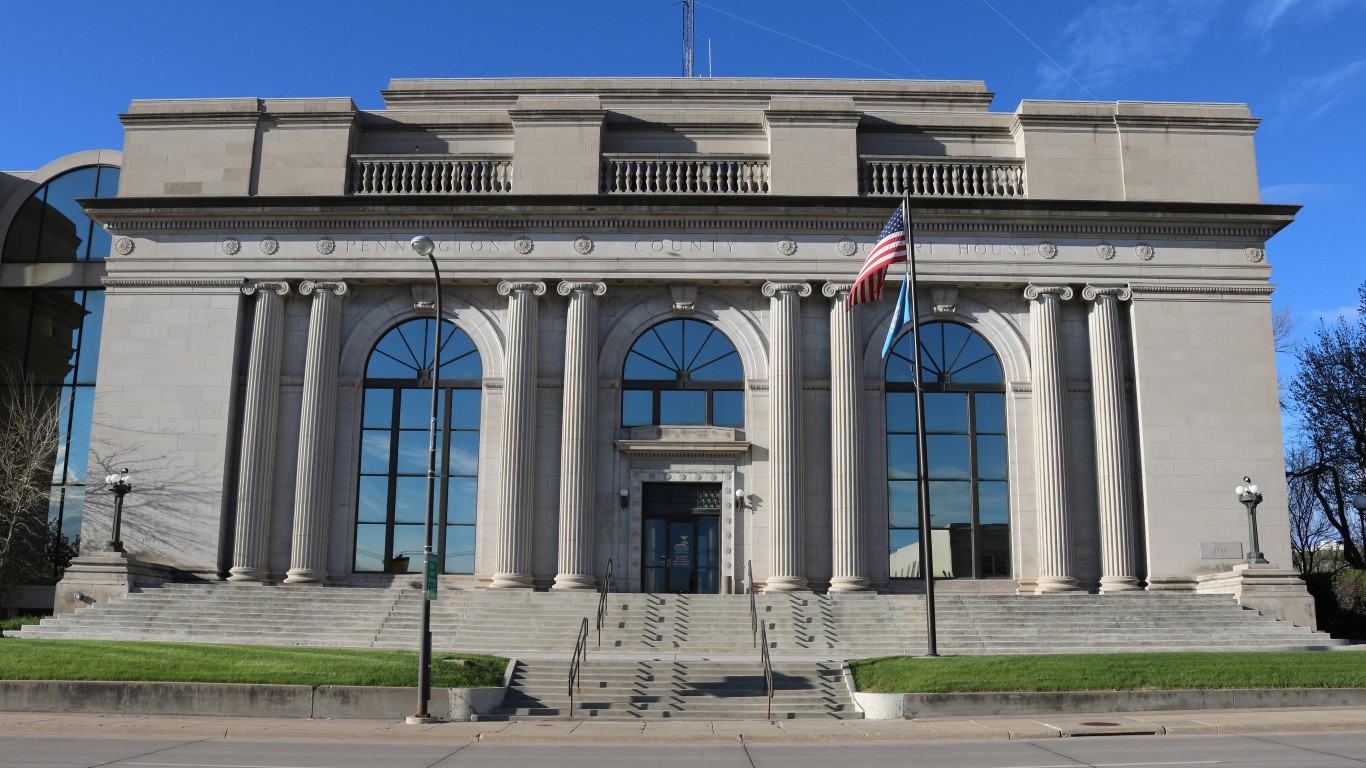
41. Pennington County, South Dakota
> Annual drug deaths per 100,000 residents: 10.9 (county) 8.0 (state)
> Drug-related deaths, 2012-16: 54 (county) 274 (state)
> Poverty rate: 13.8%
> Population 107,298
[in-text-ad]

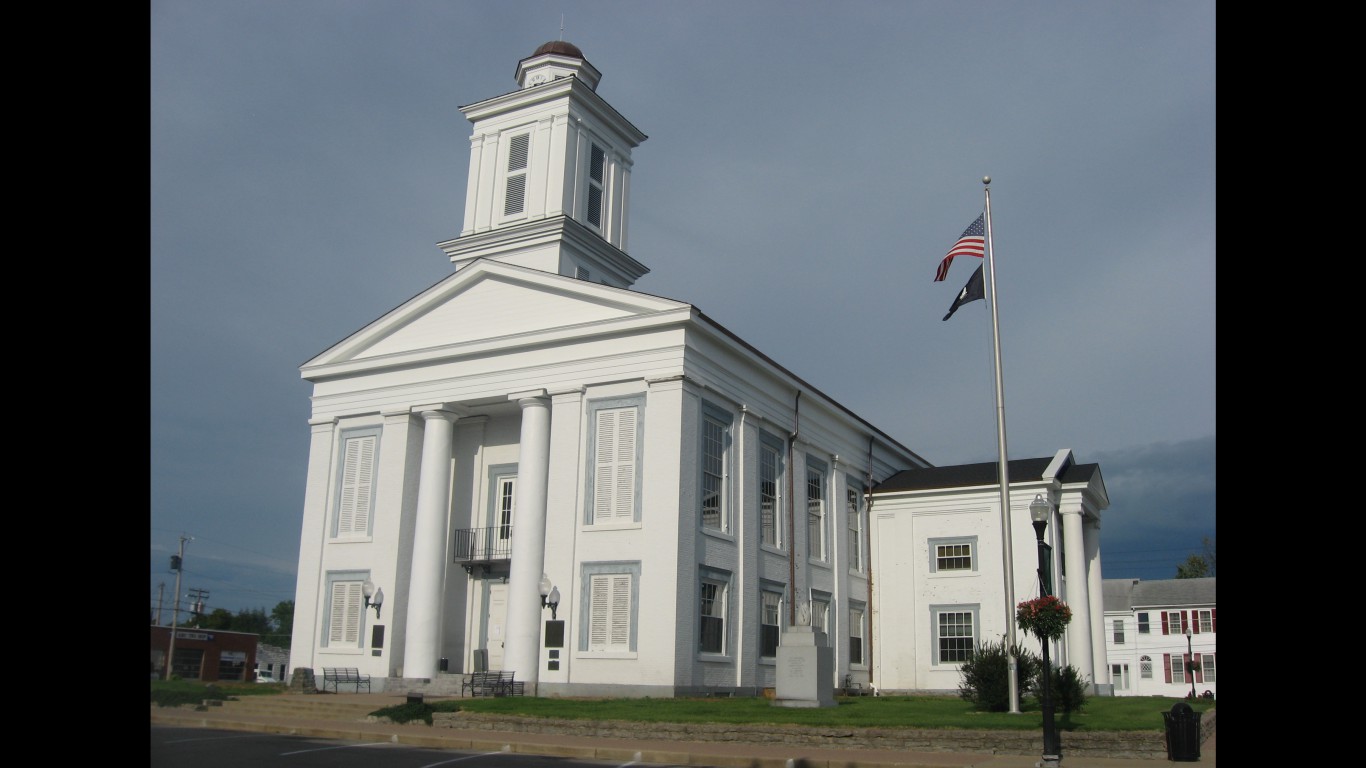
42. Overton County, Tennessee
> Annual drug deaths per 100,000 residents: 37.4 (county) 22.4 (state)
> Drug-related deaths, 2012-16: 41 (county) 5,900 (state)
> Poverty rate: 20.0%
> Population 22,090

43. Orange County, Texas
> Annual drug deaths per 100,000 residents: 29.9 (county) 10.1 (state)
> Drug-related deaths, 2012-16: 123 (county) 11,030 (state)
> Poverty rate: 15.2%
> Population 83,751

44. Carbon County, Utah
> Annual drug deaths per 100,000 residents: 43.8 (county) 21.7 (state)
> Drug-related deaths, 2012-16: 46 (county) 2,581 (state)
> Poverty rate: 15.5%
> Population 20,733
[in-text-ad-2]

45. Windham County, Vermont
> Annual drug deaths per 100,000 residents: 17.1 (county) 17.2 (state)
> Drug-related deaths, 2012-16: 38 (county) 431 (state)
> Poverty rate: 14.0%
> Population 43,609
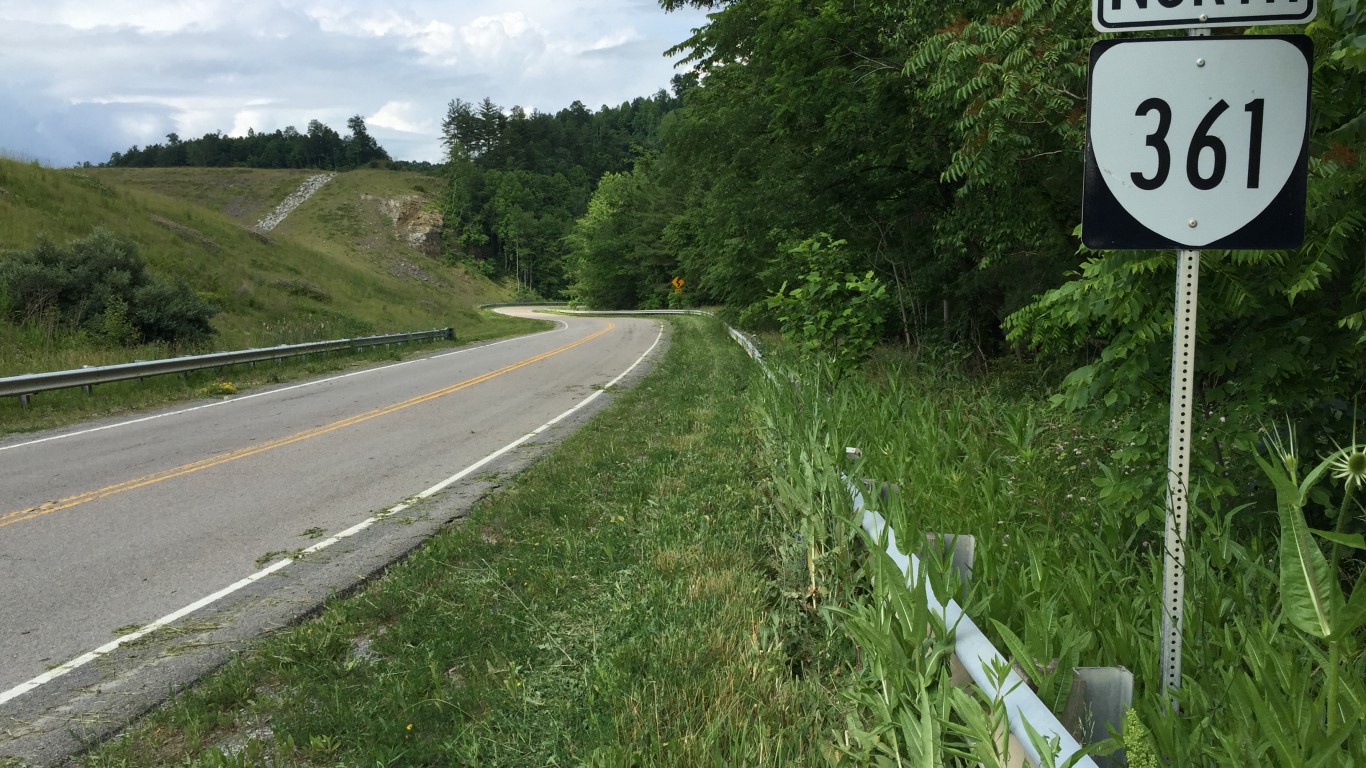
46. Dickenson County, Virginia
> Annual drug deaths per 100,000 residents: 51.5 (county) 13.2 (state)
> Drug-related deaths, 2012-16: 41 (county) 4,406 (state)
> Poverty rate: 21.5%
> Population 15,304
[in-text-ad]

47. Pacific County, Washington
> Annual drug deaths per 100,000 residents: 27.5 (county) 15.8 (state)
> Drug-related deaths, 2012-16: 29 (county) 4,501 (state)
> Poverty rate: 18.7%
> Population 20,743
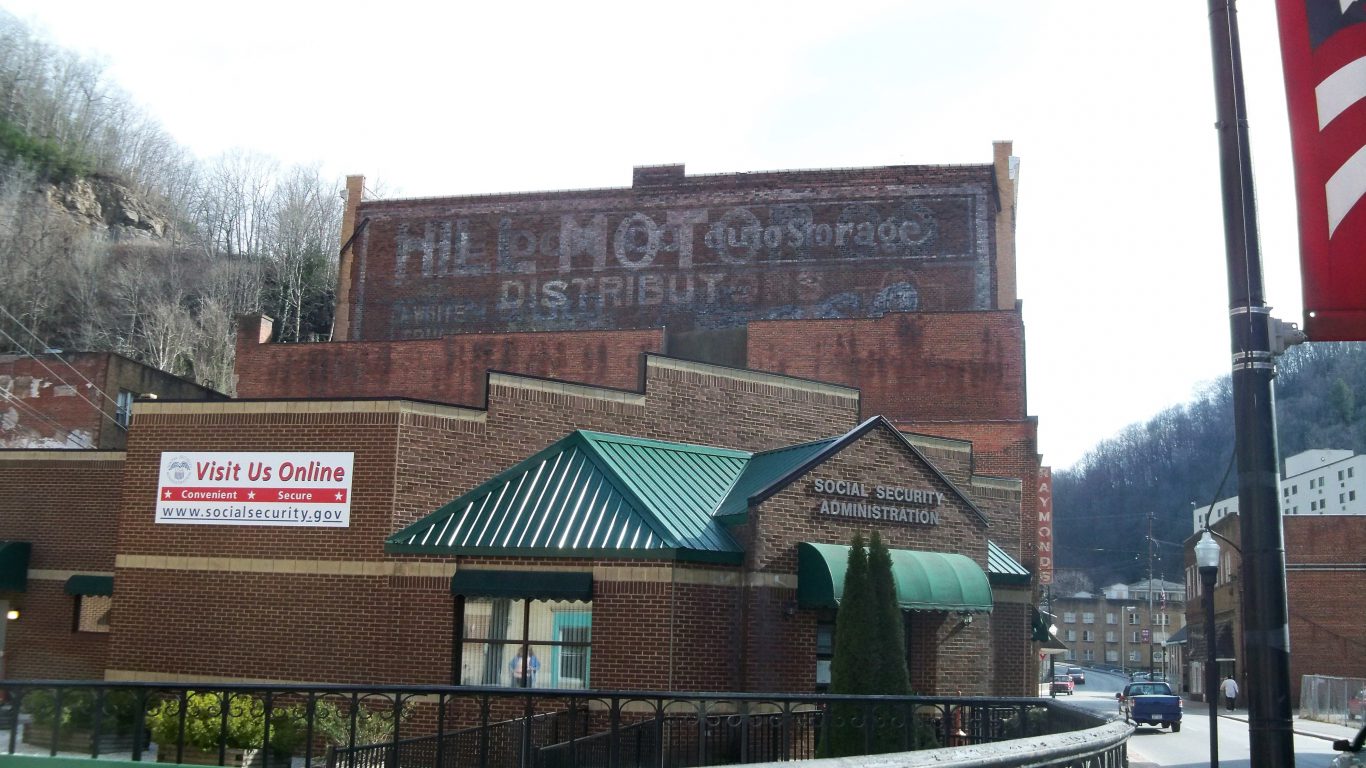
48. McDowell County, West Virginia
> Annual drug deaths per 100,000 residents: 88.9 (county) 39.2 (state)
> Drug-related deaths, 2012-16: 99 (county) 2,891 (state)
> Poverty rate: 37.6%
> Population 20,273
[in-text-ad-2]
50. Uinta County, Wyoming
> Annual drug deaths per 100,000 residents: 22.1 (county) 17.7 (state)
> Drug-related deaths, 2012-16: 23 (county) 413 (state)
> Poverty rate: 16.8%
> Population 20,893
Detailed Findings
The opioid epidemic has hit the poorest parts of the country the hardest. Drug addiction is often more common among the poorest Americans, who often lack the resources to seek substance abuse help and who live in communities that lack adequate funding for programs that fight the spread of drugs.
While nationwide 16.5 in every 100,000 Americans die each year from drug overdoses — mostly opioids — in some states the overdose mortality rate is more than double the national average. The three states with the highest overdose rates — West Virginia, Kentucky, and Ohio — all have poverty rates above the 15.1% national rate. These states also have some of the lowest median household incomes in the country.
Similarly, within each state, the county with the highest drug mortality rate is often among the poorest in the state. In 38 states, the poverty rate in the county with the highest drug mortality rate is higher than the state as a whole. In 15 states, the county with the highest drug death rate is also among the three counties with the highest poverty rates.
Methodology
To determine the counties with the worst drug problem in every state, 24/7 Wall St. reviewed the average number of drug-related deaths per 100,000 residents each year for the period 2012 to 2016 with data from the Centers for Disease Control and Prevention’s WONDER web application. The cause of drug-induced deaths include unintentional overdoses, suicide, homicide, and undetermined causes. Data on poverty and population came from the U.S. Census Bureau’s American Community Survey and are five-year averages for the period 2012 to 2016. All data is for the most recent period available.
The thought of burdening your family with a financial disaster is most Americans’ nightmare. However, recent studies show that over 100 million Americans still don’t have proper life insurance in the event they pass away.
Life insurance can bring peace of mind – ensuring your loved ones are safeguarded against unforeseen expenses and debts. With premiums often lower than expected and a variety of plans tailored to different life stages and health conditions, securing a policy is more accessible than ever.
A quick, no-obligation quote can provide valuable insight into what’s available and what might best suit your family’s needs. Life insurance is a simple step you can take today to help secure peace of mind for your loved ones tomorrow.
Click here to learn how to get a quote in just a few minutes.
Thank you for reading! Have some feedback for us?
Contact the 24/7 Wall St. editorial team.


 24/7 Wall St.
 24/7 Wall St.
 24/7 Wall St.
 24/7 Wall St.
 24/7 Wall St.
 24/7 Wall St.