Special Report
How Much You Have to Make to Be in the Top 1% in Your State

Published:
Last Updated:

The United States is enjoying an era of unprecedented wealth and prosperity. Economic output and household incomes are at all-time highs, while unemployment is at its lowest level in well over a decade. However, the growth has not benefited all Americans equally, and in much of the country, wealth is becoming increasingly concentrated in the hands of a few.
From the end of World War II through the early 1970s, the average income growth of the bottom ninety-nine percent of earners roughly tripled the 34% growth rate among the wealthiest one percent.
Since, however, the strengthening of the middle class has ground nearly to a halt, while the wealth of the one percent has grown exponentially.
The average income for the top one percent spiked by 216.4% from 1973 to 2007, but it increased by just 15.4% for all other earners. From 2009 to 2015, the average income for the wealthiest Americans grew by 33.9%, more than triple the income growth of 10.3% among the remaining ninety-nine percent.
Today, more so than in the decades immediately following World War II, being among the top earners not only helps ensure a comfortable life, but also greatly increases earning potential and the ability to amass a fortune.
Any family earning at least $422,000 a year ranks among the top one percent of earners nationwide. However, as income levels vary by state so too does the amount it takes to be a one-percenter.
24/7 Wall St. reviewed data compiled by the Economic Policy Institute, a nonprofit nonpartisan think tank, to identify the minimum income threshold of the top one percent of earners in each state.

50. Mississippi
> Top 1% earn at least: $254,362
> Avg. income of top 1%: $580,461
> Avg. income of bottom 99%: $35,353
> Adults with a bachelor’s degree: 21.8%

49. Arkansas
> Top 1% earn at least: $255,050
> Avg. income of top 1%: $864,772
> Avg. income of bottom 99%: $38,472
> Adults with a bachelor’s degree: 22.4%

48. New Mexico
> Top 1% earn at least: $255,429
> Avg. income of top 1%: $615,082
> Avg. income of bottom 99%: $39,675
> Adults with a bachelor’s degree: 27.2%

47. West Virginia
> Top 1% earn at least: $258,078
> Avg. income of top 1%: $535,648
> Avg. income of bottom 99%: $34,987
> Adults with a bachelor’s degree: 20.8%

46. Kentucky
> Top 1% earn at least: $274,818
> Avg. income of top 1%: $719,012
> Avg. income of bottom 99%: $38,990
> Adults with a bachelor’s degree: 23.4%
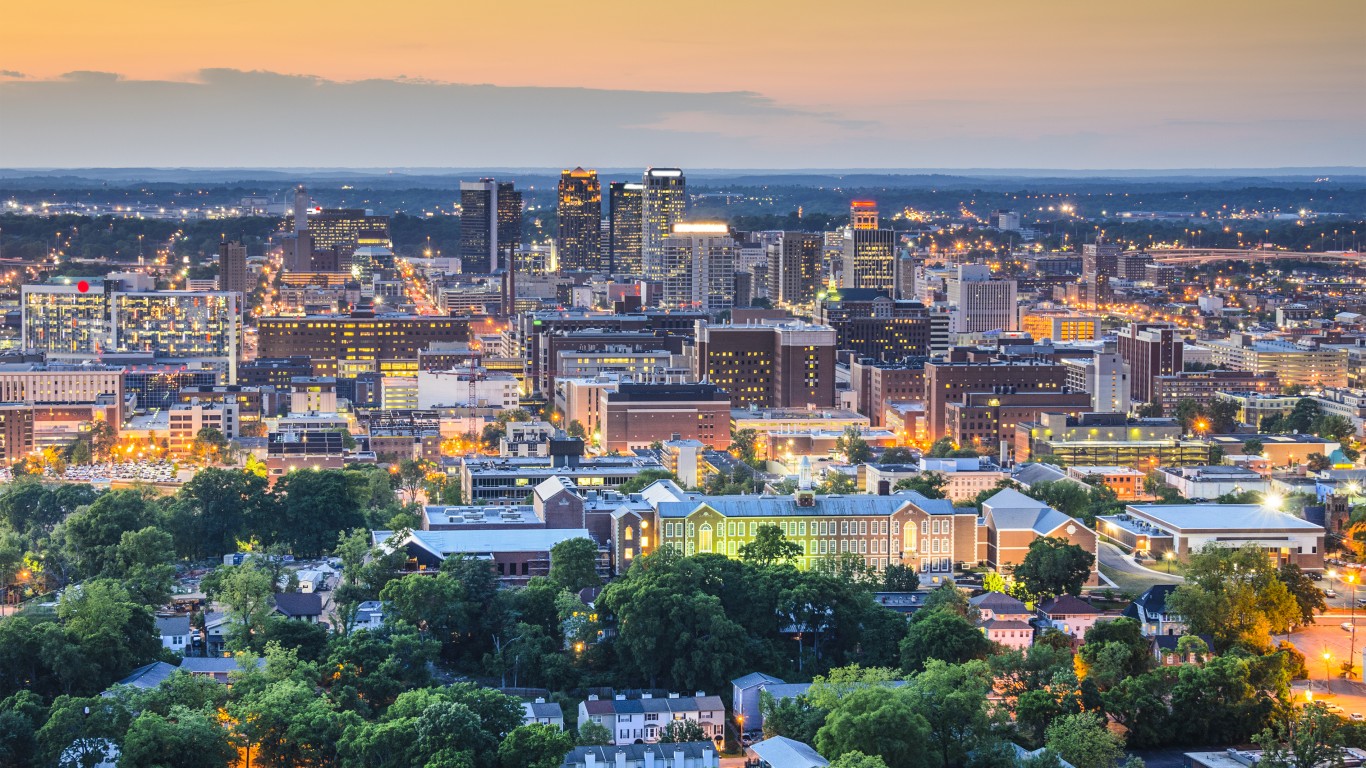
45. Alabama
> Top 1% earn at least: $297,564
> Avg. income of top 1%: $743,644
> Avg. income of bottom 99%: $38,587
> Adults with a bachelor’s degree: 24.7%
[in-text-ad]

44. Maine
> Top 1% earn at least: $303,897
> Avg. income of top 1%: $655,870
> Avg. income of bottom 99%: $42,575
> Adults with a bachelor’s degree: 30.1%

43. Hawaii
> Top 1% earn at least: $310,566
> Avg. income of top 1%: $797,001
> Avg. income of bottom 99%: $57,987
> Adults with a bachelor’s degree: 31.9%

42. Idaho
> Top 1% earn at least: $314,532
> Avg. income of top 1%: $829,268
> Avg. income of bottom 99%: $47,727
> Adults with a bachelor’s degree: 27.6%
[in-text-ad-2]

41. Indiana
> Top 1% earn at least: $316,756
> Avg. income of top 1%: $804,275
> Avg. income of bottom 99%: $46,501
> Adults with a bachelor’s degree: 25.6%

40. Louisiana
> Top 1% earn at least: $318,393
> Avg. income of top 1%: $814,386
> Avg. income of bottom 99%: $45,060
> Adults with a bachelor’s degree: 23.4%
[in-text-ad]

39. South Carolina
> Top 1% earn at least: $318,463
> Avg. income of top 1%: $761,185
> Avg. income of bottom 99%: $38,646
> Adults with a bachelor’s degree: 27.2%
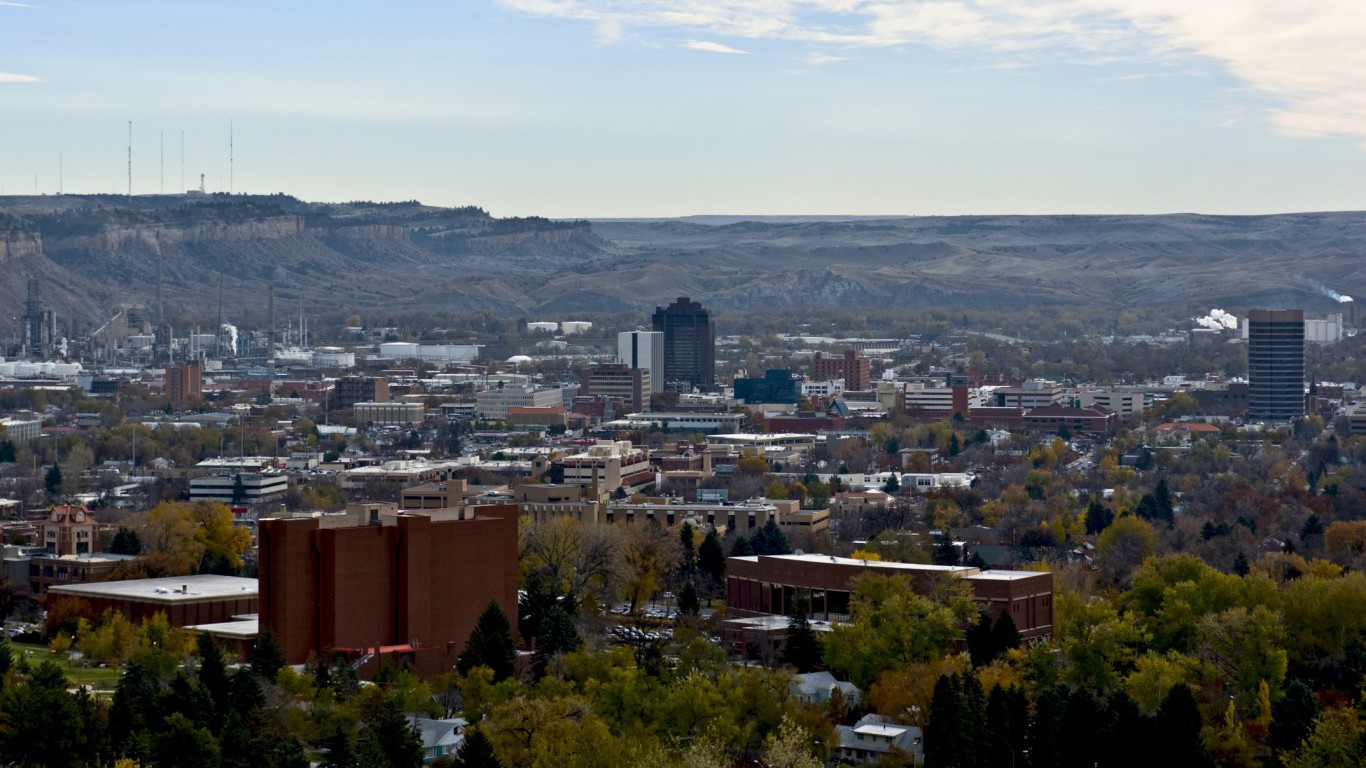
38. Montana
> Top 1% earn at least: $321,849
> Avg. income of top 1%: $855,976
> Avg. income of bottom 99%: $45,197
> Adults with a bachelor’s degree: 31.0%
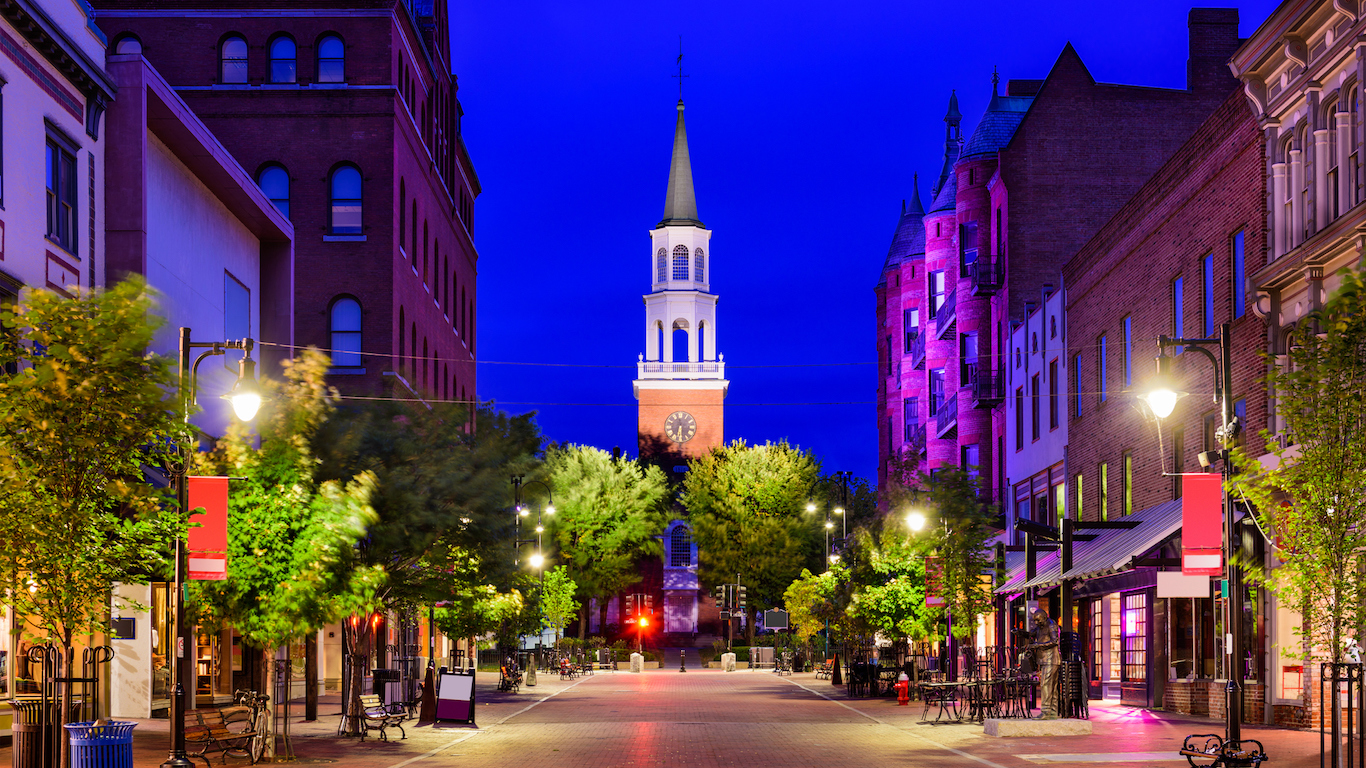
37. Vermont
> Top 1% earn at least: $321,969
> Avg. income of top 1%: $816,579
> Avg. income of bottom 99%: $50,283
> Adults with a bachelor’s degree: 36.4%
[in-text-ad-2]

36. Missouri
> Top 1% earn at least: $326,839
> Avg. income of top 1%: $944,804
> Avg. income of bottom 99%: $44,650
> Adults with a bachelor’s degree: 28.5%

35. Michigan
> Top 1% earn at least: $328,649
> Avg. income of top 1%: $917,701
> Avg. income of bottom 99%: $42,825
> Adults with a bachelor’s degree: 28.3%
[in-text-ad]

34. Arizona
> Top 1% earn at least: $331,074
> Avg. income of top 1%: $882,657
> Avg. income of bottom 99%: $42,000
> Adults with a bachelor’s degree: 28.9%

33. Iowa
> Top 1% earn at least: $331,572
> Avg. income of top 1%: $788,419
> Avg. income of bottom 99%: $53,753
> Adults with a bachelor’s degree: 28.4%

32. Tennessee
> Top 1% earn at least: $332,913
> Avg. income of top 1%: $947,021
> Avg. income of bottom 99%: $44,219
> Adults with a bachelor’s degree: 26.1%
[in-text-ad-2]

31. Oklahoma
> Top 1% earn at least: $333,139
> Avg. income of top 1%: $932,520
> Avg. income of bottom 99%: $52,533
> Adults with a bachelor’s degree: 25.2%

30. Ohio
> Top 1% earn at least: $334,979
> Avg. income of top 1%: $858,965
> Avg. income of bottom 99%: $46,157
> Adults with a bachelor’s degree: 27.5%
[in-text-ad]
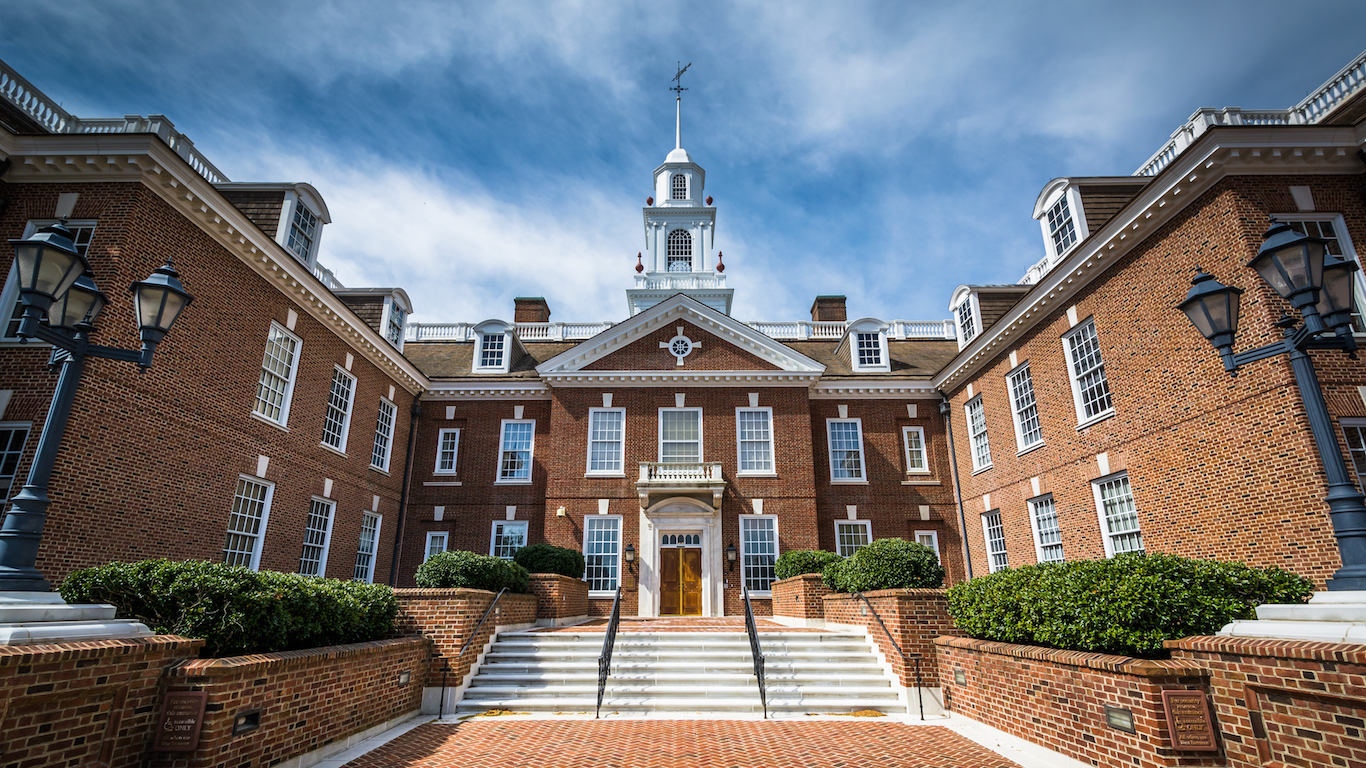
29. Delaware
> Top 1% earn at least: $340,770
> Avg. income of top 1%: $869,461
> Avg. income of bottom 99%: $51,049
> Adults with a bachelor’s degree: 31.0%

28. Nevada
> Top 1% earn at least: $341,335
> Avg. income of top 1%: $1,354,780
> Avg. income of bottom 99%: $41,470
> Adults with a bachelor’s degree: 23.5%

27. North Carolina
> Top 1% earn at least: $343,066
> Avg. income of top 1%: $902,972
> Avg. income of bottom 99%: $43,850
> Adults with a bachelor’s degree: 30.4%
[in-text-ad-2]

26. Rhode Island
> Top 1% earn at least: $346,657
> Avg. income of top 1%: $928,204
> Avg. income of bottom 99%: $50,963
> Adults with a bachelor’s degree: 34.1%

25. Wisconsin
> Top 1% earn at least: $349,905
> Avg. income of top 1%: $964,358
> Avg. income of bottom 99%: $50,953
> Adults with a bachelor’s degree: 29.5%
[in-text-ad]
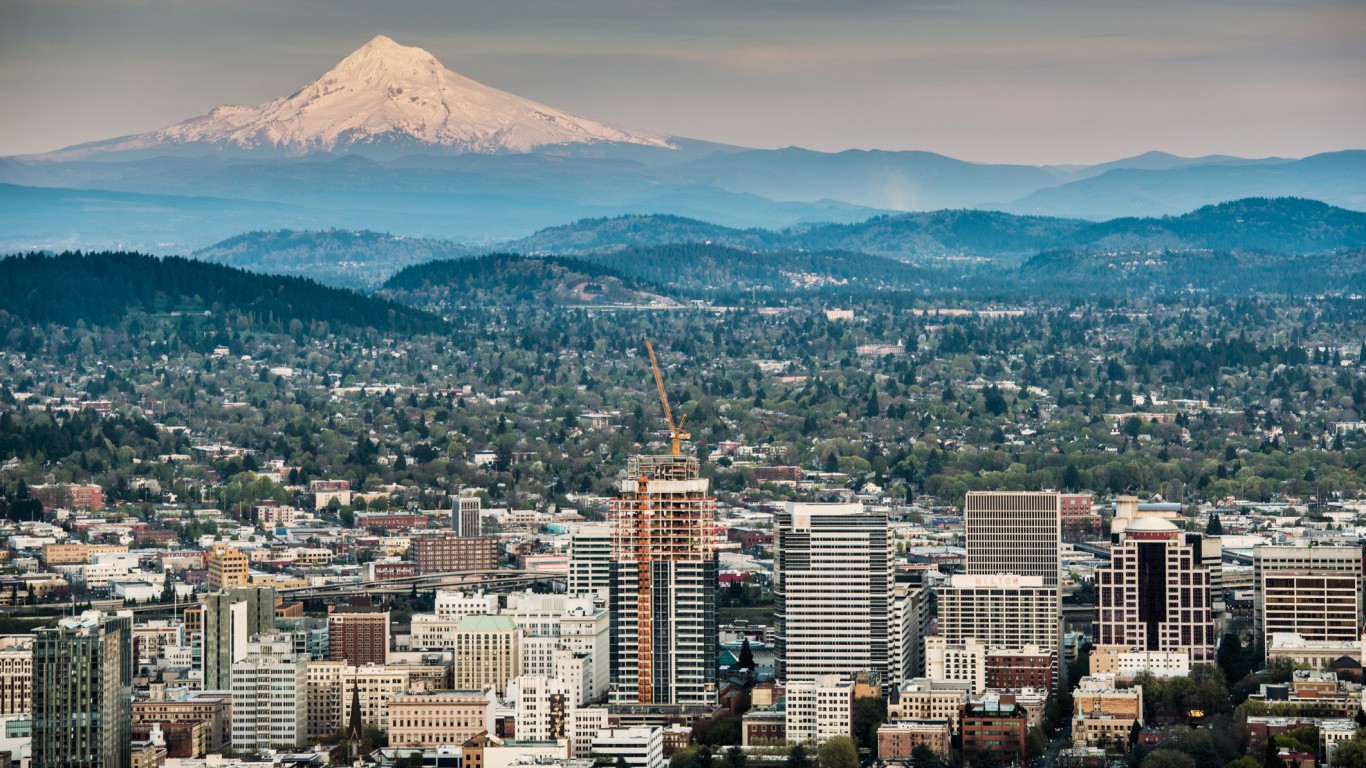
24. Oregon
> Top 1% earn at least: $358,937
> Avg. income of top 1%: $908,898
> Avg. income of bottom 99%: $46,090
> Adults with a bachelor’s degree: 32.7%
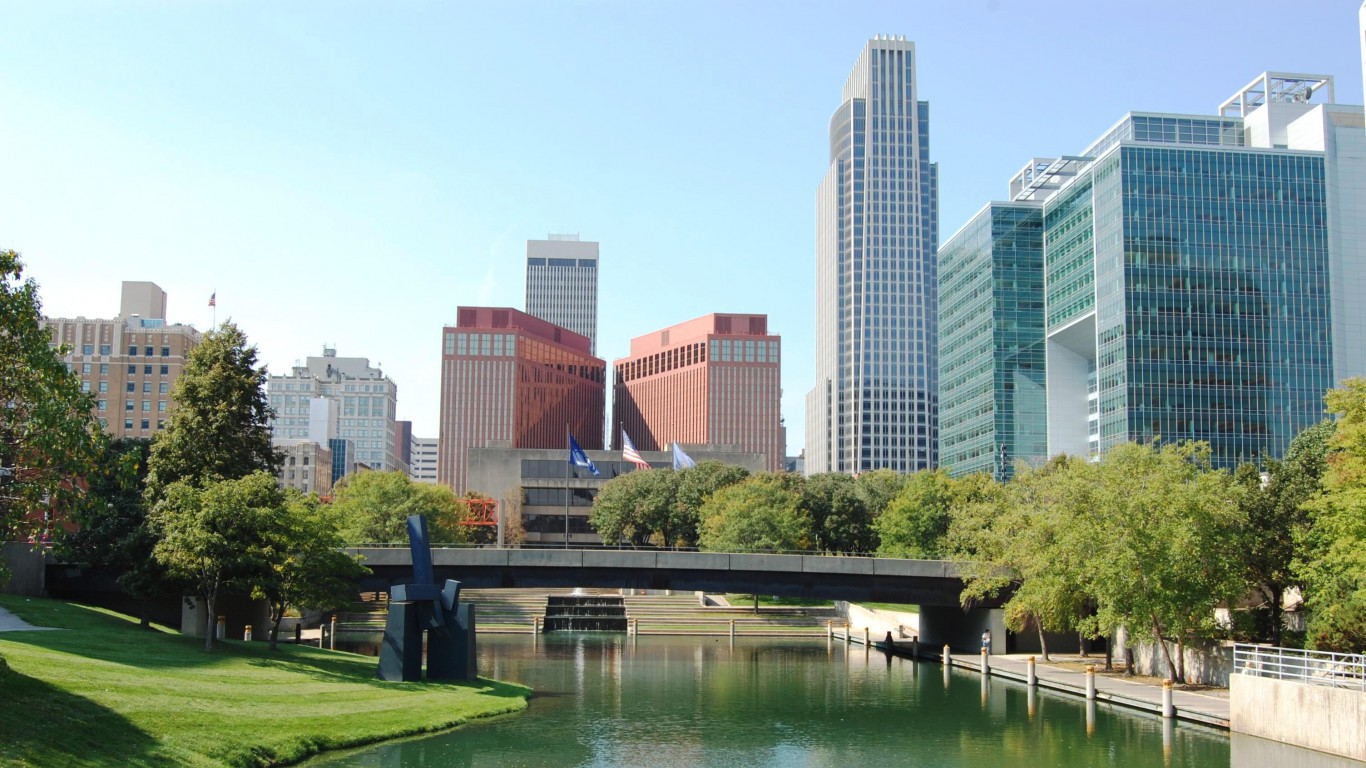
23. Nebraska
> Top 1% earn at least: $363,310
> Avg. income of top 1%: $945,869
> Avg. income of bottom 99%: $58,013
> Adults with a bachelor’s degree: 31.4%
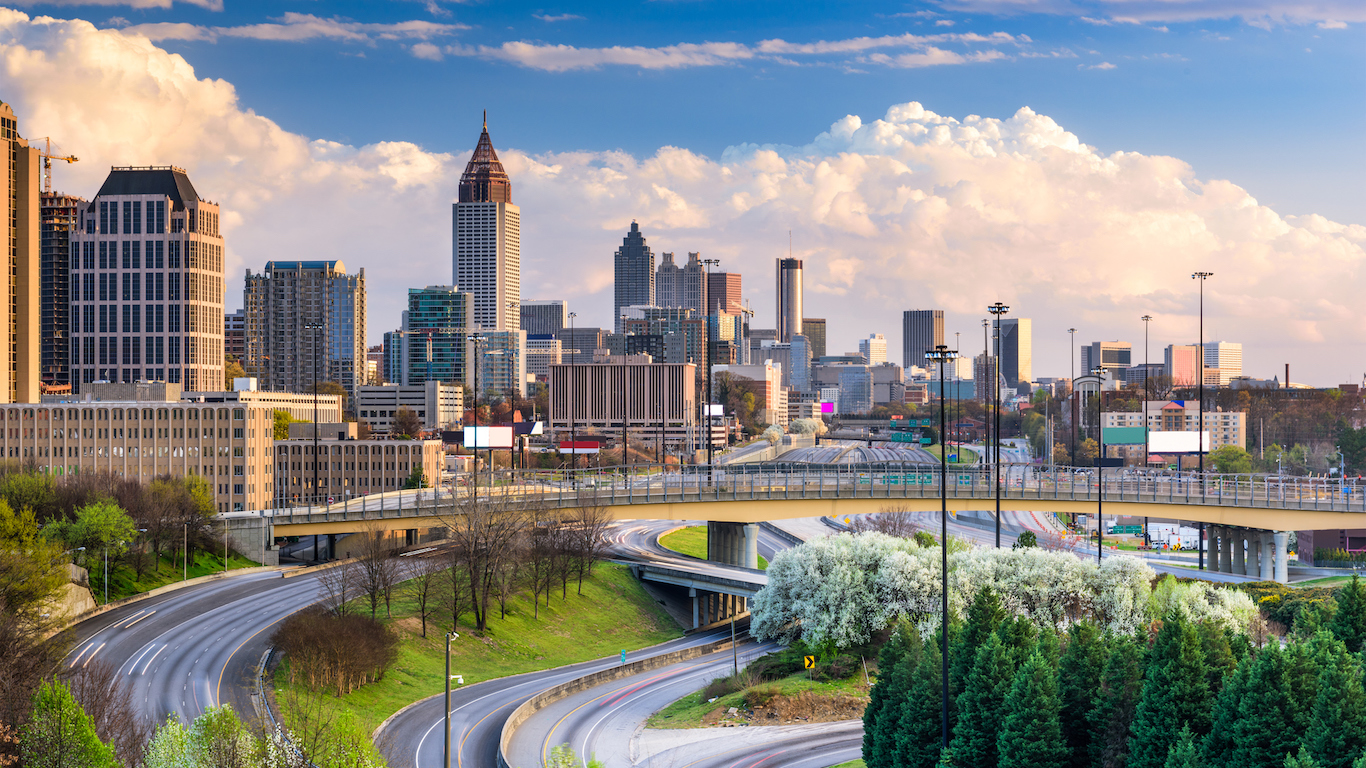
22. Georgia
> Top 1% earn at least: $371,811
> Avg. income of top 1%: $995,576
> Avg. income of bottom 99%: $44,147
> Adults with a bachelor’s degree: 30.5%
[in-text-ad-2]

21. Utah
> Top 1% earn at least: $374,467
> Avg. income of top 1%: $1,057,066
> Avg. income of bottom 99%: $53,614
> Adults with a bachelor’s degree: 32.6%
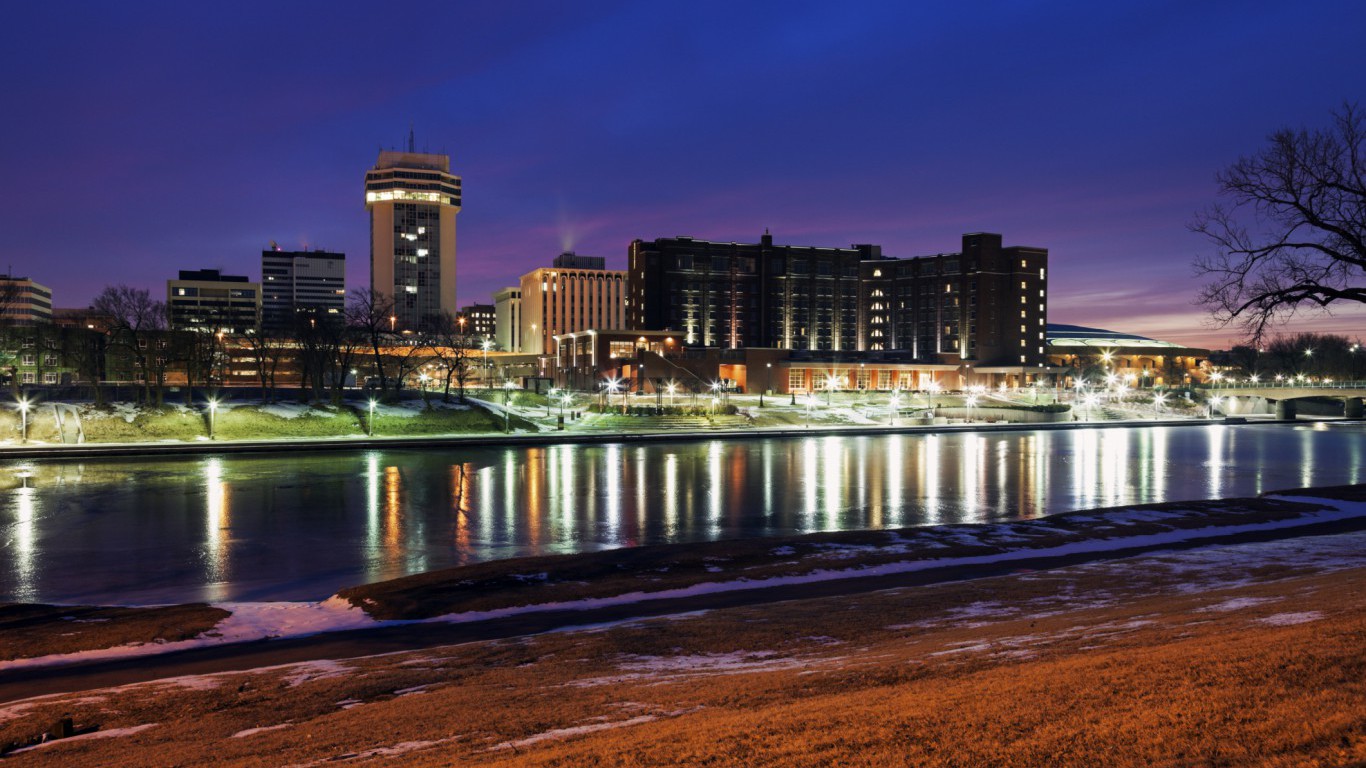
20. Kansas
> Top 1% earn at least: $375,344
> Avg. income of top 1%: $1,034,676
> Avg. income of bottom 99%: $56,628
> Adults with a bachelor’s degree: 32.8%
[in-text-ad]

19. Pennsylvania
> Top 1% earn at least: $388,593
> Avg. income of top 1%: $1,100,962
> Avg. income of bottom 99%: $50,830
> Adults with a bachelor’s degree: 30.8%
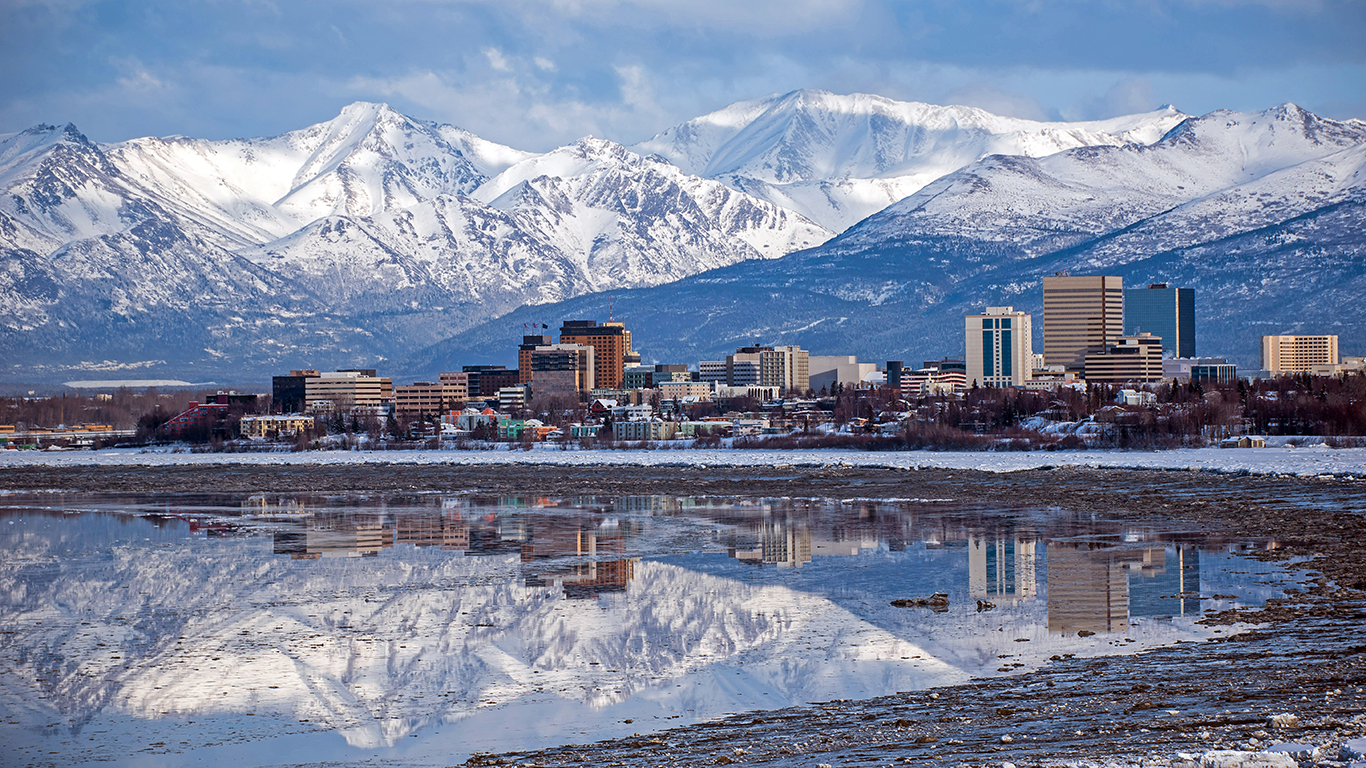
18. Alaska
> Top 1% earn at least: $400,017
> Avg. income of top 1%: $910,059
> Avg. income of bottom 99%: $71,876
> Adults with a bachelor’s degree: 29.6%

17. New Hampshire
> Top 1% earn at least: $405,286
> Avg. income of top 1%: $1,134,101
> Avg. income of bottom 99%: $62,796
> Adults with a bachelor’s degree: 36.6%
[in-text-ad-2]

16. Wyoming
> Top 1% earn at least: $405,596
> Avg. income of top 1%: $1,900,659
> Avg. income of bottom 99%: $60,922
> Adults with a bachelor’s degree: 27.1%

15. South Dakota
> Top 1% earn at least: $407,406
> Avg. income of top 1%: $1,130,048
> Avg. income of bottom 99%: $56,610
> Adults with a bachelor’s degree: 28.9%
[in-text-ad]
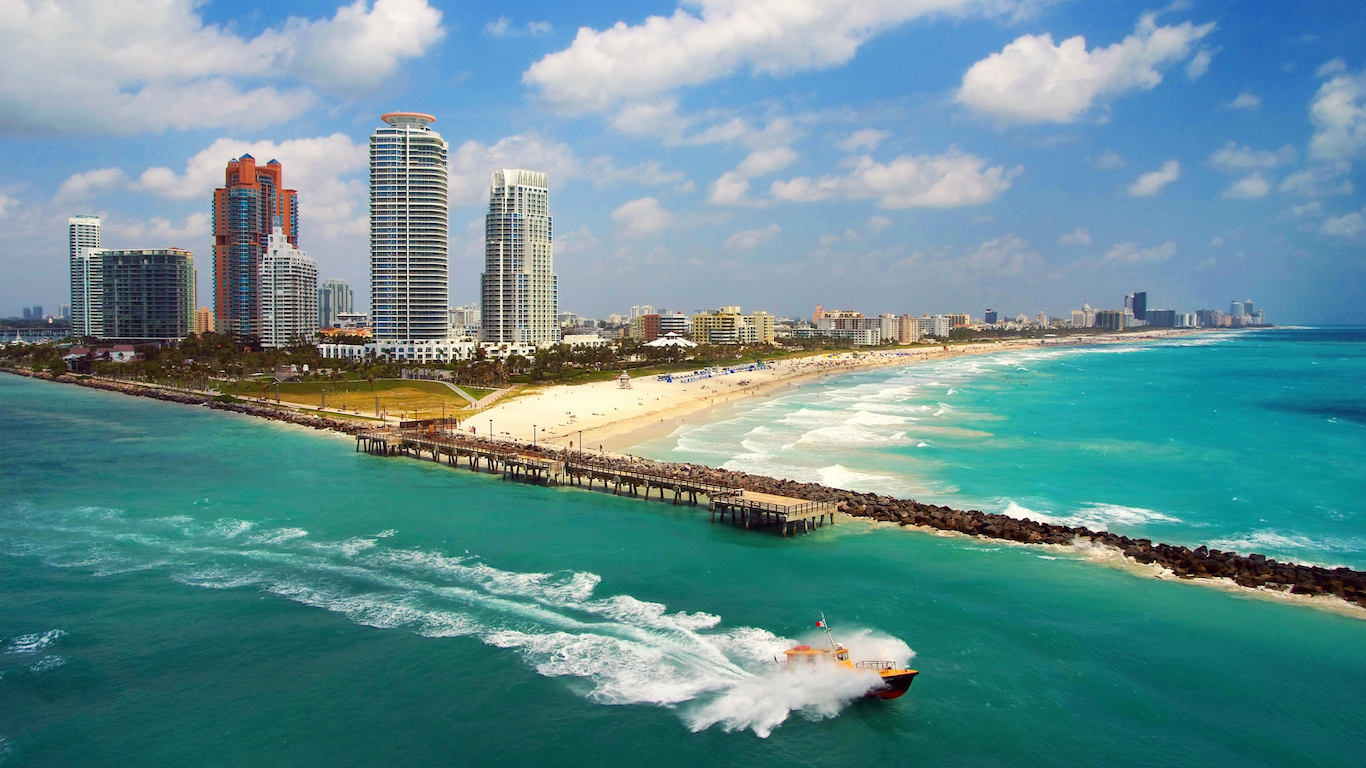
14. Florida
> Top 1% earn at least: $417,587
> Avg. income of top 1%: $1,543,124
> Avg. income of bottom 99%: $39,094
> Adults with a bachelor’s degree: 28.6%

13. Virginia
> Top 1% earn at least: $425,144
> Avg. income of top 1%: $1,109,984
> Avg. income of bottom 99%: $62,844
> Adults with a bachelor’s degree: 38.1%

12. Texas
> Top 1% earn at least: $440,758
> Avg. income of top 1%: $1,343,897
> Avg. income of bottom 99%: $55,614
> Adults with a bachelor’s degree: 28.9%
[in-text-ad-2]

11. Minnesota
> Top 1% earn at least: $443,118
> Avg. income of top 1%: $1,185,581
> Avg. income of bottom 99%: $56,728
> Adults with a bachelor’s degree: 34.8%
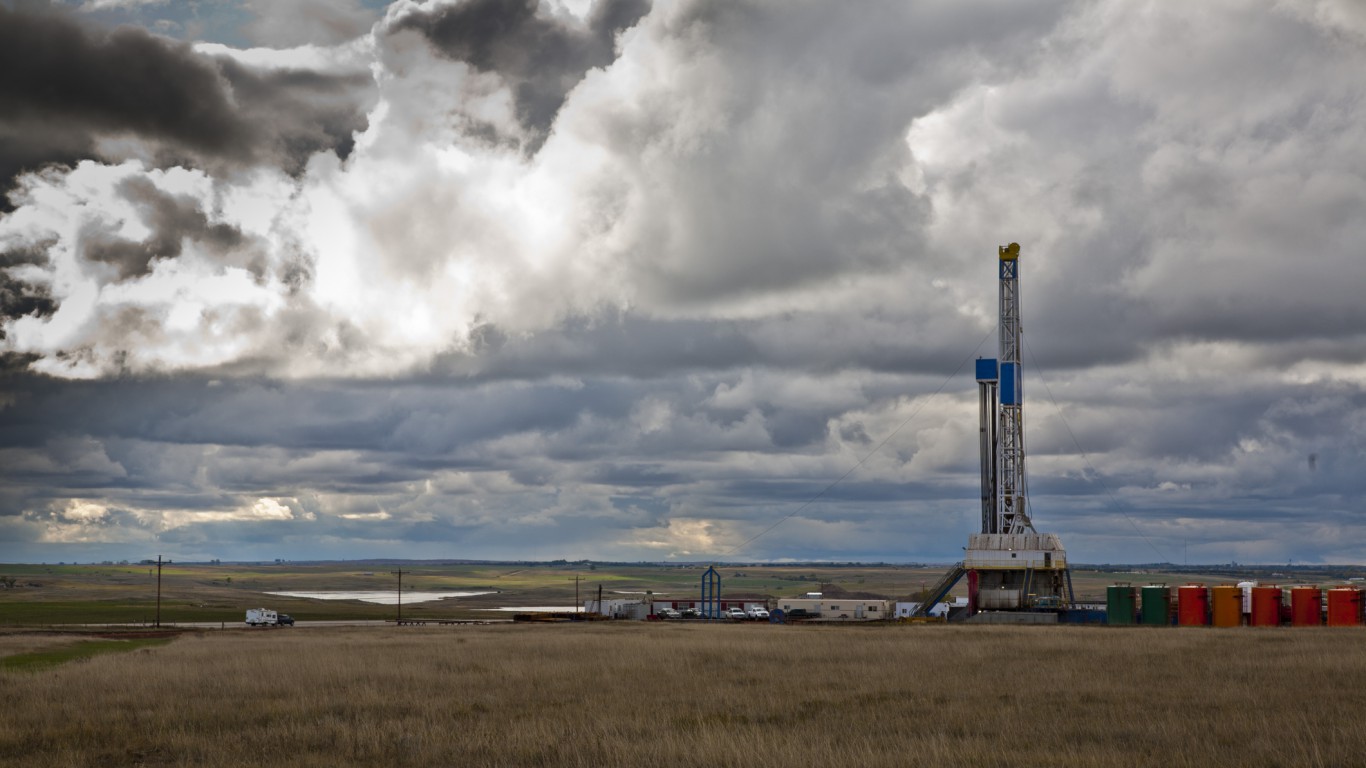
10. North Dakota
> Top 1% earn at least: $445,415
> Avg. income of top 1%: $1,080,845
> Avg. income of bottom 99%: $68,316
> Adults with a bachelor’s degree: 29.6%
[in-text-ad]

9. Maryland
> Top 1% earn at least: $445,783
> Avg. income of top 1%: $1,135,718
> Avg. income of bottom 99%: $63,656
> Adults with a bachelor’s degree: 39.3%

8. Washington
> Top 1% earn at least: $451,395
> Avg. income of top 1%: $1,383,223
> Avg. income of bottom 99%: $57,100
> Adults with a bachelor’s degree: 35.1%

7. Illinois
> Top 1% earn at least: $456,377
> Avg. income of top 1%: $1,412,024
> Avg. income of bottom 99%: $52,216
> Adults with a bachelor’s degree: 34.0%
[in-text-ad-2]

6. Colorado
> Top 1% earn at least: $458,576
> Avg. income of top 1%: $1,261,053
> Avg. income of bottom 99%: $61,165
> Adults with a bachelor’s degree: 39.9%
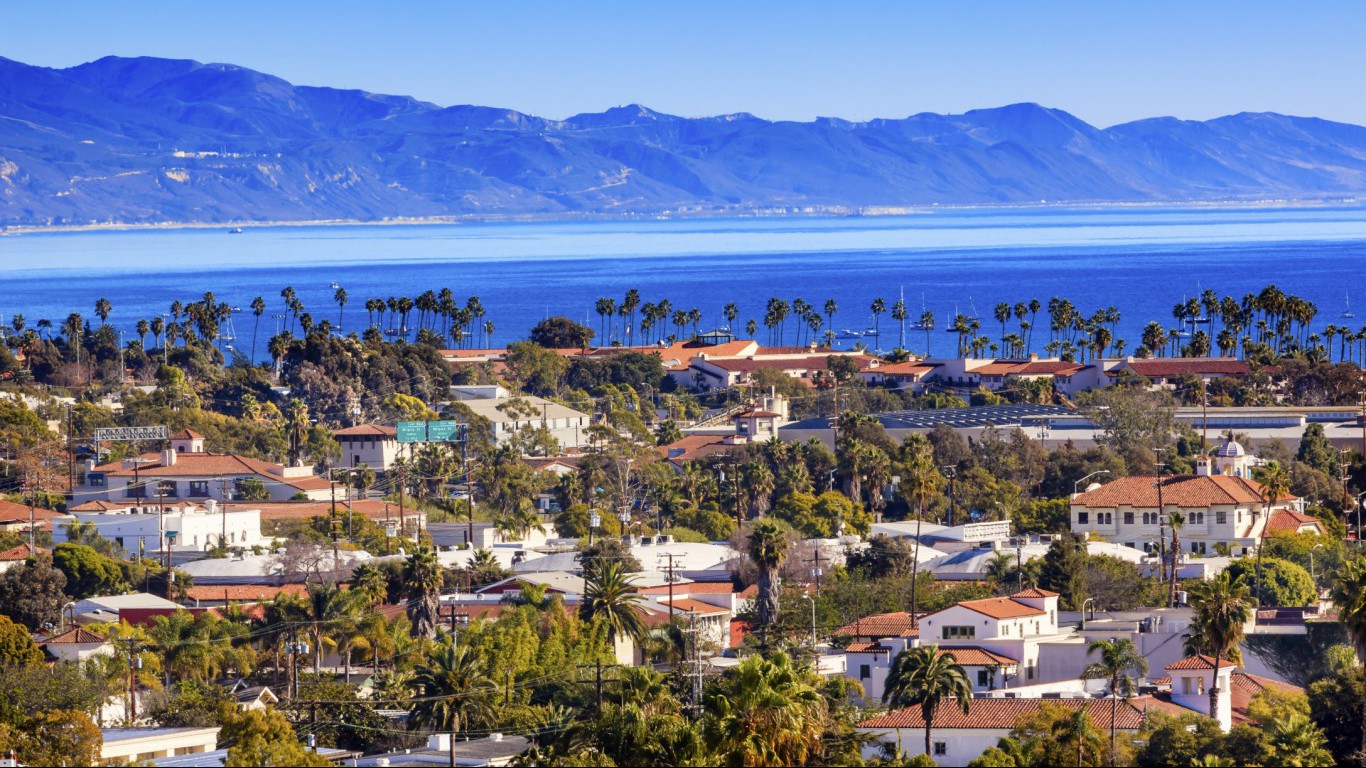
5. California
> Top 1% earn at least: $514,694
> Avg. income of top 1%: $1,693,094
> Avg. income of bottom 99%: $55,152
> Adults with a bachelor’s degree: 32.9%
[in-text-ad]

4. New York
> Top 1% earn at least: $550,174
> Avg. income of top 1%: $2,202,480
> Avg. income of bottom 99%: $49,617
> Adults with a bachelor’s degree: 35.7%

3. Massachusetts
> Top 1% earn at least: $582,774
> Avg. income of top 1%: $1,904,805
> Avg. income of bottom 99%: $61,694
> Adults with a bachelor’s degree: 42.7%

2. New Jersey
> Top 1% earn at least: $588,575
> Avg. income of top 1%: $1,581,829
> Avg. income of bottom 99%: $65,068
> Adults with a bachelor’s degree: 38.6%
[in-text-ad-2]

1. Connecticut
> Top 1% earn at least: $700,800
> Avg. income of top 1%: $2,522,806
> Avg. income of bottom 99%: $67,742
> Adults with a bachelor’s degree: 38.6%
Detailed Findings & Methodology
According to the Economic Policy Institute, growing income inequality is attributable to a number of factors. In earlier decades of the last century, strong unionization in industries like manufacturing, construction, and transportation, and a regularly rising minimum wage coupled with a cultural and legal environment that capped executive compensation helped ensure favorable wage growth for the vast majority of Americans.
Today, many of those conditions no longer exist. Union participation has hit lows not seen since before the Great Depression, the federal minimum wage has less buying power than it did half a century ago, and CEO compensation has increased exponentially in recent decades.
Through investments and ownership of assets such as real estate and company stocks, wealthier Americans are able to expand their wealth far faster than those of lesser means.
The states with the highest thresholds of what it takes to be in the one percent also generally have the greatest degree of income inequality. In New York, a state where the one percent earns at least $550,174 a year, the average income among one percenters is $2.2 million — 44 times the average income of $49,617 among the bottom ninety-nine percent. No state has greater inequality. For comparison, the average one percenter on a national scale earns $1.3 million a year, 26.3 times the average income of $50,107 among the remaining ninety-nine percent.
The states with the wealthiest one-percenters — generally the same states with the greatest income inequality — tend to have higher educational attainment rates. College graduates are more likely to earn higher incomes, but access to a four-year college degree can depend largely on family incomes. This structure serves to reinforce the concentration of wealth at the top.
Of the 10 states with the highest income threshold for the top one percent, nine are home to a larger than typical share of adults with a bachelor’s degree than the national share. Similarly, nine of the 10 states with the lowest income threshold for the top one percent have a lower bachelor’s degree attainment rate than the comparable national rate of 31.3%.
To identify the annual income necessary to be in the top 1% of earners in each state, 24/7 Wall St. reviewed The New Gilded Age: Income Inequality in the U.S. by State, an Economic Policy Institute report published in July 2018. Income figures are from the IRS and are for tax units — which could be a single adult or married couple — and are for 2015. The share of adults with a bachelor’s degree came from the U.S. Census Bureau’s American Community Survey and are for 2016.
Thank you for reading! Have some feedback for us?
Contact the 24/7 Wall St. editorial team.