Special Report
America's Fastest Growing (and Shrinking) Housing Markets

Published:
Last Updated:

A decade has passed since the U.S. housing market crash and the beginning of the 2008 financial crisis. The typical American home lost about a third of its value during the recession. While the median home price has since surpassed its pre-crisis levels and reached an all-time high of $269,000 in the second quarter of 2018, the recovery from the Great Recession has been largely uneven. Some housing markets have even been on the decline in the recent years.
Like anything else, home prices are driven by supply and demand forces, which are highly correlated with the area’s economy, job market, and population changes. Demand tends to be higher in stronger economies, with a healthy job market, and a growing population. While the price of a typical single-family home rose by more the $100,000 in some of the more high-demand metropolitan areas from the second quarter of 2017 to the second quarter of 2018, in a handful of cities, the median home value declined over the past year.
Based on median single-family home price changes over the year through the second quarter from the National Association of Realtors, 24/7 Wall St. reviewed the fastest growing (and shrinking) housing markets.
Click here to see the full list of America’s fastest growing housing markets.
Click here to see the full list of America’s fastest shrinking housing markets.
Click here to see our detailed findings and methodology.
Fastest Growing Housing Markets

25. Greenville-Anderson-Mauldin, SC
> 1-yr. chg. in median home sale price: 9.8%
> Median home sale price 2017 Q2: $197,400
> Median home sale price 2018 Q2: $216,800
> July unemployment: 3.0%
[in-text-ad]

24. Phoenix-Mesa-Scottsdale, AZ
> 1-yr. chg. in median home sale price: 10.0%
> Median home sale price 2017 Q2: $247,300
> Median home sale price 2018 Q2: $272,000
> July unemployment: 4.1%

23. Sacramento–Roseville–Arden-Arcade, CA
> 1-yr. chg. in median home sale price: 10.0%
> Median home sale price 2017 Q2: $340,000
> Median home sale price 2018 Q2: $374,000
> July unemployment: 3.6%
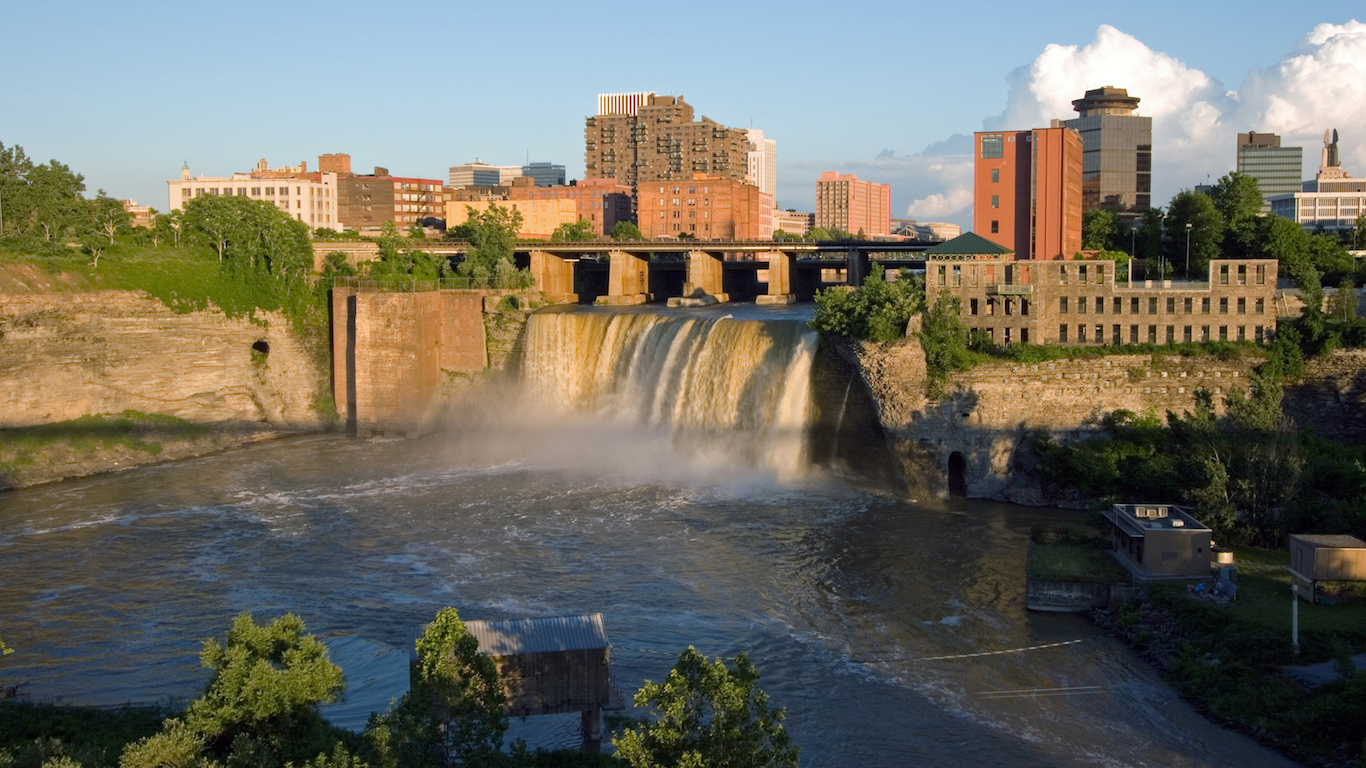
22. Rochester, NY
> 1-yr. chg. in median home sale price: 10.2%
> Median home sale price 2017 Q2: $137,900
> Median home sale price 2018 Q2: $151,900
> July unemployment: 4.2%
[in-text-ad-2]

21. Indianapolis-Carmel-Anderson, IN
> 1-yr. chg. in median home sale price: 10.2%
> Median home sale price 2017 Q2: $176,200
> Median home sale price 2018 Q2: $194,100
> July unemployment: 3.3%
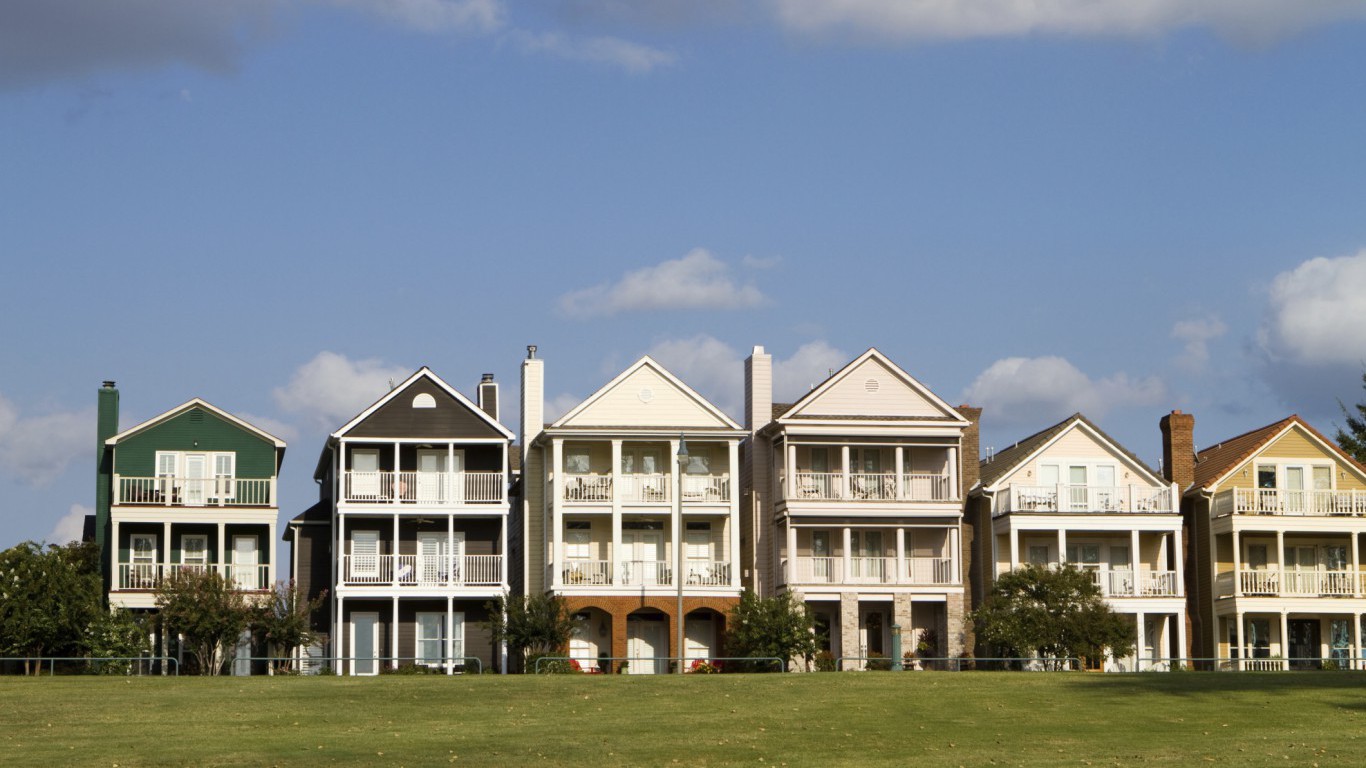
20. Memphis, TN-MS-AR
> 1-yr. chg. in median home sale price: 10.3%
> Median home sale price 2017 Q2: $171,500
> Median home sale price 2018 Q2: $189,100
> July unemployment: 4.4%
[in-text-ad]

19. Deltona-Daytona Beach-Ormond Beach, FL
> 1-yr. chg. in median home sale price: 10.3%
> Median home sale price 2017 Q2: $190,000
> Median home sale price 2018 Q2: $209,500
> July unemployment: 3.8%

18. Huntsville, AL
> 1-yr. chg. in median home sale price: 10.8%
> Median home sale price 2017 Q2: $177,100
> Median home sale price 2018 Q2: $196,200
> July unemployment: 3.6%

17. Kankakee, IL
> 1-yr. chg. in median home sale price: 10.9%
> Median home sale price 2017 Q2: $128,400
> Median home sale price 2018 Q2: $142,400
> July unemployment: 4.8%
[in-text-ad-2]
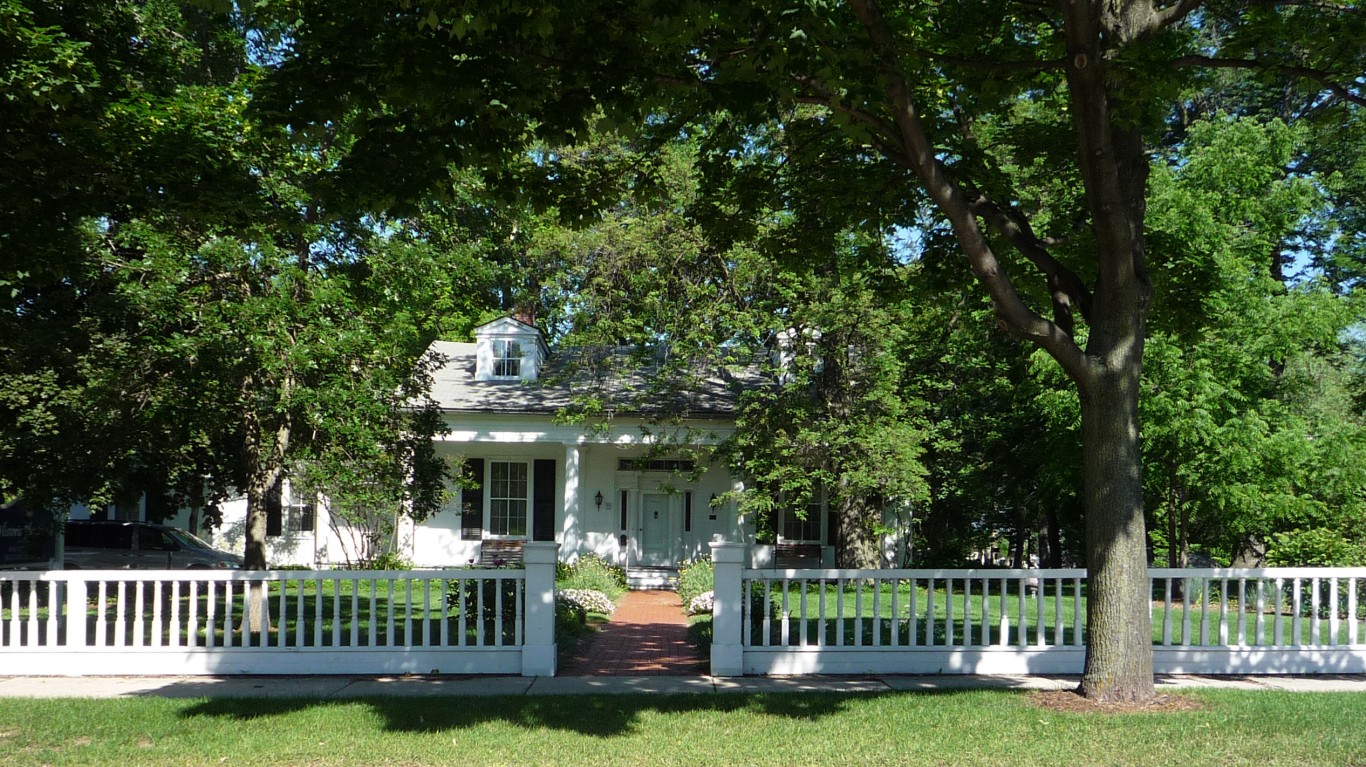
16. Green Bay, WI
> 1-yr. chg. in median home sale price: 11.3%
> Median home sale price 2017 Q2: $163,400
> Median home sale price 2018 Q2: $181,800
> July unemployment: 2.9%

15. Sherman-Denison, TX
> 1-yr. chg. in median home sale price: 11.5%
> Median home sale price 2017 Q2: $166,800
> Median home sale price 2018 Q2: $186,000
> July unemployment: 3.0%
[in-text-ad]

14. Seattle-Tacoma-Bellevue, WA
> 1-yr. chg. in median home sale price: 11.5%
> Median home sale price 2017 Q2: $475,400
> Median home sale price 2018 Q2: $530,300
> July unemployment: 3.7%

13. Atlanta-Sandy Springs-Marietta, GA
> 1-yr. chg. in median home sale price: 11.7%
> Median home sale price 2017 Q2: $204,900
> Median home sale price 2018 Q2: $228,800
> July unemployment: 3.5%
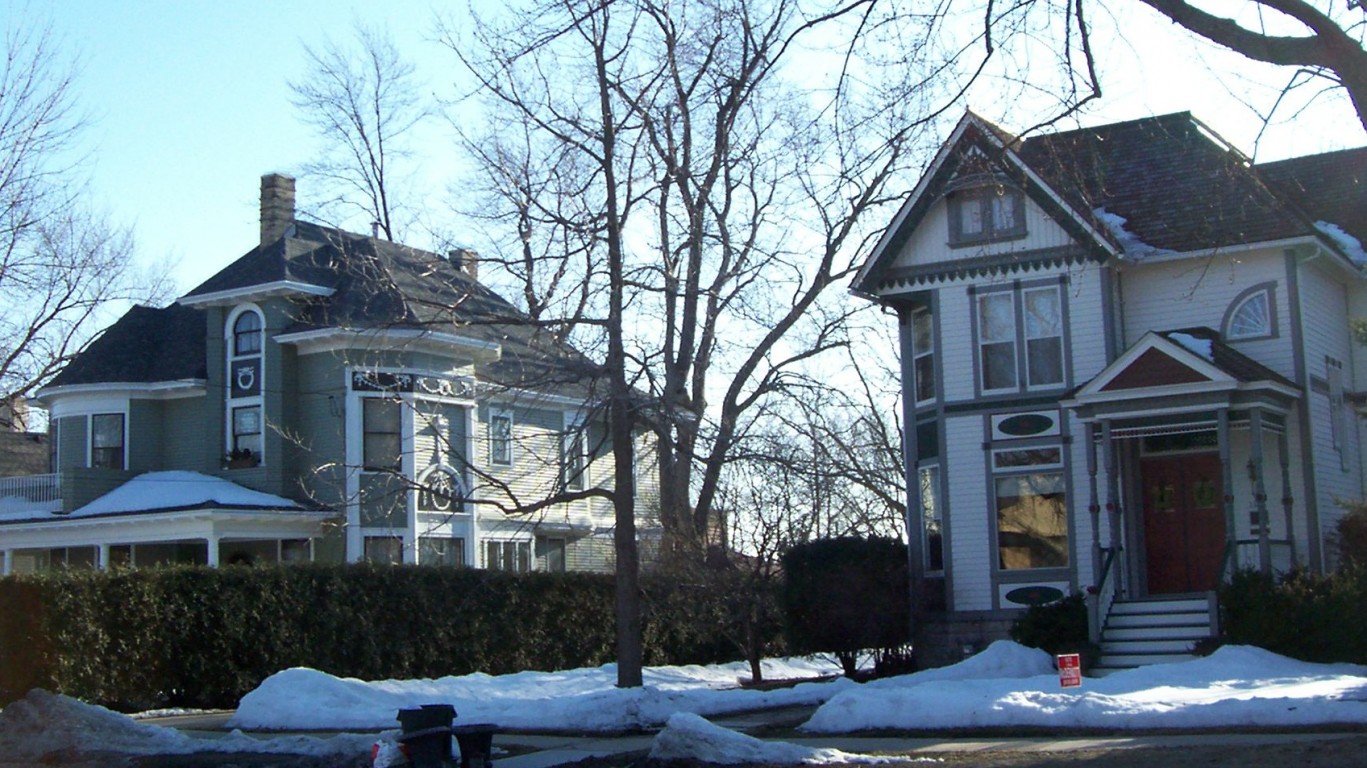
12. Oshkosh-Neenah, WI
> 1-yr. chg. in median home sale price: 12.0%
> Median home sale price 2017 Q2: $140,300
> Median home sale price 2018 Q2: $157,200
> July unemployment: 2.7%
[in-text-ad-2]

11. Yakima, WA
> 1-yr. chg. in median home sale price: 12.3%
> Median home sale price 2017 Q2: $205,800
> Median home sale price 2018 Q2: $231,200
> July unemployment: 6.3%

10. San Francisco-Oakland-Hayward, CA
> 1-yr. chg. in median home sale price: 12.6%
> Median home sale price 2017 Q2: $950,000
> Median home sale price 2018 Q2: $1,070,000
> July unemployment: 2.6%
[in-text-ad]

9. Binghamton, NY
> 1-yr. chg. in median home sale price: 12.8%
> Median home sale price 2017 Q2: $109,000
> Median home sale price 2018 Q2: $122,900
> July unemployment: 4.9%
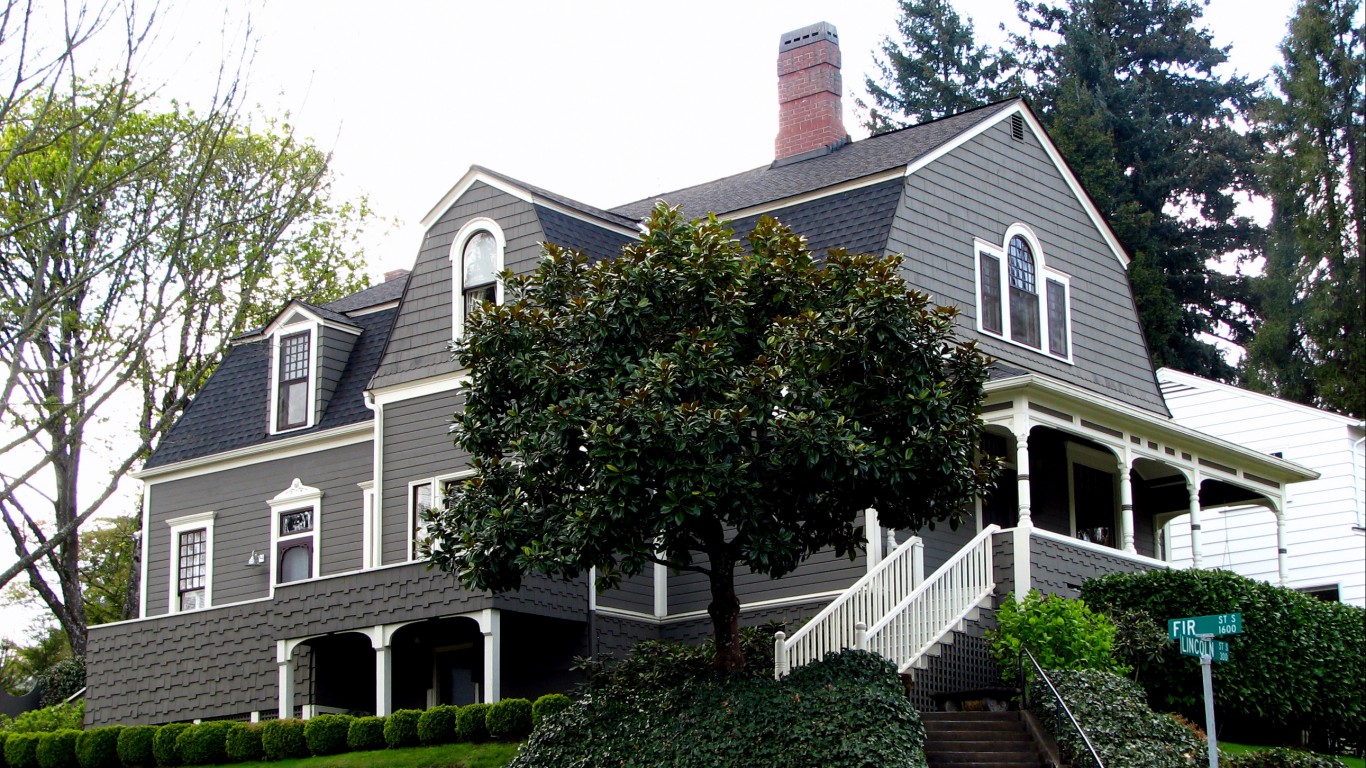
8. Salem, OR
> 1-yr. chg. in median home sale price: 13.2%
> Median home sale price 2017 Q2: $261,400
> Median home sale price 2018 Q2: $295,800
> July unemployment: 4.0%
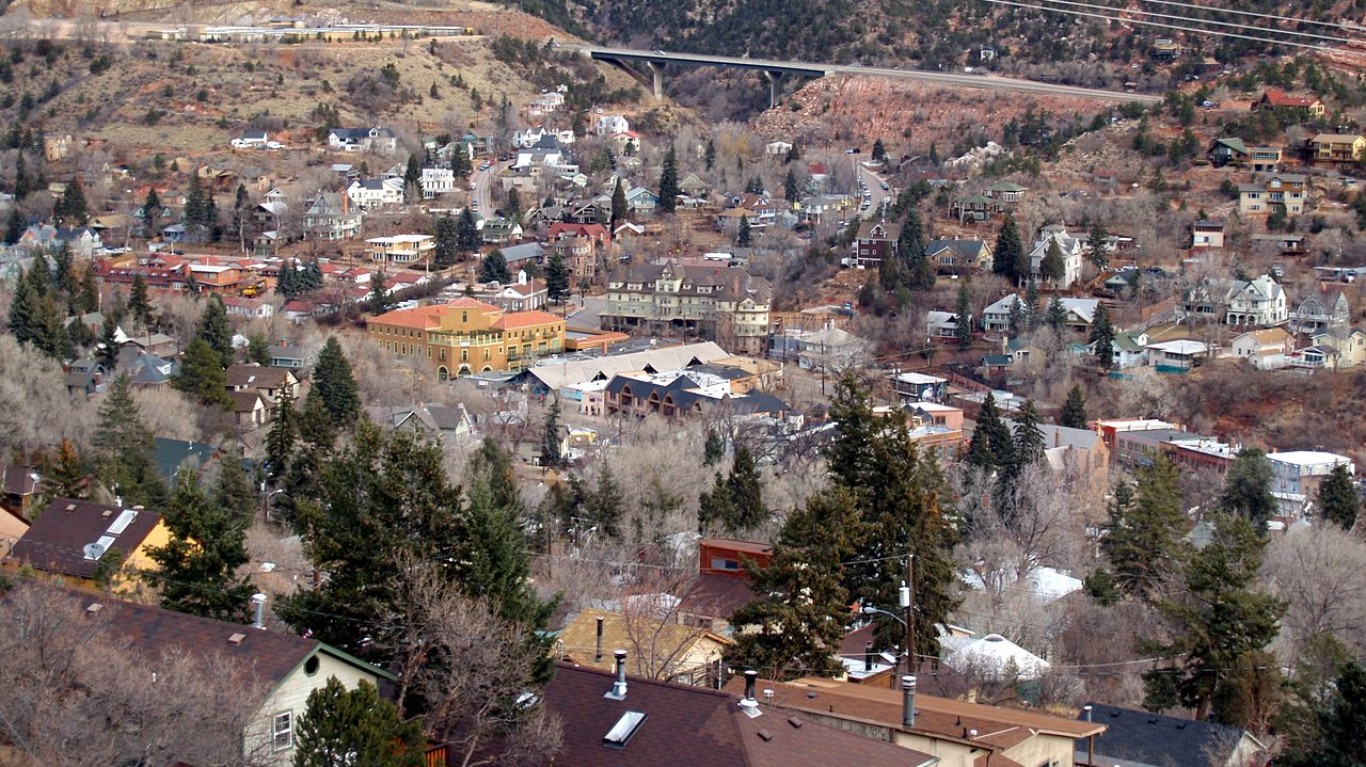
7. Colorado Springs, CO
> 1-yr. chg. in median home sale price: 13.9%
> Median home sale price 2017 Q2: $284,200
> Median home sale price 2018 Q2: $323,600
> July unemployment: 3.6%
[in-text-ad-2]
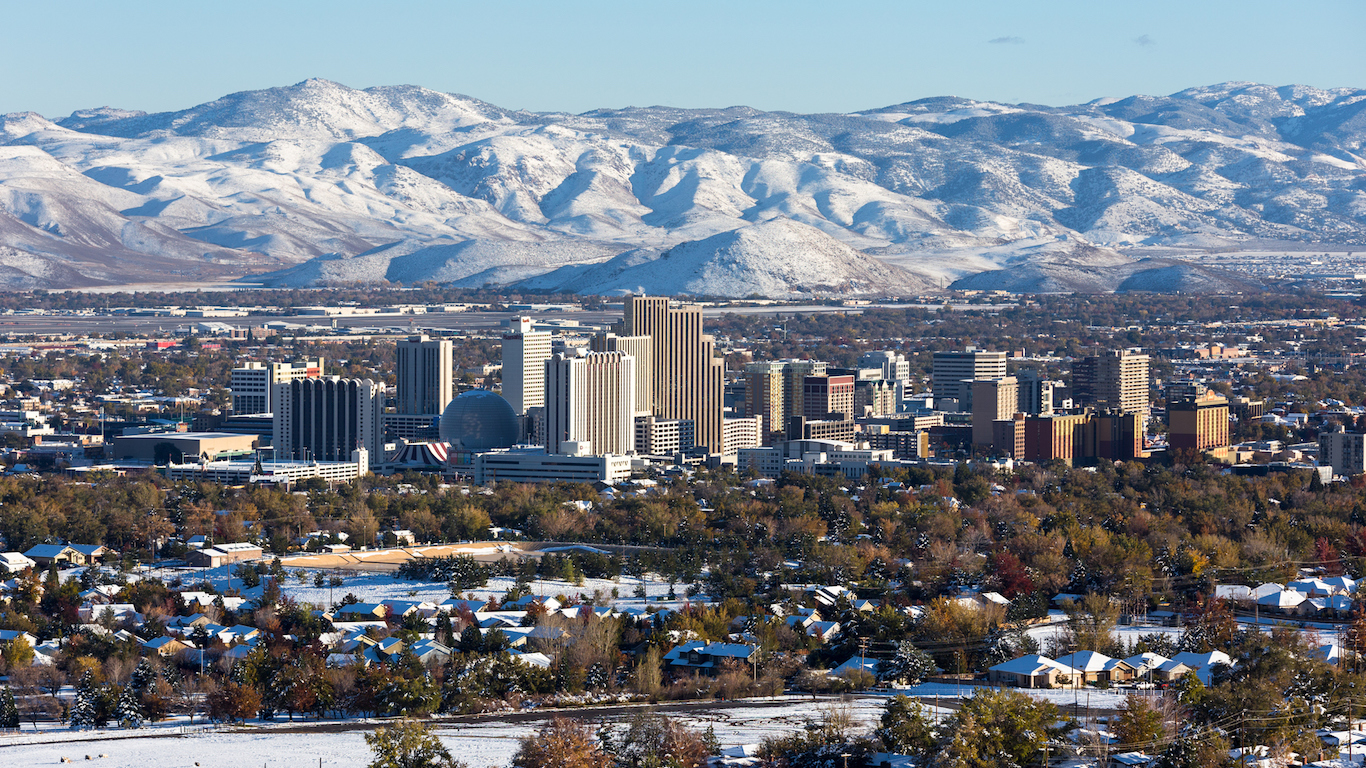
6. Reno, NV
> 1-yr. chg. in median home sale price: 14.0%
> Median home sale price 2017 Q2: $338,800
> Median home sale price 2018 Q2: $386,400
> July unemployment: 3.6%

5. Kennewick-Richland, WA
> 1-yr. chg. in median home sale price: 14.5%
> Median home sale price 2017 Q2: $241,300
> Median home sale price 2018 Q2: $276,300
> July unemployment: 5.5%
[in-text-ad]
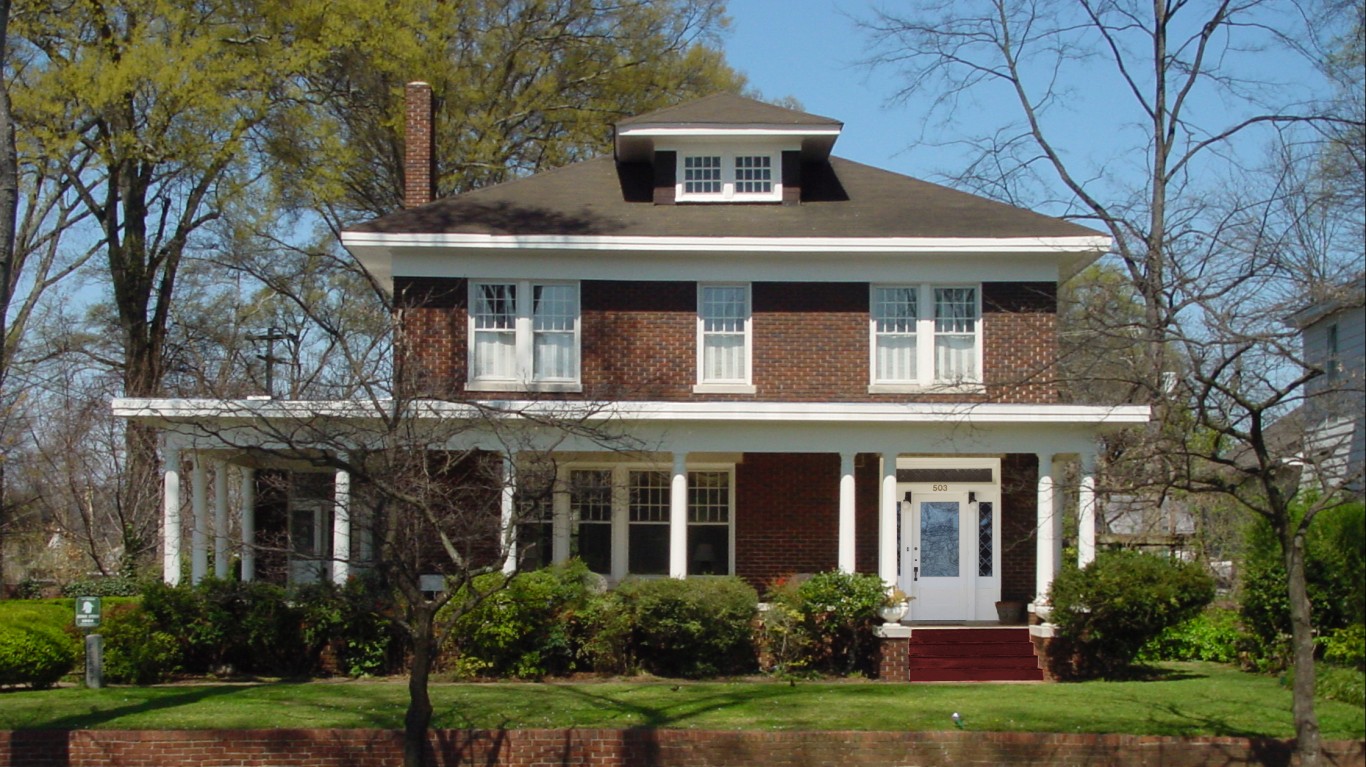
4. Decatur, AL
> 1-yr. chg. in median home sale price: 15.2%
> Median home sale price 2017 Q2: $122,400
> Median home sale price 2018 Q2: $141,000
> July unemployment: 3.7%

3. Boise City-Nampa, ID
> 1-yr. chg. in median home sale price: 15.4%
> Median home sale price 2017 Q2: $227,800
> Median home sale price 2018 Q2: $262,800
> July unemployment: 2.8%

2. Las Vegas-Henderson-Paradise, NV
> 1-yr. chg. in median home sale price: 15.4%
> Median home sale price 2017 Q2: $252,500
> Median home sale price 2018 Q2: $291,400
> July unemployment: 4.5%
[in-text-ad-2]
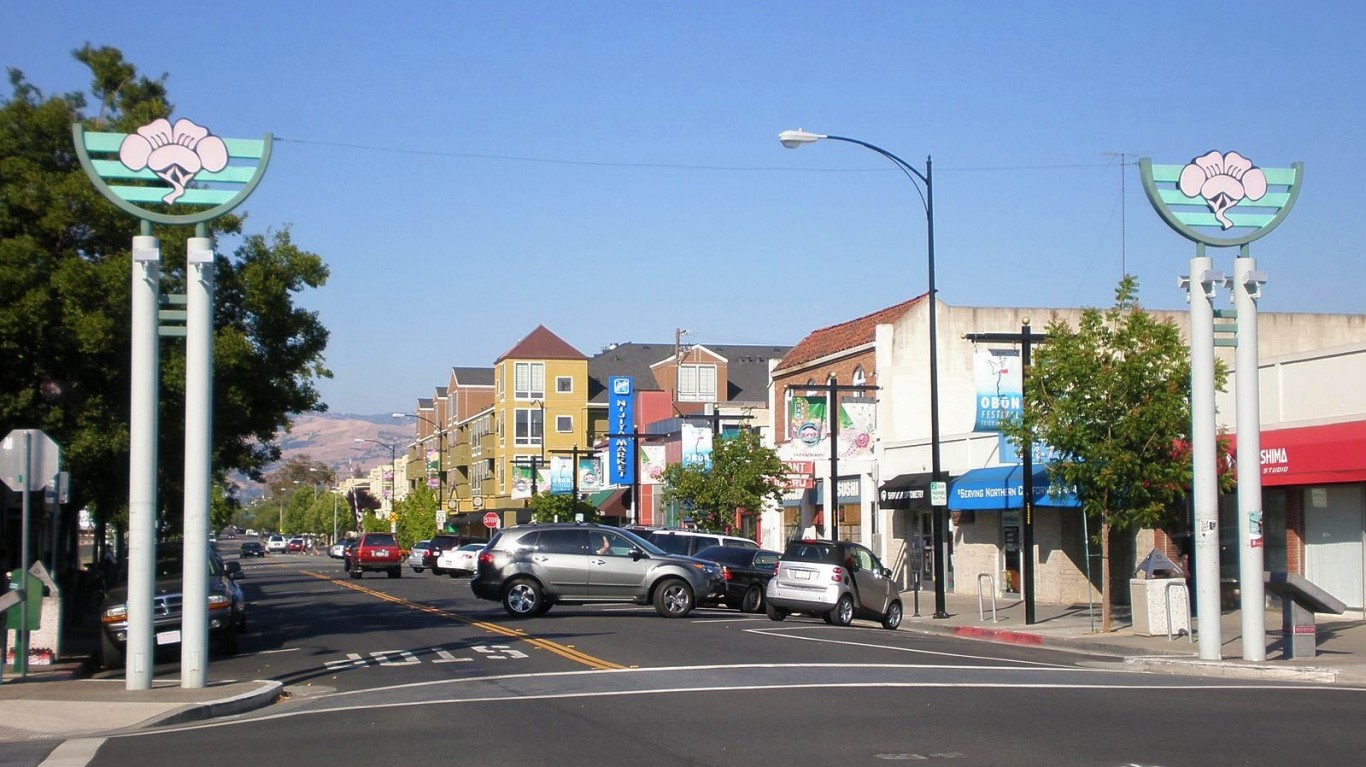
1. San Jose-Sunnyvale-Santa Clara, CA
> 1-yr. chg. in median home sale price: 18.7%
> Median home sale price 2017 Q2: $1,183,400
> Median home sale price 2018 Q2: $1,405,000
> July unemployment: 2.6%
Fastest Shrinking Housing Markets
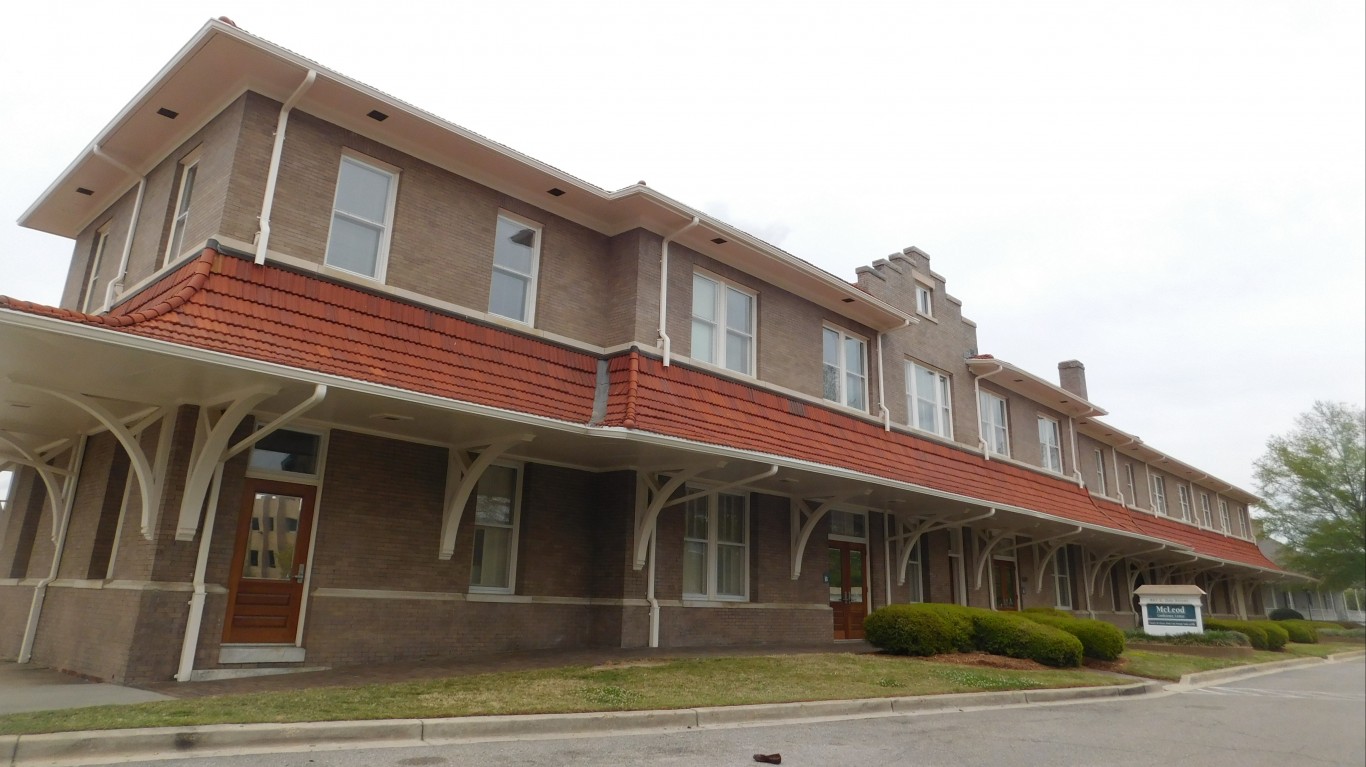
15. Florence, SC
> 1-yr. chg. in median home sale price: -0.2%
> Median home sale price 2017 Q2: $136,400
> Median home sale price 2018 Q2: $136,100
> July unemployment: 3.7%
[in-text-ad]

14. Cape Girardeau, MO-IL
> 1-yr. chg. in median home sale price: -0.5%
> Median home sale price 2017 Q2: $146,500
> Median home sale price 2018 Q2: $145,800
> July unemployment: 3.1%
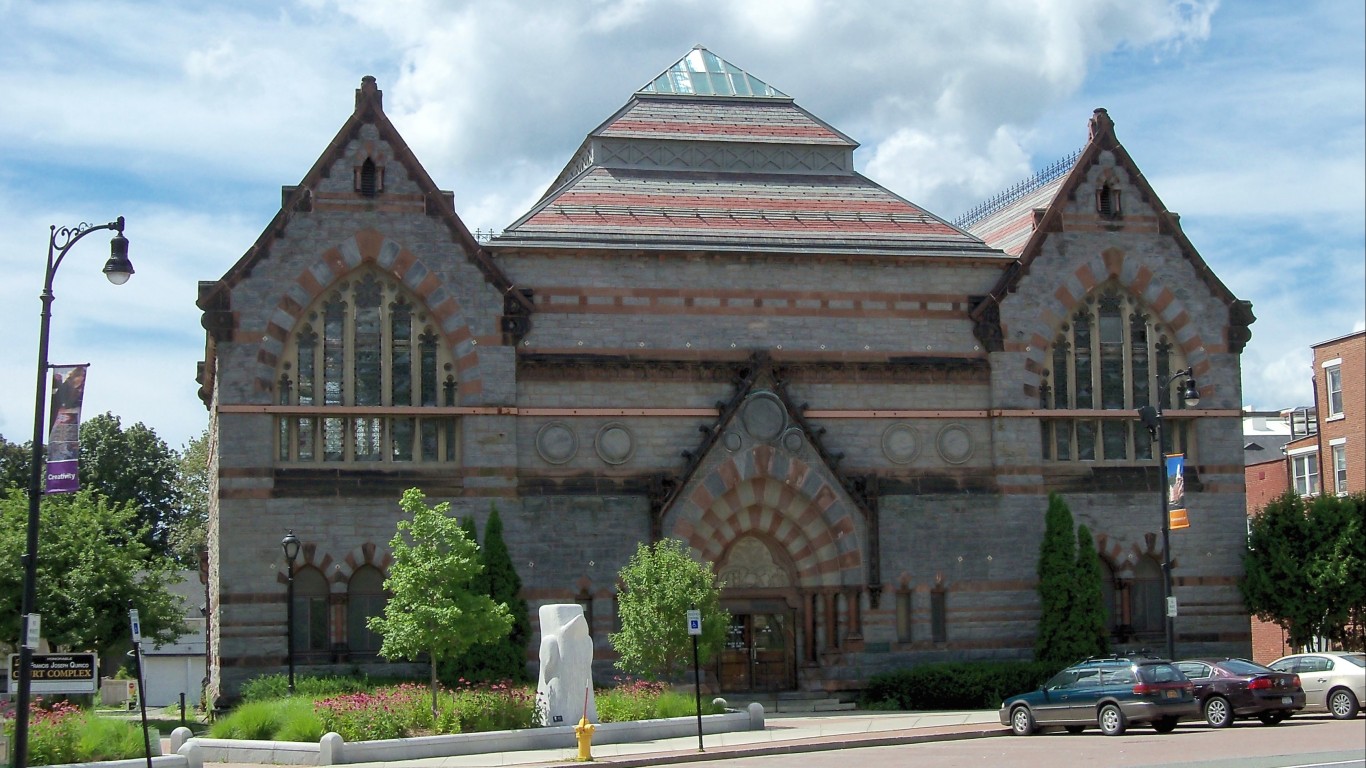
13. Pittsfield, MA
> 1-yr. chg. in median home sale price: -0.6%
> Median home sale price 2017 Q2: $206,800
> Median home sale price 2018 Q2: $205,600
> July unemployment: 4.4%

12. New York-Newark-Jersey City, NY-NJ-PA
> 1-yr. chg. in median home sale price: -0.8%
> Median home sale price 2017 Q2: $414,000
> Median home sale price 2018 Q2: $410,500
> July unemployment: 4.0%
[in-text-ad-2]
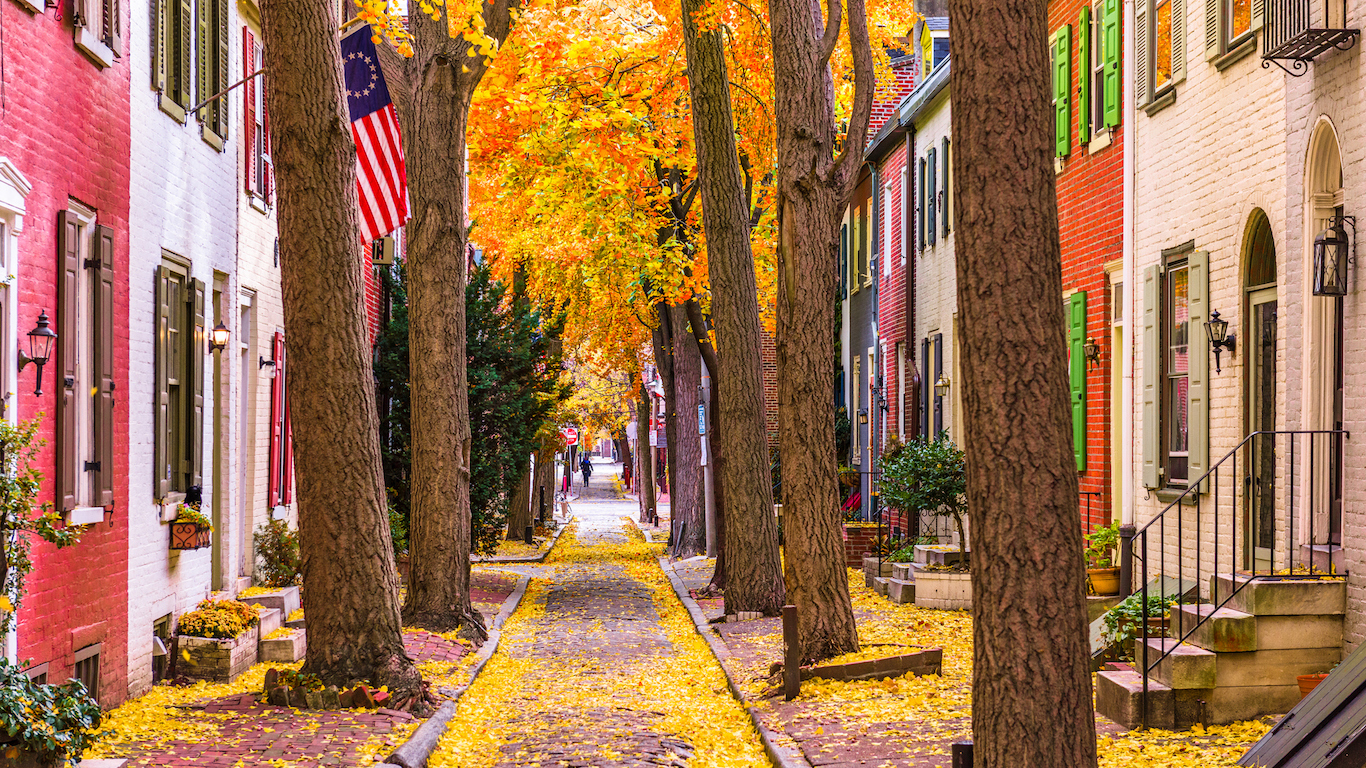
11. Philadelphia-Camden-Wilmington, PA-NJ-DE-MD
> 1-yr. chg. in median home sale price: -1.3%
> Median home sale price 2017 Q2: $239,100
> Median home sale price 2018 Q2: $236,100
> July unemployment: 4.1%
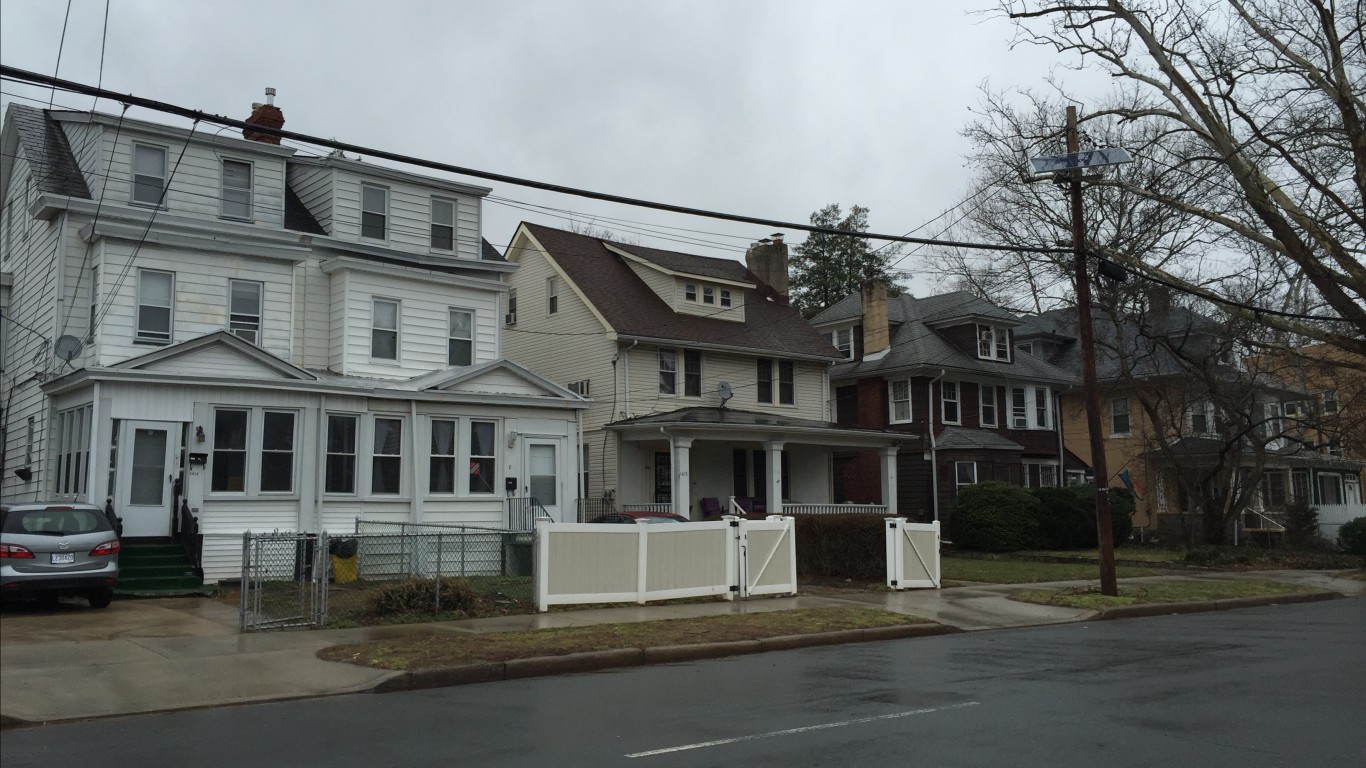
10. Trenton, NJ
> 1-yr. chg. in median home sale price: -1.3%
> Median home sale price 2017 Q2: $262,900
> Median home sale price 2018 Q2: $259,400
> July unemployment: 3.8%
[in-text-ad]

9. Reading, PA
> 1-yr. chg. in median home sale price: -1.3%
> Median home sale price 2017 Q2: $164,700
> Median home sale price 2018 Q2: $162,500
> July unemployment: 4.0%
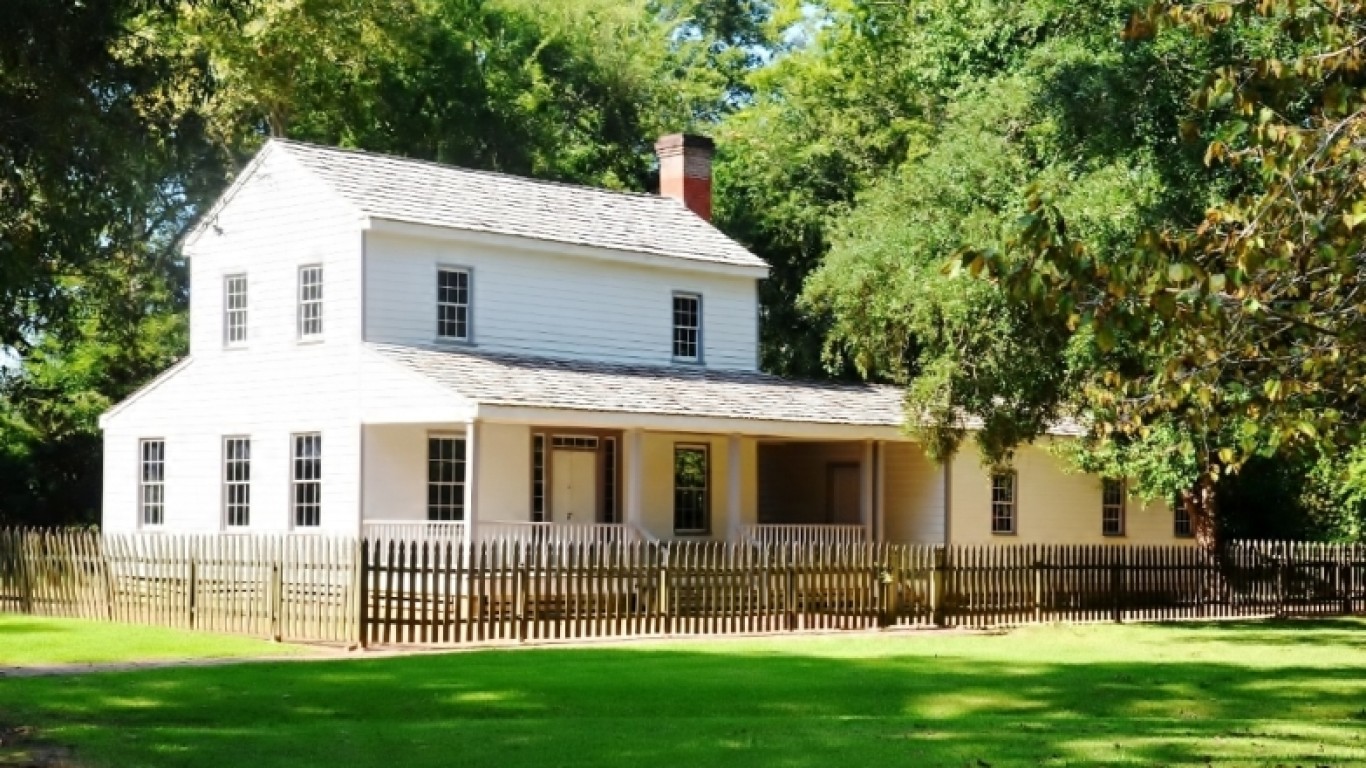
8. Beaumont-Port Arthur, TX
> 1-yr. chg. in median home sale price: -1.6%
> Median home sale price 2017 Q2: $156,100
> Median home sale price 2018 Q2: $153,600
> July unemployment: 6.0%

7. Virginia Beach-Norfolk-Newport News, VA-NC
> 1-yr. chg. in median home sale price: -2.0%
> Median home sale price 2017 Q2: $239,900
> Median home sale price 2018 Q2: $235,000
> July unemployment: 3.2%
[in-text-ad-2]

6. Amarillo, TX
> 1-yr. chg. in median home sale price: -2.2%
> Median home sale price 2017 Q2: $161,700
> Median home sale price 2018 Q2: $158,100
> July unemployment: 2.7%

5. Cumberland, MD-WV
> 1-yr. chg. in median home sale price: -3.4%
> Median home sale price 2017 Q2: $98,200
> Median home sale price 2018 Q2: $94,900
> July unemployment: 6.0%
[in-text-ad]

4. Farmington, NM
> 1-yr. chg. in median home sale price: -4.4%
> Median home sale price 2017 Q2: $184,300
> Median home sale price 2018 Q2: $176,100
> July unemployment: 4.7%

3. Bridgeport-Stamford-Norwalk, CT
> 1-yr. chg. in median home sale price: -4.6%
> Median home sale price 2017 Q2: $495,700
> Median home sale price 2018 Q2: $473,100
> July unemployment: 4.2%
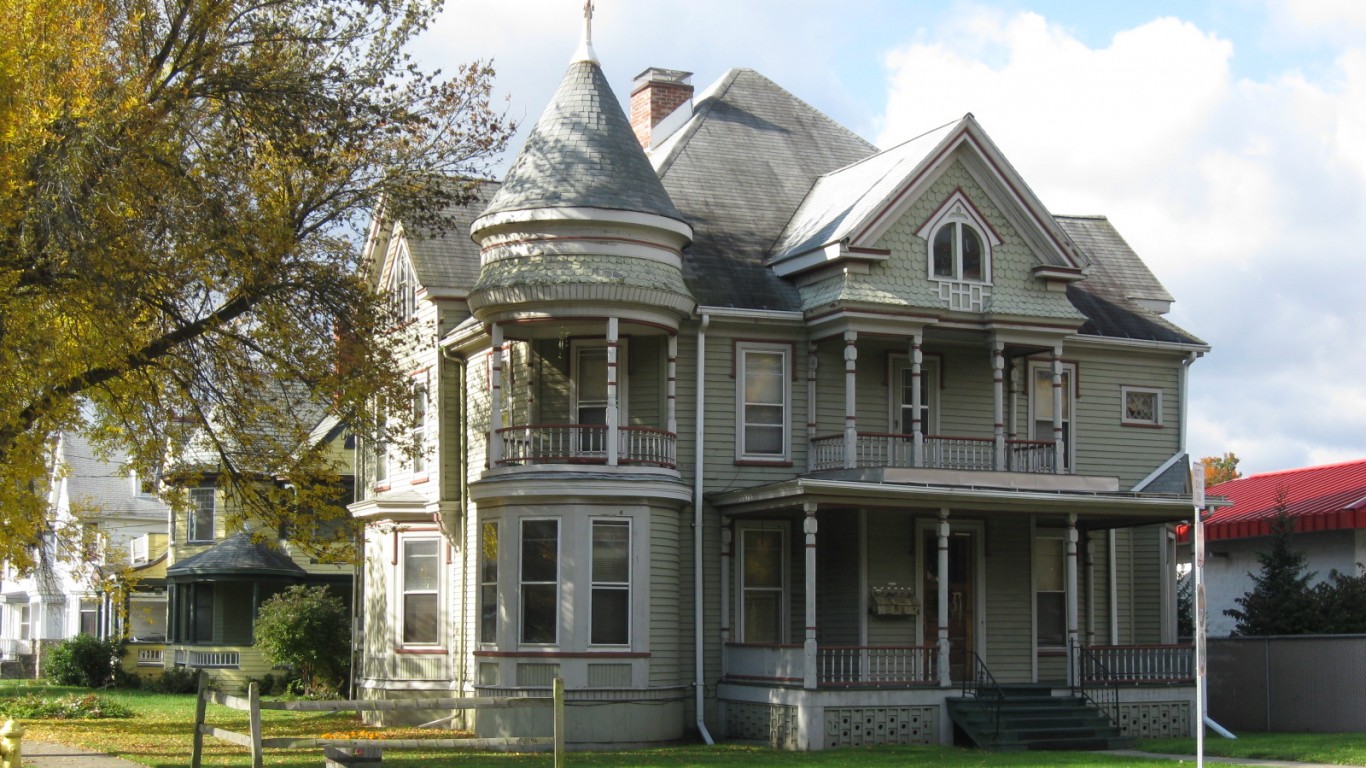
2. Elmira, NY
> 1-yr. chg. in median home sale price: -4.7%
> Median home sale price 2017 Q2: $111,600
> Median home sale price 2018 Q2: $106,300
> July unemployment: 4.8%
[in-text-ad-2]
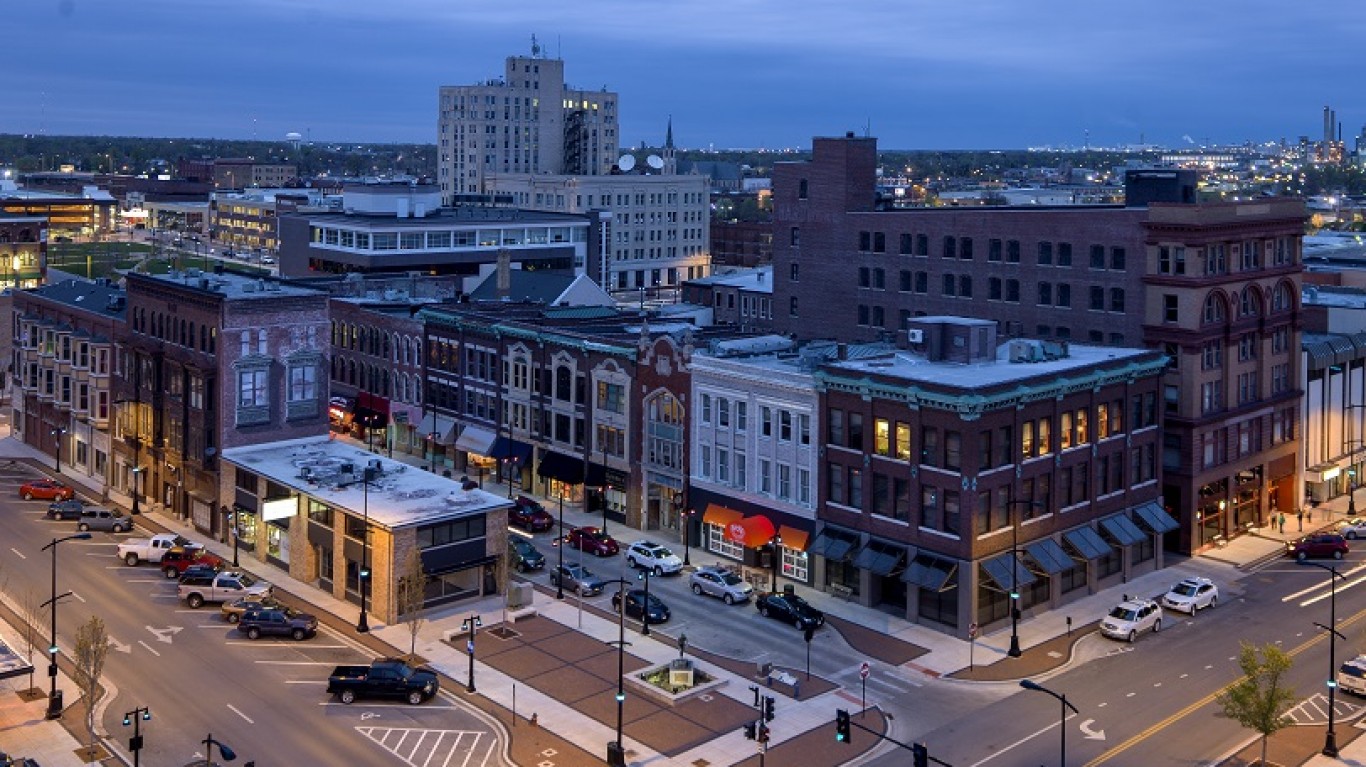
1. Decatur, IL
> 1-yr. chg. in median home sale price: -9.8%
> Median home sale price 2017 Q2: $107,400
> Median home sale price 2018 Q2: $96,900
> July unemployment: 5.3%
Detailed Findings
Demand is the largest contributor to housing price growth. Americans have been moving from large, urban areas in the Northeast to suburban, mid-size cities in the South and West Coast, driving up the price of homes in those fast-growing states. From 2016 to 2017, the population of the South and West grew by 1.0%, five times the 0.2% population growth rate in the Northeast. In 2014, Florida surpassed New York as the third most populous state.
The price of the typical home in the West rose by 8.3% from Q2 2017 to Q2 2018, compared to a price increase of 4.0% in the South, 3.5% in the Midwest, and 2.3% in the Northeast. While 19 of the 25 fastest growing housing markets are in the South and West, seven of the 15 shrinking housing markets are in the Northeast.
In 16 of the 25 fastest growing housing markets, the population grew faster from 2016 to 2017 due to migration than the 0.34% national figure. In all 15 shrinking housing markets, the population declined or grew slower than the nation as a whole due to migration.
One of the main reasons people move is for work. Americans are more likely to move to areas with more employment opportunities, ultimately driving up home prices in areas with low unemployment. In 16 of the 25 fastest growing housing markets, the unemployment rate is below the 3.9% national rate. In 10 of the 15 shrinking housing markets, the unemployment rate is above the national unemployment rate.
While population growth can contribute to economic growth, rising home prices in many housing markets with rapid population growth have reduced affordability for the average resident. Nationwide, the median household income rose 4.7% over the past year as the median home value rose 5.3%. In all 25 of the fastest growing housing markets, the home price-to-income ratio rose faster than the national figure, meaning housing became less affordable. In San Jose, California, the housing market with the most rapid home value growth, the median household income rose by just 6.8% as the home price rose 18.7% — the largest reduction in affordability of any city.
Methodology
To identify the 25 fastest growing (and 15 shrinking) housing markets, 24/7 Wall St. reviewed the largest and smallest home change in median home price over the 12 months through the second quarter of this year. Single-family home price data for the 180 metropolitan areas reviewed came from the National Association of Realtors. Unemployment rates for metropolitan areas are for July 2018 from the Bureau of Labor Statistics. Data on population change due to net international migration from 2016 to 2017 came from the U.S. Census Bureau.
If you’re one of the over 4 Million Americans set to retire this year, you may want to pay attention. Many people have worked their whole lives preparing to retire without ever knowing the answer to the most important question: am I ahead, or behind on my goals?
Don’t make the same mistake. It’s an easy question to answer. A quick conversation with a financial advisor can help you unpack your savings, spending, and goals for your money. With Zoe Financial’s free matching tool, you can connect with trusted financial advisors in minutes.
Why wait? Click here to get started today!
Thank you for reading! Have some feedback for us?
Contact the 24/7 Wall St. editorial team.