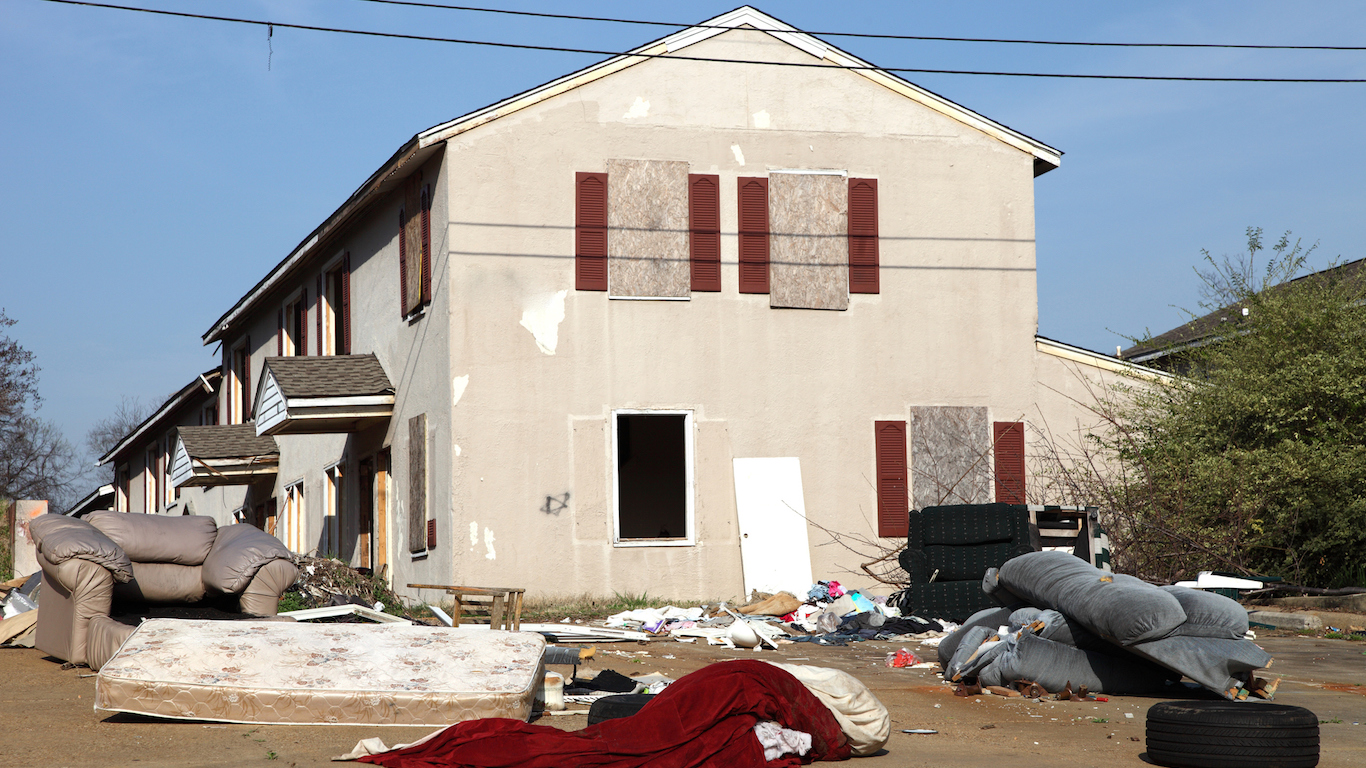
The U.S. Census estimates that 13.4% of Americans, about 42 million, lived below the poverty line in 2017.
Of course, poverty is far from evenly distributed across the United States, and depending on a person’s race, gender, occupation, and social status, Americans are far less, or far more, likely to live in poverty. Some groups are more than twice as likely to experience poverty as the average American.
Both personal responsibility and structural pressures can lead to poverty, and experts often argue which affects poverty more. But some factors outside of the control of the individual — including being a woman, black, Hispanic, a child, or a disabled person — are an indicator that one is more likely to live in poverty.
Greg Acs is vice president at the Income and Benefits Policy Center of the Urban Institute, a economic and social policy think tank. Acs helped explain the complexity of poverty, and why those certain groups are more likely to experience poverty. “The issue with poverty is that it’s both a cause and a consequence of factors in the economy and society and personal decisions. So you’ll find some groups that have higher poverty rates than others in no small part due to their inability to generate a lot of income on their own as a result of historical, economic, social, and personal factors.”
24/7 Wall St. reviewed 2017 American Community Data from the U.S. Census Bureau to identify 11 distinct groups of Americans who are more likely than their peers to live in poverty. It is important to note that the more commonly reported poverty rate is based on the Census Bureau’s Current Population Survey, but to consistently use the level of detail required to break down poverty rates for specific groups, we used American Community Survey data in all cases.
Some of the groups on this list are more likely to grow up in difficult homes, poor neighborhoods, and inadequate school systems. They face discrimination and limited work or advancement opportunities, and the effects of generational poverty, all which make it more likely they will live in poverty.
Click here to see the faces of poverty in the United States
Click here to see our detailed findings and methodology
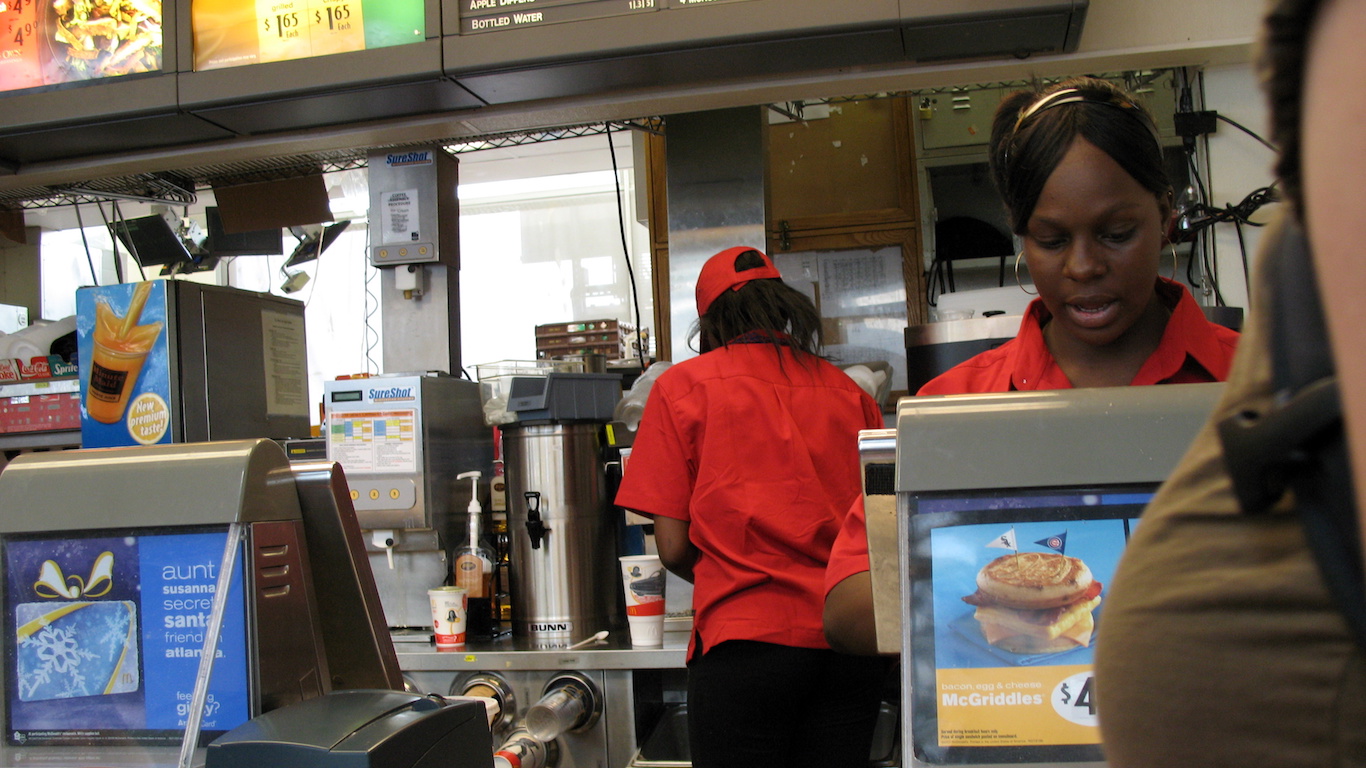
11. Service workers
> Poverty rate: 10.7%
> Total in poverty: 26.2 million
> Service workers as pct. of U.S. population: 8.2%
> Service workers as pct. of poor population: 6.6%
The 10.1% poverty rate among service workers might not seem especially high, given that the national poverty rate is 13.4%, but Americans who are employed are far less likely to live in poverty than those who are not. For example, only 4.9% of America’s full-time workforce lived below the poverty line, according to the Bureau of Labor Statistics, half the poverty rate among service workers. Service workers represent a major part of the American workforce, and a large share of service workers earn minimum wage or close to it. As of 2017, two-thirds of all American workers earning the minimum wage or less were in service occupations. The current federal minimum wage is $7.25 an hour, which, assuming a 40-hour work week, would not be enough to bring an individual with no dependents above the poverty level. Many states and municipalities have already passed, or are currently considering passing, legislation to increase the local minimum wage to $15 an hour.
[in-text-ad]
10. Women
> Poverty rate: 14.5%
> Total in poverty: 23.6 million
> Women as pct. of U.S. population: 51.0%
> Women as pct. of poor population: 55.4%
While 12.2% of men in the United States live in poverty, the poverty rate for women is 14.5%. Because women face a number of unique challenges they at a greater risk of poverty and financial hardship. Women are paid far less than men — women earned 81.3% of men’s median earnings in the second quarter of 2018. While much of this gap can be explained by the kinds of occupations women occupy, the pay gap between men and women persists even when job duties and qualifications are equal. Women with masters and doctoral degrees earn 71.9% of what men with a similar education earn, and they are paid less in nearly every occupation. Women are also more likely than men to work in low-paying occupations and spend more time providing unpaid caregiving to children or elderly family members.

9. Hispanics and Latinos
> Poverty rate: 19.4%
> Total in poverty: 11.2 million
> Hispanics and Latinos as pct. of U.S. population: 18.2%
> Hispanics and Latinos as pct. of poor population: 26.2%
Some 19.4% of Hispanic and Latino Americans live in poverty, far above the nationwide poverty 13.4% poverty rate for all Americans. Two factors contributing to the high poverty rate among Hispanics and Latinos are the group’s relatively low education and earnings levels. Just 16.0% of Hispanic and Latino adults have a bachelor’s degree, half of the nationwide college attainment rate of 32.0% — for all races. Individuals with a college degree are more likely to hold advanced, high-paying jobs and report higher incomes overall. In the second quarter of 2018, the typical Hispanic or Latino workers earned just 76.9% of the median earnings for all workers.
A large share of Latino workers also face racial discrimination that can reduce the likelihood of gaining employment and ultimately lead to lower earnings. According to a poll conducted by National Public Radio, the Robert Wood Johnson Foundation, and Harvard T.H. Chan School of Public Health, one in three Hispanics and Latinos living in America report being discriminated against when applying for jobs.
8. Children under five
> Poverty rate: 20.2%
> Total in poverty: 3.9 million
> Children under 5 as pct. of U.S. population: 6.1%
> Children under 5 as pct. of poor population: 9.2%
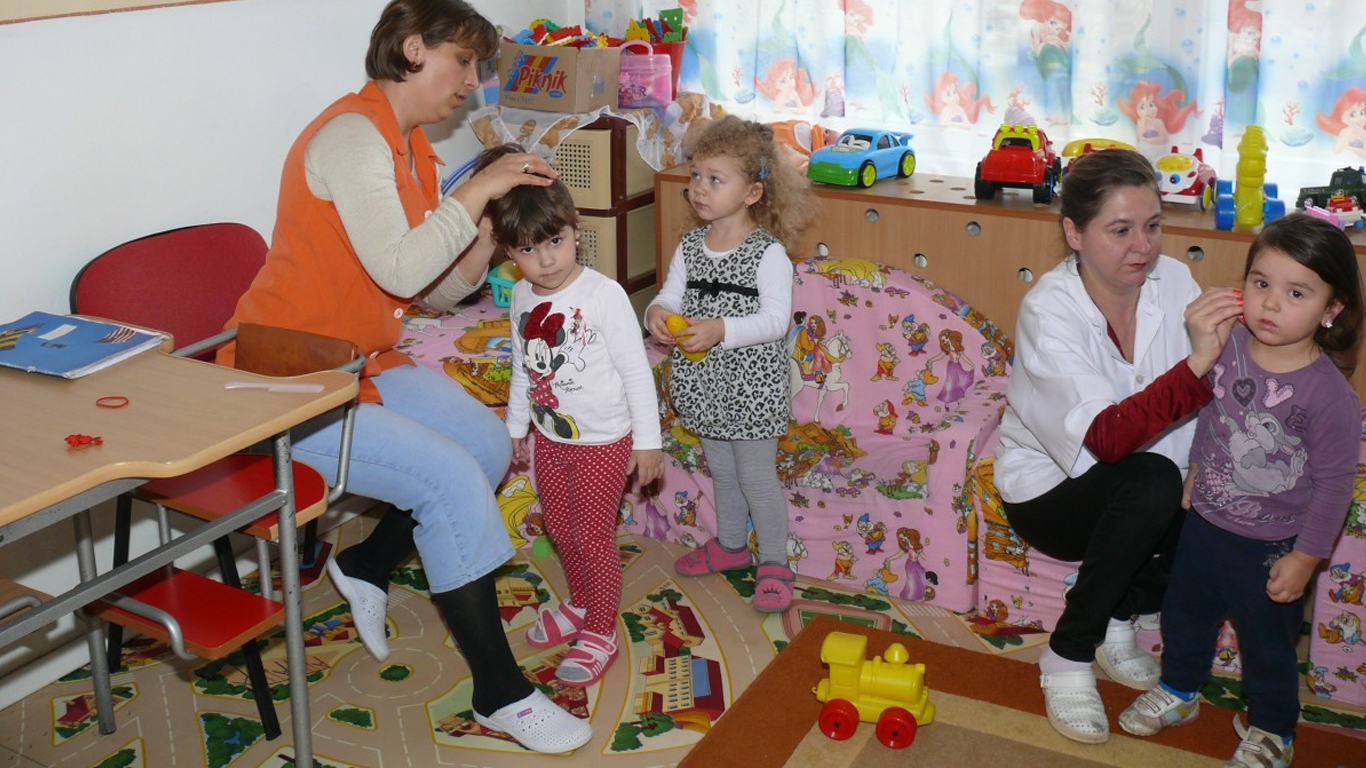
Children cannot earn incomes on their own, and so they are reliant entirely on the incomes of their parents to stay out of poverty. Compared to working-age adults or senior citizens, children are significantly more likely to live in poverty — 18.4% of Americans under age 18 live in poverty, compared to 12.6% of 18 to 64 year olds and 9.3% of senior citizens. And the most vulnerable children are the youngest. While 17.8% of children age 5 to 17 live in poverty, 20.2% of children under 5-years-old do.
[in-text-ad-2]
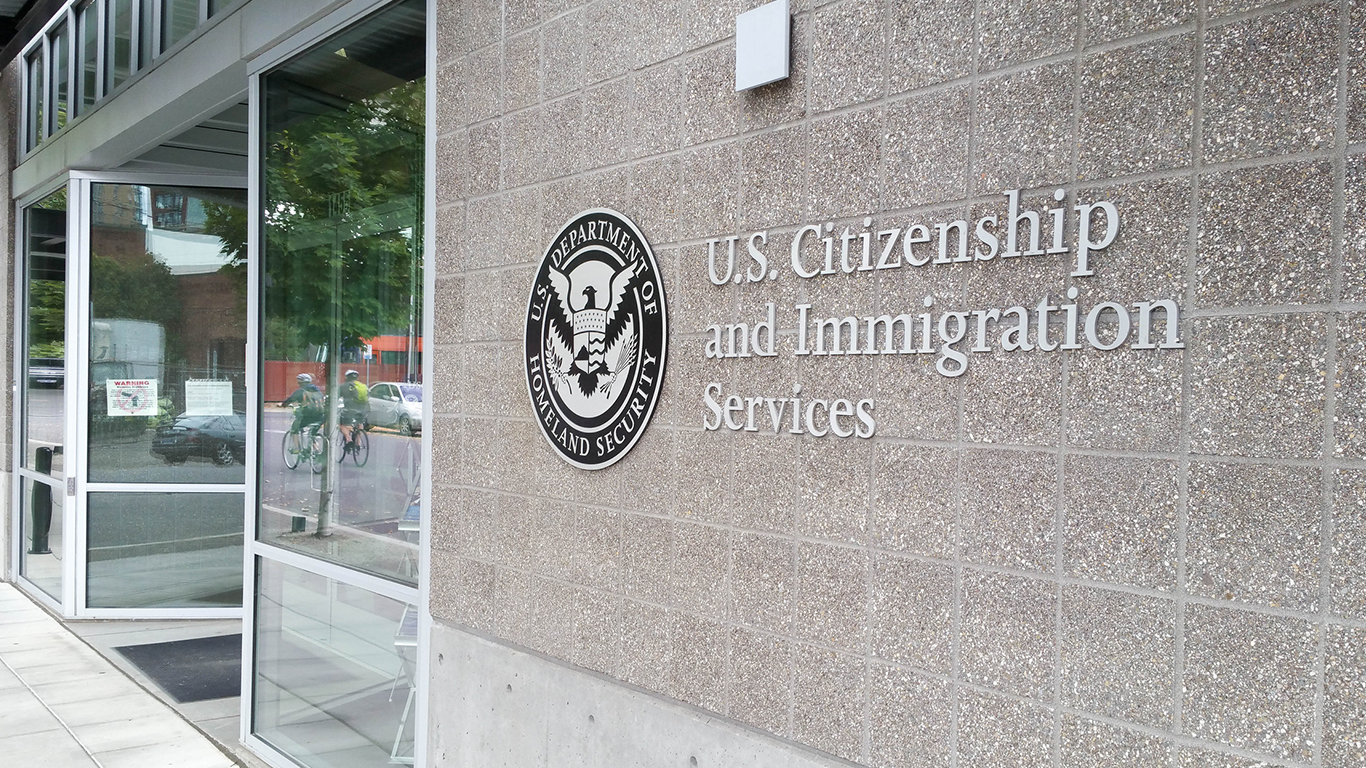
7. Non-citizen immigrants
> Poverty rate: 20.4%
> Total in poverty: 4.5 million
> Non-citizens as pct. of U.S. population: 7.0%
> Non-citizens as pct. of poor population: 10.6%
Of the 44 million immigrants to the United States, slightly less than half have become citizens. Regardless of citizenship status, foreign-born people living in the United States are more likely than natural born Americans to live in poverty. About 20% of non-citizen immigrant residents earn poverty wages. Finding steady employment as an immigrant can be particularly difficult due to language barriers, discrimination, and more. Permanent employment status can help pave the path to citizenship, which helps explain why those who are not yet citizens are particularly likely to earn low wages. The Census is widely believe to heavily undercount those who currently live in the country illegally, and poverty estimates for this group likely far exceed poverty rate of other immigrant groups.

6. Black and African Americans
> Poverty rate: 23.0%
> Total in poverty: 9.1 million
> African Americans as pct. of U.S. population: 12.5%
> African Americans as pct. of poor population: 21.4%
Black and African Americans living in the United States face a wide range of institutional obstacles that make earning a steady, livable income, as well as the possibility of escaping poverty, extremely difficult. Black Americans are more than twice as likely as whites or Asian Americans to live in poverty. According to a report by the Brookings Institution, black Americans encounter inequalities in education, discrimination in the workplace, ineffective parenting, high incarceration rates, and more. One in eight Americans are black, but black Americans make up more than one-fourth of the nation’s poor population.
[in-text-ad]

5. Adults with less than a high school diploma
> Poverty rate: 24.7%
> Total in poverty: 6.3 million
> Adults w/o a high school diploma as pct. of U.S. population: 8.1%
> Adults w/o a high school diploma as pct. of poor population: 14.9%
While there are several famous Americans who dropped out of high school or college and are now successful billionaires, generally educational attainment is a strong indicator of one’s earnings potential. Most jobs that pay above poverty wages require, at the very least, a high school diploma, and a large share also require a bachelor’s degree. Among American adults, typical earnings correspond directly with educational attainment. The typical adult who did not graduate from high school earns $20,924 a year, roughly $8,000 less than median earnings for those graduated high school but did not proceed to higher education. The typical American with just a bachelor’s degree earns $51,094 a year, over $30,000 more than the median earnings for Americans who have not graduated high school.

4. American Indian and Alaska Natives
> Poverty rate: 25.4%
> Total in poverty: 670,571
> American Indian and Alaska Natives as pct. of U.S. population: 0.8%
> American Indian and Alaska Natives as pct. of poor population: 1.6%
Native Americans are still dealing with the effects of 400 years of persecution and discrimination. At the time of colonization, the U.S. government forced tribes onto remote reservations that often lacked natural resources or arable soil. Today, American Indians have the highest poverty rate of any major racial group in the United States, with one in four living below the poverty line. Those who live on reservations face obstacles such as food insecurity and associated health problems like diabetes.
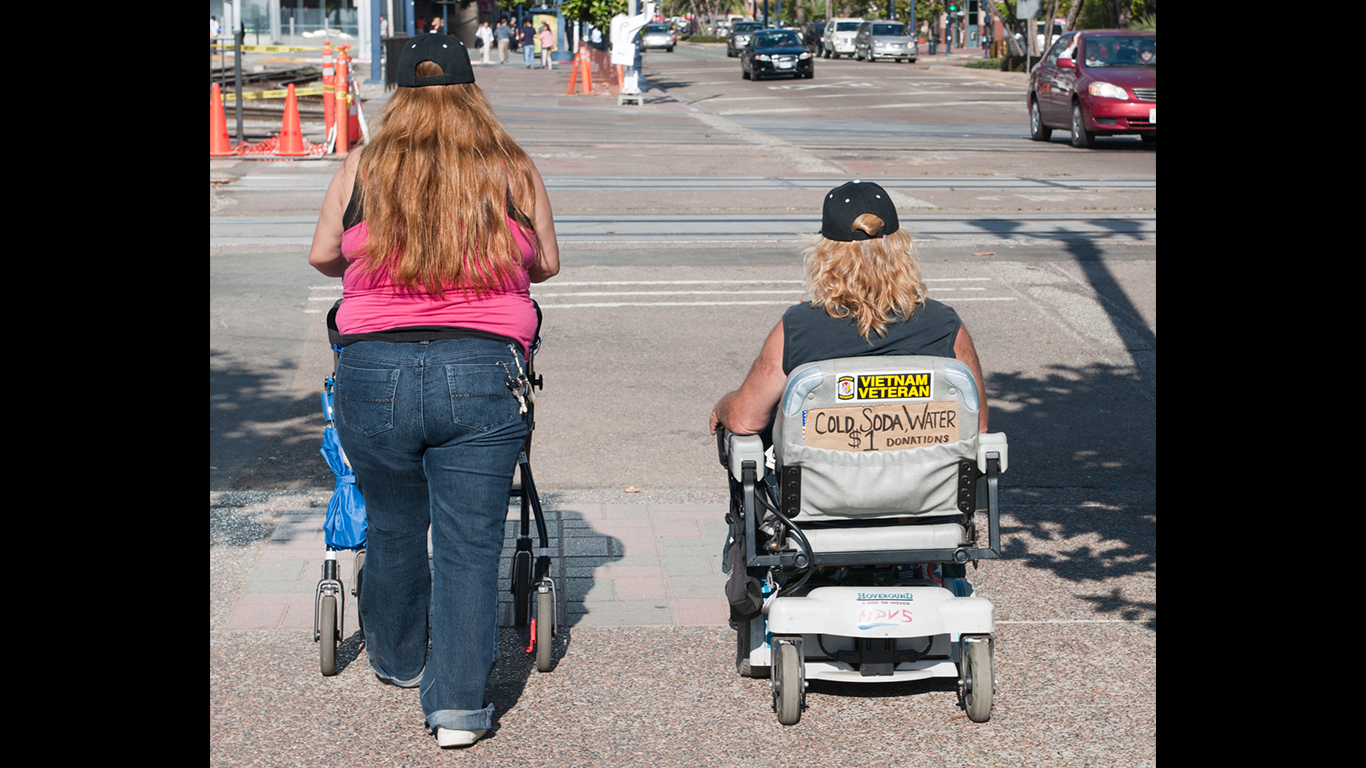
3. Americans with a disability
> Poverty rate: 25.7%
> Total in poverty: 9.6 million
> Disabled as pct. of U.S. population: 11.8%
> Disabled as pct. of poor population: 22.6%
As is the case with many conditions associated with poverty, causality goes both ways. Those who have a disability have a higher risk of becoming poor, and those who are poor have a higher risk of becoming disabled. Those with a disability, physical or otherwise, are much more likely to be unable to work. In 1990, the U.S. government passed the Americans With Disabilities Act, designed to ensure the financial security of people with a debilitating condition or injury. Still, evidence suggests that workplace discrimination continues, and the disabled generally have a harder time finding steady work and earning above-poverty wages. The unemployment gap between the disabled and not disabled has actually widened since the ADA was passed.
[in-text-ad-2]
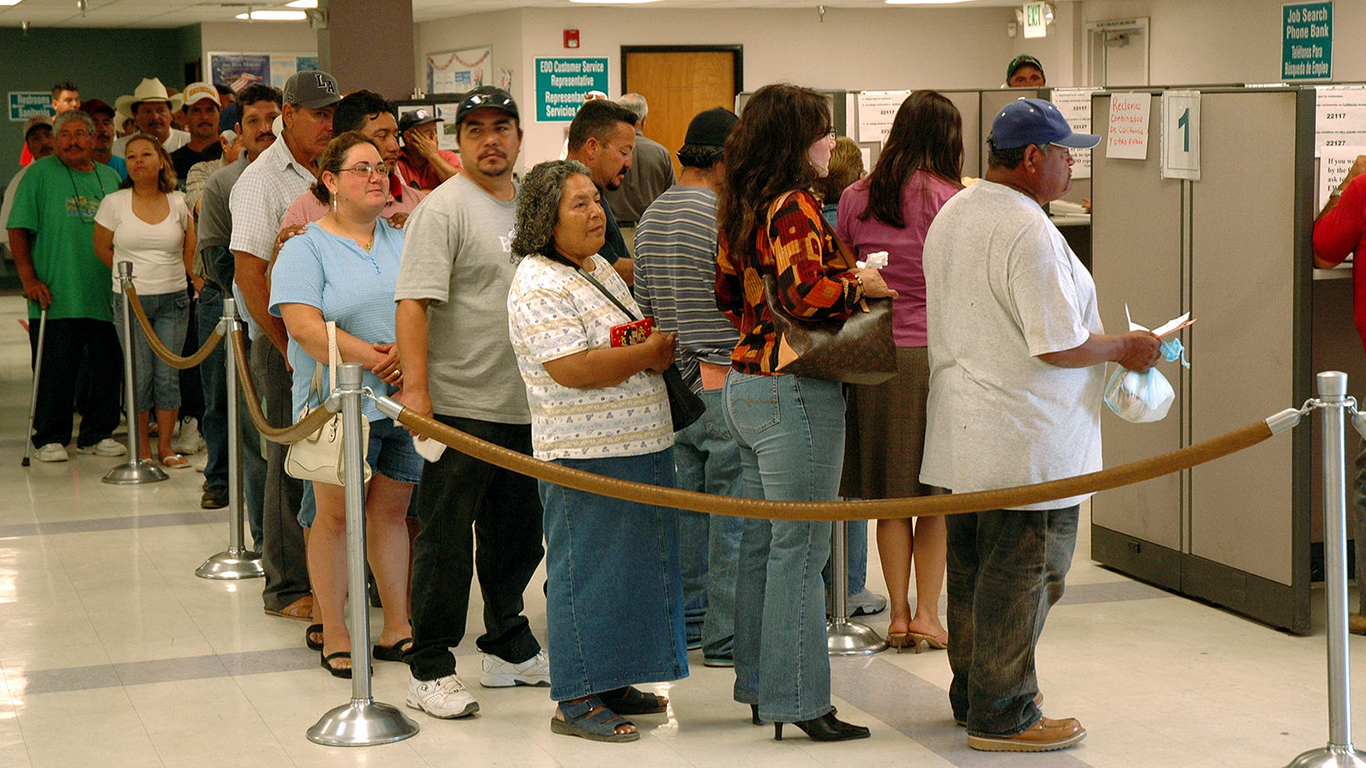
2. The unemployed
> Poverty rate: 30.4%
> Total in poverty: 2.6 million
> Unemployed as pct. of U.S. population: 2.7%
> Unemployed as pct. of poor population: 6.1%
Many people who live in poverty work full- or part-time, earning poverty level wages, but one of the more obvious contributors of poverty is earning no wages at all. Just 4.9% of those who were employed at least 27 weeks in 2016 lived in poverty. More than 30% of Americans who were unemployed and actively seeking work lived in poverty. Those who are unemployed are eligible for state unemployment benefits, but these are often not enough to escape poverty, particularly if the unemployed person has dependents to support. Those who live in poverty are also more likely to have difficulty finding employment for many reasons, including the fact that those growing up in poverty are less likely to have high school and higher education.
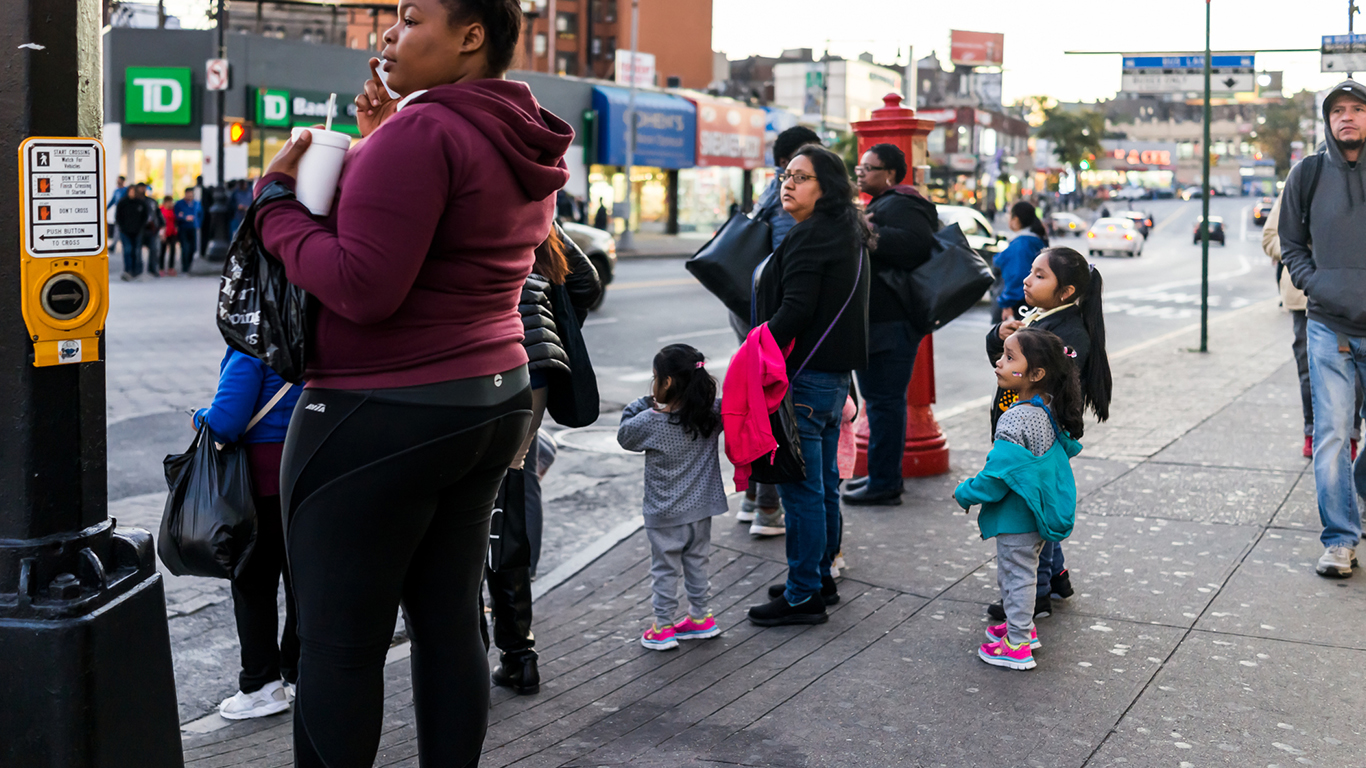
1. Single recent mothers
> Poverty rate: 44.3%
> Total in poverty: 592,588
> Unmarried recent mothers as pct. of U.S. population: 0.4%
> Unmarried recent mothers as pct. of poor population: 1.4%
A dependent child can be a significant cost burden, especially for single parent, and is often enough to push the parent — often a mother — and child into poverty. Among recent single mothers, an astounding 44.3% live in poverty. In comparison, just 11.4% of married recent mothers live in poverty. While an unplanned-for pregnancy can occur among people of all social and economic levels, low-income women have far more unwanted pregnancies than higher-income women. A 2011 study published in the New England Journal of Medicine found that low-income women were five times more likely to have an unplanned pregnancy than high-income women.
Detailed Findings
Most people who live above the poverty line are able to do so through their jobs. For this reason, the groups that have higher poverty rates generally are less likely to be steadily employed, or are less likely to have high-salaried positions. The disabled and the poorly-educated, for example, are two of the most likely groups to be in poverty because they either cannot access certain kinds of jobs or are less attractive to potential high-paying jobs.
The importance of not only being employed but also well paid in order to stay out of poverty is evident in the poverty rate among Americans employed in the service industry, which, at 10.7%, is about twice the poverty rate for those who have jobs. Even full-time service industry workers, many of whom earn minimum wage, often earn poverty incomes.
“In service industries, many of these jobs don’t require the highest level of skill or education or training,” Acs said. “They do require a lot of personal responsibility and reliability, but because there’s a large competitive pool of folks that can do those jobs, and to the extent that those jobs are gendered and there are gender differences that are baked into the way we value work, those jobs tend to pay less, and hence folks working in those jobs tend to have higher poverty rates.”
Many of the groups on this list are racial or ethnic groups, including black, Hispanic, and American Indians. While the poverty rate for white Americans is around 10%, it is roughly double for black and Hispanic Americans, and it is 25% for American Indians.
Attempting to explain the difficulties in assessing why certain social or economic groups have higher poverty rates, Acs said, “Racial and ethnic differences [in the poverty rate] are really complex.” He added that one major reason for the disparity is that these groups appear to have more limited access to opportunities for gainful employment, due in part to, he said “…discrimination, and the long-term structural barriers that affect the circumstance of the neighborhoods in which African Americans grew up, as opposed to neighborhoods where whites grew up.”
For many specific groups in poverty, there is the argument that individuals in high-poverty groups did not take actions that could lift them out of poverty, including obtaining an education and leaving their impoverished neighborhood. “But,” Acs noted, “the reason they didn’t do those things was that their poverty or intergenerational poverty reduced those opportunities factors, and society constrains where people can live and what jobs they get offered.”
Having a child is a significant expense on a family, and larger families must earn more to escape poverty. Poor families are therefore more likely to be large, and for this reason, children are more likely than both working-age adults and the elderly to live in poverty.
Single parents, particularly single mothers, are one of the most impoverished groups in America, in part because impoverished Americans are more likely to have unwanted pregnancies, and also because supporting a child with a single source of income is more burdensome on an individual, who cannot rely on a partner for flexibility in childcare or income.
Methodology
Based on data from the U.S. Census Bureau and the Bureau of Labor Statistics, 24/7 Wall St. identified population groups that are more likely to live in poverty compared to other comparable groups. The share of service workers in poverty is based on the July 2018 U.S. Bureau of Labor Statistics Report “A profile of the working poor, 2016,” which identifies the poverty rate for all workers employed in a profession for 27 weeks or more during 2016. The remainder of data on poverty rates came from the U.S. Census Bureau’s 2017 American Community Survey (ACS) one-year estimates. Average earnings by occupation, sex, and race also came from the 2017 ACS.
Get Ready To Retire (Sponsored)
Start by taking a quick retirement quiz from SmartAsset that will match you with up to 3 financial advisors that serve your area and beyond in 5 minutes, or less.
Each advisor has been vetted by SmartAsset and is held to a fiduciary standard to act in your best interests.
Here’s how it works:
1. Answer SmartAsset advisor match quiz
2. Review your pre-screened matches at your leisure. Check out the advisors’ profiles.
3. Speak with advisors at no cost to you. Have an introductory call on the phone or introduction in person and choose whom to work with in the future
Get started right here.
Thank you for reading! Have some feedback for us?
Contact the 24/7 Wall St. editorial team.
 24/7 Wall St.

